A new Abacus Data survey finds the country deeply divided on whether to eliminate Canada’s Temporary Foreign Worker Program (TFWP), with support strongest among younger Canadians, residents of the Prairies, and Conservative voters.
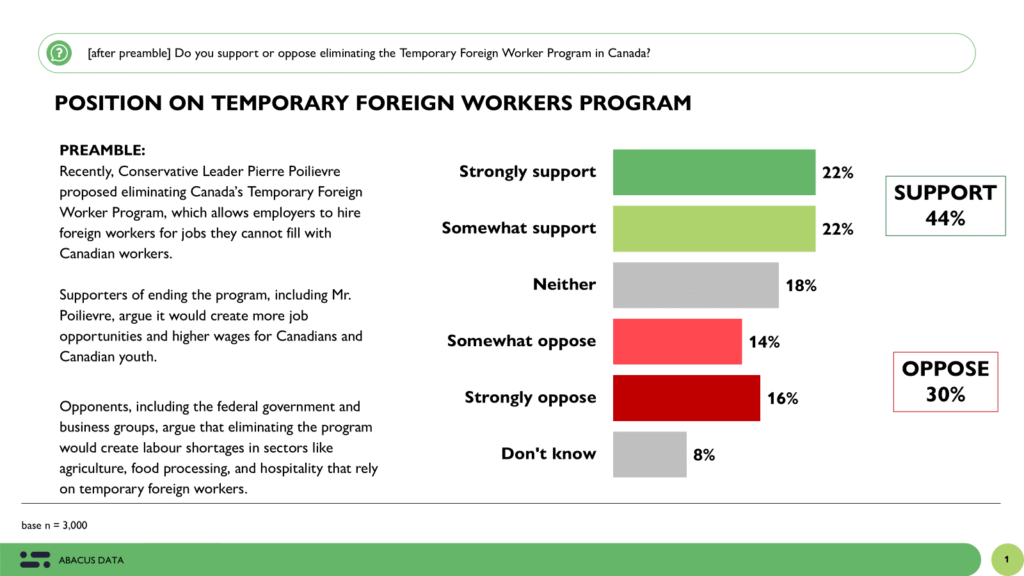
Following a recent proposal by Conservative Leader Pierre Poilievre to phase out the program, nearly half of Canadians say they support its elimination. While 44% support the move, 30% oppose it, and 18% are neutral or undecided.
But beneath the surface of the top-line numbers, a more fractured picture emerges. One that makes this a textbook wedge issue.
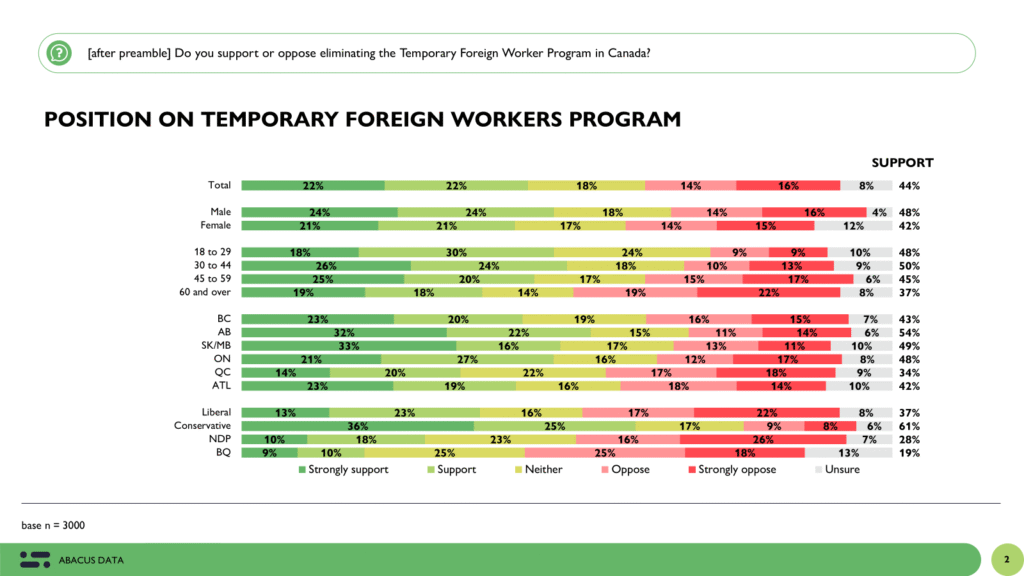
Generational divides are stark. Support for eliminating the TFWP peaks among Canadians aged 30 to 44 (50%) and 18 to 29 (48%), pointing to anxieties around wages, job opportunities, and affordability. By contrast, support dips among older Canadians. Just 37% of those aged 60 and over support the proposal indicating greater concern about workforce stability and economic disruption.
Regionally, the divide is just as pronounced. Support reaches a majority in Alberta (54%) and Saskatchewan/Manitoba (49%), while Ontario hovers close behind at 48%. In contrast, only 34% of Quebec residents support eliminating the program, making it the most resistant province.
Politically, the data reveals a clear fault line. 61% of Conservative voters support eliminating the TFWP, aligning closely with party leadership. Only 17% are oposed.
However, and why this may become an effective wedge for the Conservatives – views among past Liberal voters is almost evenly split. 37% support the idea while 39% oppose it creating a difficult position for the Carney government.
The Upshot
This could develop into one of the most divisive issues on the political landscape cutting cleanly across age, region, and political affiliation. Immigration has risen over the last three years to one of the top 5 issues in the country with close to 1 in 4 putting it in their top 3 national issues.
The proposal to end the Temporary Foreign Worker Program is more than a policy suggestion; it may be seen by many people as a litmus test for broader questions around economic fairness, national identity, and the future of Canada’s labour market.
Proponents of keeping the program in place have a clear challenge ahead: to make a compelling case that the benefits of temporary foreign workers outweigh the perceived risks. With a large segment of the public still neutral or unsure, the conversation is far from settled.
Methodology
The survey was conducted with 3,000 Canadians from September 4 to 7, 2025. A random sample of panelists were invited to complete the survey from a set of partner panels based on the Lucid exchange platform. These partners are typically double opt-in survey panels, blended to manage out potential skews in the data from a single source.
The margin of error for a comparable probability-based random sample of the same size is +/- 1.8%, 19 times out of 20.
The data were weighted according to census data to ensure that the sample matched Canada’s population according to age, gender, and region. Totals may not add up to 100 due to rounding.
We are Canada’s most sought-after, influential, and impactful polling and market research firm. We are hired by many of North America’s most respected and influential brands and organizations.
We use the latest technology, sound science, and deep experience to generate top-flight research-based advice to our clients. We offer global research capacity with a strong focus on customer service, attention to detail, and exceptional value.
And we are growing throughout all parts of Canada and the United States and have capacity for new clients who want high quality research insights with enlightened hospitality.
Our record speaks for itself: we were one of the most accurate pollsters conducting research during the 2025 Canadian election following up on our outstanding record in the 2021, 2019, 2015, and 2011 federal elections.
From August 28 to September 2, 2025, Abacus Data surveyed 1,500 Canadian adults on the state of federal politics. The poll was conducted over the Labour Day long weekend, following Pierre Poilievre’s byelection win in Calgary and just ahead of the federal cabinet’s late-summer retreat. The data capture a moment of political pause but economic unease, as fresh GDP figures showed that the Canadian economy contracted in the second quarter of 2025—marking the first quarterly decline in nearly two years.
Against this backdrop, the numbers reveal subtle but notable movement: approval of the federal government under Prime Minister Mark Carney continues its slow descent, Carney’s personal favourables have softened further, and concerns about the economy are climbing back toward the top of the political agenda. The Liberals have regained a narrow lead in vote intention, but it’s the directional signs that may be more telling than any single datapoint.
Direction of the Country: Static, But Not Optimistic
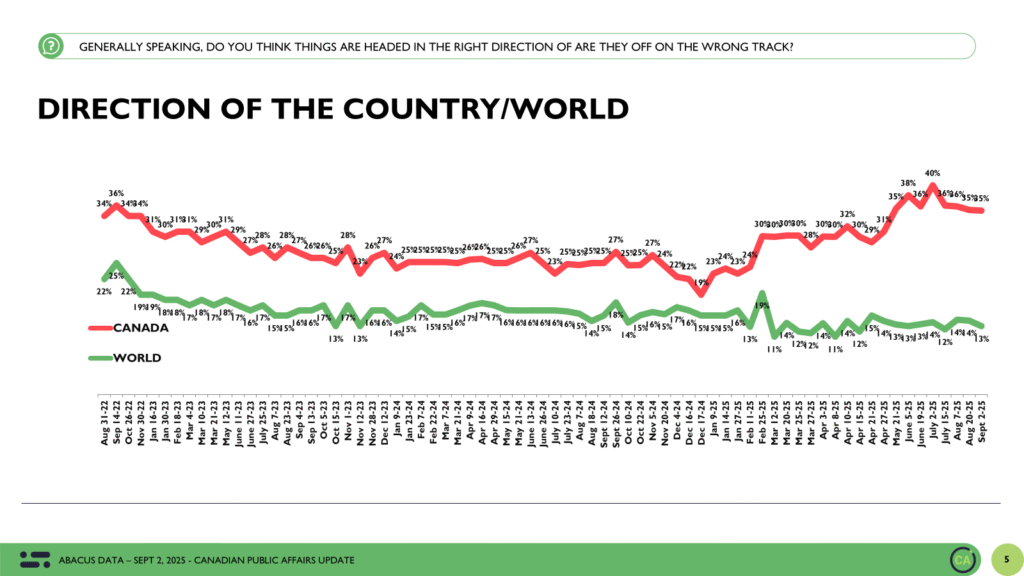
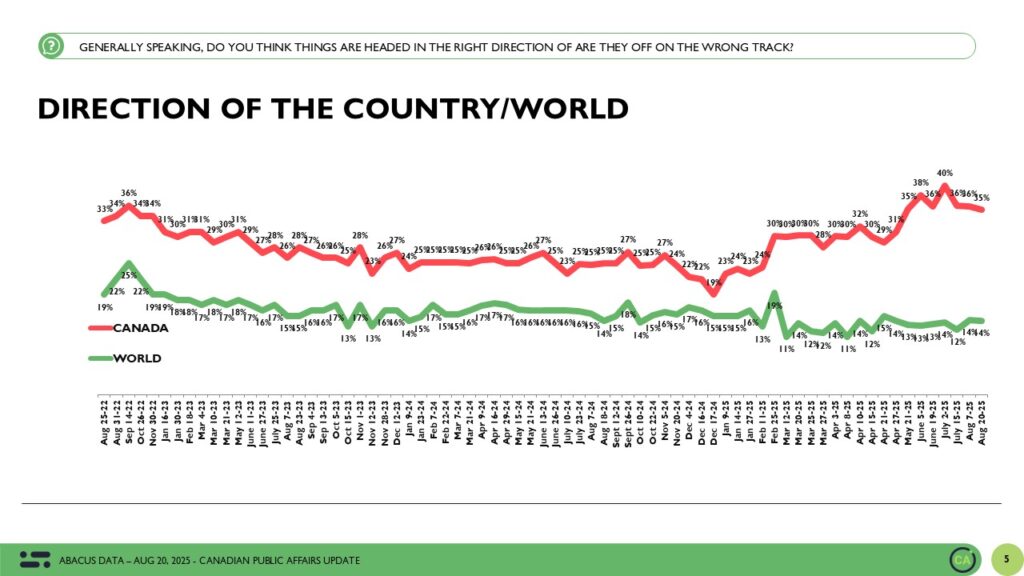
Views of the country’s direction remain essentially unchanged. Just over a third of Canadians (35%) believe things are moving in the right direction, while 48% say the country is on the wrong track. These numbers have held steady across the summer, suggesting a persistent undercurrent of concern, though not an active deterioration. Views of the world (13% right direction) and of the United States (14%) remain bleak, underscoring the sustained pessimism in broader international outlooks.
Top Issues: Affordability Tops the List as Economic Concern Grows
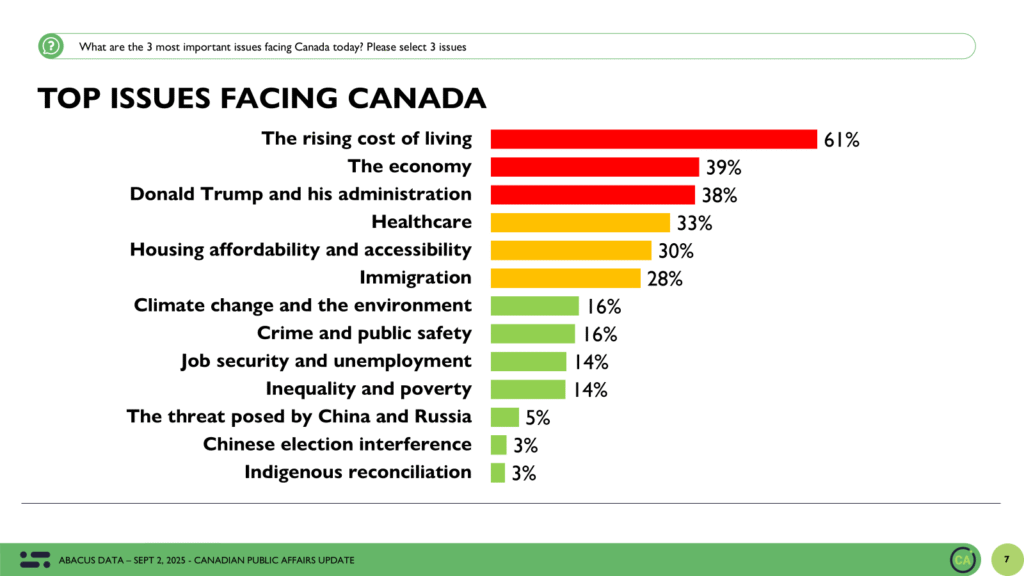
The rising cost of living remains the defining issue of the moment. Six in ten Canadians (61%) name it among their top three concerns, virtually unchanged from mid-August. But what’s shifting is the salience of the broader economy: 39% now cite it as a top concern by as many people as the Trump administration, up from 36% in the last wave. This increase is likely tied to renewed attention following the news that Canada’s economy contracted by 1.6% in Q2, a development that’s reignited public and political debate about whether the recovery is faltering.
Housing affordability (30%) and healthcare (33%) round out the top four, while concern about Donald Trump and his administration continues to fade. Just 37% of respondents now list Trump as a top issue, down one point from two weeks ago and well off the highs seen earlier in the year. Immigration, meanwhile, remains mid-pack at 28%, stable in both ranking and intensity.
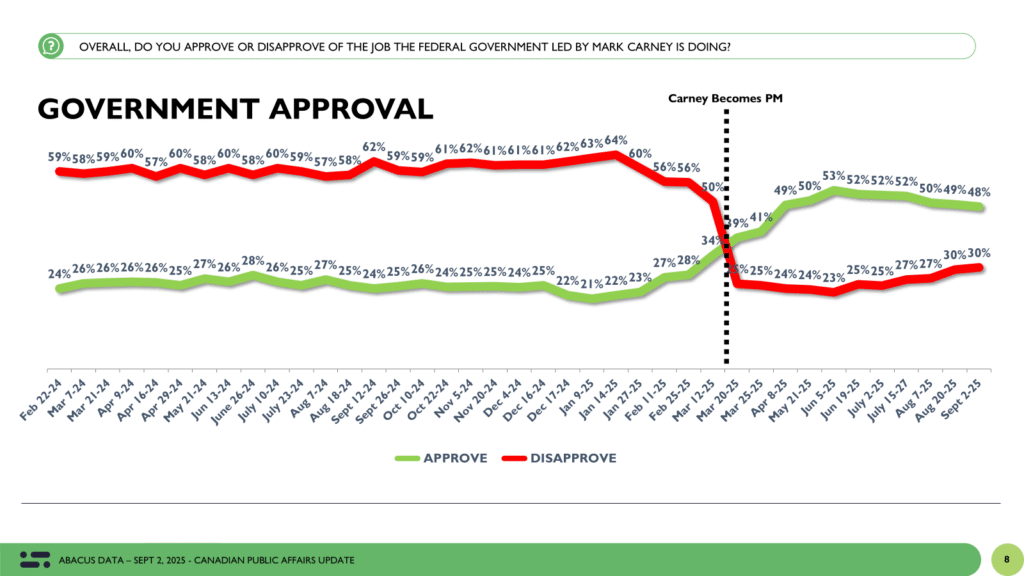
Government Approval: Gradual Erosion Continues
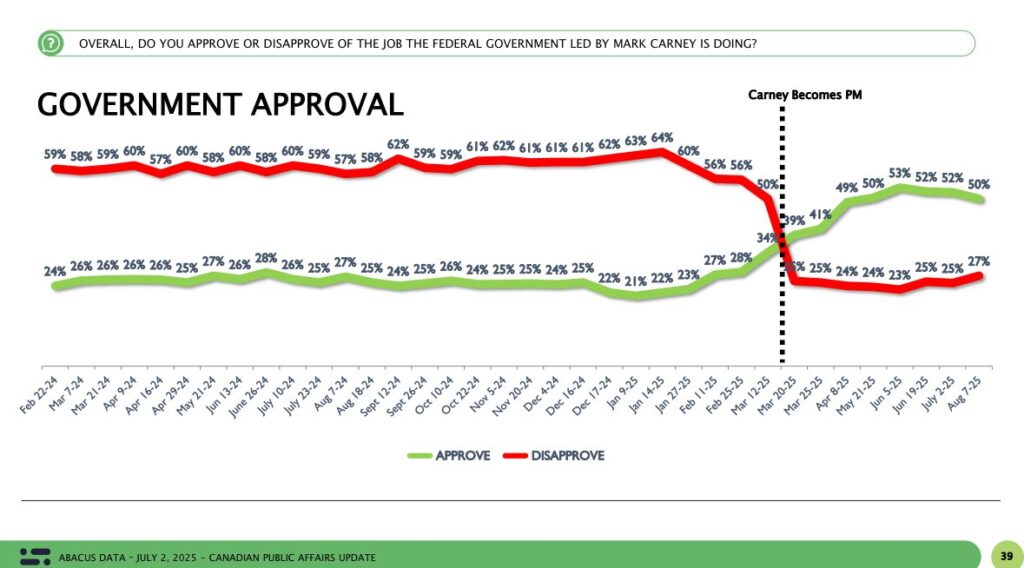
Approval of the federal government led by Mark Carney now sits at 48%, down a point from our previous wave. Disapproval has edged up to 30%. These figures are still relatively strong in historical context, but the trend is clear: the government’s approval rating has been slowly drifting downward since early summer, with no sign yet of a rebound.
The current slide may reflect growing economic anxiety and the sense among some Canadians that while the government is competent, it may not be moving fast enough to address affordability and economic concerns.
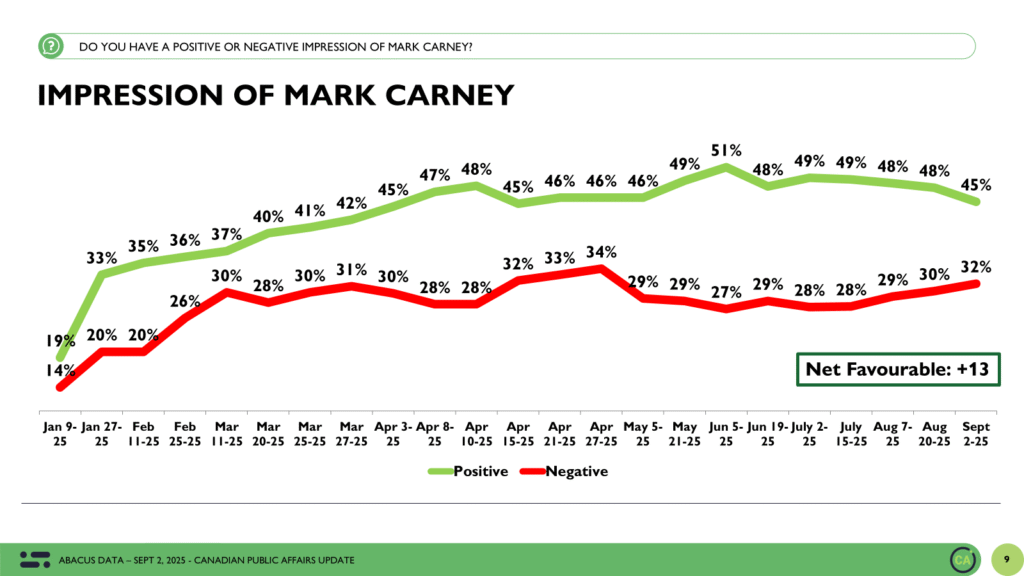
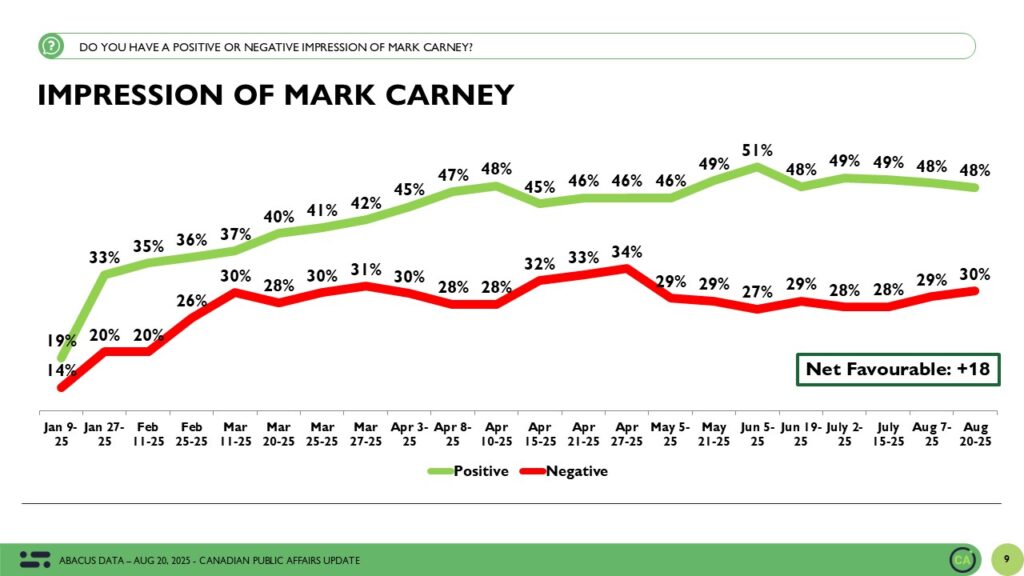
Mark Carney continues to maintain a net positive favourability rating, but the gap is narrowing. This wave, 48% of Canadians express a favourable view of the Prime Minister, down one point, while 35% view him unfavourably, up slightly. His net rating now stands at +13, down from +18 two weeks ago and +21 in mid-July. The erosion is subtle but sustained, and notably, his ratings have declined across most regions and demographic groups.
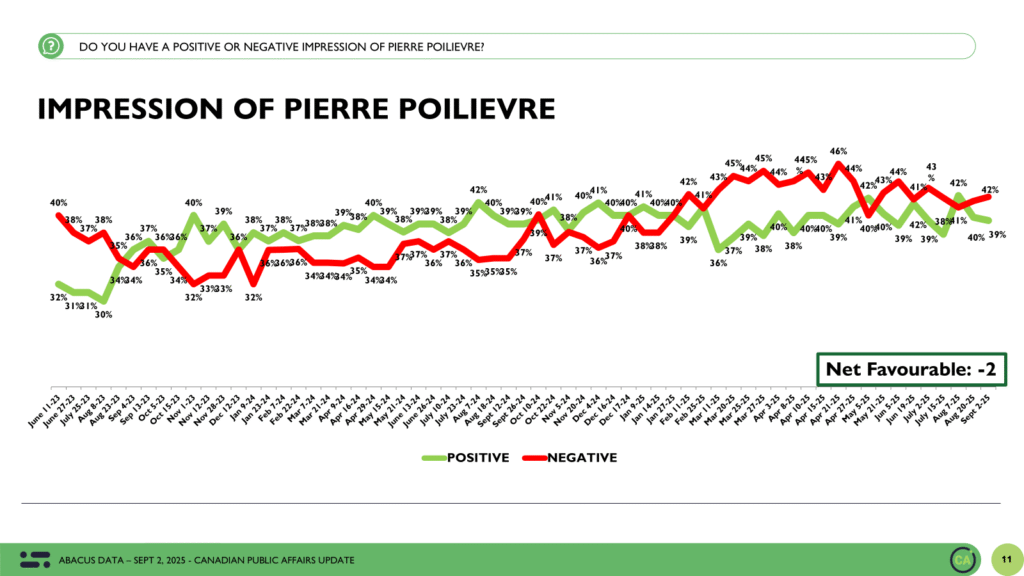
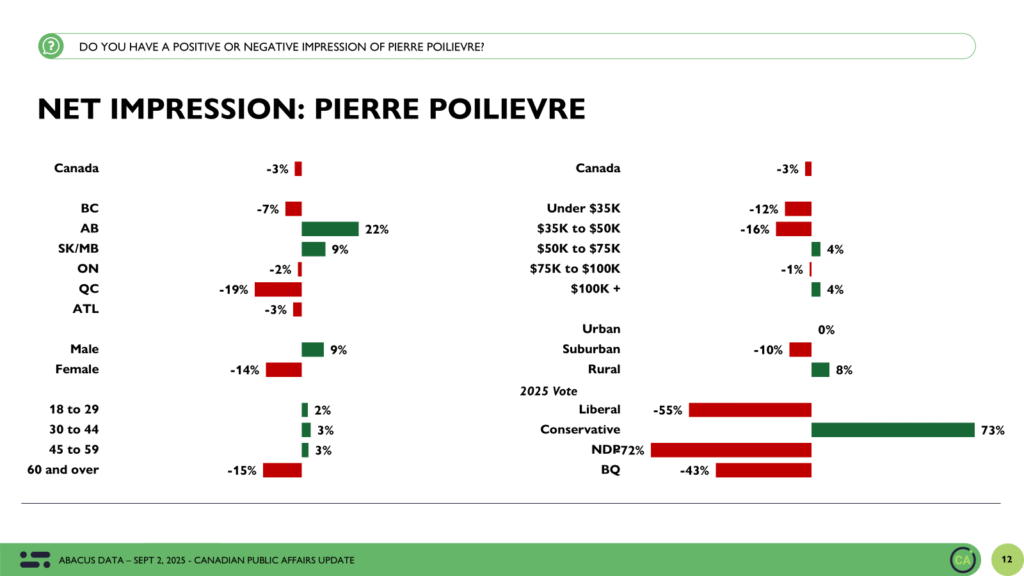
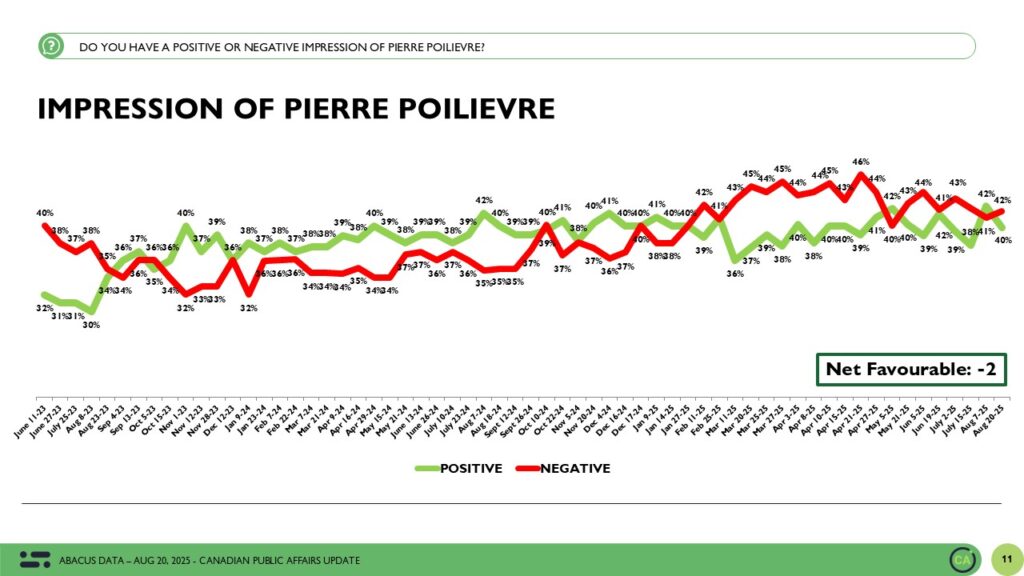
Pierre Poilievre’s numbers remain steady. He is viewed favourably by 39% and unfavourably by 42%, for a net rating of -3, down from the previous wave. His numbers continue to be stronger among younger men and in the Prairies, while trailing in Quebec and among older Canadians (60+).
Issue Ownership: Conservatives Lead on Economy and Cost of Living
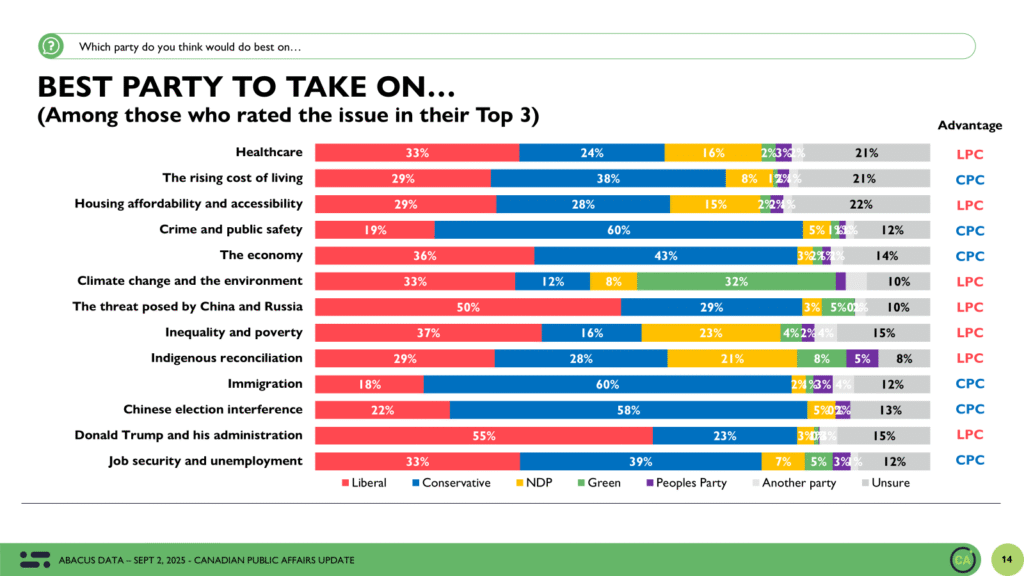
When Canadians are asked which party is best able to handle the issues they care most about, the Conservatives continue to lead on the economic front. On cost of living, they hold a 9-point advantage over the Liberals (38% to 29%), and a 7-point lead on managing the economy overall (43% to 36%), among the 39% of people who put that issue in their top 3.
They also dominate on immigration, where 60% believe the Conservatives are best equipped, compared to just 18% for the Liberals.
However, the Liberal Party continues to hold clear advantages on other issues: they are the preferred party on climate change (33% to the Conservatives’ 12%) and on handling the Trump administration and U.S.-Canada relations (55% vs. 23%) and on healthcare (33% to 24%).
Accessible Voter Pools: Flat and Competitive
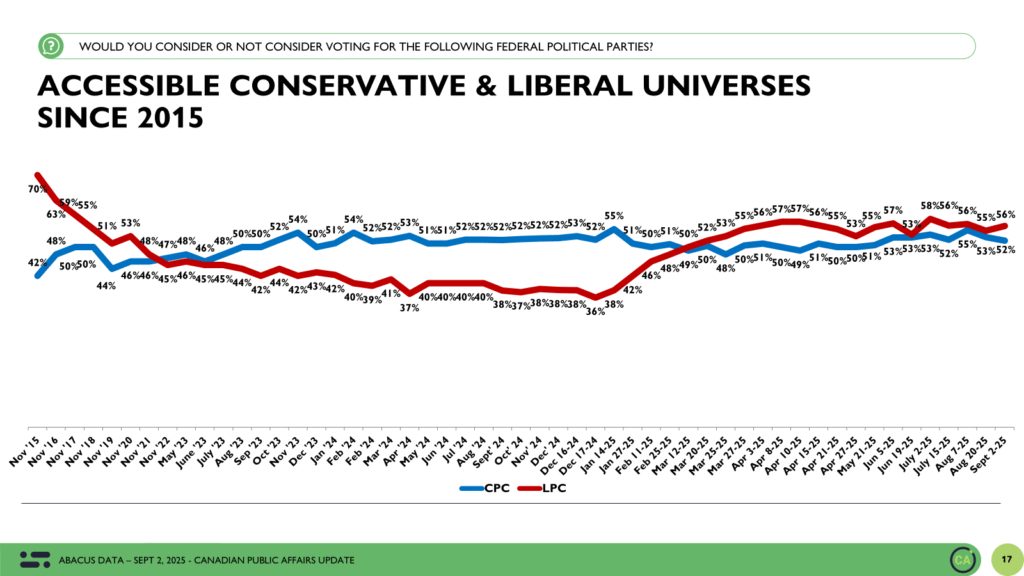
The Liberal Party remains accessible to 56% of Canadians, statistically unchanged from our last wave. The Conservatives follow closely at 52%. The NDP’s accessible pool sits at 34%, also unchanged. Regionally, the Liberals continue to lead in Ontario and Quebec, while the Conservatives are ahead in B.C..
Vote Intention: Liberals back in the lead
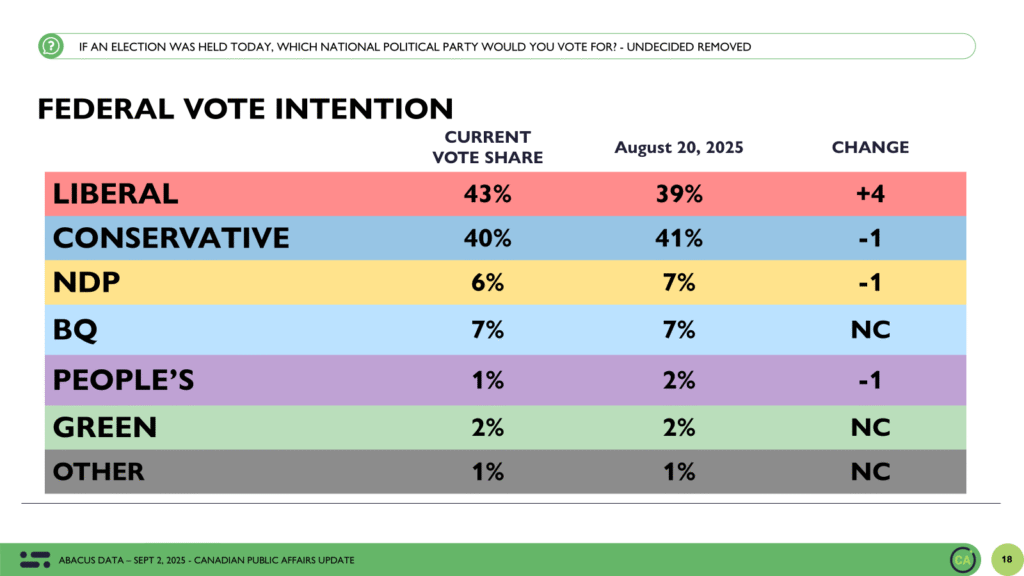
If an election were held today, 43% of decided voters would cast a ballot for the Liberal Party, up four points since mid-August. The Conservatives are at 40%, down one point. The NDP holds at 6%, Bloc Québécois at 7%, Greens at 2%, and the PPC at 1%.
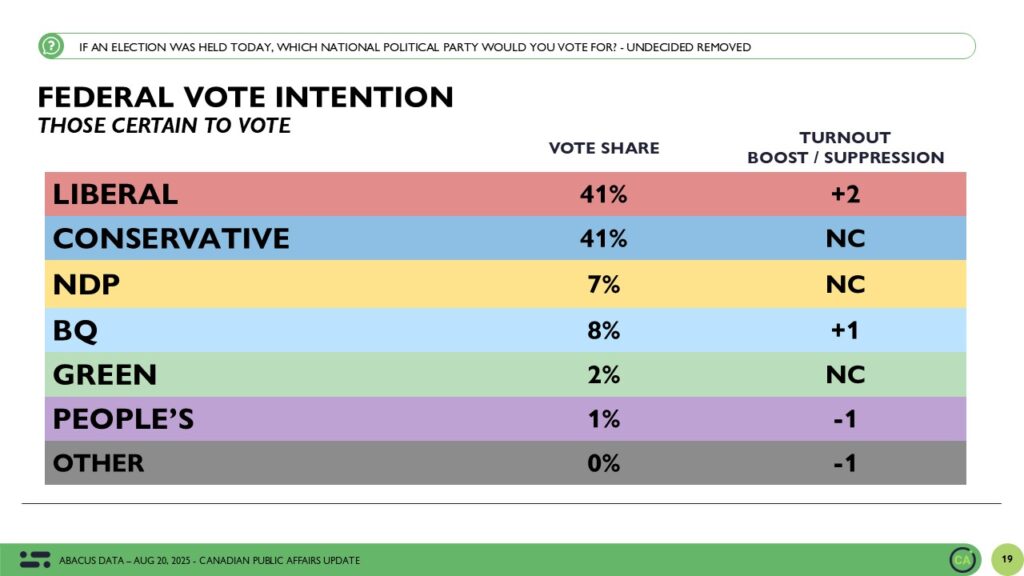
Among those certain to vote, the race is a dead heat: both Liberals and Conservatives are tied at 42%. This suggests the Liberals may benefit slightly from a turnout advantage—particularly among older voters, where their support remains stronger.
Demographic Trends: Stability in the Divides
The underlying demographic patterns remain familiar. The Liberals lead among women by seven points, while the Conservatives lead among men by a similar margin. Carney’s party maintains an 11-point advantage among university-educated voters, while the Conservatives lead among those with a college diploma or less education.
By age, the Liberals lead among voters under 45 and over 60, while the Conservatives hold a notable lead among those aged 45 to 59.
The Upshot
According to Abacus Data CEO David Coletto: “While the top-level vote numbers suggest relative stability, underneath we continue to observe slow but meaningful erosion in the Carney government’s standing. His personal favourables remain in net-positive territory, but they’ve been drifting downward for several weeks. More notably, government approval remains below 50%, and Canadians are increasingly anxious about the economic outlook.
The fact that the economy contracted in Q2—the first decline in nearly two years—is likely to reinforce that anxiety. That’s not an easy environment for an incumbent government. As concerns about affordability and economic management become more top-of-mind, feeling that the government is responsive to those concerns becomes more important.
The summer of political calm may be ending. With Parliament returning and the government facing rising pressure to respond to economic headwinds, we could see more significant movement in the months ahead.”
Methodology
The survey was conducted with 1,500 Canadians from August 28 to September 2, 2025. A random sample of panelists were invited to complete the survey from a set of partner panels based on the Lucid exchange platform. These partners are typically double opt-in survey panels, blended to manage out potential skews in the data from a single source.
The margin of error for a comparable probability-based random sample of the same size is +/- 2.5%, 19 times out of 20.
The data were weighted according to census data to ensure that the sample matched Canada’s population according to age, gender, and region. Totals may not add up to 100 due to rounding.
We are Canada’s most sought-after, influential, and impactful polling and market research firm. We are hired by many of North America’s most respected and influential brands and organizations.
We use the latest technology, sound science, and deep experience to generate top-flight research-based advice to our clients. We offer global research capacity with a strong focus on customer service, attention to detail, and exceptional value.
And we are growing throughout all parts of Canada and the United States and have capacity for new clients who want high quality research insights with enlightened hospitality.
Our record speaks for itself: we were one of the most accurate pollsters conducting research during the 2025 Canadian election following up on our outstanding record in the 2021, 2019, 2015, and 2011 federal elections.
As the Liberal cabinet meets this week and Parliament prepares to resume, new polling shows a growing divide between what Canadians want their leaders to prioritize and what they believe Ottawa is actually focused on. Between August 28 and September 2, 2025, Abacus Data conducted a national poll with 1,500 Canadians (aged 18+) to explore whether Canadians feel the federal government is directing its attention to the issues that matter most, both at home and abroad.
While Canadians recognize that managing Donald Trump’s policies is critically important – especially for trade, security, and the economy – many fear it may be taking too much attention away from urgent challenges at home, like housing affordability, healthcare, and rising costs.
A Perception Gap at the Heart of Politics
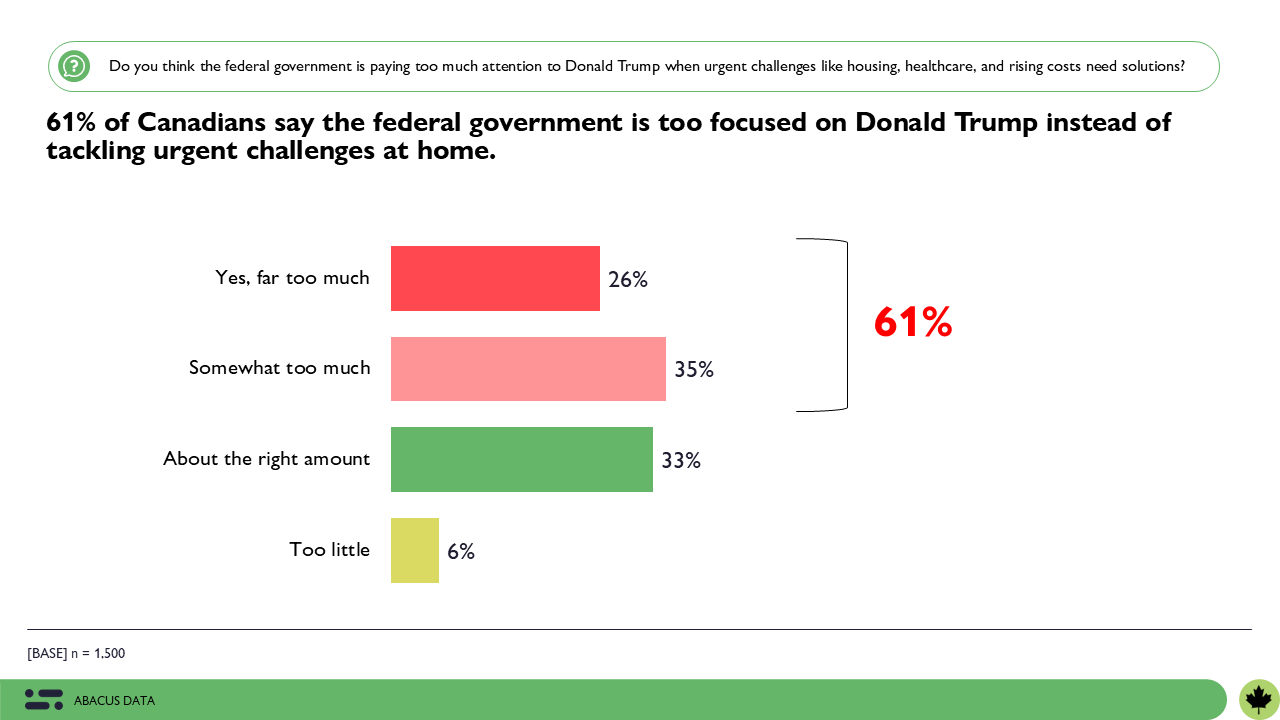
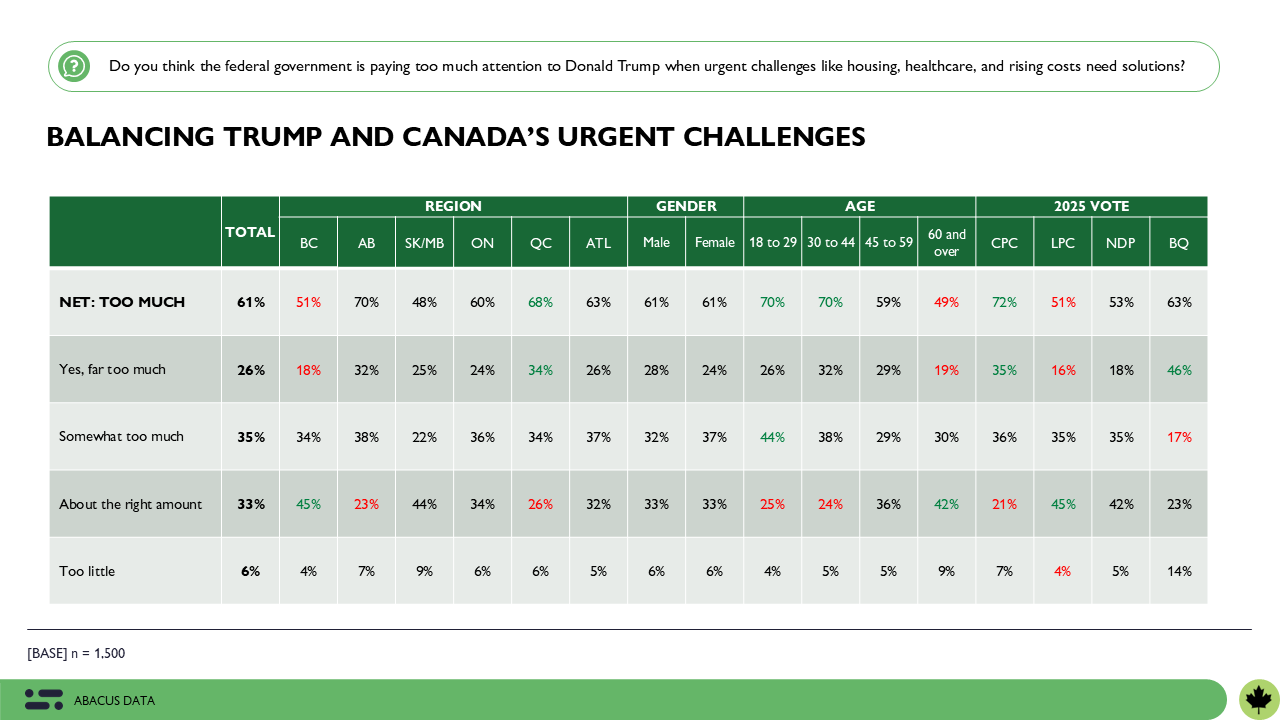
Six in ten Canadians (61%) believe the federal government is paying too much attention on Donald Trump when urgent domestic challenges – like housing, healthcare, and rising costs – need solutions, while just one in three (33%) think Ottawa is focusing the right amount of attention to Trump.
It’s worth noting that while dealing with the Trump administration and securing a trade deal is critical to many of those same domestic issues, there is a gap in people’s views.
This concern cuts across demographics. Younger Canadians are especially critical, with 70% of those aged 18–44 saying the government is too focused on Donald Trump. Even among Liberal voters, more than half (51%) believe their government is distracted by Trump when pressing domestic problems remain unresolved (compared to 45% who believe it is the right amount of attention).
As Parliament gets set to resume, this perception gap will shape how Canadians judge the government’s performance, and whether they believe Ottawa can balance international challenges with urgent priorities at home. It’s also an important signal for government to really think about how it frames the work its doing and whether or not its reaching all audiences with its communications.
Next 2 Years: Domestic Issues Seen as the Greater Threat
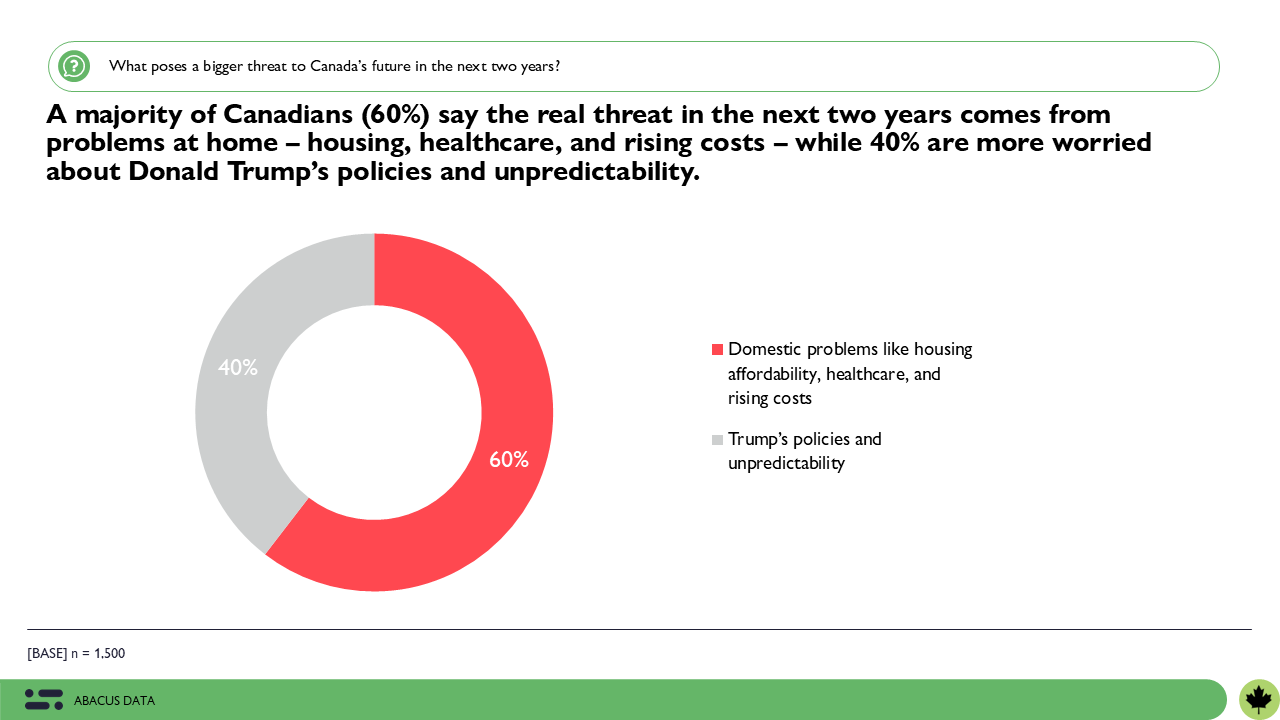
When looking ahead to the next two years, most Canadians see domestic challenges as the bigger threat:
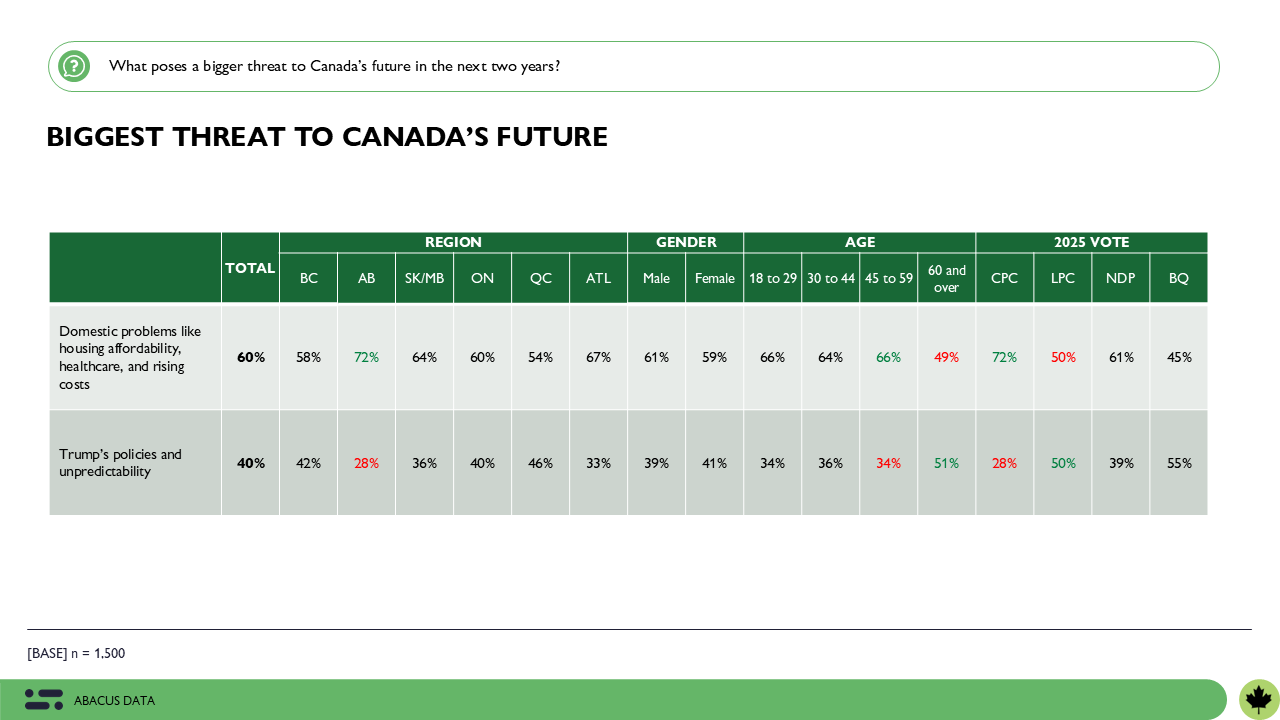
60% say issues like housing affordability, healthcare, and rising costs pose the greatest risk to the country.
40% believe Trump’s policies and unpredictability are the larger danger.
Younger Canadians are especially concerned about domestic challenges, while older Canadians are more evenly split. Politically, Conservative voters are far more likely to see domestic crises as the bigger danger, while Liberal voters are evenly divided.
This indicates that while Canadians understand the significance of Trump’s influence, their priority remains solving urgent problems at home. To build their trust, the federal government must clearly demonstrate how tackling global challenges will lead to meaningful, tangible improvements in Canadians’ everyday lives, showing how actions on the world stage directly translate into progress on housing, healthcare, and affordability.
Families Are Feeling the Strain
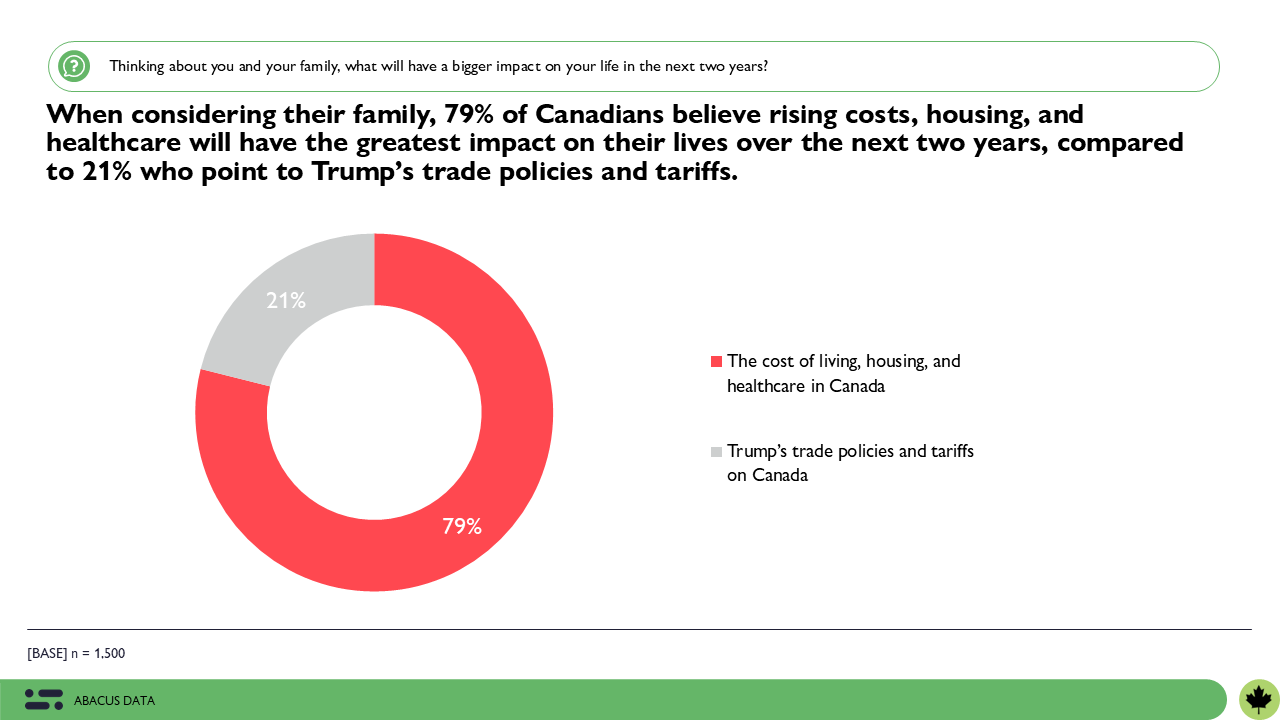
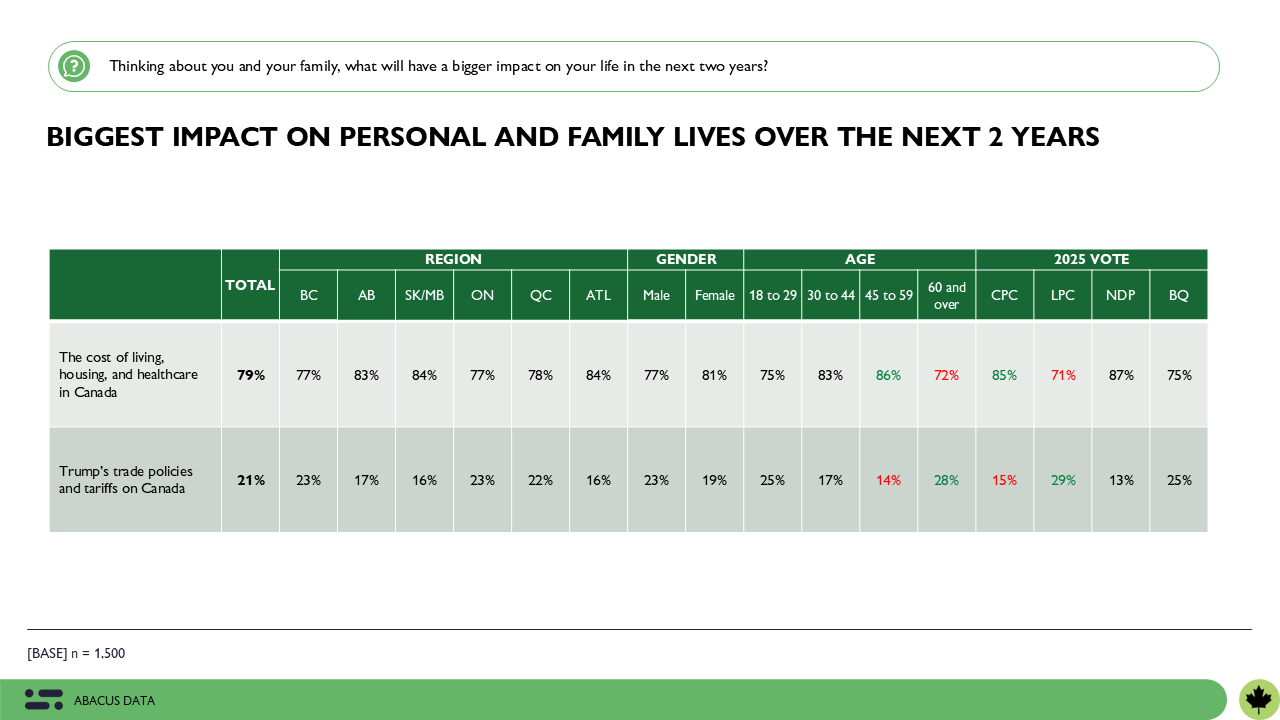
This sentiment becomes even sharper at the personal level. Nearly eight in ten Canadians (79%) say rising costs, housing, and healthcare will have a greater impact on their families over the next two years than U.S. tariffs or trade policies (21%).
Again, this suggests that people may not understand the relationship between Trump’s trade policies and domestic micro-economic and social issues. The federal government may need to spend more time connecting the dots for Canadians, explaining why getting a deal and why it’s focusing so much on getting that deal, is important to everything else.
This perspective cuts across all regions, age groups, and political leanings, with the strongest concern among middle-aged Canadians juggling mortgages, childcare, and aging parents (83% of 30-44 and 86% of 45-59). Even among Liberal voters, 71% admit their day-to-day struggles are shaped far more by domestic affordability challenges than by Trump’s actions abroad.
What Canadians Want Leaders to Prioritize
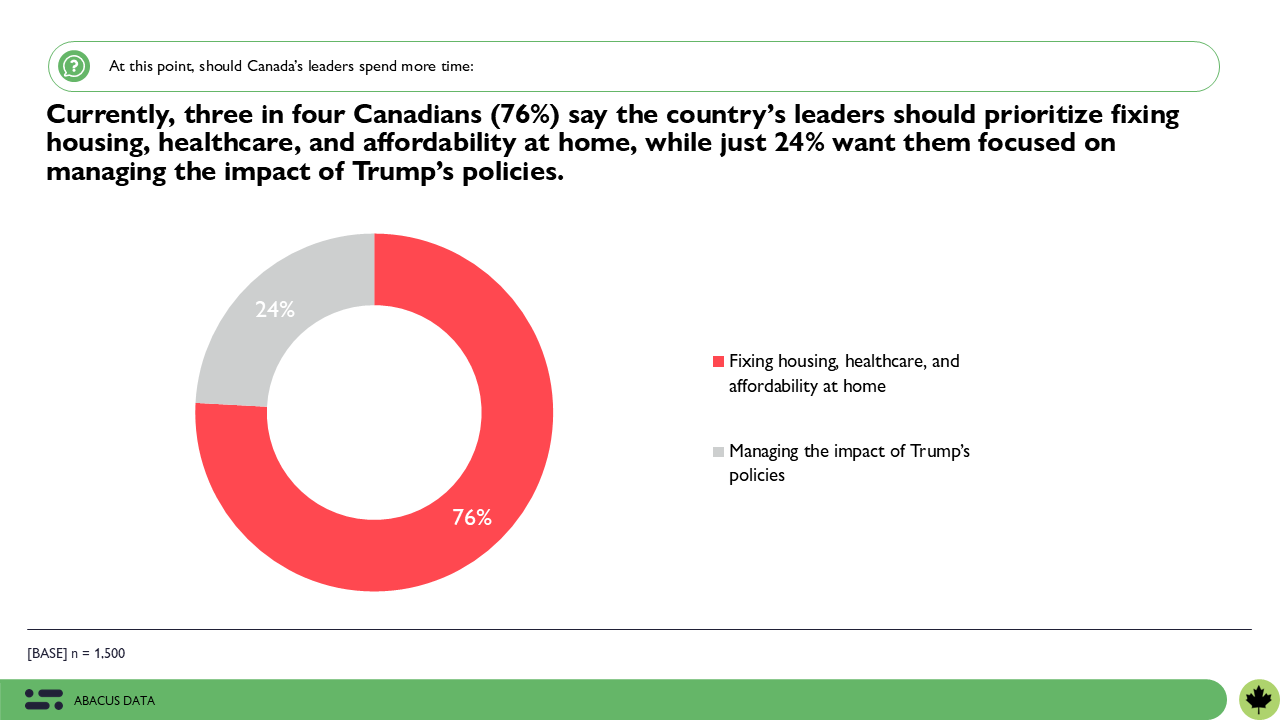
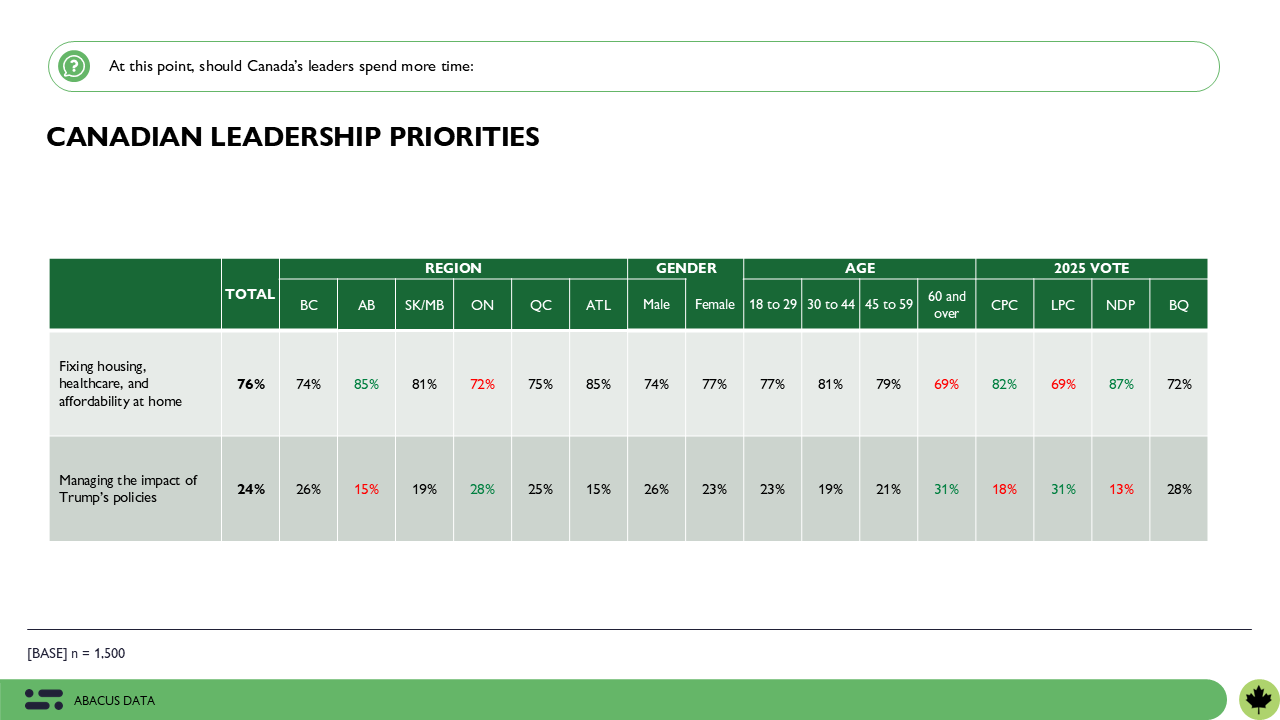
Three in four Canadians (76%) believe federal leaders should spend more time fixing problems at home – housing, healthcare, and affordability – while just 24% want them focused on managing Trump’s policies.
This consensus spans party lines: 82% of Conservative voters and 69% of Liberal supporters agree that domestic issues must come first.
The takeaway for Ottawa is clear: Canadians expect their leaders to keep their eyes firmly on challenges at home, even while managing the complexities of the U.S. relationship.
Canadians Divided on Trump and Trade
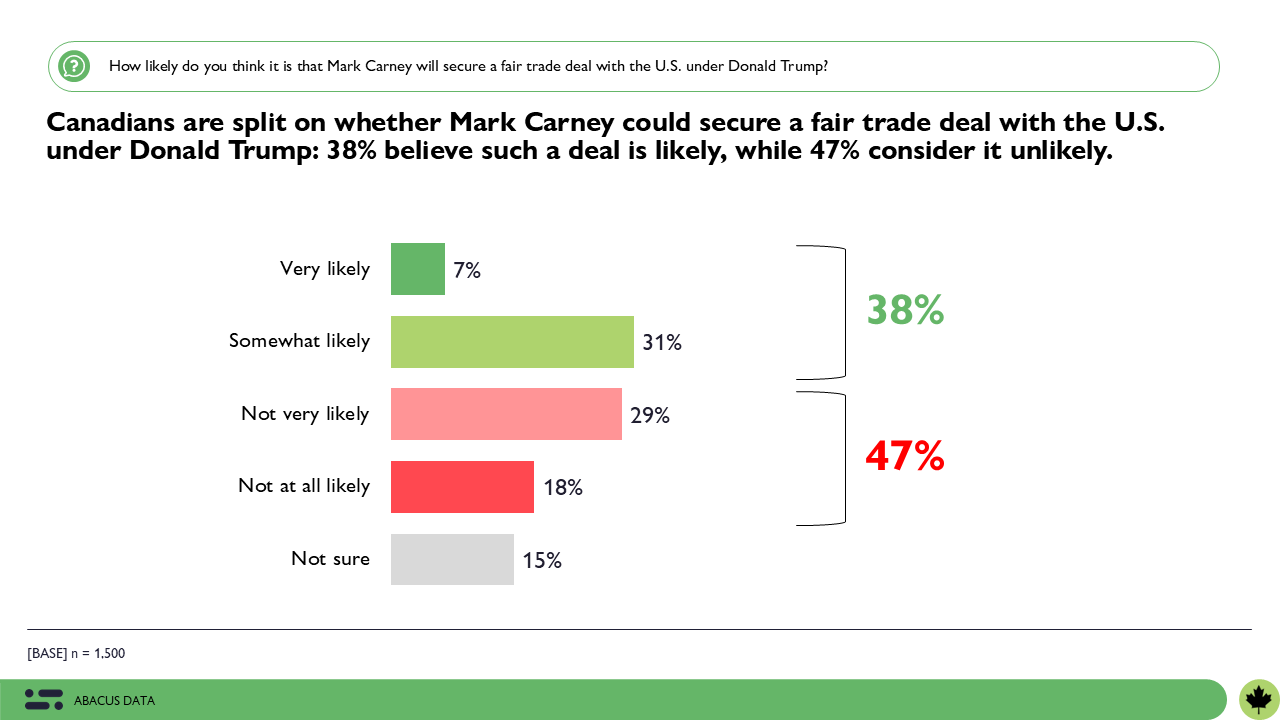
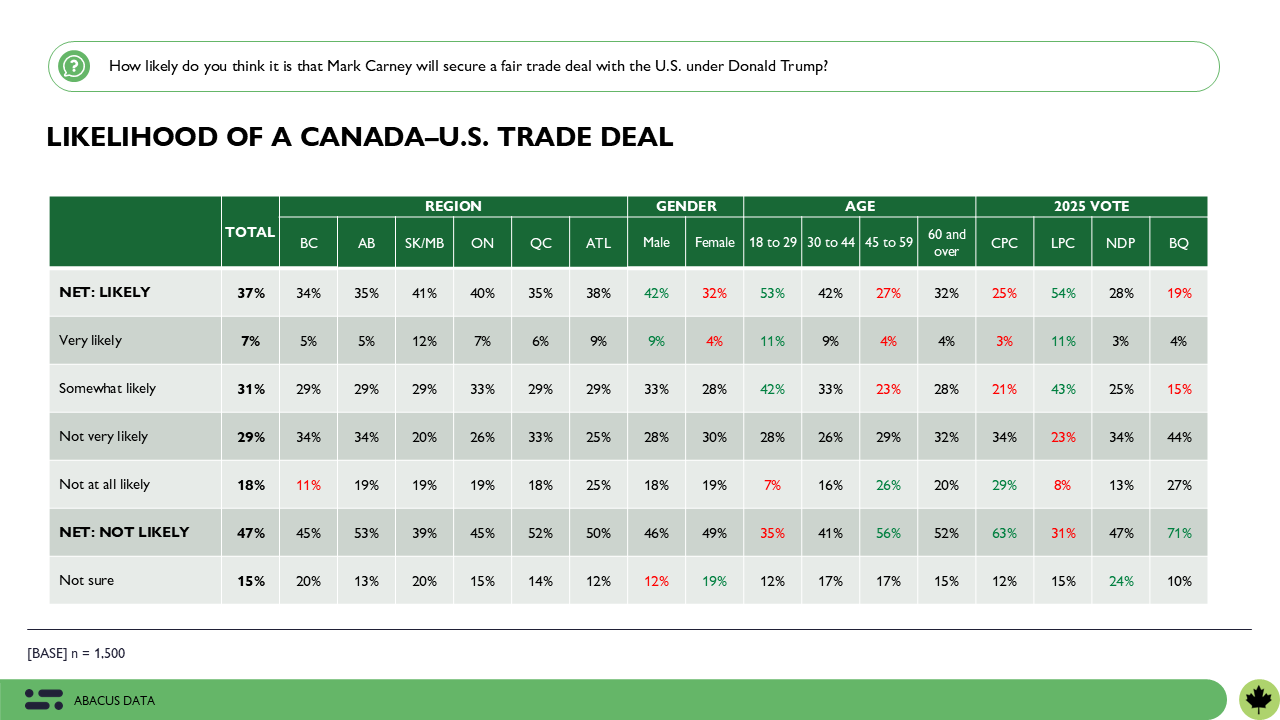
While Canadians want their leaders to focus on domestic issues, they also recognize that Trump matters. But they are divided on whether Prime Minister Mark Carney can successfully navigate a trade deal – 38% believe Carney is likely to secure a fair trade deal with the U.S. under Trump while 47% believe it is unlikely. Younger Canadians and Liberal voters tend to be more optimistic, while older Canadians and Conservatives are far more skeptical.
This split highlights two things. One, that many Canadians don’t think a secure and fair trade deal with the U.S. is likely to happen – either because they don’t think Trump will ever agree to one or because they don’t think the Carney government can achieve it. Second, it also suggests that only a small minority of Canadians expect one to be reached, providing evidence that the Carney government may not be blamed if a good deal is not achieved.
Exhaustion with Trump Coverage
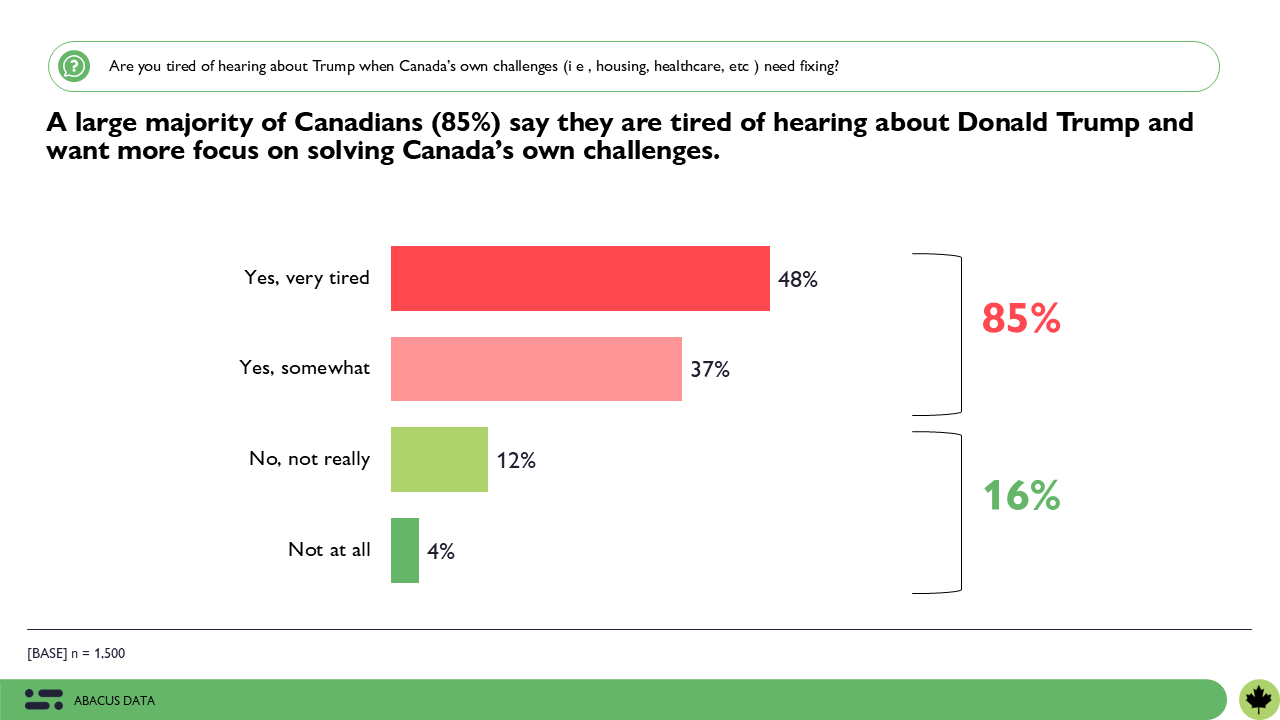
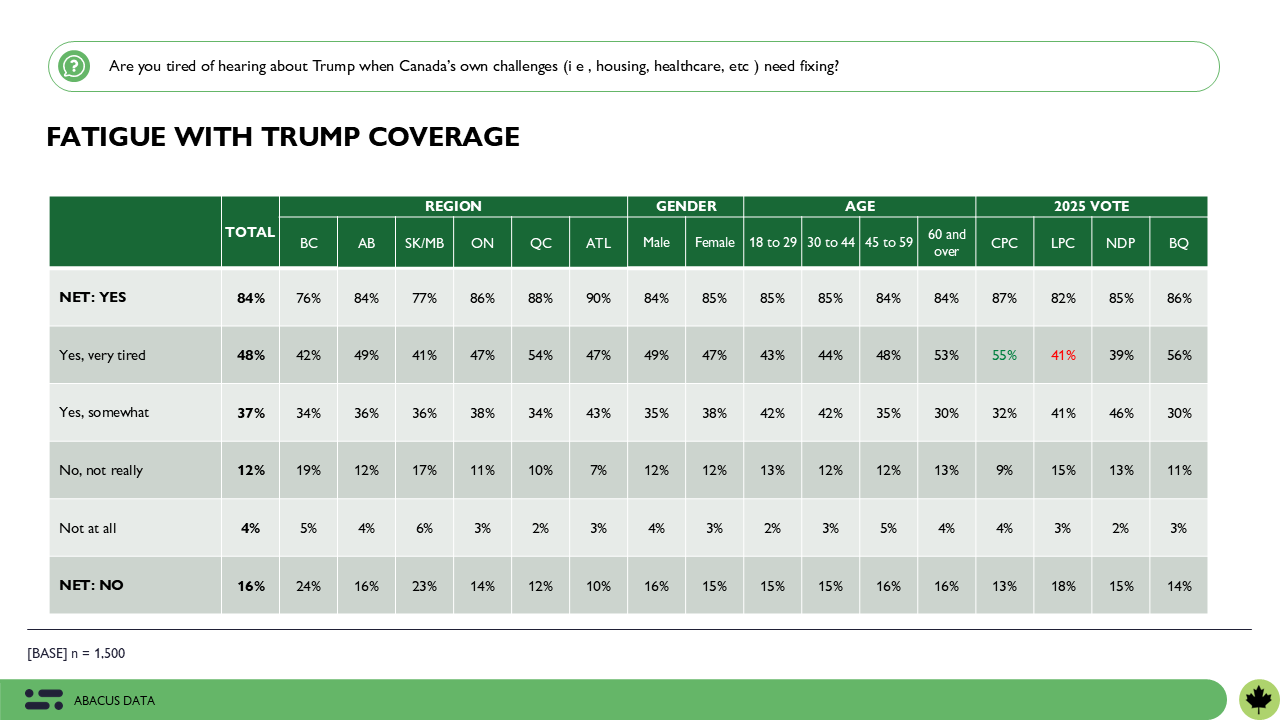
Perhaps the strongest signal in the data is emotional: 85% of Canadians say they are tired of hearing about Donald Trump.
This fatigue is shared across the political spectrum – 87% of Conservative voters and 82% of Liberal voters feel the same way.
Canadians understand that managing Trump and his policies is important, but they don’t want it dominating headlines or overshadowing the urgent problems they face at home – like housing, healthcare, and rising costs – that demand immediate attention.
The Upshot
Managing Trump’s unpredictability is undeniably important for Canada’s future and a key concern for governments at every level. Getting it right creates an opportunity to build trust and momentum, showing Canadians that skillful management of global challenges can lead to stability, growth, and meaningful improvements in their daily lives. Getting it wrong, however, could derail progress on every other priority, undermining public confidence and leaving Canadians feeling unprotected both at home and abroad.
This is where the perception gap emerges. While Ottawa may view global negotiations and U.S. relations as essential to Canada’s long-term stability, most Canadians are focused on the here and now – housing they can afford, healthcare they can access, and rising costs they can manage. For many, these urgent domestic crises feel disconnected from the government’s trade agenda, fueling a sense that their immediate struggles are being overshadowed by debates and decisions that seem distant from their daily lives.
To close this gap, Ottawa must help Canadians see the connections between the macro and the micro. Decisions about trade, cross-border tensions, and economic stability need to be clearly linked to tangible, local benefits. Canadians need to understand how actions taken on the global stage lead to shorter ER waits, more affordable groceries, and greater housing stability. Voters are open to growth and stability narratives – but only if they feel real, relevant, and fair.
As Parliament resumes, the challenge for the Liberals isn’t just navigating Trump; it’s convincing Canadians that their government understands what matters most to them and can deliver on it. This means demonstrating that every move – whether a trade negotiation or a response to Trump’s policies – has a direct and visible payoff for Canadians at home.
For the Conservatives, the opportunity lies in positioning themselves as the party laser-focused on the everyday struggles Canadians face. By framing the Liberals as distracted by international affairs and disconnected from real-world challenges, they can make the case that they are the party best equipped to restore balance and put domestic priorities first.
In the months ahead, the battle won’t just be about Trump or trade deals. It will be about whether Canadians believe their government understands what they need and is focused on delivering it. The party that closes this perception gap will not only win the political debate but will define the direction of the country heading into the next election.
Methodology
The survey was conducted with 1,500 Canadian adults from August 28 to September 2, 2025. A random sample of panelists were invited to complete the survey from a set of partner panels based on the Lucid exchange platform. These partners are typically double opt-in survey panels, blended to manage out potential skews in the data from a single source.
The margin of error for a comparable probability-based random sample of the same size is +/- 2.53%, 19 times out of 20.
The data were weighted according to census data to ensure that the sample matched Canada’s population according to age, gender, educational attainment, and region.
We are Canada’s most sought-after and influential full-service market and public opinion research agency.
But what we really do is identify the unmet needs of your audience and develop strategies for you to meet those unmet needs first.
Through qualitative and quantitative research methods, our deep experience and and wide perspective, we ask the right questions that capture insights, show you where things are going to be, and help our clients navigate some of their biggest challenges, deepen relationships with customers and stakeholders, and better understand the road ahead.
The signal was clear: Canadians should judge this government not on its talking points or press releases, but on its ability to make meaningful progress on these seven interrelated goals.
In this environment, measuring perception matters more than ever. Clear priorities create clarity for citizens but also accountability. If the public understands what the government says it’s doing, they’re better equipped to notice when it falls short or reward it when it succeeds.
Back in June, we asked a core set of questions that we will track every few months. Here we report on the latest results completed in mid-August.
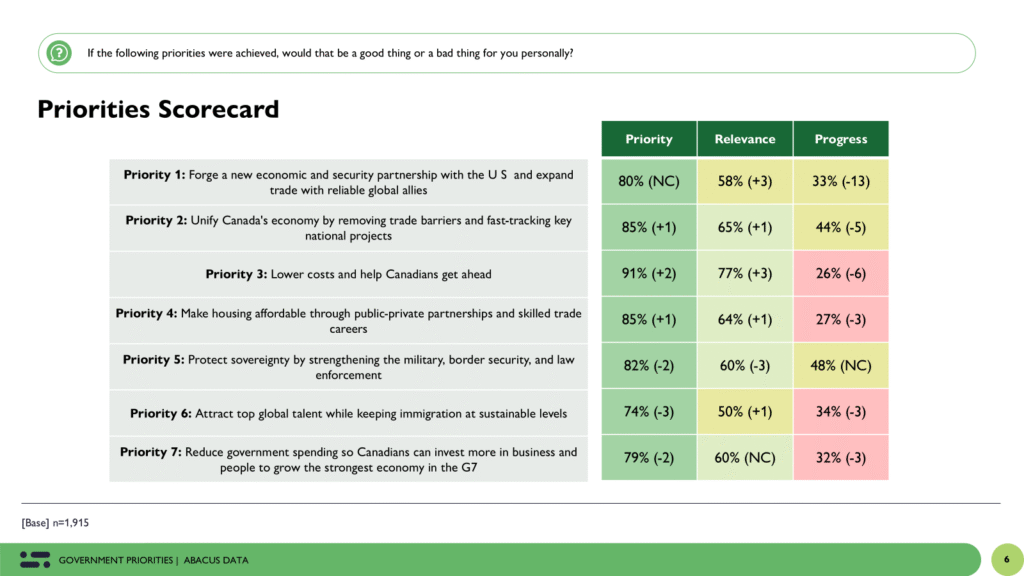
A Clear List Still Resonates
From the beginning, Carney’s approach has been different. By narrowing the government’s agenda to seven focused priorities spanning affordability, housing, economic unification, sovereignty, partnerships, spending, and immigration, he invited Canadians to judge his leadership against a concise list.
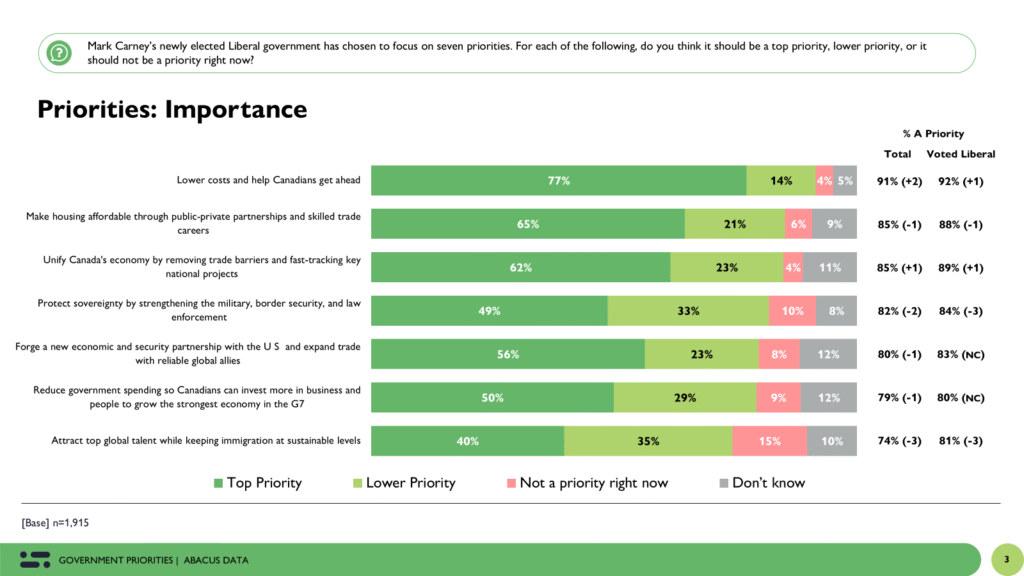
The good news? That clarity continues to pay off. All seven priorities are still supported by a majority of Canadians, and most continue to rank high in importance.
91% say lowering costs and helping Canadians get ahead should be a top or lower priority (up 2 points).
85% support making housing more affordable (up 1).
85% also back efforts to unify Canada’s economy by removing trade barriers and fast-tracking major projects (also up 1).
Even the more complex items — like trade partnerships and fiscal restraint — continue to hold support from roughly 80% of the population. The only exception is immigration, though 74% still believe it should be on the government’s radar.
This suggests the Carney government hasn’t lost alignment. But as we’ve seen before, alignment isn’t the problem. Expectation management might be.
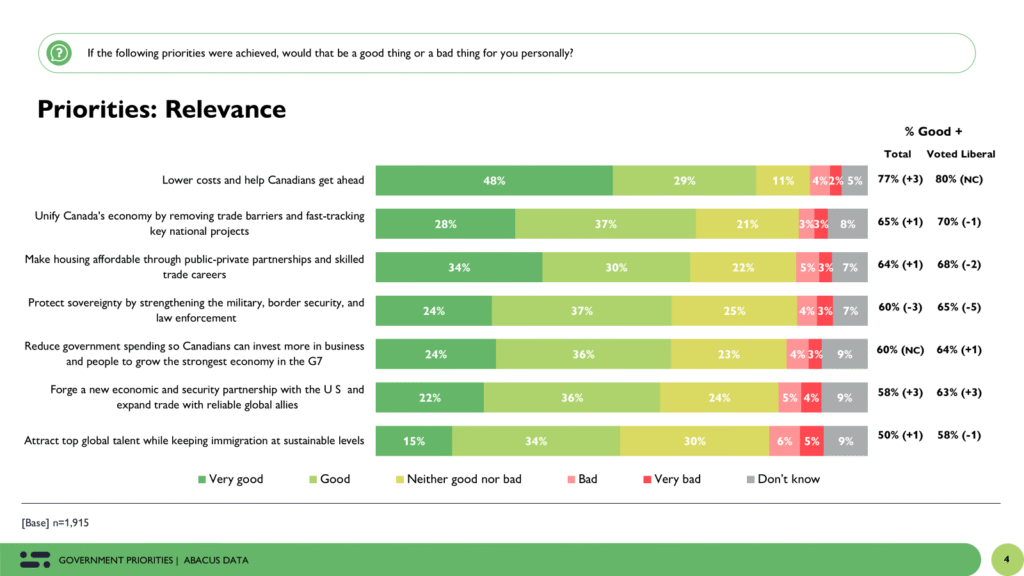
Relevance to Everyday Life
When asked if achieving these priorities would be good for them personally, the pattern held from last wave but with more nuance.
The public still overwhelmingly believes that lowering costs would benefit them directly (77%, up 3), and housing affordability, economic unification, and sovereignty each score above 60%. But once again, macro-level goals like trade partnerships and immigration trail, with 58% and 50% respectively seeing them as good for their lives.
This gap between macro-importance and personal relevance remains one of the central communications challenges facing the government. Canadians understand why these issues matter. They just don’t always feel them.
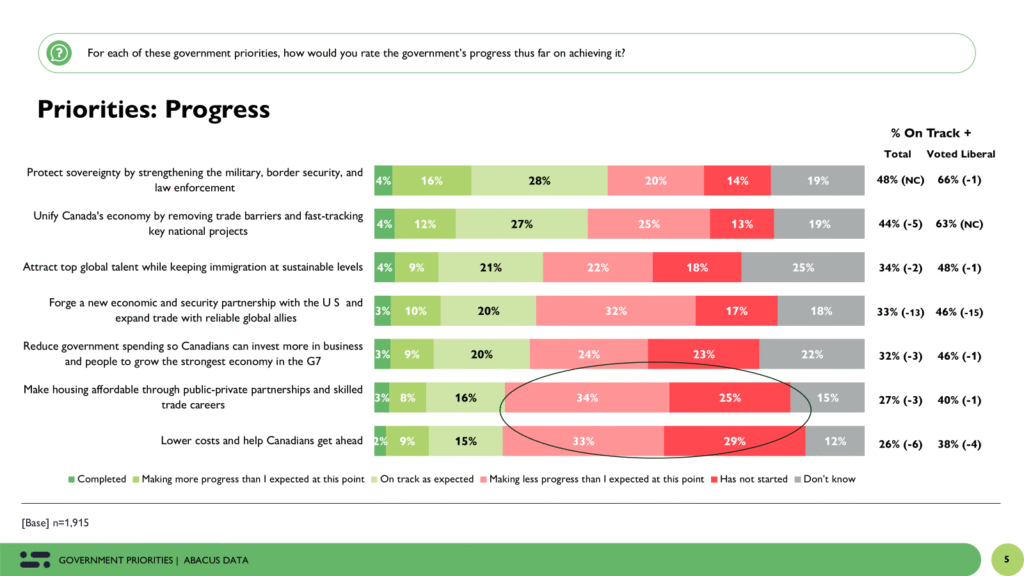
Where Progress Is Felt and Where It Isn’t
Which brings us to the real test: how much progress do people think is actually being made?
Here, the story gets more complicated.
We combined “on track” and “ahead of schedule” responses to create a momentum score. The results are telling:
48% believe the government is on track or better when it comes to protecting Canada’s sovereignty, the highest of any priority and unchanged from June.
44% say the same about economic unification (down 5 points).
But only 26% believe the government is on track with affordability efforts (down 6).
And just 27% feel progress is being made on housing (down 3).
The biggest drop in progress is on the economic and security relationship with the U.S. Only 1 in 3 think things on on track, down 13 from June.
This decline is especially concerning because affordability and housing remain the top two priorities for Canadians, and also the ones they feel matter most in their daily lives.
Among Liberal voters, the numbers are slightly better, but not by much. Only 38% of Liberals say the government is making progress on affordability. That’s lower than for trade, sovereignty, or even immigration.
What It Means for the Carney Government
These numbers offer a clear message heading into the Cabinet retreat: the government’s agenda is still supported. But the clock is ticking on visible delivery.
Perceptions of progress have declined across almost every priority, with the steepest drop, 13 points on the international trade and security partnership file as uncertainty around tariffs and CUSMA continue to make Canadians feel insecure. While that drop may reflect the high expectations created by recent diplomatic events, it also points to a need for clearer messaging around what has been accomplished.
The public isn’t giving up on Carney’s priorities. But they are watching closely. And they’re increasingly impatient on the kitchen-table issues that brought this government to power.
As the Cabinet plans its next moves, momentum needs to become the message, not just through words, but through action that people can see, feel, and experience.
Final Thoughts: Don’t Mistake Patience for Indifference
Clarity creates accountability. And the Carney government is being held to the standard it set for itself: seven clear goals, one unified direction.
So far, Canadians still agree with the list. They still believe it would make their lives better. But as progress ratings decline, especially on the issues they care most about, the risk grows that this alignment turns into frustration.
The fall will be a critical moment. The right decisions and the right signals could still shift the storyline. But only if Canadians start to feel that what matters to them is finally starting to move.
Subscribe or Request the Full Report
This baseline assessment is part of our new Government Priorities Tracker. Organizations can subscribe to receive quarterly updates, crosstabs, and tailored briefings on how public opinion is evolving. Sign up here to learn more.
About Abacus Data
We are Canada’s most sought-after and influential full-service market and public opinion research agency.
But what we really do is identify the unmet needs of your audience and develop strategies for you to meet those unmet needs first.
Through qualitative and quantitative research methods, our deep experience and and wide perspective, we ask the right questions that capture insights, show you where things are going to be, and help our clients navigate some of their biggest challenges, deepen relationships with customers and stakeholders, and better understand the road ahead.
About David Coletto
David is one of Canada’s best known and most respected public opinion analysts, pollsters, and social researchers. He works with some of North America and Europe’s biggest and most respected brands, associations, and unions andis frequently called upon by news organizations, to assess public opinion as events happen.
In January 2024, The Hill Times recognized him as one of the Top 100 Most Influential People in Canadian Politics noting, “when David Coletto releases polling numbers, Ottawa listens.”
Contact us with any questions
Find out more about how we can help your organization by downloading our corporate profile and service offering.
Survey Methodology
The survey was conducted with 1,915 Canadians from August 15 to 19, 2025. A random sample of panelists were invited to complete the survey from a set of partner panels based on the Lucid exchange platform. These partners are typically double opt-in survey panels, blended to manage out potential skews in the data from a single source.
The margin of error for a comparable probability-based random sample of the same size is +/- 2.2%, 19 times out of 20.
The data were weighted according to census data to ensure that the sample matched Canada’s population according to age, gender, and region. Totals may not add up to 100 due to rounding.
At Abacus Data, we’ve been tracking how Canadians think and feel about artificial intelligence (here and here). What we’ve found is a mix of curiosity and unease. People are experimenting with ChatGPT, reading about breakthroughs, and watching how the technology is being used in workplaces and classrooms. Yet behind that experimentation is a thread of anxiety, especially when it comes to jobs.
In one of our recent surveys, about half of working Canadians told us they worry that AI could force them to change jobs or even careers in the near future. Seven in ten believe AI will make some roles in their industry obsolete. Among younger Canadians, those under 30, the anxiety is especially acute: more than half expect AI to destroy more jobs than it creates.
For leaders, this presents both a challenge and an opportunity. How you talk to your employees about AI will shape whether they see it as a tool to enhance their work, or as a looming threat to their livelihoods.
Psychological research tells us that when people face uncertainty, they crave reassurance, transparency, and a sense of control. Here are five evidence-based tips for framing AI in your workplace conversations.
1. Lead with Empathy
Acknowledge the unease. Don’t brush aside legitimate concerns about job security or skills becoming outdated. Research on trust in leadership shows that when people feel heard and understood, they are more open to change. Starting with empathy builds credibility.
2. Share the “Why” Before the “What”
Behavioural psychology reminds us that people are more likely to embrace change when they understand its purpose. Explain why your organization is exploring or implementing AI, whether it’s about improving customer service, streamlining repetitive tasks, or giving your team more time for creative work. Without a clear “why,” employees may assume the worst.
3. Frame AI as Augmentation, Not Replacement
Our data shows Canadians are divided on whether AI will be a net job creator. Leaders can help tip that balance by framing AI as a tool that enhances human potential rather than eliminates it. Highlight tasks AI can take off people’s plates so they can focus on higher-value, more meaningful work.
4. Be Transparent About Limits and Unknowns
Psychological studies on uncertainty management suggest that people prefer imperfect information to silence. If you don’t know exactly how AI will change every role, say so. Share what you do know, commit to regular updates, and involve employees in shaping how AI gets used. Transparency reduces fear.
5. Invest in Skills and Agency
Finally, give employees a sense of control. Our research finds that Canadians want to adapt, they just want help doing it. Offering training, skills development, and opportunities to experiment with AI tools empowers employees to feel prepared rather than powerless. It turns AI into something they can use, not something done to them.
AI is not just a technological shift; it’s a cultural and psychological one.
For leaders, the task is not only to deploy new tools but also to guide your teams through the emotions that come with them. If you can lead with empathy, clarity, and transparency, and give your employees the confidence to adapt, you’ll not only make AI work in your organization, you’ll strengthen trust, resilience, and the sense of shared purpose that every great workplace depends on.
As Ontario heads into the fall, Doug Ford and the Progressive Conservatives remain firmly in control of the province’s political landscape. The latest Abacus Data survey shows the PCs strengthening their position even further, as the Premier’s personal brand continues to outperform all rivals, while the opposition parties struggle to gain traction.
Six months after the election, the PCs appear to be consolidating—not just holding—their support, with rising vote share, stable approval, and a broad base of backing across demographics and regions
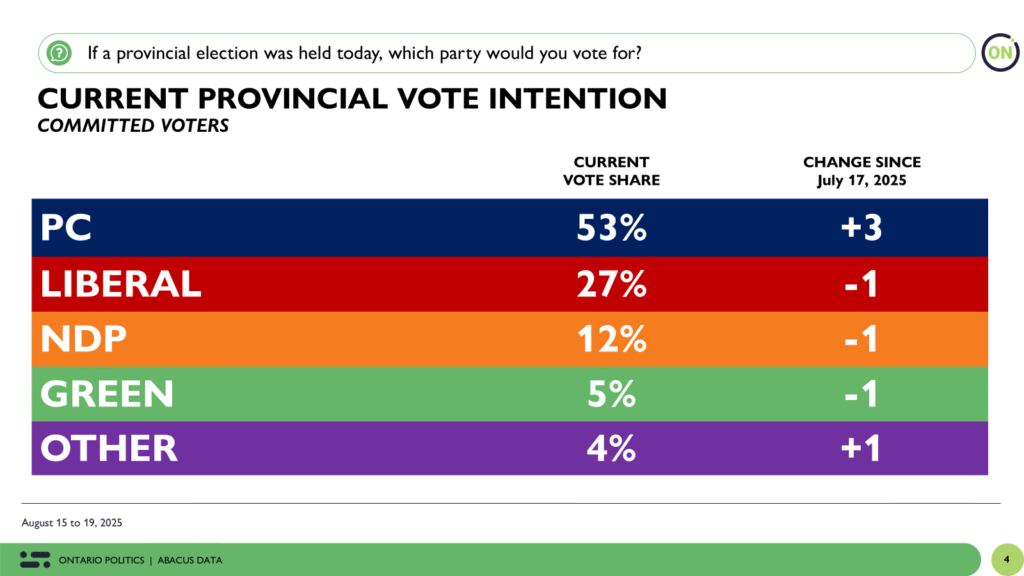
Vote Intention: PCs Expand Lead to 26 Points
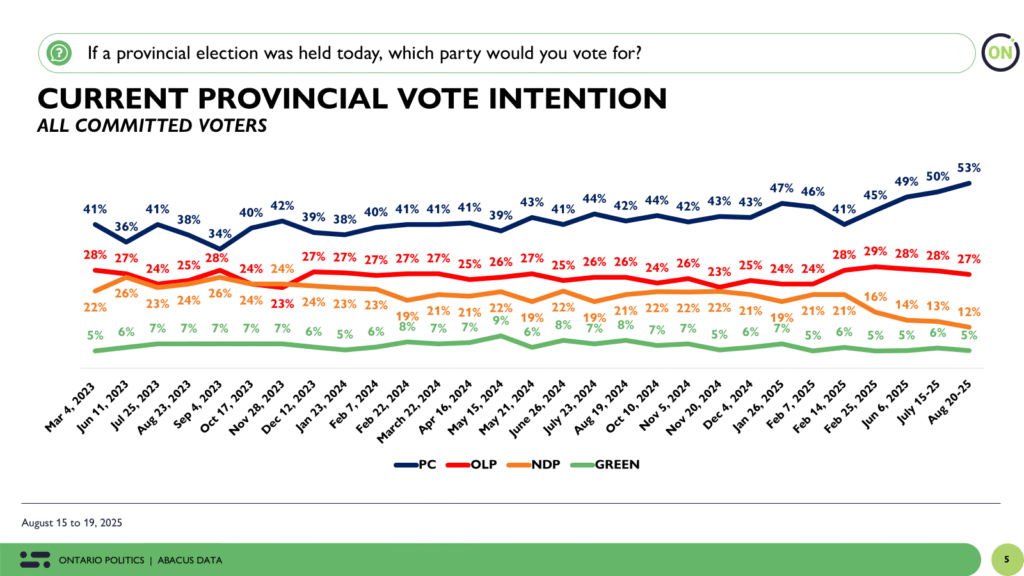
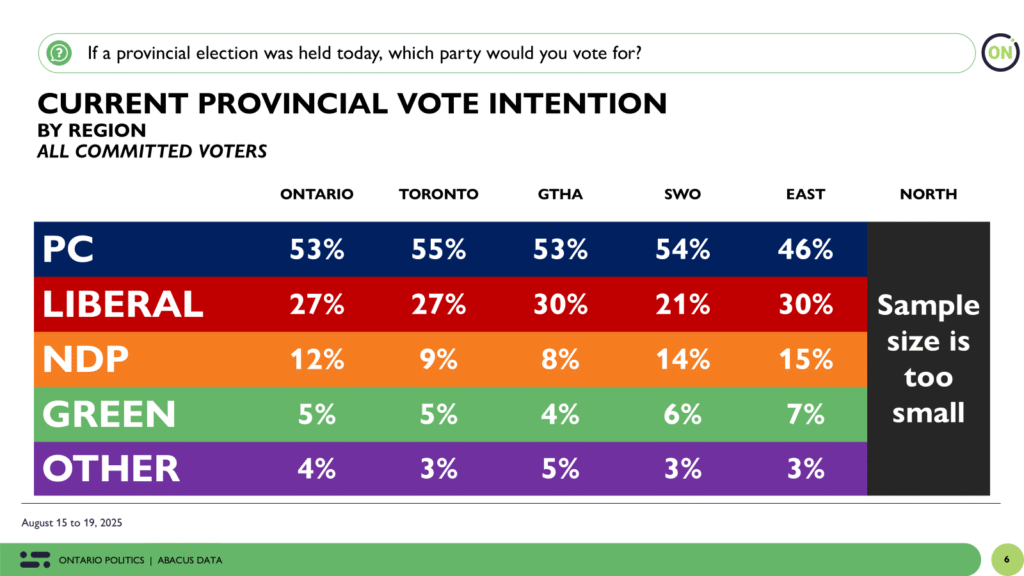
If a provincial election were held today, 53% of committed voters would cast their ballot for the Ontario PC Party, up 3 points since mid-July and marking their highest share we have ever measured for them. The Ontario Liberals sit at 27% (-1), while the NDP has declined again to 12% (-1). The Greens now register 5% (-1), with other parties at 4%.
This extends the PC lead over the Liberals to 26 points, a margin not seen since the immediate post-election period.
Over the past six months, the PC vote has steadily climbed, from the low 40s in March to the low 50s today, with the opposition parties either stagnating or declining in that time. This trendline reflects a government benefiting from a political environment still largely defined by Trump and the cost of living – two issues that Ford and the PCs are seen to perform well on.
Approval: Ford Government Holding at 48%
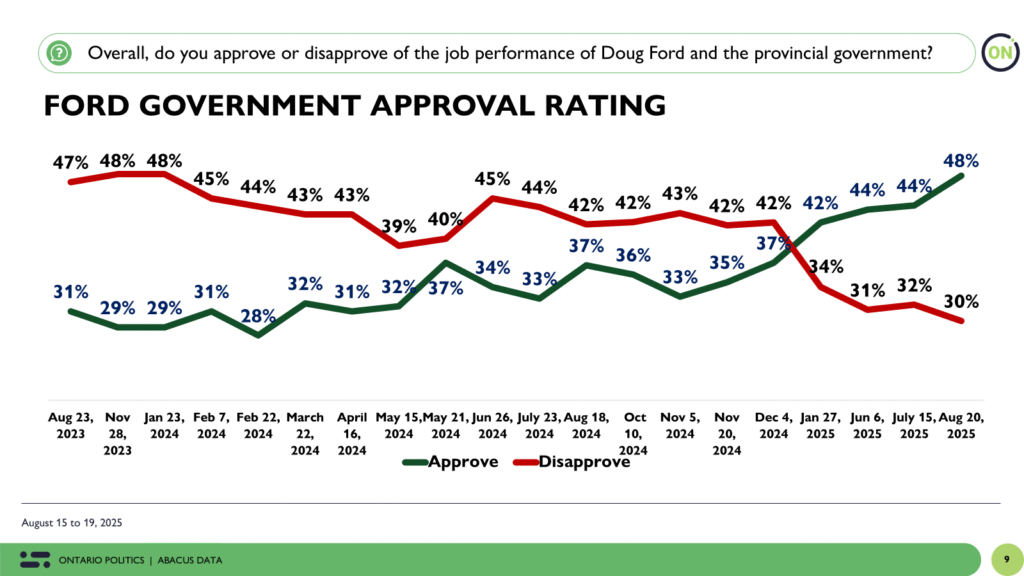
The Ford government’s job performance rating also continues to hold firm. As of August, 48% approve of the job Ford and his government are doing (+4 since mid-July), while 30% disapprove (-2). This yields a net +18, the highest level recorded since early 2024.
Approval has been trending upward since early November, when it hovered around 33%. Since then, public support has steadily increased, rising 15 points since the U.S. Presidential election.
This trend suggests growing comfort with Ford’s leadership style and performance, especially amid broader economic and geopolitical concerns dominating the public discourse.
Doug Ford Remains the Most Popular Leader
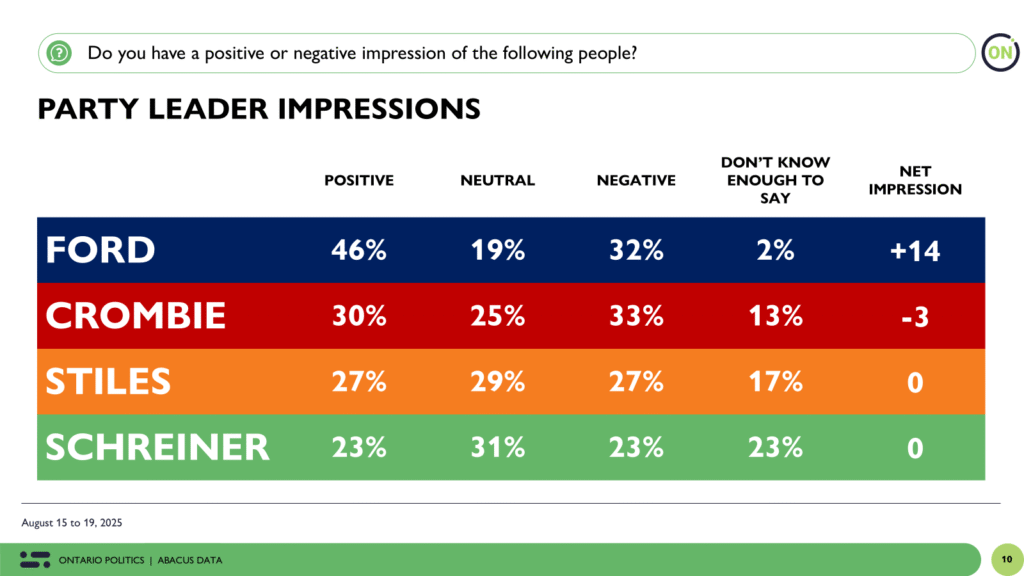
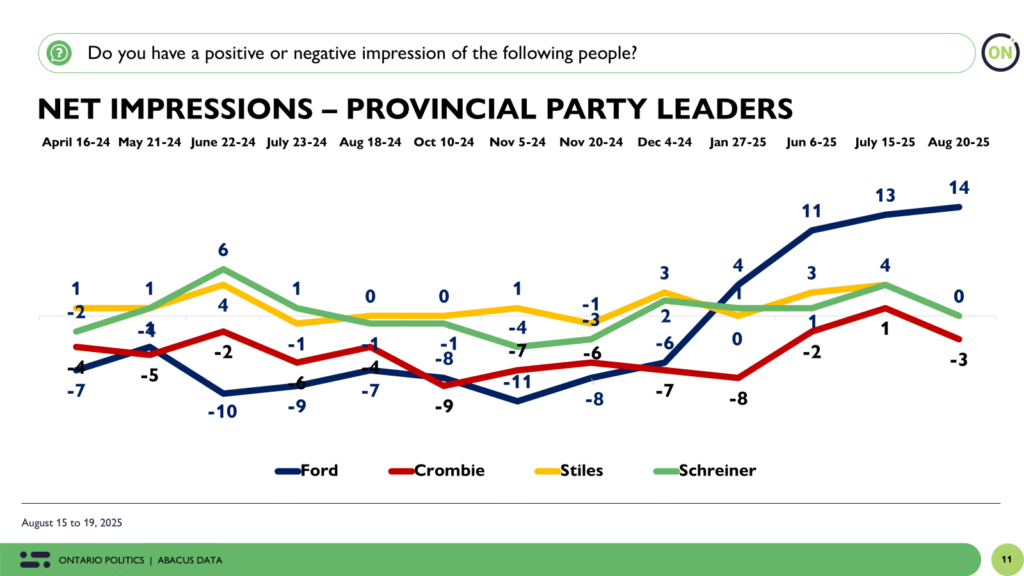
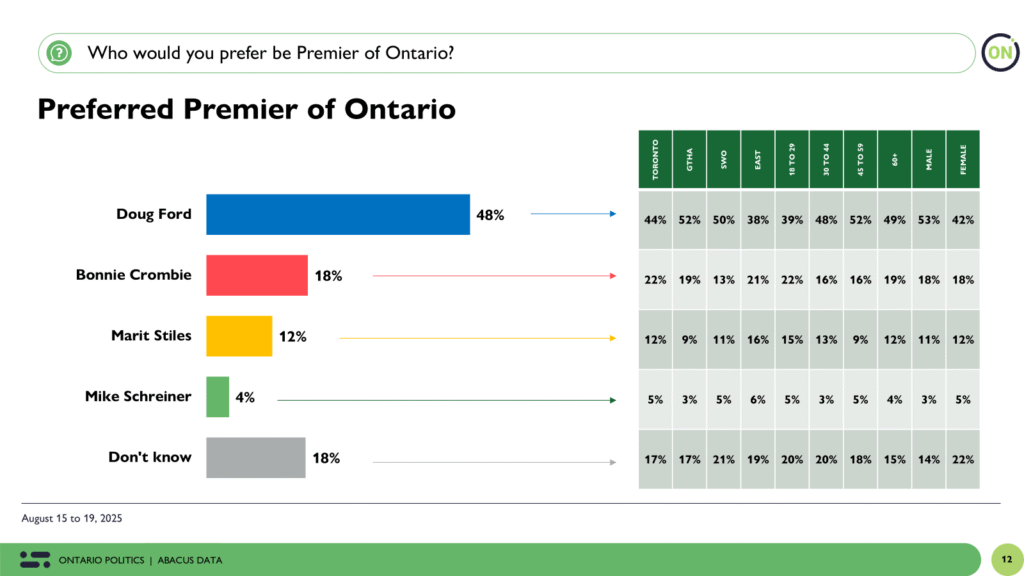
Doug Ford continues to enjoy the strongest personal ratings among provincial leaders. His net impression sits at +14, with 46% of Ontarians viewing him positively and 32% negatively. Only 2% say they don’t know enough to offer an opinion. This is a sign of both familiarity and entrenchment.
By contrast, Bonnie Crombie is viewed positively by 30% and negatively by 33% (net -3), while Marit Stiles and Mike Schreiner both register net scores of 0. Notably, one in five Ontarians still say they don’t know enough about Stiles (17%) or Schreiner (23%) to offer a clear impression.
Ford is also the preferred choice for Premier among 48% of Ontarians, with Crombie trailing far behind at 18%, followed by Stiles at 12% and Schreiner at 4%.
This 30-point advantage in Premier preference is another sign of Ford’s durable leadership brand—a mix of familiarity, comfort, and perceived competence that cuts across multiple voter segments.
PCs are Regionally and Demographically Dominant
The PCs hold commanding leads across all major regions:
Toronto: 55% PC vs. 27% Liberal
GTHA: 53% PC vs. 30% Liberal
Southwestern Ontario: 54% PC vs. 21% Liberal
Eastern Ontario: 46% PC vs. 30% Liberal
Demographically, the PC Party leads among:
Men (57%) and women (48%)
Voters aged 45 to 59 (58%) and 60+ (55%)
Even among younger voters aged 18 to 29, the PCs garner 40%, ahead of the Liberals (36%) and NDP (14%)
These results underscore a key point: PC support is not just large, it is broad. The party maintains double-digit leads across almost every region, gender, and age group.
The Upshot
Doug Ford and the Ontario PCs enter September in their strongest position since they were elected in 2018. With 53% of the vote, a 26-point lead over the Liberals, and an approval rating approaching 50%, Ford has not only maintained his edge, he’s expanded it.
Much of this strength comes comfort with Ford’s approach and focus on protecting Ontario from Trump, leading premiers and coordinating with Prime Minister Carney. With few major disruptions or scandals and a Premier who has embraced a more collaborative, steady style, the environment continues to favour the incumbent. His wide lead in preferred Premier and personal favourability adds to the sense of stability.
The Liberals, despite a comparable accessible voter pool, have stalled. Crombie’s personal numbers have dipped, and the party has now lost a point in each of the last two waves. With a leadership review convention approaching, the stakes are high, but the room to move the needle appears limited.
The NDP struggles under the weight of a weak national party brand.
Looking ahead, affordability, housing, and broader global uncertainty continue to shape the political climate. For now, that environment is playing to Doug Ford’s strengths.
Methodology
The survey was conducted with 1,037 eligible voters in Ontario from August 15 to 19, 2025.
A random sample of panelists were invited to complete the survey from a set of partner panels based on the Lucid exchange platform. These partners are typically double opt-in survey panels, blended to manage out potential skews in the data from a single source.
The margin of error for a comparable probability-based random sample of the same size is +/- 3.04%, 19 times out of 20.
The data were weighted according to census data to ensure that the sample matched Ontario’s population according to age, gender, educational attainment, and region. Totals may not add up to 100 due to rounding.
We are Canada’s most sought-after, influential, and impactful polling and market research firm. We are hired by many of North America’s most respected and influential brands and organizations.
We use the latest technology, sound science, and deep experience to generate top-flight research-based advice to our clients. We offer global research capacity with a strong focus on customer service, attention to detail, and exceptional value.
And we are growing throughout all parts of Canada and the United States and have capacity for new clients who want high quality research insights with enlightened hospitality.
Our record speaks for itself: we were one of the most accurate pollsters conducting research during the 2021 Canadian election following up on our outstanding record in the 2019, 2015, and 2011 federal elections.
In recent years, Canadian workers have experienced a profound shift in mindset. We’ve described this as a move from scarcity (worrying about whether you have enough today) to precarity (worrying whether the systems and supports you rely on will hold tomorrow).
This change isn’t abstract. It shows up in the workplace every day, and it’s reshaping the dynamics of collective bargaining and labour relations in Canada. And perhaps nowhere is the shift more evident than across generational lines.
Labour Conflict at Near-Historic Levels
Since COVID-19, Canada has seen a surge of strikes, lockouts, and tense negotiations. In 2023 alone, over 800 labour disputes resulted in about 6.6 million person-days lost to work stoppages, roughly six times higher than in 2019. That’s the highest level of conflict in decades, approaching the strike activity of the 1970s and 1980s.
What’s driving it? Inflation eroded real wages, corporate profits hit record highs, and workers who sacrificed during the pandemic now feel they’ve fallen further behind. When people already feel precarious, worried about housing, retirement security, or health care, they’re far less willing to accept modest gains at the bargaining table.
For younger workers the sense of precarity is even more acute. They are the generations least likely to own homes, most burdened by debt, and most exposed to automation and AI disruptions. They also expect more transparency, fairness, and respect in the workplace. That combination has made them particularly vocal in pushing their unions to fight harder.
Tentative Agreements Are No Longer a Sure Thing
Perhaps the clearest signal of this new reality is what’s happening at ratification votes. Across industries, workers are rejecting tentative deals at levels we haven’t seen in years.
At Canada’s West Coast ports, dockworkers voted down a recommended settlement, sending negotiators back to the table.
Metro grocery workers in Toronto—many of them younger, lower-wage employees—rejected a first deal and went on strike, eventually securing bigger gains.
Air Canada flight attendants, a group that skews younger and more female than many other bargaining units, are now voting on a tentative agreement that many members say still doesn’t deliver a liveable wage.
In each case, workers are sending a message: “it simply isn’t enough.” Bargaining committees can no longer assume that members will accept the first deal struck. Instead, members are empowered, connected, and more willing to take risks in pursuit of security.
The Generational Divide Inside Unions
What makes this moment especially complex is that unions now represent memberships spanning four or five generations. Baby Boomers may prioritize pension protection and healthcare benefits. Gen X often wants stability and predictability as they approach retirement. Millennials and Gen Z—facing unaffordable housing, unstable contracts, and stagnant wages are more likely to demand bold gains, even if it means prolonged conflict.
Our generational research shows that Millennials and Gen Z approach institutions differently: they are less deferential, more skeptical of leadership, and more comfortable challenging the status quo. Within a union, that can mean younger members pushing leadership to reject deals that older members might have once accepted. These internal generational gaps are now driving much of the conflict we see.
Why Research Matters
For unions, this environment presents both opportunities and risks. A mobilized membership can be a source of strength. But it also means leaders must be attuned to the different expectations across generations. Misreading the mood of younger members risks a rejected agreement, extended conflict, and internal divisions.
This is where research plays a critical role. Just as we advise companies and governments to understand public opinion before making big decisions, unions need evidence-based insights into what their members are thinking—especially when generational gaps are widening.
We have worked with public and private sector unions to design member surveys that don’t just measure headline approval, but probe deeper:
Which issues matter most to younger versus older members?
How do life-stage priorities shape bargaining expectations?
What levels of risk are different groups prepared to accept in pursuit of gains?
By mapping these generational differences, we help union leaders anticipate where fractures could emerge and how to bridge them. The result: agreements that are more likely to be ratified and memberships that feel heard.
The Upshot
The precarity mindset has changed the calculus of collective bargaining in Canada. Workers—especially younger ones—feel anxious about the future, and that anxiety is showing up in higher strike rates, more conflict, and more tentative agreements voted down.
For unions, research isn’t optional. Understanding generational differences in members’ expectations is now essential. It’s the difference between a deal that unites a membership and one that divides it.
That research should be independently designed and executed so members feel free sharing their views without fear of repraisal.
Our expertise in generational analysis and labour research gives leaders the tools to navigate this new reality. In a time defined by precarity and generational divides, listening has never been more powerful.
Reach out to labour expert David Coletto to start a conversation.
From August 15 to 19, 2025, Abacus Data surveyed 1,915 Canadian adults on the state of federal politics. The poll captures public opinion just as Air Canada flight attendants initiated strike action but it’s important to note that many of the interviews were completed prior to that event, and thus this wave does not fully reflect its impact. The same is true for Pierre Poilievre’s byelection victory on Monday.
What the data does show is a modest but meaningful shift: the Conservative Party has pulled slightly ahead in national vote intention for the first time in months. Meanwhile, the issue landscape remains anchored in affordability, with Donald Trump fading as a top-tier concern, a notable shift in a summer that’s otherwise seen stability in attitudes.
Despite these changes, government approval remains relatively steady, though with signs of erosion around economic management. The political weather hasn’t turned, but the winds may be shifting.
Direction of the Country: Steady Concern, No Escalation
Just over a third of Canadians (35%) believe the country is headed in the right direction, essentially unchanged from early August. Meanwhile, 47% say things are on the wrong track. Views of the global outlook (14% right direction) and of the United States (13%) remain bleak, driven by persistent global uncertainty and lingering wariness toward U.S. leadership.
Top Issues: Trump Recedes, Affordability Remains King
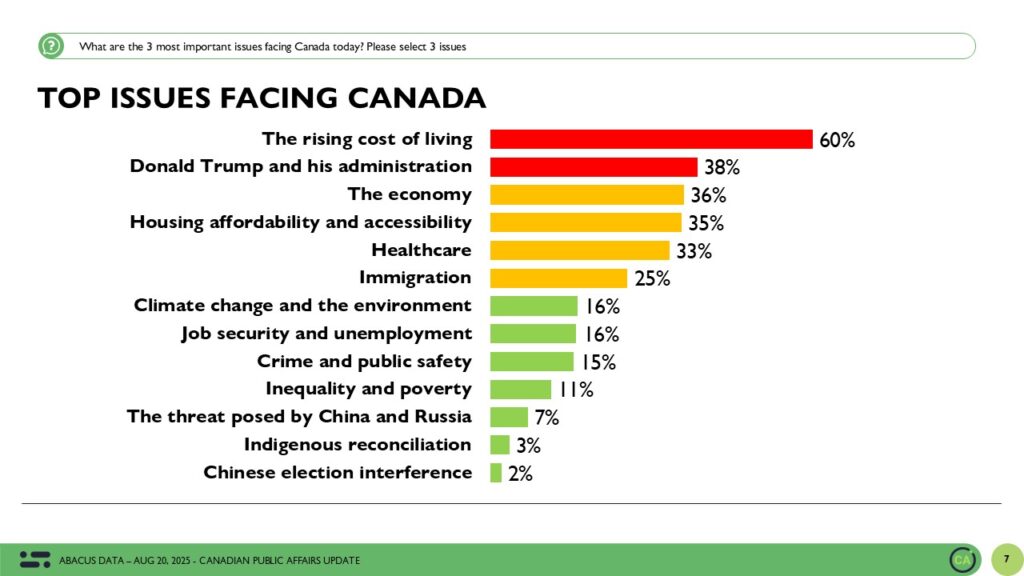
The rising cost of living continues to dominate the political conversation chosen by 60% of Canadians as one of their top three concerns. The broader economy follows at 36%, and housing at 35%. Healthcare ranks fourth at 33%.
Donald Trump’s influence as a political issue appears to be diminishing. Mentioned by 38% this wave and down from 44% earlier in the summer, Trump now sits behind cost of living and is tied with the economy in salience. While still significant, his shadow is receding slightly, likely reflecting both Canadian fatigue and a slight cooling in U.S. news coverage.
Immigration remains in the middle of the pack, cited by 25%, and continues to be more polarizing than broadly resonant.
Government Approval: Still Solid, But Signs of Softness
Approval of the Carney-led federal government stands at 49%, down a point from two weeks ago and below the 50% threshold for the first time since March. Disapproval has edged up to 30%.
While these figures are still relatively strong, they point to gradual softening. The government retains majority support, but the cost of living crunch and continued frustrations around housing may be beginning to wear on that goodwill.
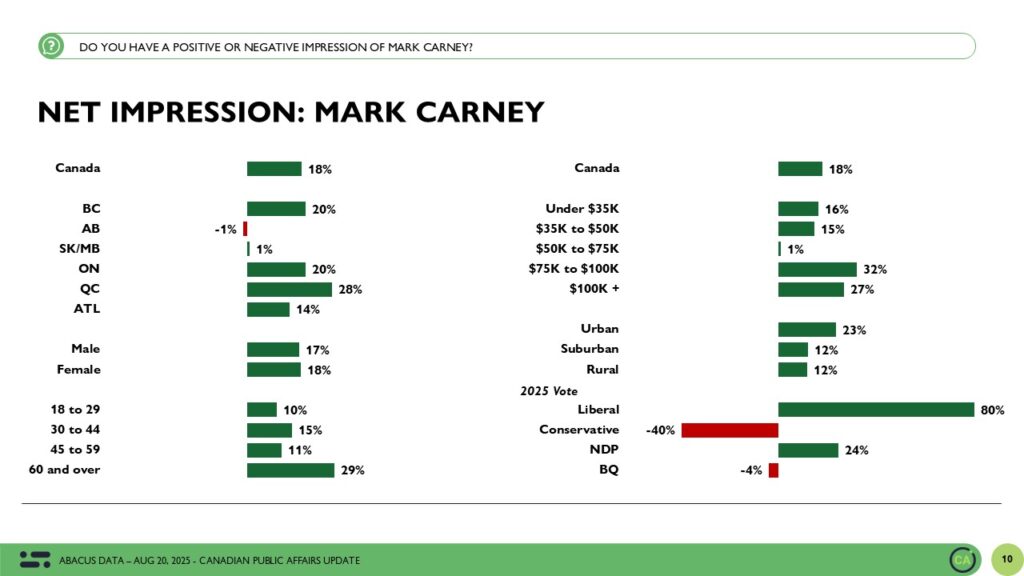
Mark Carney remains in net positive territory, with 48% viewing him favourably and 30% unfavourably, for a net score of +18 mostly unchanged since the election. His numbers remain strongest in Quebec (+28), Ontario (+20), and B.C. (+20), and among Baby Boomers (+29) and higher income Canadians.
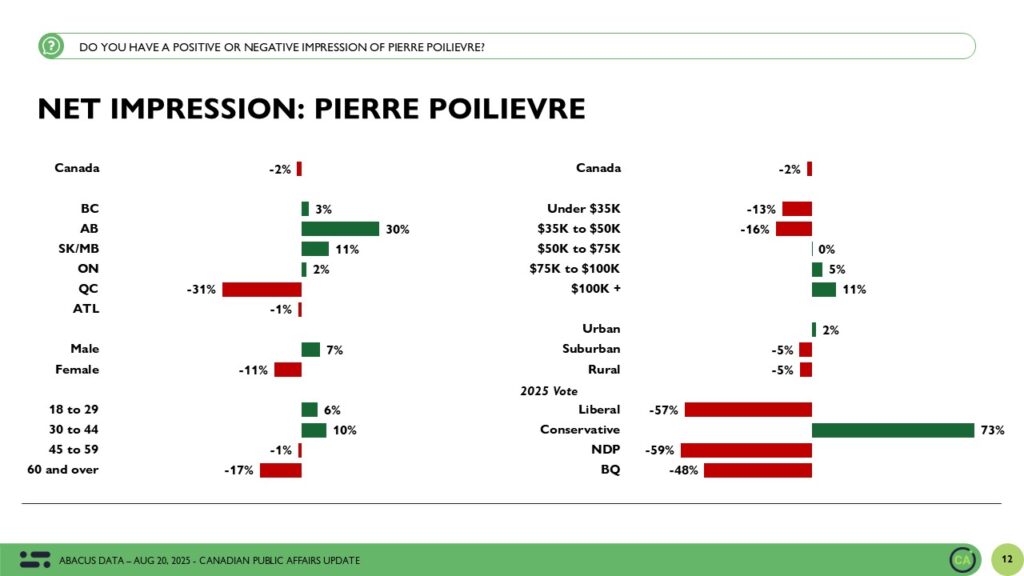
Pierre Poilievre, meanwhile, is holding competitive ground. His favourables (40%) are two points behind his unfavourables (42%), for a net rating of -2. While underwater, this is consistent with his numbers over the past few months and signals consistency in views towards him. Poilievre’s net favourables are higher among younger Canadians and men and lower among older Canadians and women.
Donald Trump remains deeply unpopular in Canada: just 13% view him favourably, with 74% unfavourable, for a net score of -61.
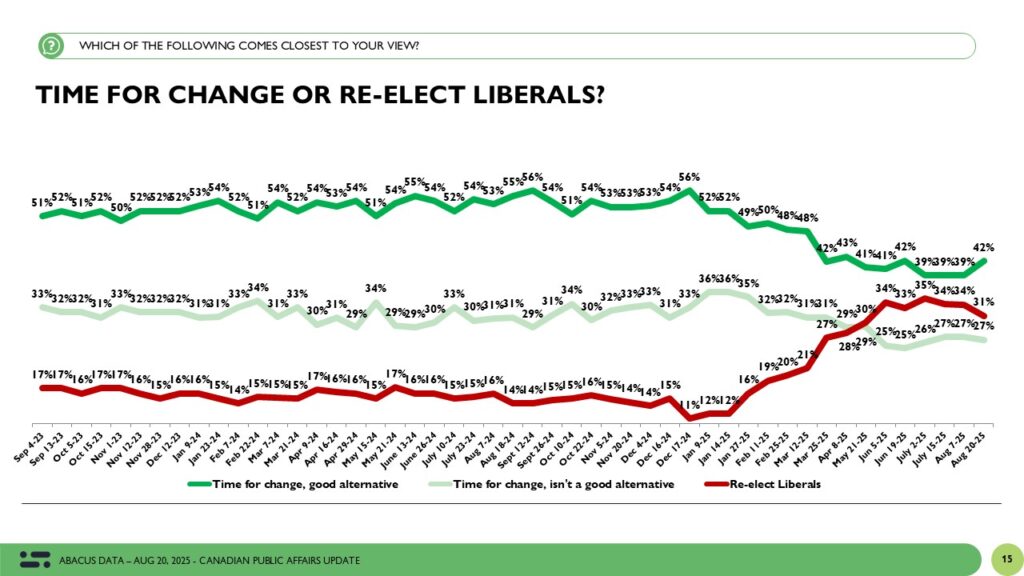
Desire for Change: High, but Not Accelerating
Two-thirds of Canadians (66%) say it’s time for change: 36% believe there is a good alternative, and another 30% want change but aren’t sure there’s a viable option. Meanwhile, 34% still believe the Liberals under Carney deserve re-election down four points since June.
Issue Ownership: Conservatives Gain on Key Files
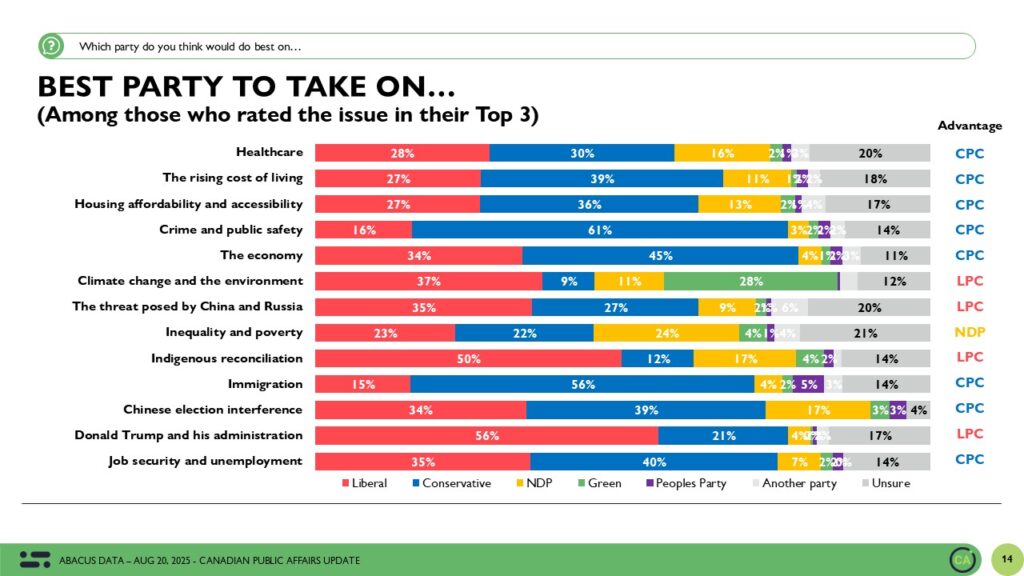
When Canadians are asked which party is best equipped to handle the issues they personally care most about, a clear pattern emerges:
Cost of living: Conservatives lead (39%) over the Liberals (27%)
The economy: Conservatives lead (45%) vs. Liberals (34%)
Immigration: Conservatives dominate — 56% to the Liberals’ 15%
On these core affordability and economic issues, the Conservatives are building and maintaining leads.
However, the Liberals continue to dominate on other fronts:
Climate change: Liberals lead (37%) vs. Conservatives (9%)
Donald Trump & his administration: Liberals are still the preferred party (56% vs. 21%), but fewer people list it as a top issue now.
The result is a split map, but the issues rising in salience increasingly favour the Conservatives.
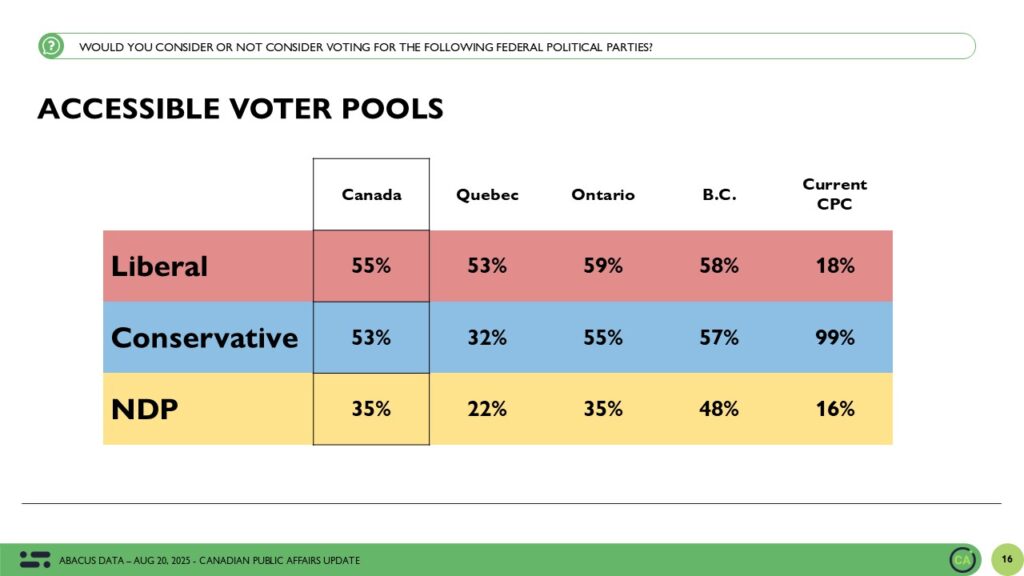
Accessible Voter Pools: Still a Close Contest
The accessible universe for the Liberal Party sits at 55%, virtually unchanged. The Conservatives follow closely at 53%, holding firm. Regionally, Liberals lead in Ontario and Quebec, while the Conservatives dominate in the West. The NDP remains in third, with 35% saying they would consider voting for the party, unchanged since the election.
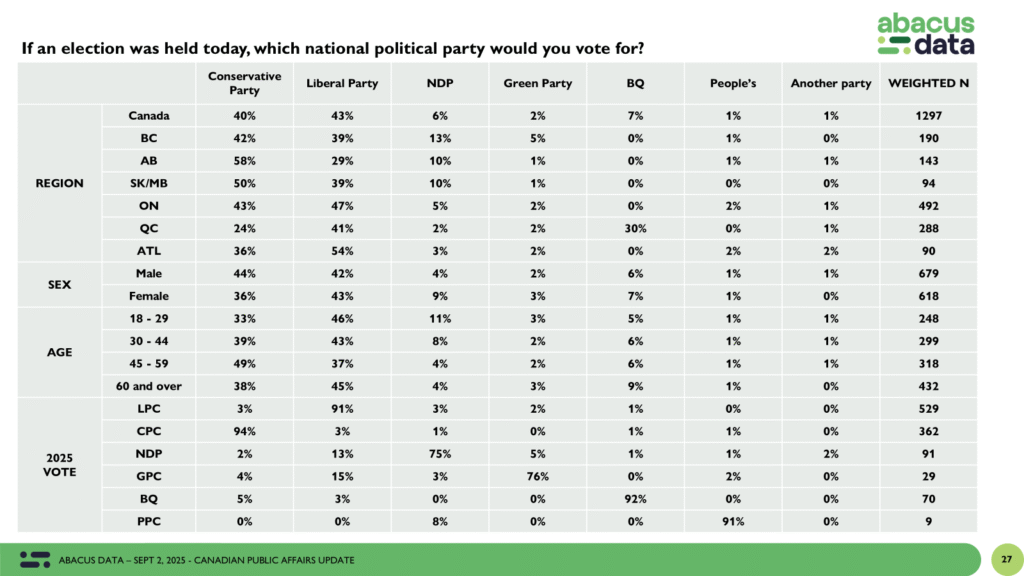
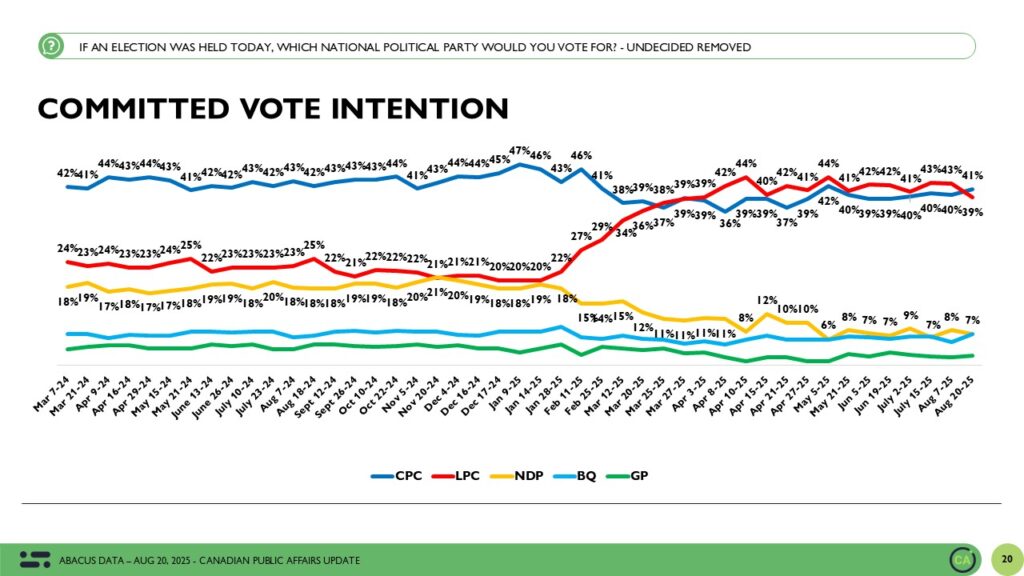
Vote Intention: Conservatives Take the Lead
If an election were held today, 41% of decided voters would cast a ballot for the Conservatives, up one point. The Liberals sit at 39%, down four points since early August. The NDP holds at 7%, Bloc at 7%, Greens at 2%, and PPC at 2%.
Among those certain to vote, it’s a dead heat: 41% Liberal, 41% Conservative suggesting the gap may close in a turnout scenario thanks in part to the Liberal lead among older voters.
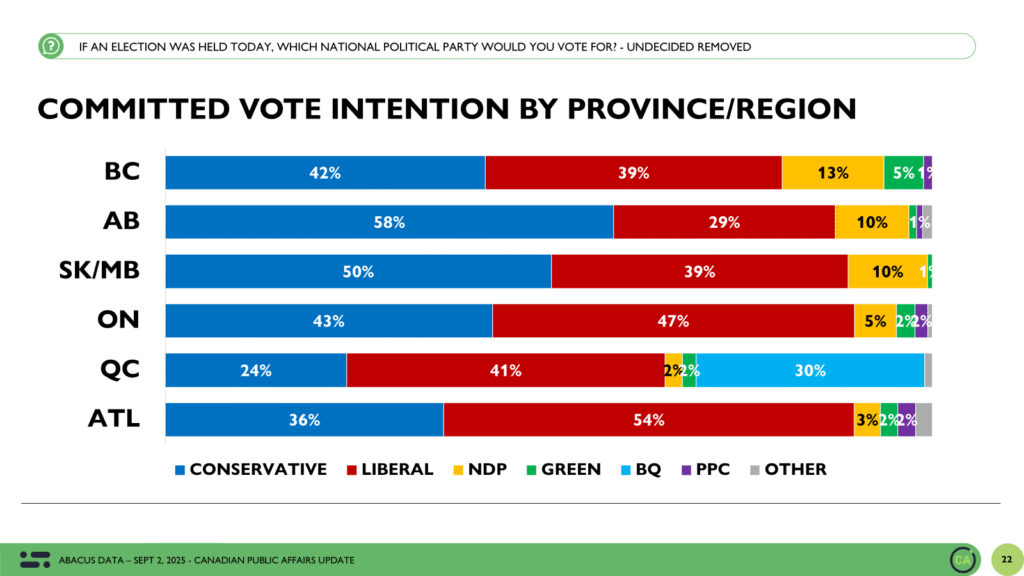
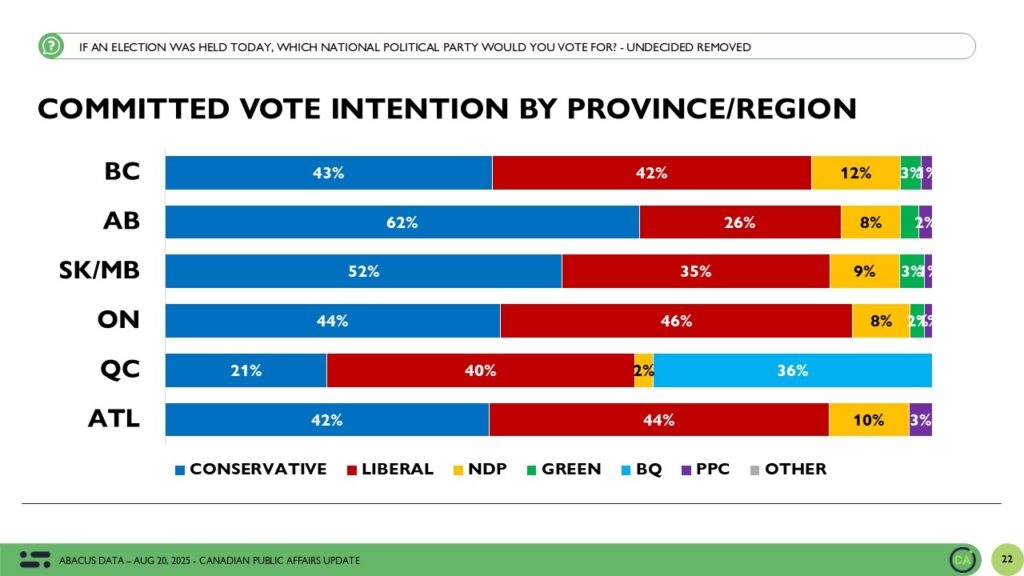
Regional Snapshot:
British Columbia: Conservatives and Liberals statistically tied (43% to 42%)
Ontario: Liberals are marginally ahead 46% to 44%
Quebec: Liberals lead with 40%, Bloc at 36%, CPC at 21%
Atlantic Canada: Liberals and Conservatives statistically tied (43% to 42%)
Alberta: CPC continues to dominate (62% to Liberals’ 26%)
Saskatchewan/Manitoba: Conservatives strong at 52%, Liberals at 35%
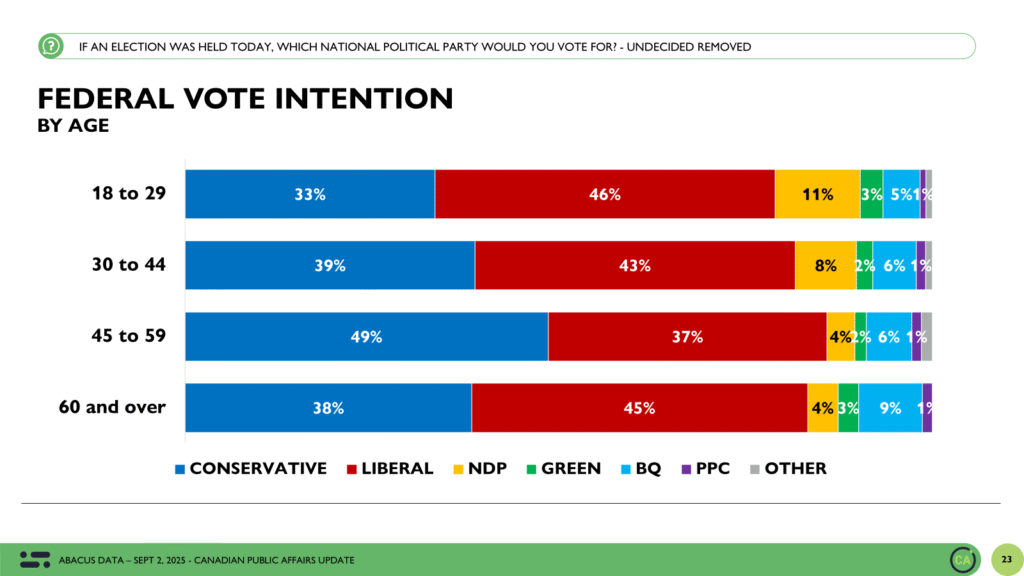
Demographic Trends: Familiar Divides Remain
We see a closing of generational gaps in the data. The Liberals and Conservatives are statistically tied among all age groups except for those aged 45 to 59 who the Conservatives lead by 6. The Liberals lead by 8 among women while the Conservatives lead by 8 among men.
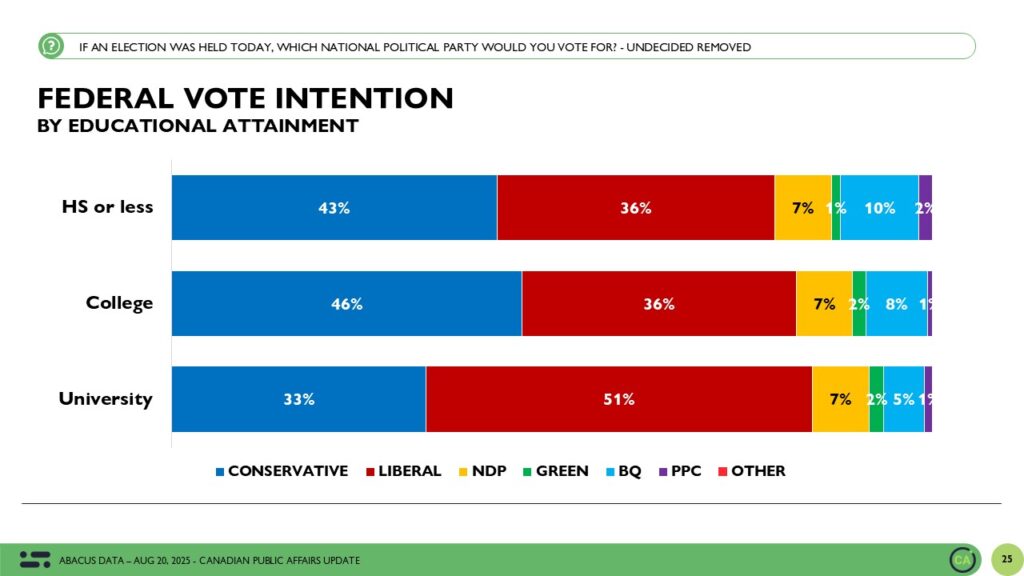
The Liberals lead by 18 among those with a university degree while the Conservatives lead by 10 among those with a college degree and by 7 among those with high school or less.
The Upshot
According to Abacus Data CEO David Coletto: “After a spring and summer of stability in public opinion, we may be seeing signs of fluidity in federal politics. The Carney government still enjoys a solid approval rating, Prime Minister Carney personally remains well liked, and the Liberal brand remains broadly accessible but public concern around affordability is persistent, and the Conservatives are clearly benefiting from that focus.
What’s notable this wave is that Donald Trump’s influence on Canadian political attitudes may be receding for now, allowing domestic issues to reassert dominance. That’s not good news for the governing party, which holds strength internationally but continues to face trust gaps on the economy, housing, and cost of living.
And for those who believe Pierre Poilievre can’t become Prime Minister: the data doesn’t support that view. The issue set remains an asset to the Conservatives, his favourability numbers are not better than Carney’s but not bad either, and the Conservative coalition remains firm. With Poilievre back in the House of Commons this fall and with a complex set of issues in front of the government, we may start to see more shifts in public opinion.”
Methodology
The survey was conducted with 1,915 Canadians from August 15 to 19, 2025. A random sample of panelists were invited to complete the survey from a set of partner panels based on the Lucid exchange platform. These partners are typically double opt-in survey panels, blended to manage out potential skews in the data from a single source.
The margin of error for a comparable probability-based random sample of the same size is +/- 2.2%, 19 times out of 20.
The data were weighted according to census data to ensure that the sample matched Canada’s population according to age, gender, and region. Totals may not add up to 100 due to rounding.
We are Canada’s most sought-after, influential, and impactful polling and market research firm. We are hired by many of North America’s most respected and influential brands and organizations.
We use the latest technology, sound science, and deep experience to generate top-flight research-based advice to our clients. We offer global research capacity with a strong focus on customer service, attention to detail, and exceptional value.
And we are growing throughout all parts of Canada and the United States and have capacity for new clients who want high quality research insights with enlightened hospitality.
Our record speaks for itself: we were one of the most accurate pollsters conducting research during the 2025 Canadian election following up on our outstanding record in the 2021, 2019, 2015, and 2011 federal elections.
Earlier this year, precarity emerged as the defining mindset across Canada. At a time when housing pressures were mounting, healthcare strains were deepening, and job insecurity lingered, Canadians began to question not just whether they could afford what they needed today, but whether the systems they rely on – housing, healthcare, stable work, even national security – would hold up tomorrow. Pressures from the U.S., including tariff threats and questions of sovereignty, only amplified this sense of instability and cast doubt on the resilience of the country itself.
This anxiety played out directly in the federal election. Canadians most attuned to these pressures gravitated toward Carney and the Liberals, seeking calm and reassurance in a period of turbulence. Others, frustrated by years of economic strain and institutional drift, turned to Poilievre and the Conservatives, whose promise of bold change and disruption appealed to those who saw the status quo as part of the problem. In the end, Carney’s message of stability won out, resonating with a country craving certainty in a time where there was little of it.
But since April, that reassurance has been difficult to sustain. The threat of U.S. tariffs has not gone away. Carney has yet to secure a trade deal with the Trump administration. Housing pressures remain relentless. And the cost of living continues to dominate Canadians’ concerns. The question now is whether the Liberals have delivered the security voters were looking for, or whether the country has slipped further into a heightened state of precarity.
The Shifting Distribution of Precarity
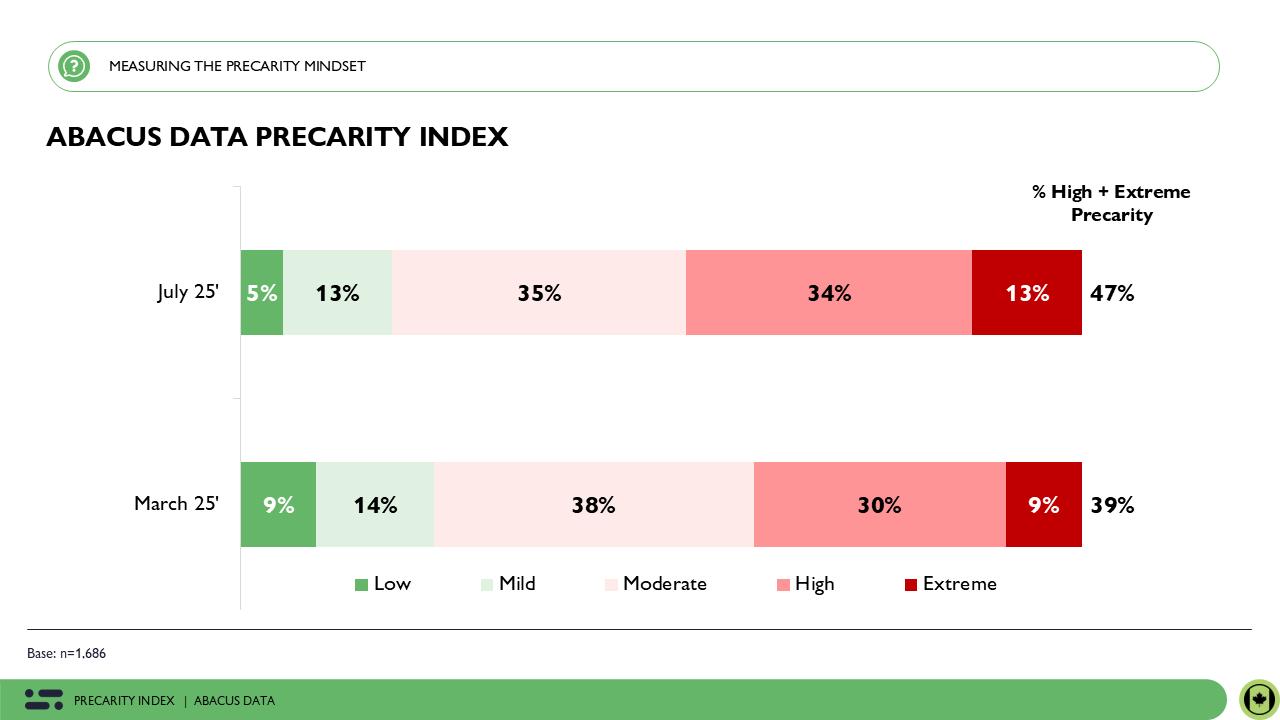
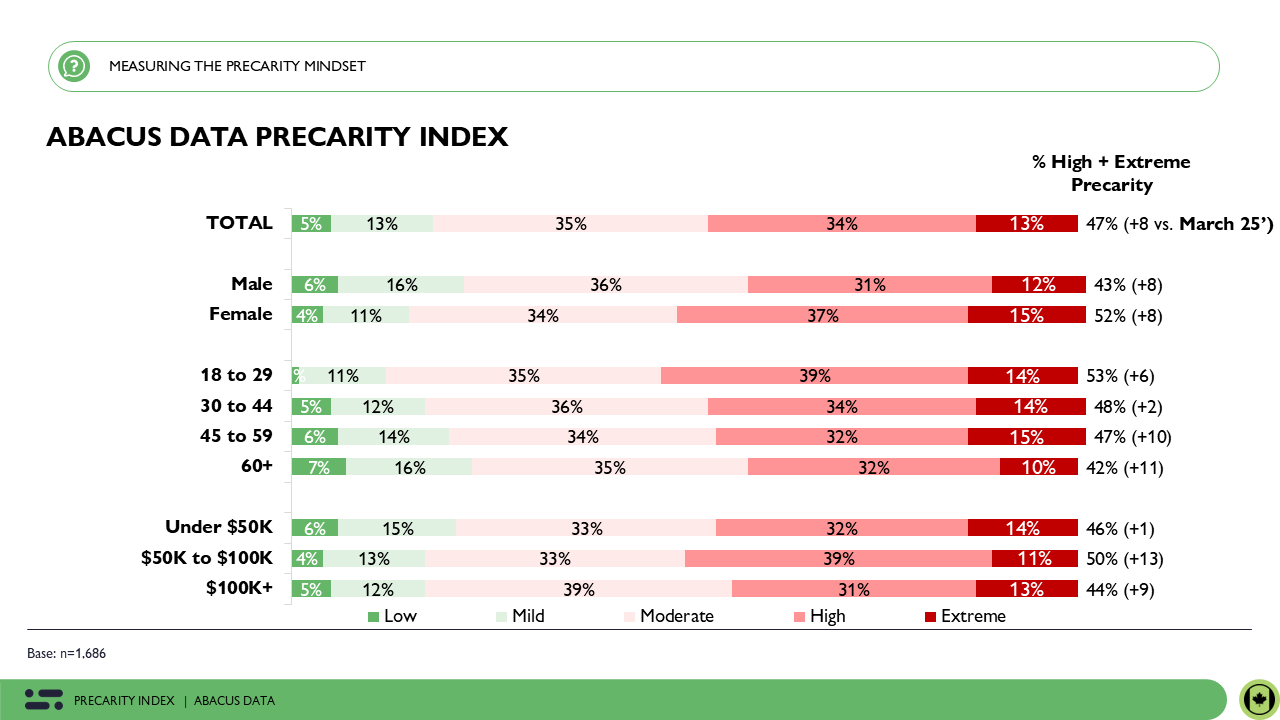
Since March 2025, the distribution of Canadians across the Abacus Data Precarity Index has shifted in ways that highlight a growing polarization. The middle ground is eroding, with fewer Canadians feeling secure and more clustering at the high and extreme ends of precarity.
Low Precarity has dropped nearly in half (5% vs. 9% in March 25’), showing that fewer Canadians feel shielded from disruption or confident in their ability to navigate uncertainty.
Mild Precarity remains virtually unchanged (13% vs. 14%), but this stability masks the broader hollowing out of the middle ground.
Moderate Precarity, still the single largest group, fell slightly to 35% from 38%, reflecting a shrinking share of Canadians who balance anxiety with cautious optimism.
High Precarity rose notably (34% vs. 30%), indicating that stress about finances, climate change, and technology is increasingly shaping everyday decisions.
Extreme Precarity surged to 13% from 9% – a sharp rise that reflects how persistent global tensions, economic volatility, and uncertainty about the future are feeding a sense that sudden or long-term shocks could fundamentally upend people’s lives.
All told, Canada is experiencing a hollowing out of the middle ground, with fewer Canadians sitting in relative comfort and more pushed toward higher levels of vulnerability. This polarization creates an increasingly fractured social and political landscape where experiences of stability and instability are moving further apart.
Demographic Drivers: Rising Anxiety Across the Board
The results show that, since March 2025, precarity has spread well beyond the groups traditionally most exposed to risk. While youth, women, and lower-income households remain the most likely to have high levels of precarity overall, older and higher-income Canadians – once more buffered from volatility – are now experiencing significant increases in perceived precarity.
Age: Younger adults remain the most precarious, with the highest concentration in the high and extreme categories. But the most dramatic increases came from older cohorts: those aged 45–59 reported a 10-point rise in high or extreme precarity, while those 60+ jumped by 11 points. This signals that precarity is now reaching groups once buffered by retirement savings, pensions, and homeownership.
Gender: Women continue to show higher levels of precarity than men, especially at the high and extreme ends. Yet both groups experienced an 8-point increase, underscoring that while women remain most vulnerable, men are also feeling more exposed than in the past.
Income: Lower-income households still face the highest levels of precarity overall, but the steepest increases are now coming from middle- and higher-income Canadians. Those earning $50–100k reported a 13-point rise in high or extreme precarity, while households earning $100k+ climbed 9 points. What was once a relatively secure middle- and upper-income cushion is showing signs of strain.
The groups historically most vulnerable – youth, women, and lower-income Canadians – remain the most likely to feel precarity, but anxiety and uncertainty is spreading quickly among those who once felt stable. This broadening of precarity across demographics signals that insecurity is becoming a shared Canadian experience, not a marginal one.
Political Implications: Precarity and Vote Intentions
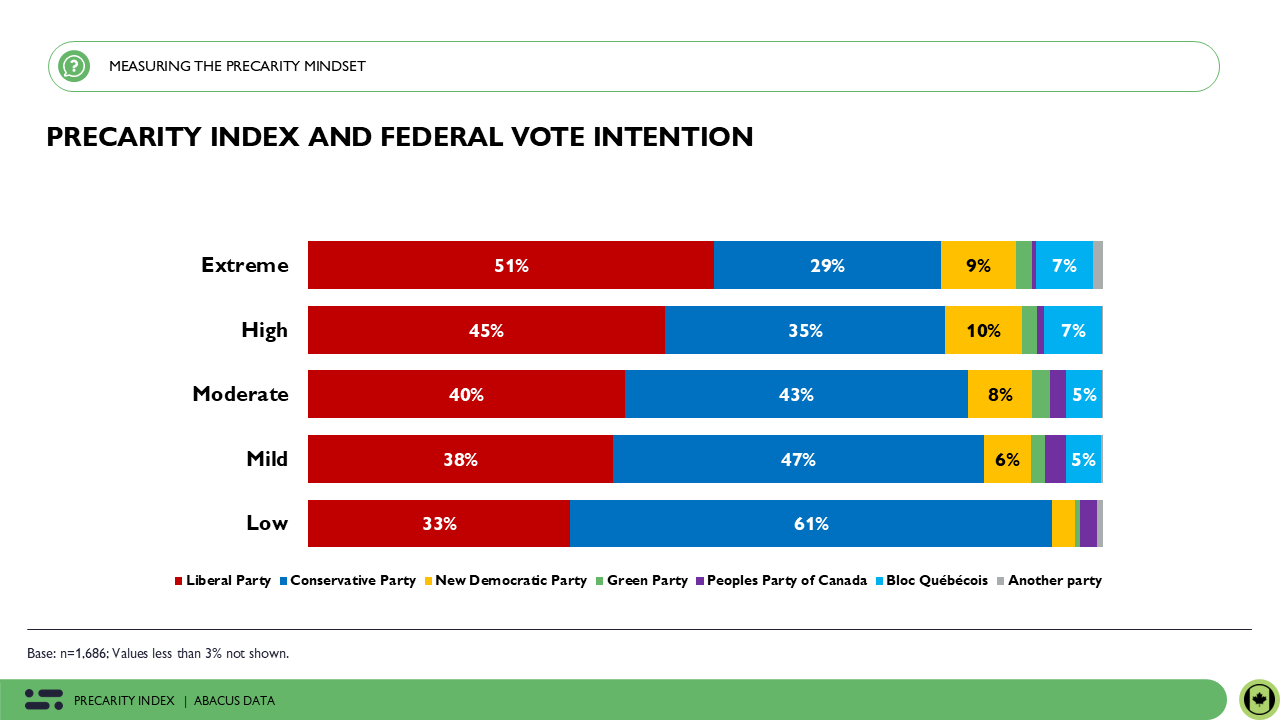
Political preferences are increasingly shaped by the lens of precarity. Among Canadians in extreme precarity, 51% say they would vote Liberal, compared to just 33% in low precarity. Conversely, Conservative support dominates among those with low precarity (61%), underscoring a stark divide.
These results suggest that Canadians most unsettled by economic, environmental, and social turbulence gravitate toward the Carney-led Liberals, viewing them as the safer option to provide protection and stability. Those who feel more shielded from disruption, however, align more strongly with the Conservatives. The Abacus Data Precarity Index thus provides a powerful lens for understanding not just individual anxieties, but also the political polarization that flows from them.
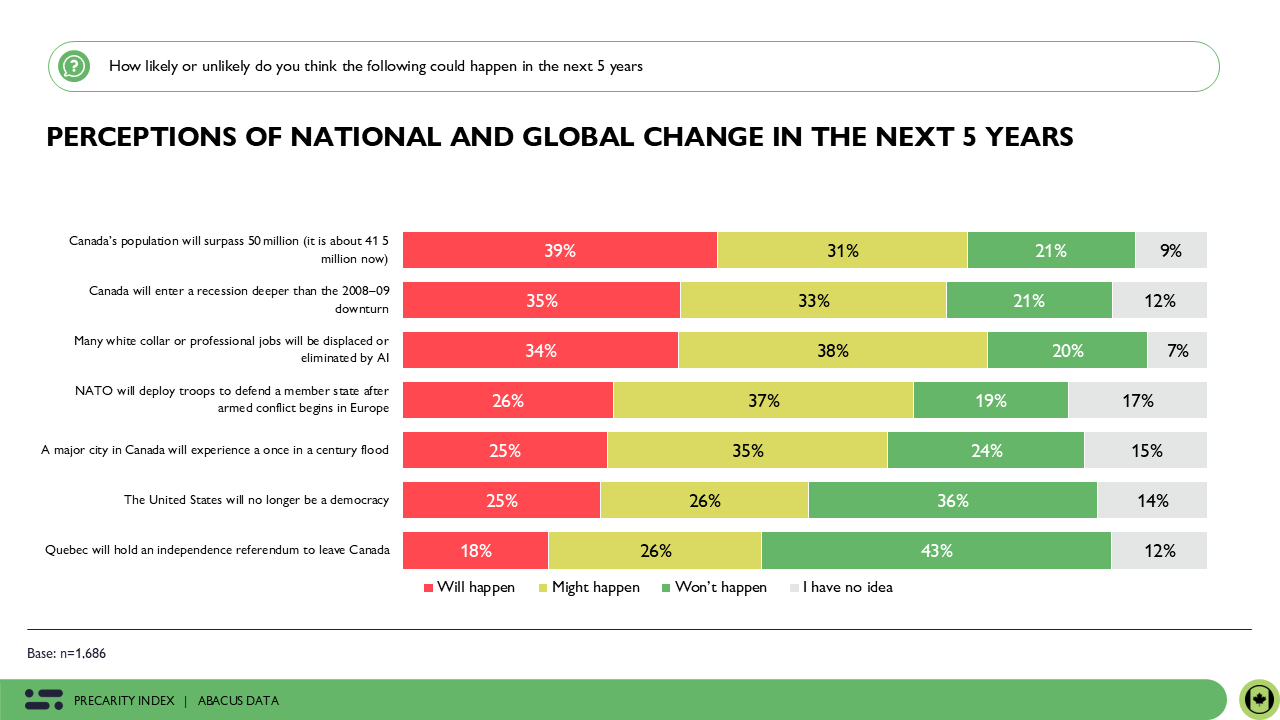
How Canadians See the Next Five Years: Optimism is Very Limited
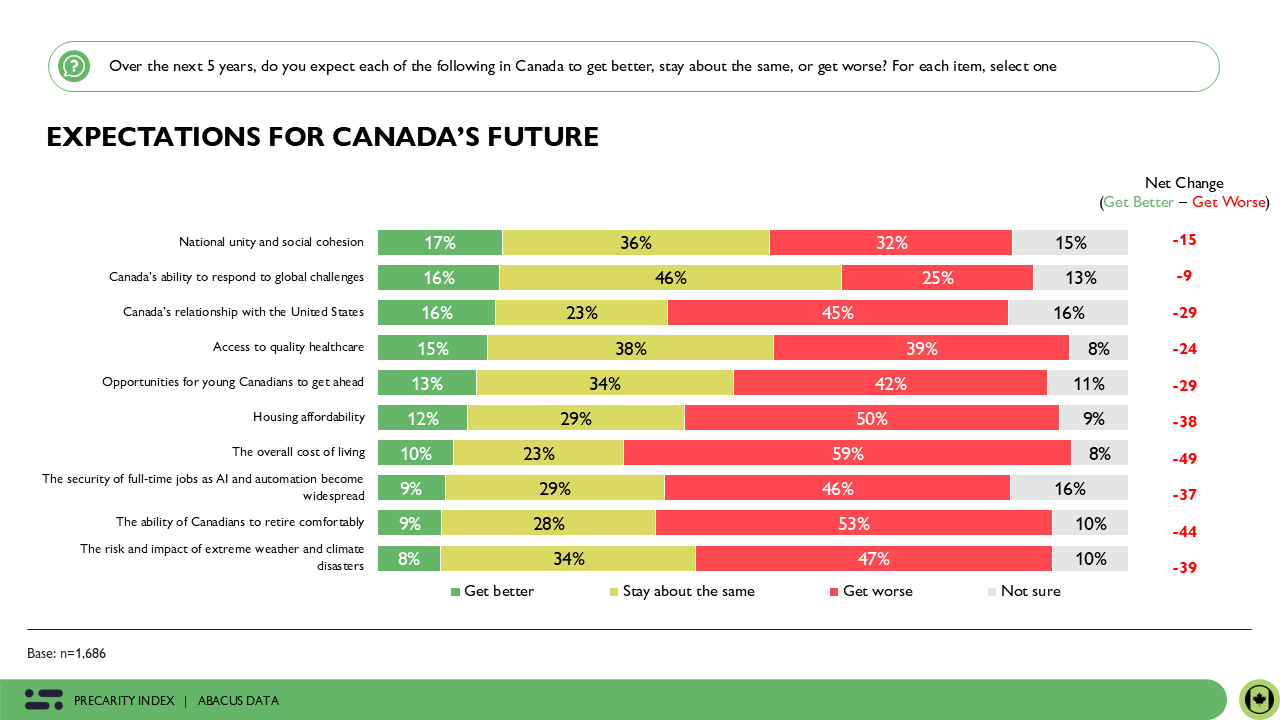
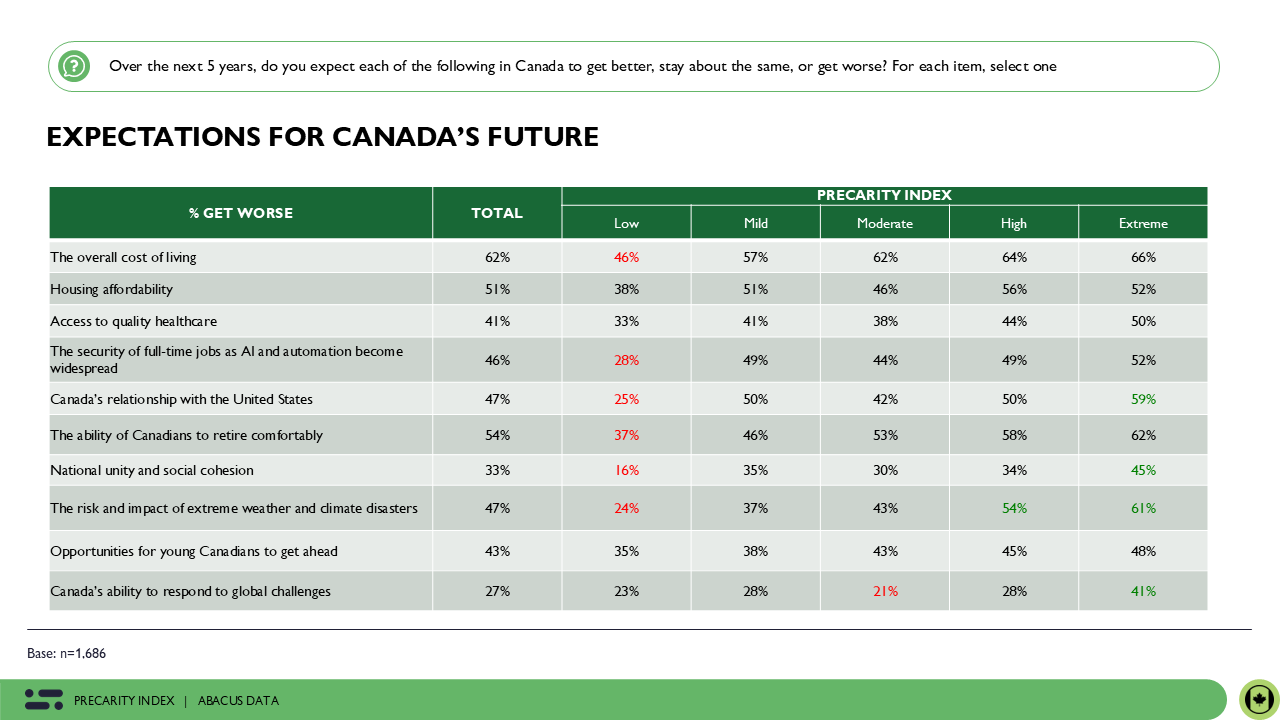
Looking ahead, Canadians see little relief on the horizon. Most believe that the very pressures driving today’s precarity will not only persist but intensify over the next five years.
Cost of living: 59% expect conditions to worsen, compared to just 10% who see improvement, reinforcing the sense that financial strain is becoming a permanent feature of Canadian life.
Housing affordability: Half (50%) anticipate further decline, while only 12% foresee progress, signaling little confidence that current policies will bring relief to one of the country’s most pressing crises.
Climate risks: Nearly half (47%) believe extreme weather and climate disasters will worsen, with just 8% expecting improvements, pointing to mounting anxieties about environmental resilience.
Job security: 46% predict stable, full-time work will erode, compared to 8% who expect gains, as fears of automation and AI disrupting employment intensify.
Canada–U.S. relations: 45% foresee a deterioration in ties with Canada’s closest ally, against 16% who expect improvement, amplifying uncertainty about the country’s geopolitical footing.
In other areas, Canadians anticipate more stagnation than progress. Nearly half (46%) expect Canada’s ability to respond to global challenges to remain unchanged, while significant numbers believe access to healthcare (38%) and national unity (36%) will hold steady.
Taken together, these views paint a sobering picture: Canadians are bracing for decline in the areas that matter most to their day-to-day lives like costs, housing, jobs, climate, and international stability, while expecting little positive momentum elsewhere. The mood is not one of collapse, but of stagnation layered with fragility, where the future feels less like a source of opportunity and more like a continuation of the pressures already weighing heavily on the country today.
At the same time, there’s a striking gap between what Canadians expect and what may plausibly unfold. Few anticipate worsening strains on national unity or the disruptive impact of AI, yet the evidence points in the opposite direction. The likely election of the Parti Québécois in Quebec next year will inevitably stoke renewed talk of independence, testing Canada’s political cohesion in ways not seen for a generation. Similarly, while only a minority foresee AI-driven instability, the technology is almost certain to upend large swaths of the labour market, especially in white-collar sectors where Canadians may feel least vulnerable. This disconnect matters – when pressures materialize that the public is not braced for, the resulting shock can deepen precarity and sour the national mood even further. History suggests that disappointment hits hardest when expectations are misaligned with reality. If Canadians are already girding themselves for stagnation, but then face unanticipated political and economic jolts, the sense of fragility could quickly harden into disillusionment.
What Canadians Believe Could Happen
When asked about major events that may unfold over the next five years, Canadians reveal a mix of skepticism and inevitability. Many expect transformative or destabilizing changes, while dismissing others as unlikely.
39% believe Canada’s population will surpass 50 million.
35% expect a recession deeper than the 2008–09 downturn.
34% believe many white-collar and professional jobs will be displaced by AI.
By contrast, few Canadians see other disruptive events as likely: 43% believe Quebec will not hold an independence referendum, and 36% believe the U.S. will not cease to function as a democracy.
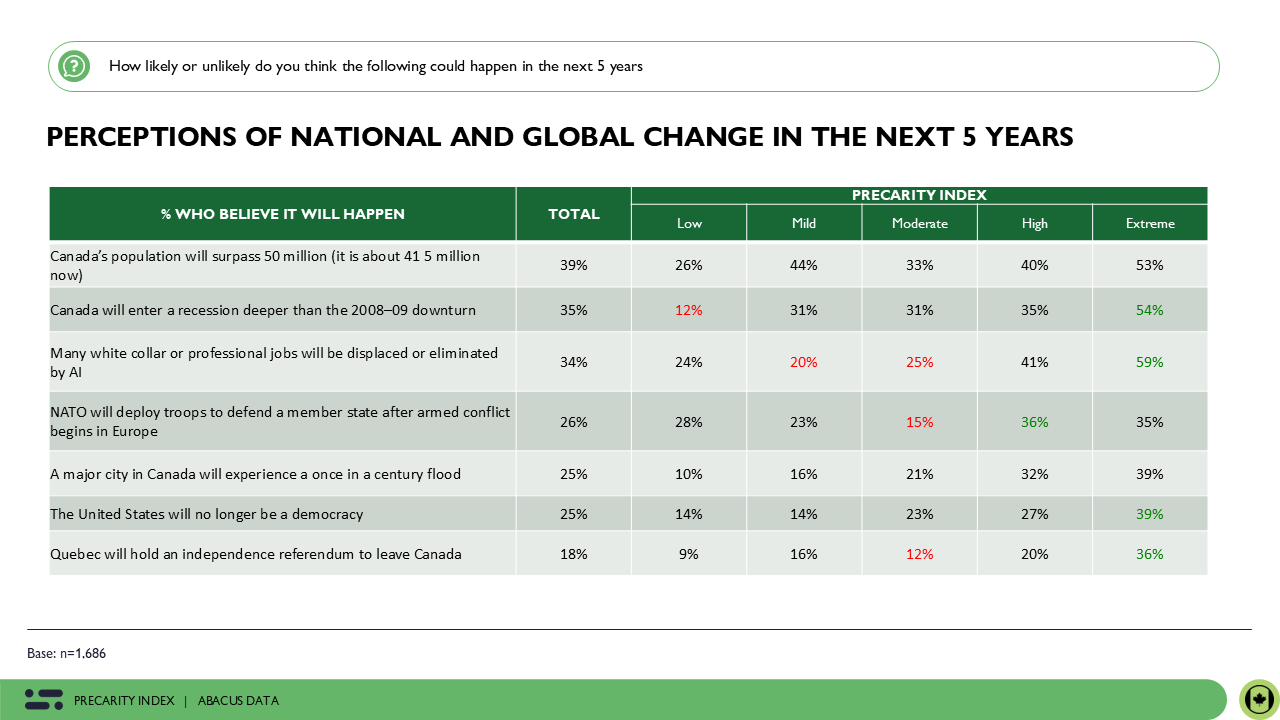
Here again, precarity is a key dividing line. Those in high or extreme precarity are significantly more likely to expect major disruptions. Among those in extreme precarity, 54% predict a severe recession, 59% expect widespread job losses from AI, 39% believe the U.S. will no longer function as a democracy, and 36% anticipate Quebec holding an independence referendum.
These results underline a central insight: Canadians who feel most vulnerable are also the most likely to expect disruption – both economic and political – on the horizon. For them, precarity is not just a description of the present, but a lens through which they view the future.
THE UPSHOT
Since March 2025, the most striking shift in the Abacus Data Precarity Index is the surge in Canadians experiencing high or extreme precarity. Nearly half the country now sits in these categories – a sharp rise in just a few months – showing that anxiety and vulnerability are no longer fleeting pressures but structural realities. The middle ground is eroding, with fewer Canadians feeling insulated from disruption and more being pulled to the precarious extremes.
While everyday conversations remain focused on the micro-level pressures – affordability, housing, healthcare access – many Canadians are less aware of the macro-level risks that could reshape the country in even more disruptive ways. Issues like the aging population and its strain on healthcare, the unresolved question of Quebec’s place in Confederation, and the durability of Canada’s relationship with the United States remain largely in the background of public attention. Yet as these larger structural risks become clearer, they could amplify the very sense of vulnerability already gripping households.
The result is a dangerous feedback loop: micro anxieties fuel macro concerns, and macro threats reinforce micro insecurities. Canadians who already feel precarious today are also the most likely to expect major disruptions tomorrow – whether from AI reshaping the workforce, a severe recession, or even the weakening of democratic institutions abroad.
This means Canada may only be at the beginning of a longer arc: a period where extreme precarity expands, where fewer Canadians see stability as achievable, and where social and political polarization hardens. The question is no longer whether Canadians can weather temporary shocks, but whether they believe the systems and institutions underpinning the country are resilient enough to endure the next wave of challenges.
METHODOLOGY
The survey was conducted with 1,686 Canadian adults from July 31 to August 7, 2025. A random sample of panelists were invited to complete the survey from a set of partner panels based on the Lucid exchange platform. These partners are typically double opt-in survey panels, blended to manage out potential skews in the data from a single source.
The margin of error for a comparable probability-based random sample of the same size is +/- 2.39%, 19 times out of 20.
The data were weighted according to census data to ensure that the sample matched Canada’s population according to age, gender, educational attainment, and region.
This survey was paid for by Abacus Data.
Abacus Data follows the CRIC Public Opinion Research Standards and Disclosure Requirements that can be found here: https://canadianresearchinsightscouncil.ca/standards/ck on schedule. It’s whether people believe their government acted fairly, reluctantly, and transparently when faced with a hard choice.
ABOUT ABACUS DATA
We are Canada’s most sought-after, influential, and impactful polling and market research firm. We are hired by many of North America’s most respected and influential brands and organizations.
We use the latest technology, sound science, and deep experience to generate top-flight research-based advice to our clients. We offer global research capacity with a strong focus on customer service, attention to detail, and exceptional value.
And we are growing throughout all parts of Canada and the United States and have capacity for new clients who want high quality research insights with enlightened hospitality.
Our record speaks for itself: we were one of the most accurate pollsters conducting research during the 2025 Canadian election following up on our outstanding record in the 2021, 2019, 2015, and 2011 federal elections.
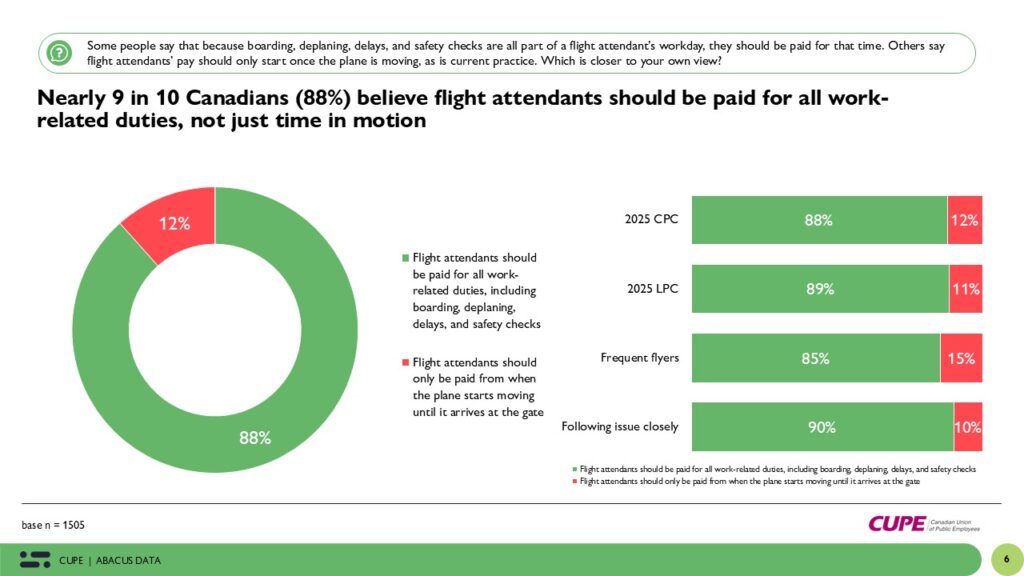
The strike at Air Canada is now a test of how governments deal with unpopular decisions in real time. Our polling shows most Canadians side with the flight attendants, agree they should be paid for all aspects of their workday, and oppose Ottawa forcing them back. That reaction makes sense. People are already stretched thin by the cost of living, housing pressures, and job insecurity. In that environment, a government decision that looks like it weakens workers’ leverage is always going to be a tough sell.
This strike highlights more than just a labour dispute. It shows the limits of trust, the way our fragmented information ecosystem makes communication harder, and how expectations have shifted from the Trudeau years to the Carney government. It also reminds us why research is essential, not just to know what people think, but to understand why they react the way they do.
1. Communicating unpopular decisions
When a government steps in during a strike, the instinct is to lean on the legal authority it has, on economic arguments, or on safety concerns. But Canadians don’t start there. They start by asking: who is losing out? Right now, that’s workers who already feel precarious and travellers whose plans are disrupted.
The best way to explain an unpopular decision is to start with that reality: acknowledge the harm, be upfront about the alternatives that were tried, and be clear about why this step is necessary now and at this very moment. People want to see fairness. They want to believe government understands the trade-offs, not just the economics. Competence matters, but empathy matters too.
2. A fragmented information ecosystem
Another big challenge is the way information spreads today. Travellers are hearing about cancelled flights from airline apps and alerts. Workers and their supporters are trading news through union networks and creator commentary. Many Canadians are catching the story through TikTok, Instagram, or YouTube clips (1 in 4 Canadians under 30 say their primary news source is TikTok).
That fragmentation makes it harder for government to set the narrative. By the time Ottawa issues a press release or holds a press conference, people have already seen their feeds fill with first takes. This is true of this case more than others.
The solution is to treat every announcement as a set of smaller conversations. Different audiences need different explanations, and they live on different platforms. Visuals, timelines, and straightforward explanations travel better than legal jargon or talking points.
3. The limits of trust
In our research, trust is built on four things: openness, fairness, responsibility, and results. Right now, all four are being tested.
Governments often fall back on competence: “We’ve got this under control.” But that isn’t enough. Competence without fairness sounds indifferent. People want to see limits on government power, independent oversight, or commitments to fix the underlying issue. Those signals show government isn’t just acting efficiently, but also fairly.
Canadians don’t expect to agree with every decision. They just want their leaders to show their work and prove the process was even-handed and well thought-out.
4. Trudeau vs. Carney: new expectations
The political context matters. By the end, Justin Trudeau’s government was defined by fatigue. People doubted its ability to deliver. Mark Carney came in promising stability, reassurance, and competence.
Voters don’t see a straight line from Trudeau to Carney.
That changes how Canadians judge his government. When the brand promise is “I’ll make you feel secure,” decisions that feel heavy-handed toward workers cut against the grain. Canadians want order, but they want order in the service of certainty and fairness, not at the expense of it.
This is the risk Carney faces now. The benefits of intervention may seem to have been quick, but are actually abstract. The costs became immediate and visible (on-going labour conflict). The decision feels like a break from the very promise that helped him win.
5. Why research matters
Polling is giving us the headline numbers: sympathy for flight attendants, opposition to intervention.
But we need to go deeper and game out scenarios before decisions are made. Rapid research, like we did for CUPE, helps make better decisions.
We need to know things like:
What’s the threshold at which Canadians accept government intervention?
Which safeguards make a decision feel fairer?
Which messengers—regulators, arbitrators, experts—help shift opinion?
Who gets the credit or blame if the strike ends?
And how do messages travel differently on TikTok versus LinkedIn or traditional news?
This isn’t just curiosity. It’s how governments, unions, and businesses can anticipate where public patience will run out and how to explain decisions before it does.
The upshot
Unpopular decisions can be explained, but only if government starts with the harm, not the justification.
Fragmentation makes first impressions stick. Communication has to meet people where they are.
Trust isn’t limitless. Competence without fairness won’t cut it.
Expectations have shifted. Carney is judged against his promise of reassurance and no-drama.
Research is essential. We need to keep mapping how people process these disputes.
The strike is still unfolding, and Canadians are watching closely. The real question isn’t just whether flights get back on schedule. It’s whether people believe their government acted fairly, reluctantly, and transparently when faced with a hard choice.
ABOUT ABACUS DATA
We are Canada’s most sought-after, influential, and impactful polling and market research firm. We are hired by many of North America’s most respected and influential brands and organizations.
We use the latest technology, sound science, and deep experience to generate top-flight research-based advice to our clients. We offer global research capacity with a strong focus on customer service, attention to detail, and exceptional value.
And we are growing throughout all parts of Canada and the United States and have capacity for new clients who want high quality research insights with enlightened hospitality.
Our record speaks for itself: we were one of the most accurate pollsters conducting research during the 2025 Canadian election following up on our outstanding record in the 2021, 2019, 2015, and 2011 federal elections.