8 in 10 Canadians Think It’s Important for Canada to Invest in Zero-Emission Ports
As the International Maritime Organizations’ 15th meeting of the Intersessional Working Group on Reduction of GHG emissions from Ships approaches, a new poll conducted by Abacus Data for Oceans North reveals broad support among Canadians to invest in zero-emission ports, marine vessels, and trade routes as more than 3 in 4 report high concern about climate change. The sample size was 1,750 adult Canadians and the survey was conducted from May 25 to 29, 2023.
Here are the key findings:
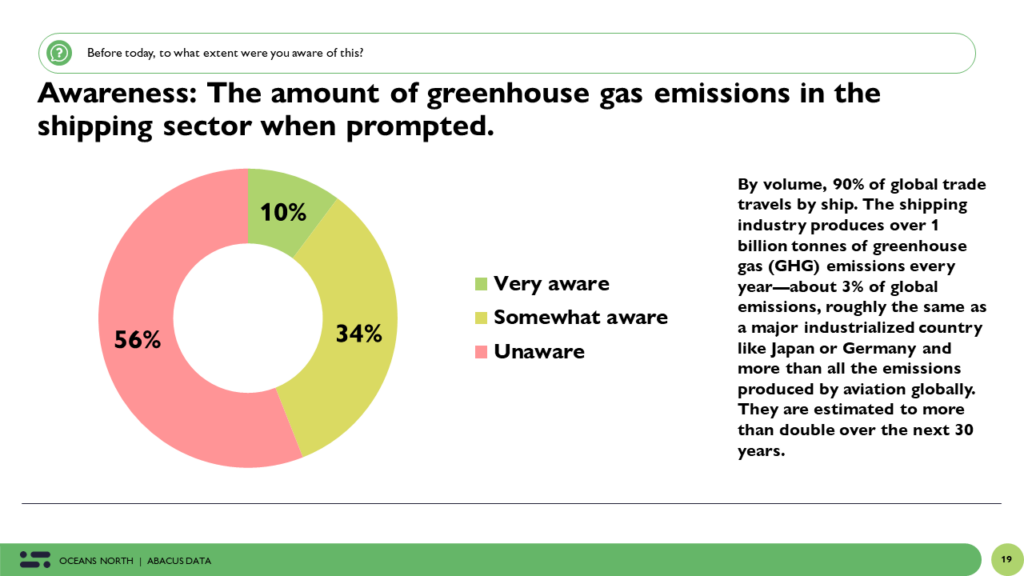
- More than half of Canadians are unaware that the marine shipping sector produces 3% of global emissions, roughly the same as major economies like Germany or Japan and more than all the emissions produced by aviation.
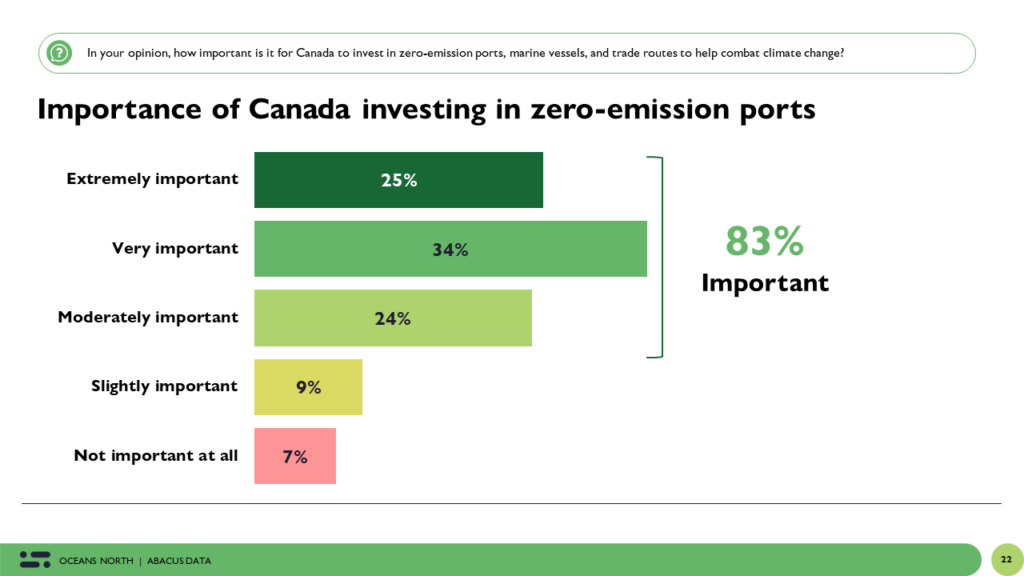
- 83% of Canadians believe it is important for Canada to invest in zero-emission ports, marine vessels, and trade routes. This view is fairly consistent across the country but Quebecers are especially focused on this issue, with 72% saying investing in zero-emission ports is extremely or very important.
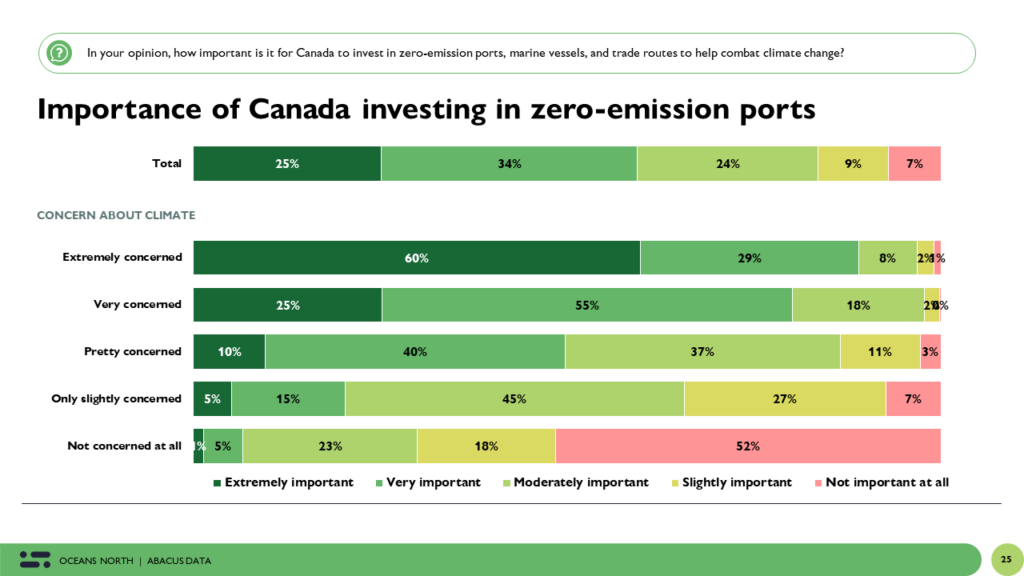
- There is a strong relationship between concern about climate change and views on decarbonizing the maritime shipping sector. As one’s concern intensifies, so too does their view on how important it is for Canada to invest in zero-emission ports.
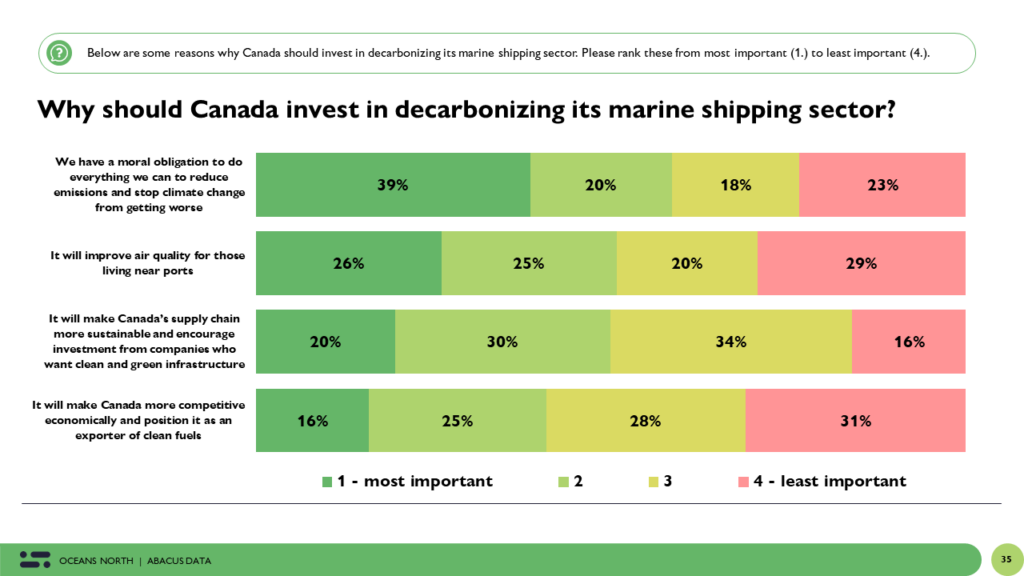
- Why should Canada invest in decarbonizing its marine shipping sector? Canadians prioritize different reasons but the top two are because we have a moral obligation to do everything we can to reduce emissions and stop climate change from getting worse and because it will improve air quality.
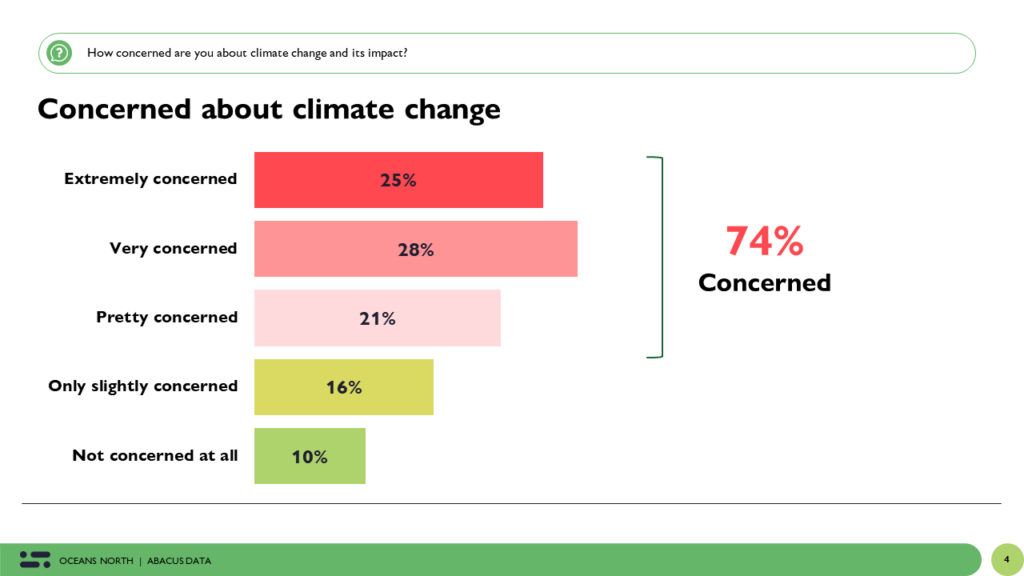
- Why the broad support for decarbonizing Canada’s maritime shipping sector? Because 3 in 4 Canadians are concerned about climate change, with 53% saying they are very or extremely concerned. Concern is fairly consistent across the country but its higher in Quebec, Ontario, and BC than in the Prairies.
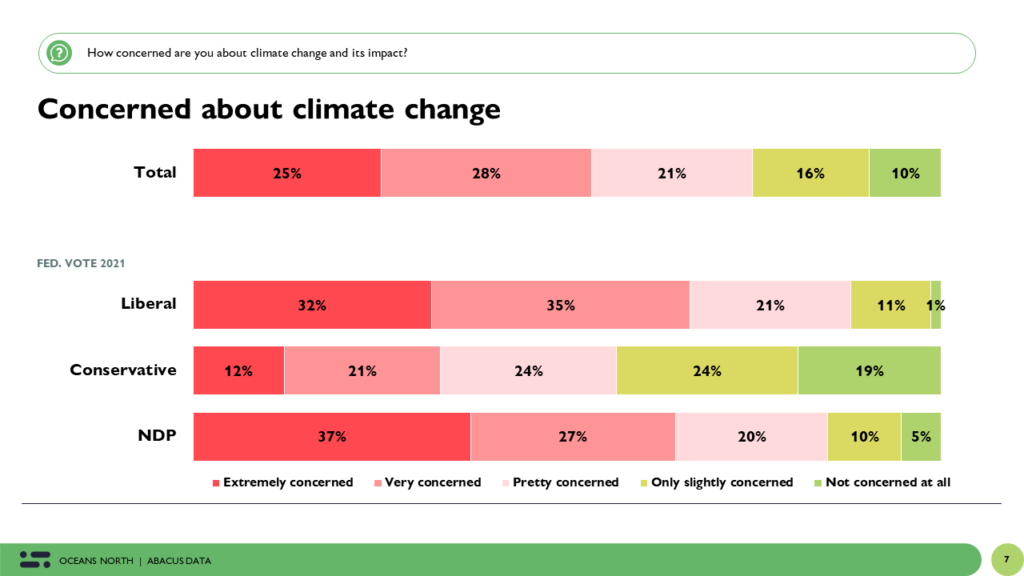
- There’s a political divide on climate concern. Liberal and NDP voters are more likely to be concerned than Conservative voters. Nevertheless, 1 in 3 Conservatives say they are very or extremely concerned about climate change.
THE UPSHOT
As large parts of Canada experience wildfires that have displaced thousands of people from their homes and draped major urban cities under a cloud of smoke, Canadians express deep concern about climate change.
It’s no surprise then that there’s overwhelming support for decarbonizing Canada’s maritime sector. Most are unaware that maritime shipping accounts for 3% of global emissions, as much as global aviation—but despite this, there’s broad cross partisan, cross regional support for action.
The public also recognizes that the benefits of doing this extend beyond solving the existential crisis of climate change. It will also improve air quality around major ports while also positioning Canada as a global leader in sustainable marine shipping and help transition the domestic and global maritime sector to a zero-emission future.
This survey also clearly highlights that as concern about climate change intensifies, so too will demand for quick and meaningful policy action to transition all parts of the economy to a zero-emission, sustainable footing.
METHODOLOGY
The survey, commissioned by Oceans North, was conducted online with 1,750 Canadians aged 18 and over from May 25 to 29, 2023.
A random sample of panelists were invited to complete the survey from a set of partner panels based on the Lucid exchange platform. These partners are typically double opt-in survey panels, blended to manage out potential skews in the data from a single source.
The margin of error for a comparable probability-based random sample of the same size is +/- 2.2%, 19 times out of 20.
The data were weighted according to census data to ensure that the sample matched Canada’s population according to age, gender, educational attainment, and region. Totals may not add up to 100 due to rounding.
OCEANS NORTH
Oceans North is a charitable organization that supports marine conservation and climate action in partnership with Indigenous and coastal communities. As part of a holistic strategy to protect the ocean, Oceans North is working to decarbonize maritime emissions that are contributing to climate change and adversely impacting communities and the environment. For more information, contact Alex Tesar at atesar@oceansnorth.ca or visit https://www.oceansnorth.org/en/what-we-do/the-zero-emission-maritime-energy-transition/.
ABOUT ABACUS DATA
We are the only research and strategy firm that helps organizations respond to the disruptive risks and opportunities in a world where demographics and technology are changing more quickly than ever.
We are an innovative, fast-growing public opinion and marketing research consultancy. We use the latest technology, sound science, and deep experience to generate top-flight research-based advice to our clients. We offer global research capacity with a strong focus on customer service, attention to detail, and exceptional value.
We were one of the most accurate pollsters conducting research during the 2021 Canadian election following up on our outstanding record in 2019.
Contact us with any questions.
Find out more about how we can help your organization by downloading our corporate profile and service offering.