Abacus Data Poll: Conservatives lead by 19 over the Liberals as party leader and government approval ratings hold steady.
From July 16 to 22, 2024 Abacus Data conducted a national survey of 2,000 Canadian adults exploring several topics related to Canadian politics and current events as part of our regular national omnibus surveys. This survey was conducted before the Bank of Canada announced an interest rate cut Wednesday morning.
In this edition, we ask Canadians our core tracking questions.
It is worth noting, that about a year ago, our July 2023 poll, conducted before the federal cabinet shuffle, showed the Conservatives opening up a much wider lead over the Liberals. At the time, the Bank of Canada had hiked its interest rates. A year later, the Liberals trail by almost 20 points and have trailed by around this margin for most of that period.
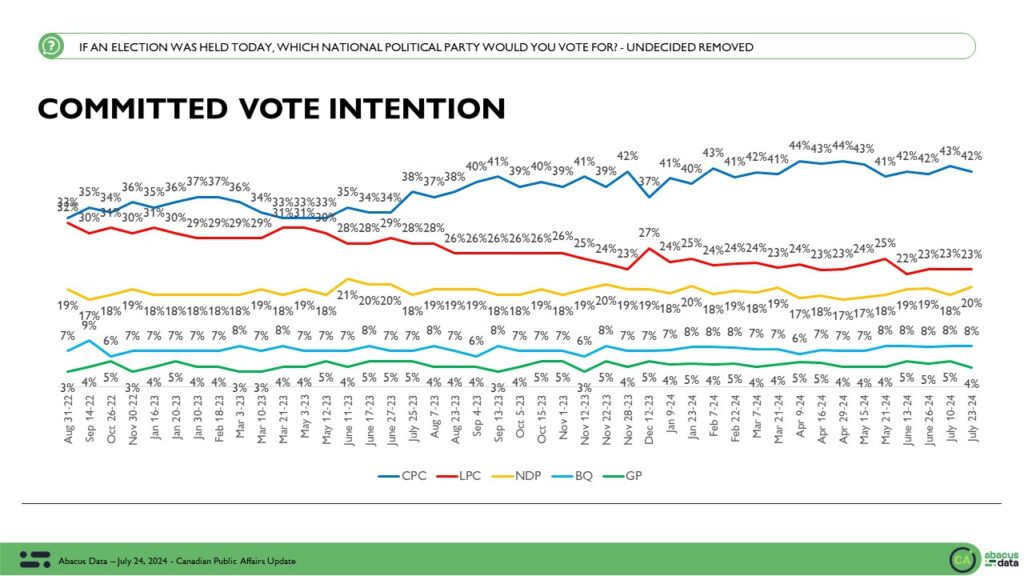
Vote Intention: Conservatives continue ahead, lead Liberals by 19
For the sixth survey in a row, the gap between the Conservatives and the Liberals remains consistent.
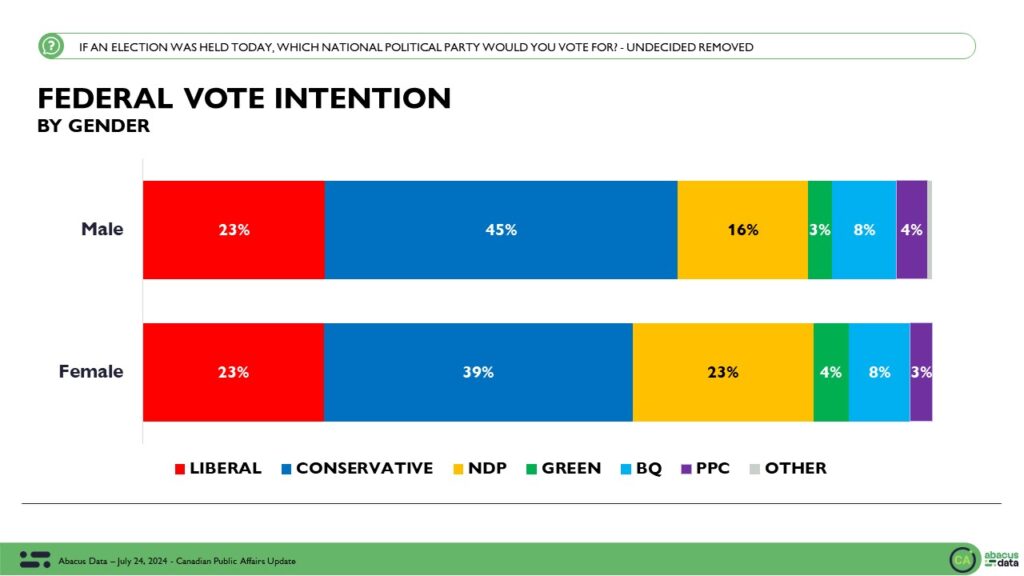
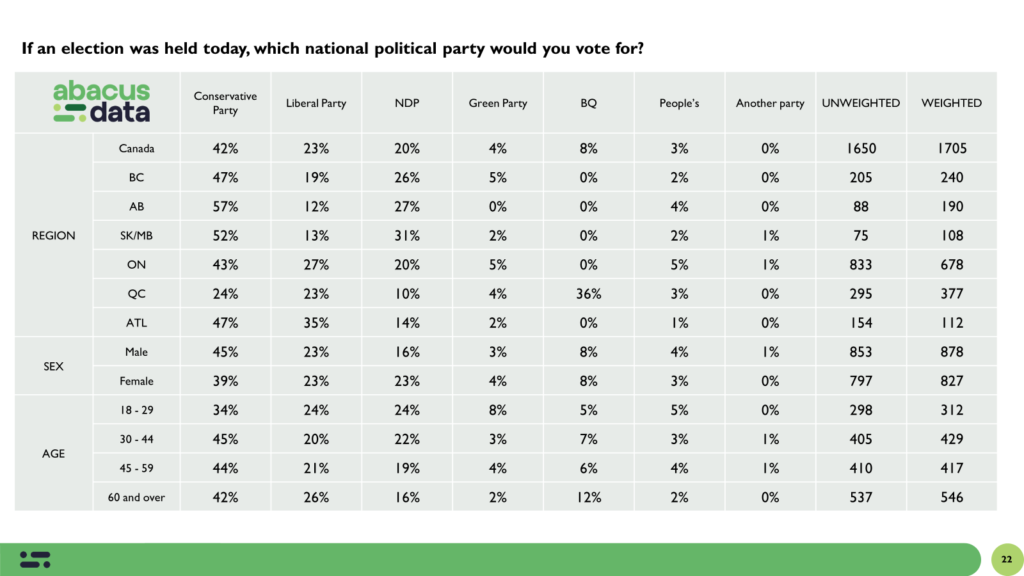
If an election were held today, 42% of committed voters would vote Conservative, while 23% would vote for the Liberals, 20% for the NDP, and 4% for the Greens. The BQ continues to hold 38% in Quebec.
Every party’s vote share is consistent with our last survey, with very minor changes, as the Conservatives are down 1 and the NDP are up 2, and all within the margin of error.
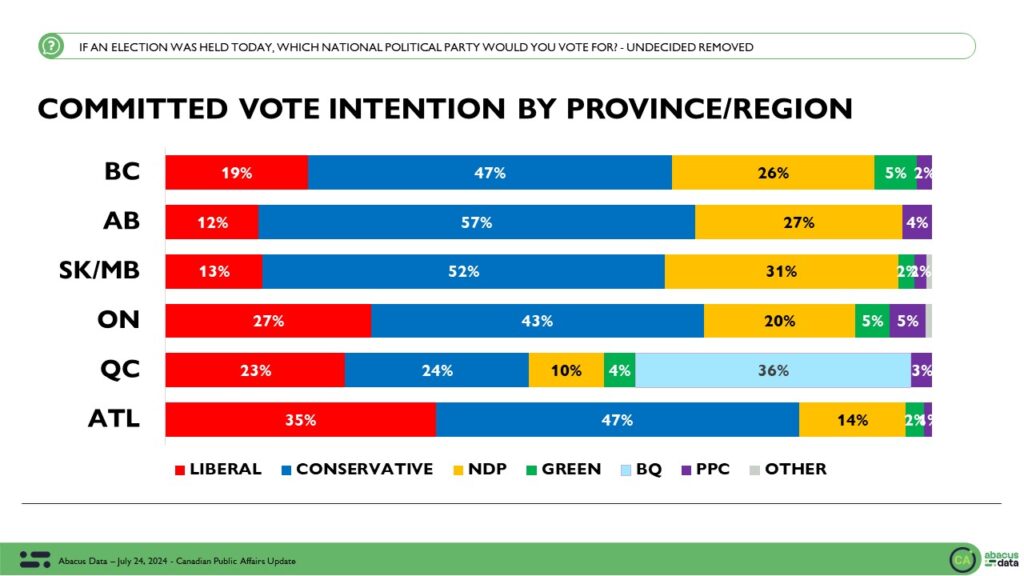
Regionally, the Conservatives are also well ahead in every region apart from Quebec.
From our last survey, the Conservatives’ lead over the Liberals in BC, Ontario and SK/MB continues to hold steady. In Alberta support for the NDP increased 5 points (a Nenshi bounce?) from our last survey, but Conservatives remain ahead by 30 points.
In Quebec, the BQ is ahead of both the Conservatives and Liberals who are statistically tied in the province.
Demographically, the Conservatives continue to lead among all groups, as vote intention remains relatively stable. Conservative support remains high at 44% among 45-to-39 (1 point down from our last survey) and 45% among 30-to-44 (2 points up).
Still, there is a small change from our last survey. Conservative support among 18-to-29 is down 3 points (34% vs 37%), as support for the Liberals recovers from the last survey (7 points up) and support for the NDP shrinks slightly (5 points down).
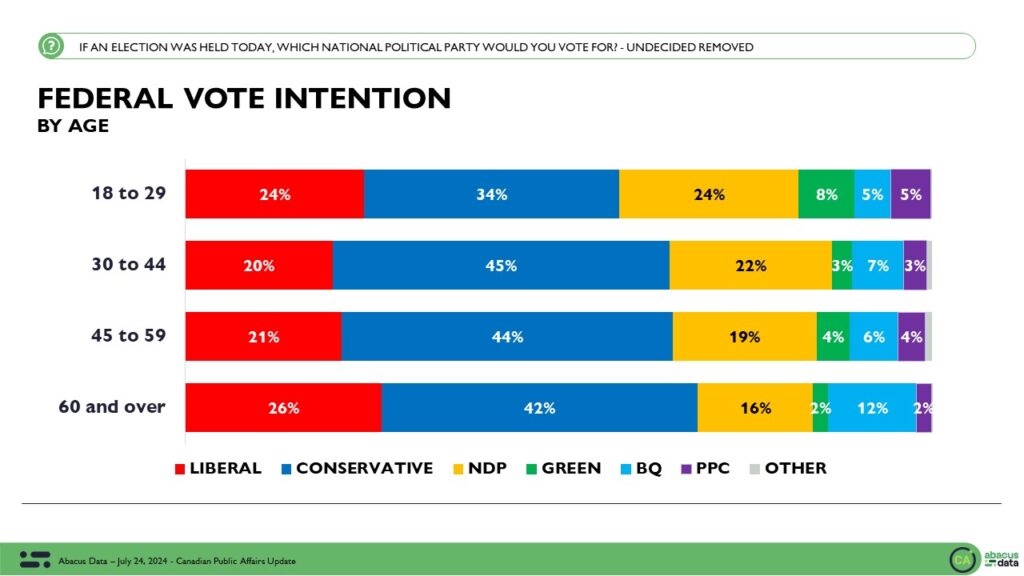
As we have consistently found in recent surveys, there is little difference in vote intention between men and women. The gender gap has grown slightly as Conservative support among women is down 2 points.
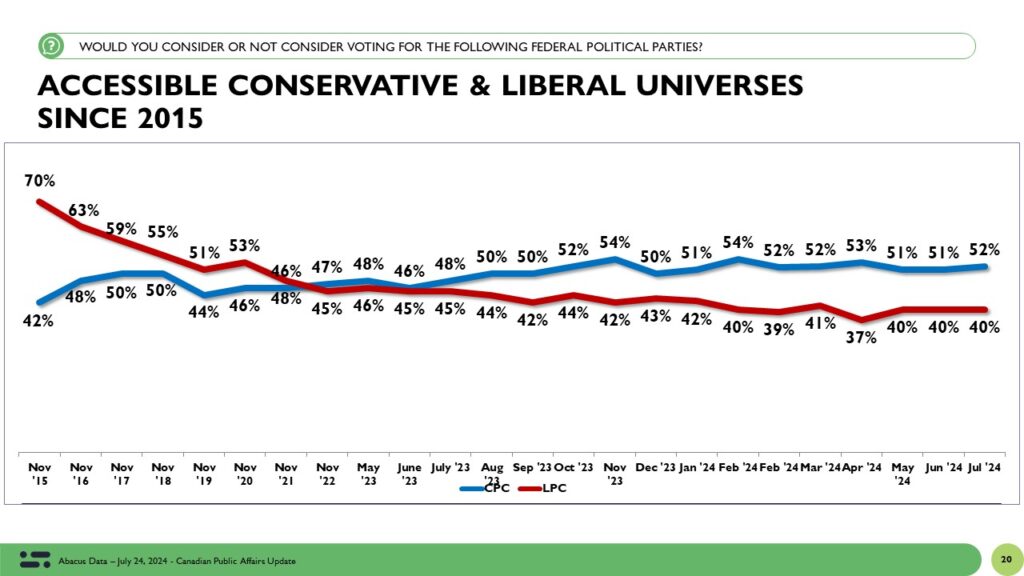
With no shifts in vote intentions, the size of the party’s accessible voter pools remains similarly stable. The Conservative pool is 12-points larger than the Liberal’s.

Desire for change continues, as impressions of political party leaders hold steady.
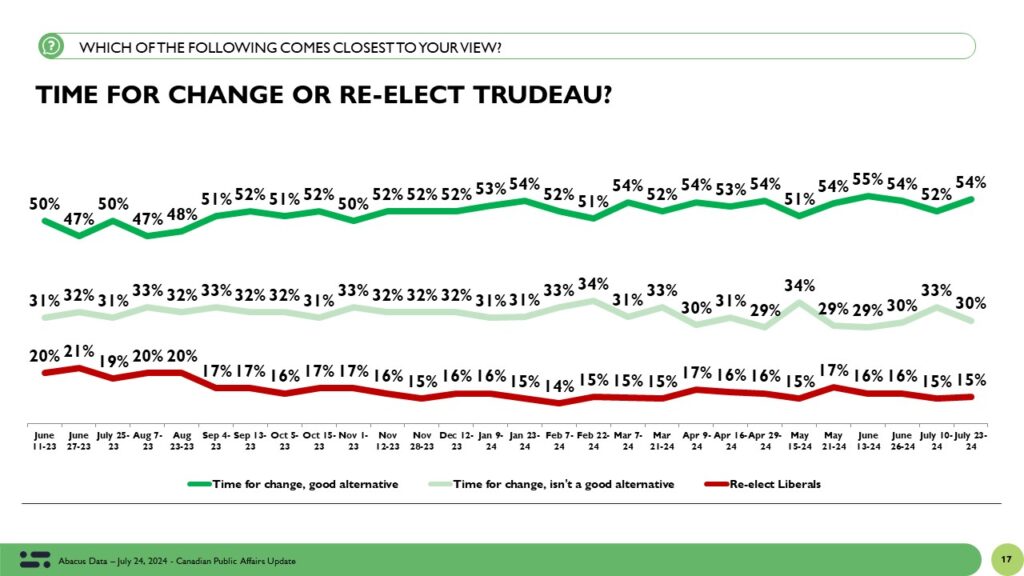
Beyond vote intention, the desire for change remains largely consistent and within the margin of error. 84% want change (down 1 point), with 54% believing there’s a good alternative to the Liberals (up 2 points).
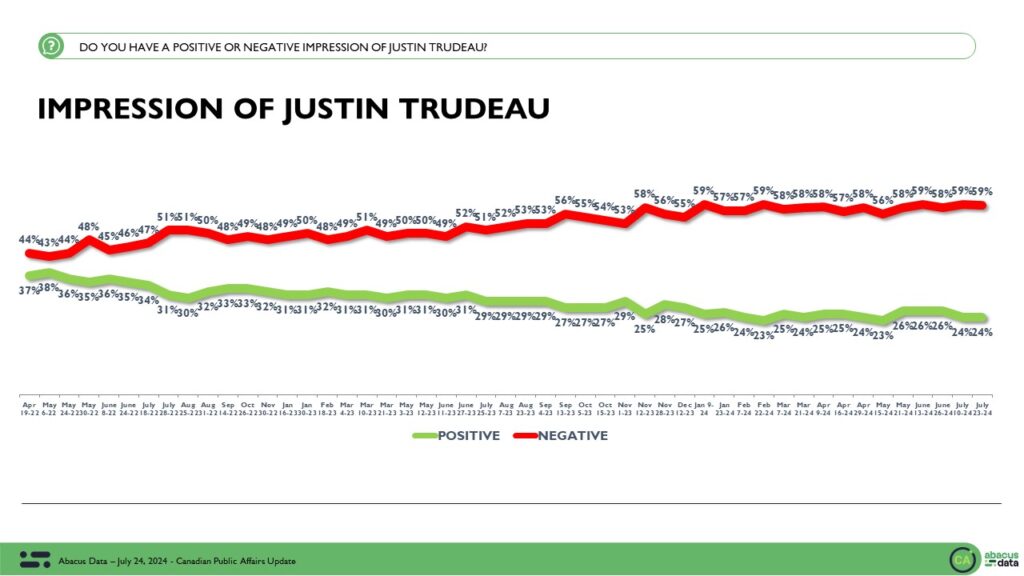
Impressions of Justin Trudeau remain negative and show no changes from our last survey. 59% have a negative impression of the Prime Minister, while 24% have a positive view for a net score of -35.
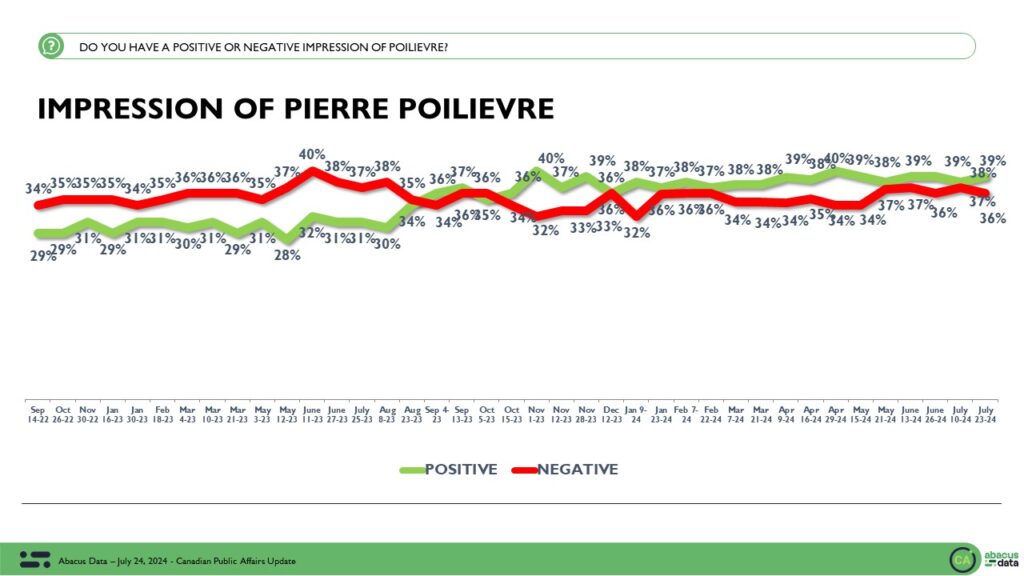
In contrast, impressions of Pierre Poilievre are also steady, although slightly more positive than in our last survey – 39% have a positive impression (1 up from our last survey), while 36% have a negative impression (1 point down) for a net score of +3.
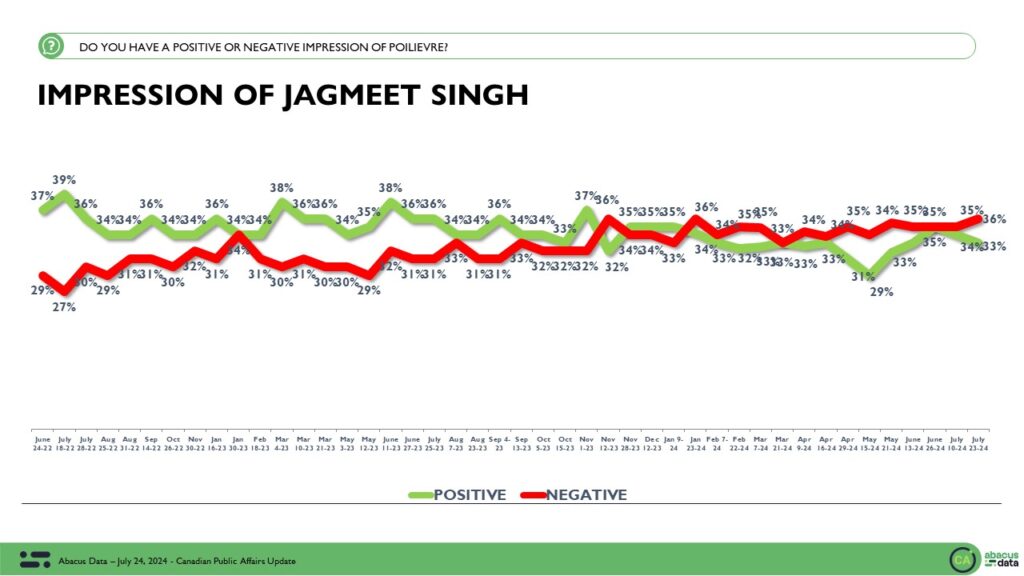
Impressions of NDP Leader Jagmeet Singh are also steady with 33% positive and 36% negative for a net score of -3.
at polling for public affairs and advocacy.
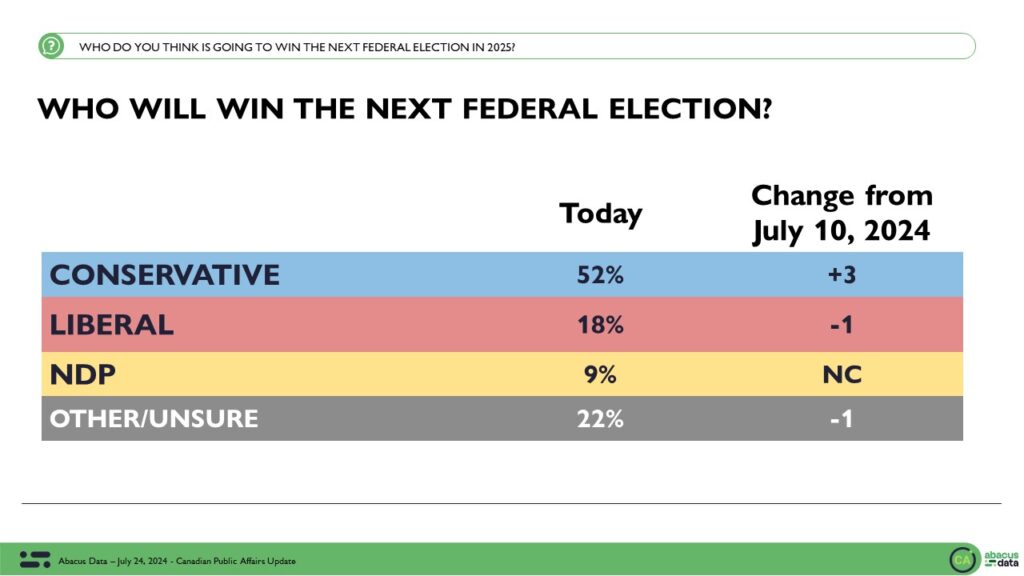
With vote intention stable and impressions negatively consistent for Prime Minister Trudeau, and positive for Mr. Poilievre, a majority of Canadians (52%) believe Conservatives will win the next federal election. Less than 20% believe Liberals can do so. This is a slight increase in expectations of a Conservative victory and the highest we have measured since we started asking the question.
The Upshot
According to Abacus Data CEO David Coletto: “As summer rolls on, political opinions Canada are holding steady with little if any change in vote intentions, impressions of party leaders, or how people feel about the government’s job performance.
This survey was conducted before the Bank of Canada’s announcement to cut interest rates, and so we don’t know whether this second rate cut will have an effect on public sentiment.
About a year ago, after the final interest hike, our survey showed the Conservatives opening up a much wider lead over the Liberals. A year later, the Liberals remain almost 20 points behind, while regionally and demographically, they struggle to re-gain ground – trailing across all age groups and in all regions of the country.
The biggest insight from this poll is the growing number of Canadians who believe the Conservatives will win the next election. 52% of all adults, 55% of those who voted in 2021, and 55% of Liberal switchers (those who voted Liberal in 2021 but today say they wouldn’t vote Liberal or are undecided), think the Conservatives will win the next election when it comes.
Given that impressions of Justin Trudeau are strongly related to vote intentions, we shouldn’t expect the gap between the Liberals and Conservatives to close unless views of the Prime Minister improve.
I’ll be writing more about this relationship over on my data lab newsletter this weekend.
Methodology
The survey was conducted with 2,000 Canadian adults from July 16 to 22, 2024. A random sample of panelists were invited to complete the survey from a set of partner panels based on the Lucid exchange platform. These partners are typically double opt-in survey panels, blended to manage out potential skews in the data from a single source.
The margin of error for a comparable probability-based random sample of the same size is +/- 2.191%, 19 times out of 20.
The data were weighted according to census data to ensure that the sample matched Canada’s population according to age, gender, educational attainment, and region. Totals may not add up to 100 due to rounding.
This survey was paid for by Abacus Data Inc.
Abacus Data follows the CRIC Public Opinion Research Standards and Disclosure Requirements that can be found here: https://canadianresearchinsightscouncil.ca/standards/
ABOUT ABACUS DATA
We are Canada’s most sought-after, influential, and impactful polling and market research firm. We are hired by many of North America’s most respected and influential brands and organizations.
We use the latest technology, sound science, and deep experience to generate top-flight research-based advice to our clients. We offer global research capacity with a strong focus on customer service, attention to detail, and exceptional value.
And we are growing throughout all parts of Canada and the United States and have capacity for new clients who want high quality research insights with enlightened hospitality.
Our record speaks for itself: we were one of the most accurate pollsters conducting research during the 2021 Canadian election following up on our outstanding record in the 2019, 2015, and 2011 federal elections.
Contact us with any questions.
Find out more about how we can help your organization by downloading our corporate profile and service offering.