On behalf of the Paramedic Association of Canada, Abacus Data conducted an extensive online nationwide survey of Canadians’ views of healthcare and the role of paramedics. This is the second release from that survey. The sample size was 3,150 adult Canadians and the survey was conducted from April 24 to 28, 2023.
Background
Cariboo-Prince George Conservative MP Todd Doherty introduced Bill C-321, a private member’s bill that seeks tougher penalties for people who attack first responders. If passed, the bill would modify the Criminal Code of Canada, introducing an amendment that considers assaults targeting health-care workers and first responders as an aggravating factor in sentencing. Consequently, this provision has the potential to extend the duration of incarceration for offenders.
In our national survey, we asked Canadians their views on the issue and whether they support amending the Criminal Code. Here’s what we found:
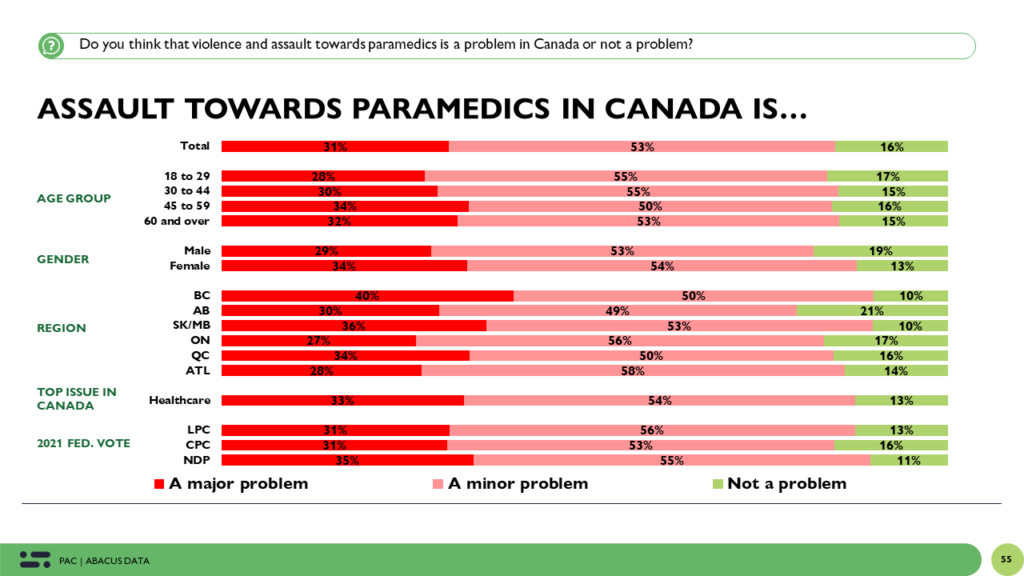
Eight in ten Canadians believe violence towards paramedics is a problem in Canada
Overall, 84% of Canadian adults believe that violence towards paramedics is a problem in Canada, including 31% who believe it is a major problem. This view is consistent across the country, across demographics, and is shared by Liberal, Conservative, and NDP voters.
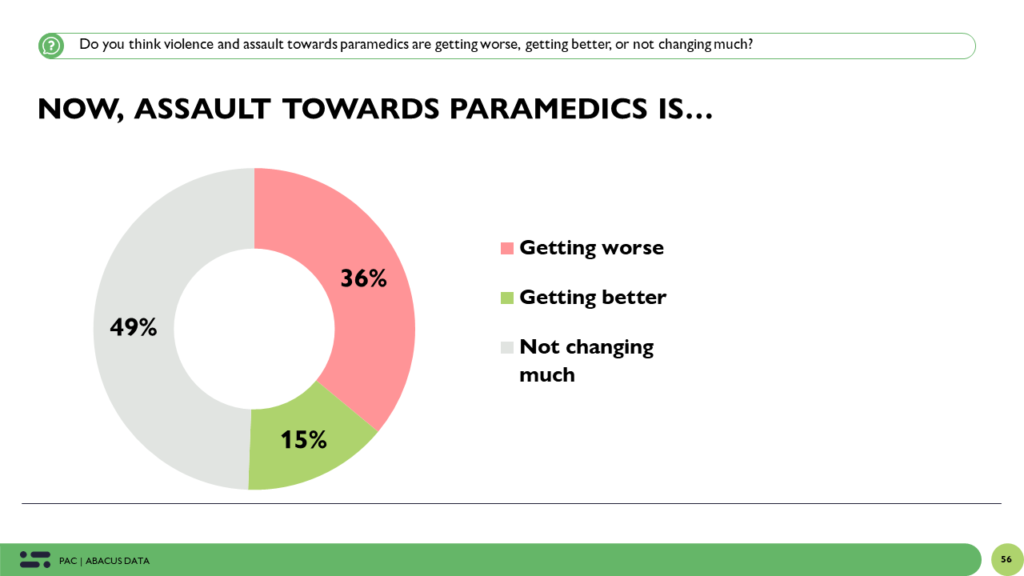
Moreover, by a 2 to 1 margin, Canadians are more likely to believe assault towards paramedics is getting worse than getting better. In total, 36% believe violence against paramedics is getting worse, 15% think it is getting better, and 49% think it is not changing much.
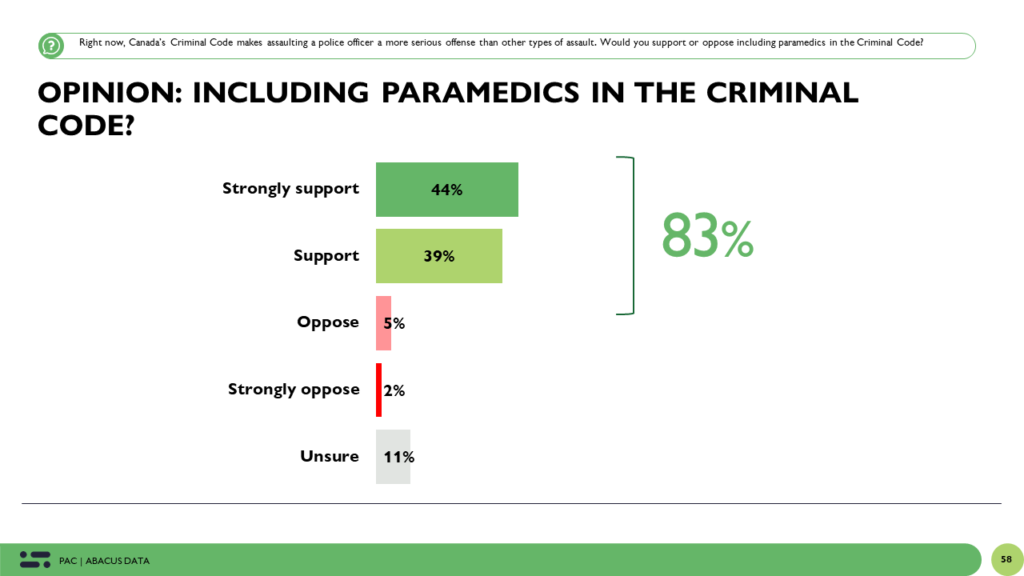
83% support changing the Criminal Code of Canada to include violence and assault against paramedics a more serious offence.
There is widespread support for changing Canada’s Criminal Code to make violence against paramedics a more serious office. 44% strongly support this move while 39% support it. Only 7% are opposed.
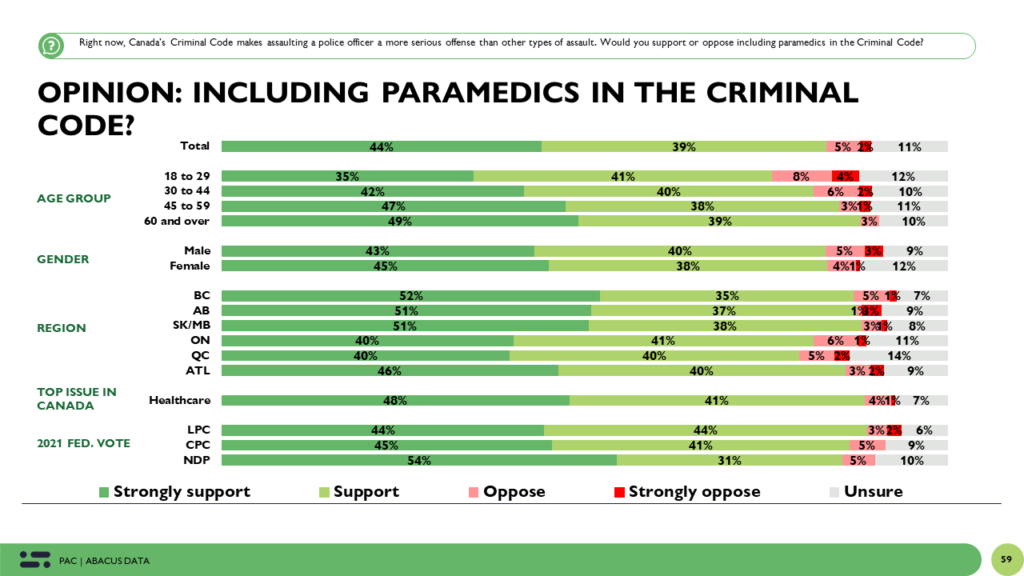
Support for amending the Criminal Code to make violence against paramedics a more serious office is consistent across the country, across demographic groups and is supported by close to 90% of Liberal, Conservative, and NDP supporters.
At the same time, there is also a widespread belief that violence against paramedics is a problem and there’s widespread, cross-partisan support for Parliament to amend the Criminal Code to make assaulting a paramedic a more serious offence. There is almost no resistance to the idea.
METHODOLOGY
The survey, commissioned by the Paramedic Association of Canada, was conducted online with 3,150 Canadians aged 18 and over from April 24 to 28, 2023.
A random sample of panelists were invited to complete the survey from a set of partner panels based on the Lucid exchange platform. These partners are typically double opt-in survey panels, blended to manage out potential skews in the data from a single source.
The margin of error for a comparable probability-based random sample of the same size is +/- 1.8%, 19 times out of 20.
The data were weighted according to census data to ensure that the sample matched Alberta’s population according to age, gender, educational attainment, and region. Totals may not add up to 100 due to rounding.
PARAMEDIC ASSOCIATION OF CANADA
The Paramedic Association of Canada is a voluntary professional organization of paramedicine practitioners in Canada. Its missions is to provide quality care for the public through leadership in the advancement of the profession of paramedicine. For more information, contact Pierre Poirier at pierre.poirier@paramedic.ca, or visit their website at http://www.paramedic.ca/
ABOUT ABACUS DATA
We are the only research and strategy firm that helps organizations respond to the disruptive risks and opportunities in a world where demographics and technology are changing more quickly than ever.
We are an innovative, fast-growing public opinion and marketing research consultancy. We use the latest technology, sound science, and deep experience to generate top-flight research-based advice to our clients. We offer global research capacity with a strong focus on customer service, attention to detail, and exceptional value.
We were one of the most accurate pollsters conducting research during the 2021 Canadian election following up on our outstanding record in 2019.
An Abacus Data survey done after the Liberals’ decision to pause the carbon tax on home heating oil shows Pierre Poilievre’s Conservatives 13 points ahead of the Liberals nationally. Abacus Data CEO David Coletto says the new numbers have ‘not been this bad’ when compared with data over the past eight years with the Liberals in office.
Residents in Windsor-Essex are anxious about their ability to obtain housing, with 66 per cent saying the availability of housing is either poor or terrible, a survey by Abacus Data suggests.
As a recent Abacus Data poll showed, 43 per cent of respondents think Conservative Leader Pierre Poilievre is better at managing the economy, with just 28 per cent saying the same about Trudeau. And Poilievre’s steadfast refusal to talk about anything other than the economy reflects what the Toronto Star’s Susan Delacourt describes as “the core belief among his inner circle that the next election will be fought and won on the economy and little else.”
David Coletto, chair and CEO of Abacus Data, joins CPAC’s Michael Serapio to discuss the latest federal polling numbers and Canadians’ satisfaction with Prime Minister Justin Trudeau.
From October 27 to November 1, 2023, Abacus Data conducted a national survey of 2,220 adults exploring several topics related to Canadian politics and current events as part of our regular national omnibus surveys. This survey was conducted entirely after the carbon tax announcement on Thursday afternoon.
In this report, we share new data on:
Federal vote intentions with a deeper look at the possible road back for the Liberals.
Party leader impressions with a deep dive on why more than half of Canadians have a negative view of Justin Trudeau.
Which party Canadians think will win the next election.
Federal Vote Intention
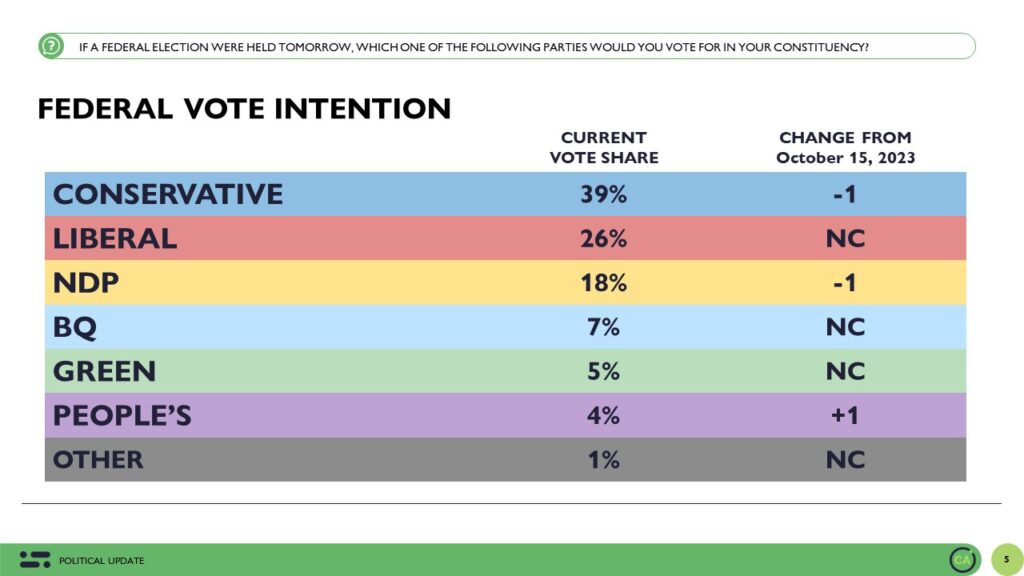
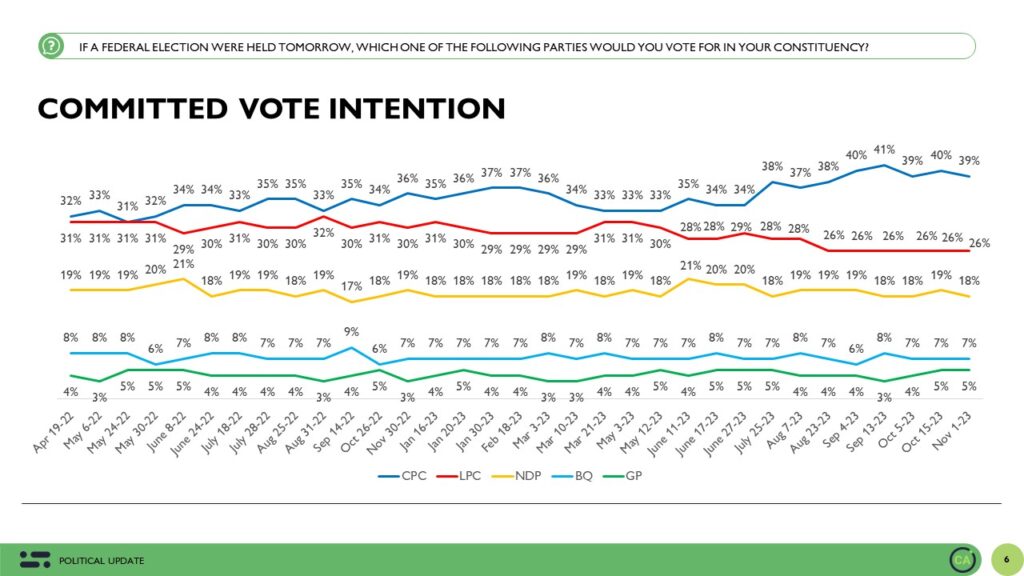
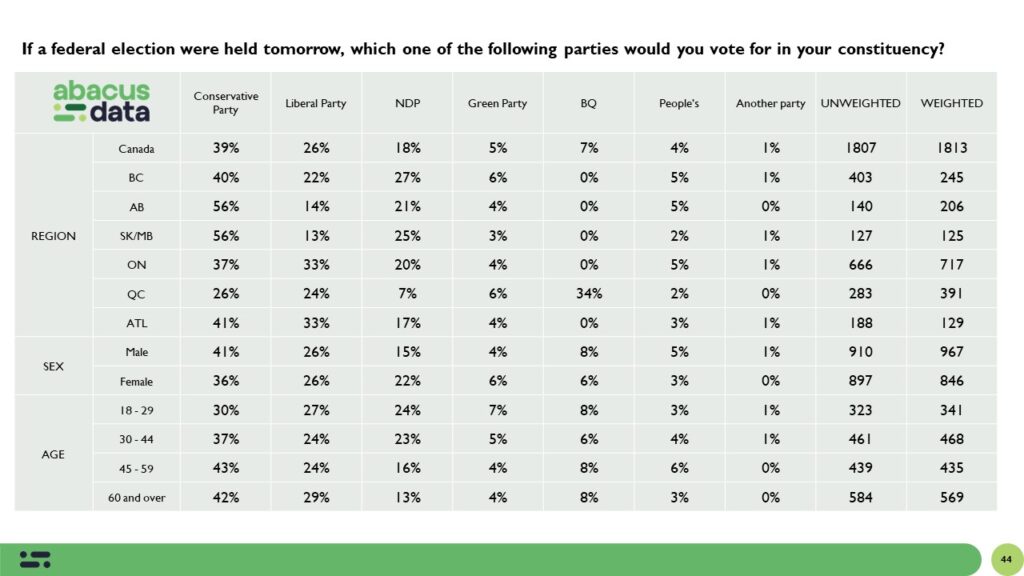
If an election were held today, 39% of committed voters would vote Conservatives with the Liberals at 26%, the NDP at 18% and the Greens at 5%. The BQ is at 34% in Quebec.
Since our last survey, we see almost no change with the Conservatives and NDP down 1 and the Liberals holding steady at 26%. In fact, since the end of July, vote intentions have changed very little and it appears we have entered a new normal where the Conservatives consistently lead by double digits.
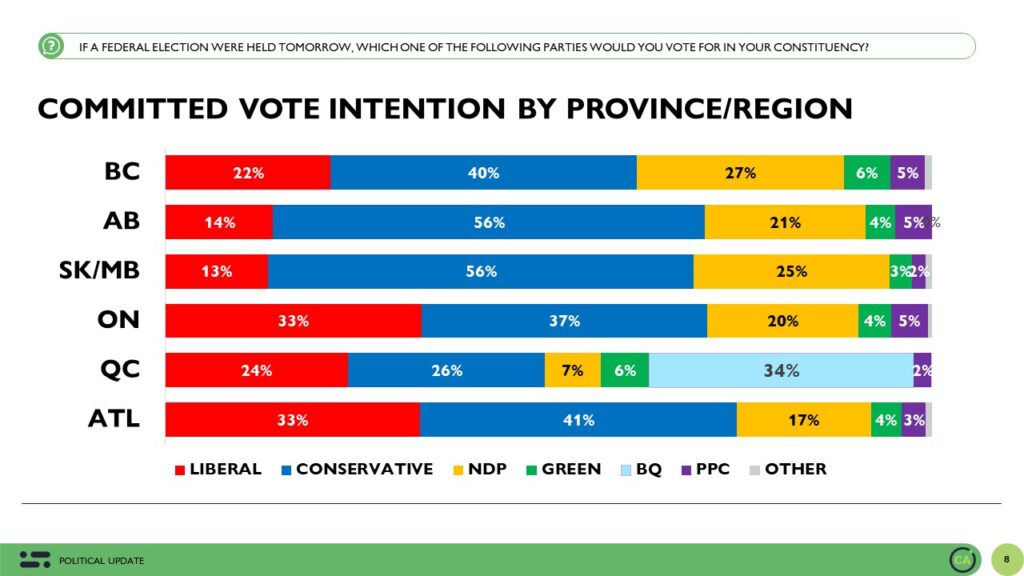
Regionally, the Conservatives are well ahead in western Canada, including in BC. The Conservatives lead by 8 in Atlantic Canada. In Quebec, we find the BQ ahead by 8 with the Conservatives and Liberals statistically tied. This is the first time we have measured the Conservatives numerically ahead of the Liberals in Quebec. Before concluding this is a real shift, we need to see more data but if it is happening, this is a notable change in vote intentions in Quebec.
The only regional brightspot for the Liberals is Ontario, where we have the Liberals trailing by only 4, smaller than it has been in recent surveys.
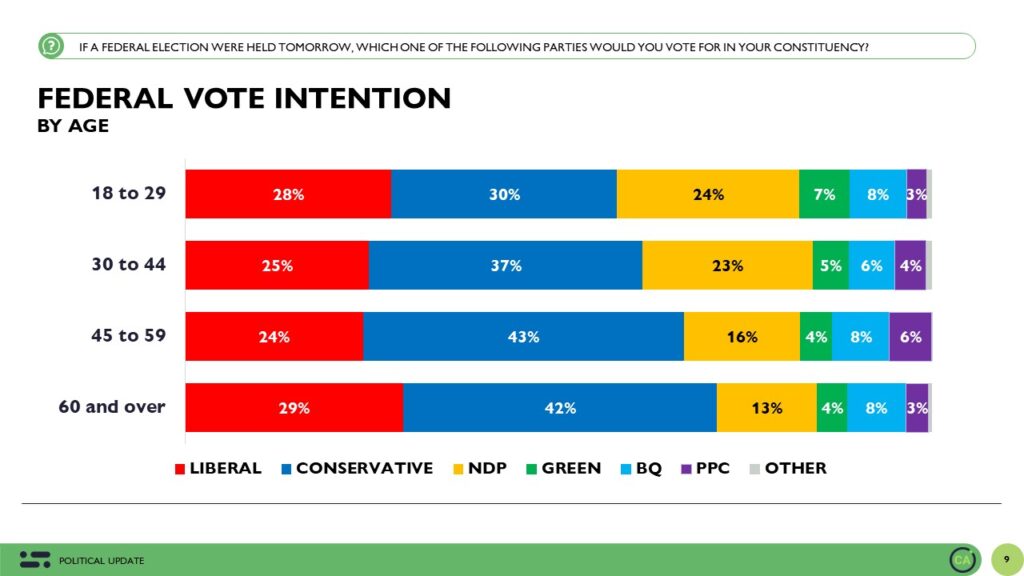
Demographically, the Conservatives lead across all age groups. They lead by 2 among 18 to 29 year olds, 12 among 30 to 44 year olds, 9 among 45 to 59 year olds and 13 among those aged 60 and over.
Is there a road back for the Liberals?
In this survey, we asked some new questions to try and gauge whether the Liberals could stage a comeback.
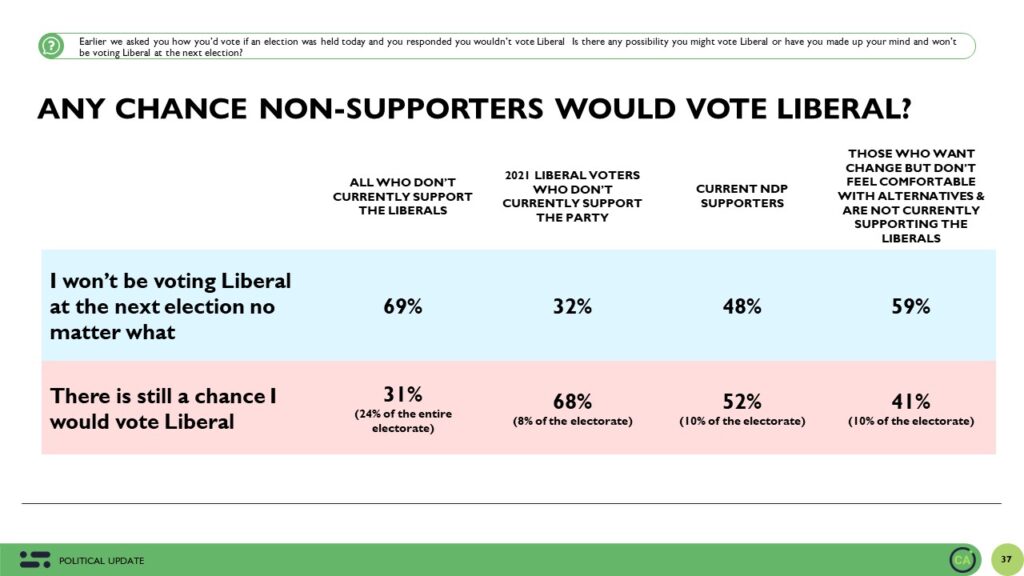
First, among those who don’t currently support the Liberals (78% of the electorate), 31% say that there is still a chance they would vote Liberal (representing 24% of the entire electorate). Many of these people either voted Liberal in 2021, currently support the NDP, or are undecided. Among 2021 Liberal voters who don’t currently support the party (8% of the electorate), 2 in 3 say there is still a chance they would vote Liberal.
Among those who say there is still a chance they could vote Liberal, 34% are currently supporting the NDP, 21% support the Conservatives, 8% support the BQ and the rest are split between the Greens, People’s Party and other parties. More than 1 in 4 say they are undecided.
What might entice them to vote Liberal?
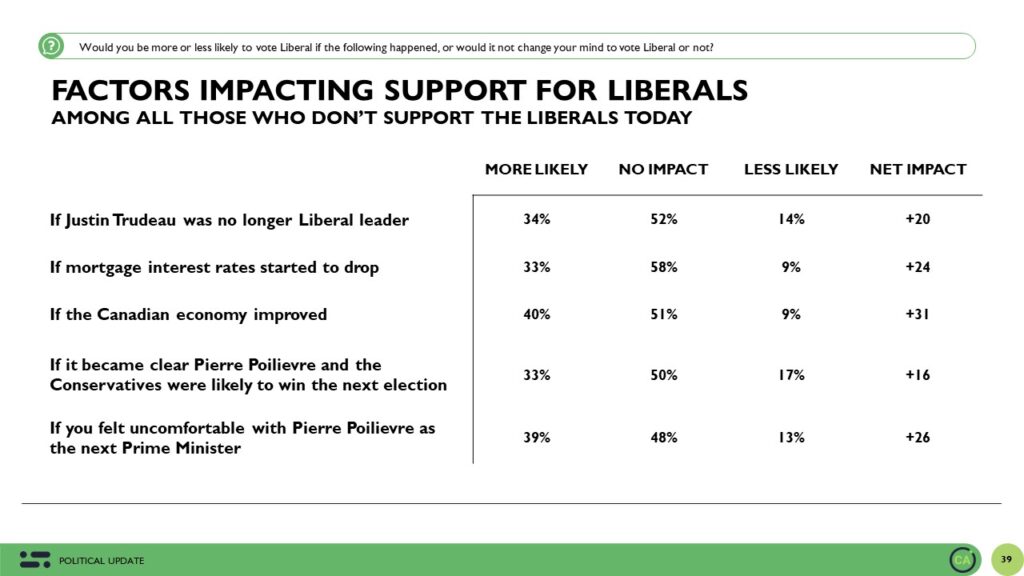
We asked those who don’t currently support the Liberals whether some outcomes or factors would make them more or less likely to support the Liberals.
1 in 3 say they are more likely to vote Liberal if Justin Trudeau was no longer Liberal leader
1 in 3 say they would be more likely to vote Liberal if mortgage interests started to drop
40% say they would be more likely to vote Liberal if the economy improved
About 1 in 3 said they would be more likely to vote Liberal if it became clear Pierre Poilievre and the Conservatives were likely to win the next election or if they felt uncomfortable with Pierre Poilievre as Prime Minister.
All five outcomes offer the Liberals some hope that they could rebuild their winning coalition, but there’s no clear silver bullet, including the Prime Minister stepping down as leader before the next election. It’s likely a combination of these will need to happen to overcome the desire for change people are feeling.
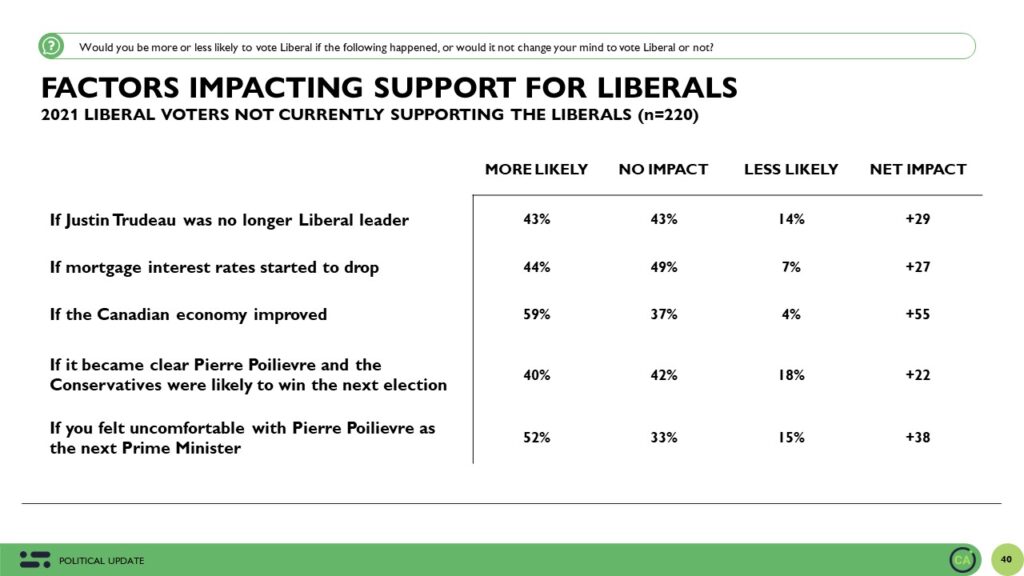
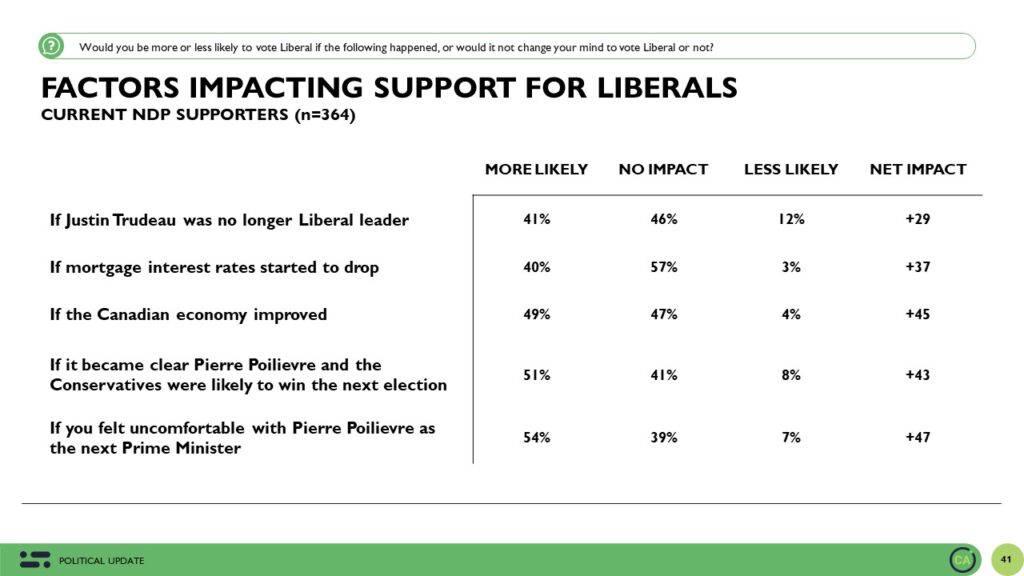
But digging a bit deeper into these numbers gives us a bit better sense of what might need to happen for the Liberals to find a way back into contention.
When we look specifically at two subgroups – those who currently support the NDP and those who voted Liberal in 2021 but don’t currently support the party (aka the switchers), we find that many of these outcomes, especially the prospect of a Conservative government or improving economic conditions might entice many into the Liberal tent. The fact that the prospect of Trudeau stepping down doesn’t have as strong an appeal might suggest that the Liberal brand is so associated with Trudeau that voters cannot look past it.
Party Leader Impressions
As usual, we asked Canadians how they feel about the main political party leaders.
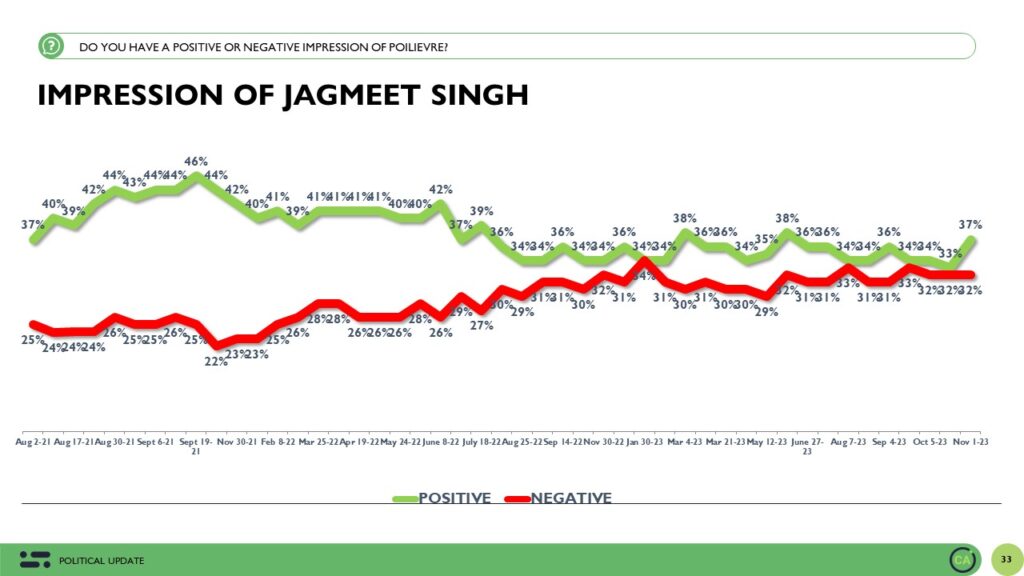
Jagmeet Singh has seen a slight rebound in his positives. Today, 37% say they have a positive impression of him compared with 32% who have a negative view for a net favourable of +5.
Pierre Poilievre has also seen an improvement in his overall image, rising 4 points since last wave and 5 points since mid-September. Today 40% have a positive view of Mr. Poilievre compared with 32% who have a negative view for a net favourable rating of +8. Pierre Poilievre is now the most popular leader in Canada.
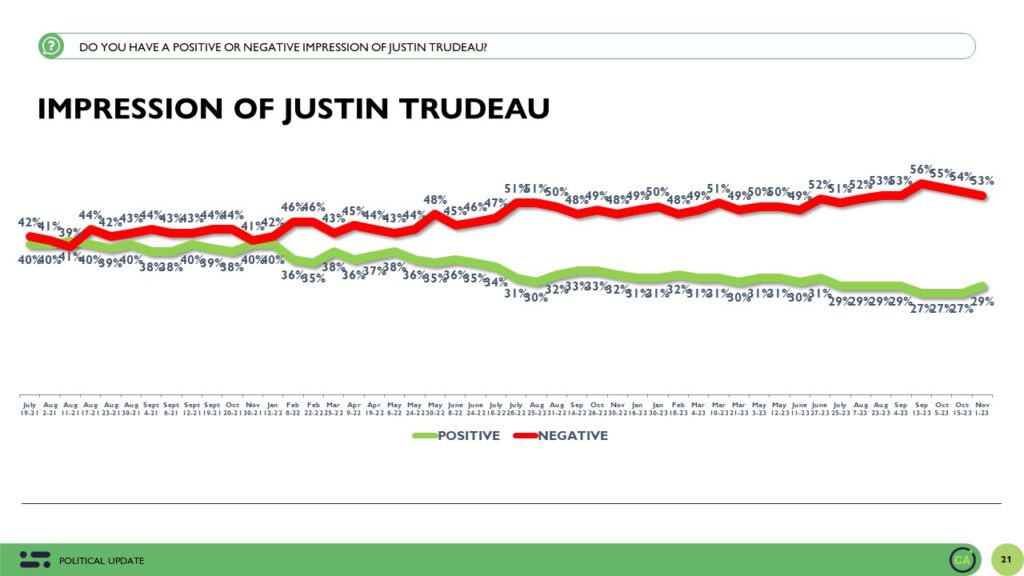
For Prime Minister Trudeau, impressions remain decidedly negative although somewhat less so than a month ago. Today, 29% have a positive view of the Prime Minister compared with 53% who have a negative view for a net favourable impression of -24. The Prime Minister’s negatives are down slightly – from 56% in September to 53% today. Still though, they remain far higher than we saw two years ago around the time the Liberals were re-elected.
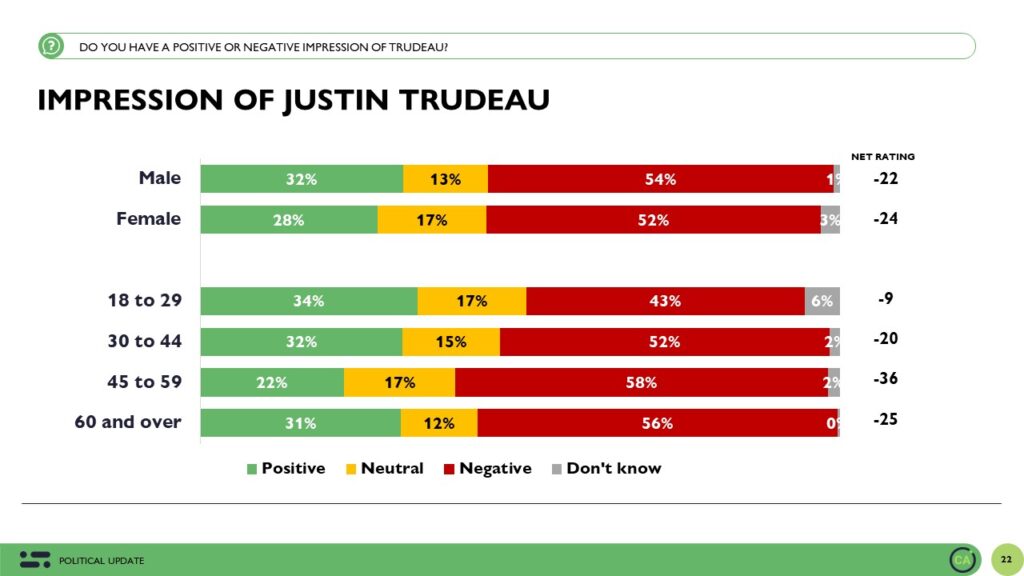
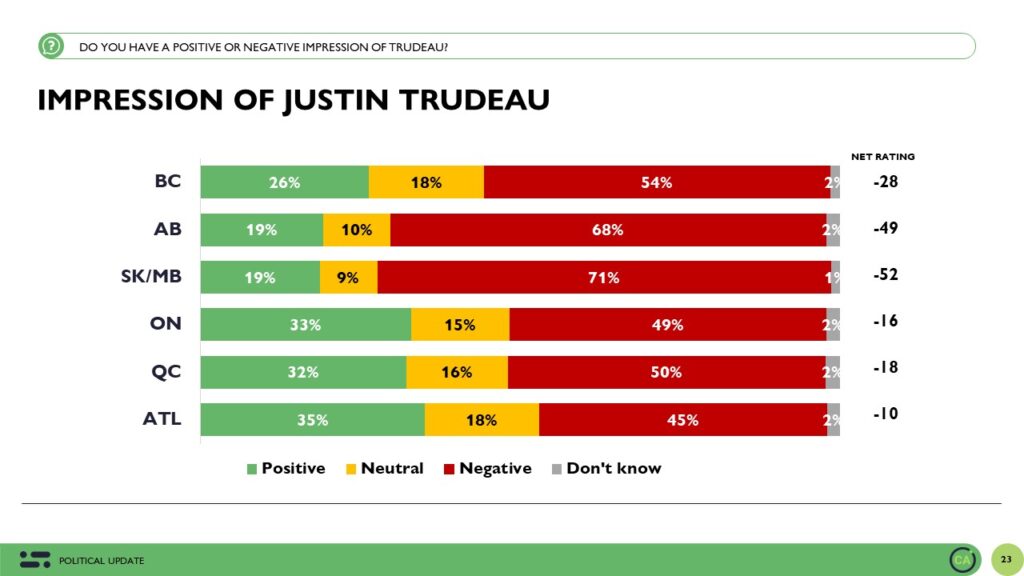
Trudeau’s image is about the same among men and women now and he’s viewed more positively among younger Canadians. Regionally, his net favourable ratings are better in Atlantic Canada, Ontario and Quebec than they are in the West,
Why does one’s impression of Justin Trudeau matter so much? Because it is highly correlated with vote intention.
Among those with a positive impression of Trudeau (29%), 64% are voting Liberal, 18% NDP and 7% Conservative.
Among those with a neutral view of him (15%), 26% are voting Liberal, 22% Conservative with 39% voting NDP.
Among those with a negative view of him (53%), 63% are voting Conservative, 14% NDP, and 3% Liberal.
If you don’t like Justin Trudeau or say you have a negative impression of him, there’s almost no chance right now that you’re voting Liberal. That’s the strength that leadership plays on the Liberal Party’s brand.
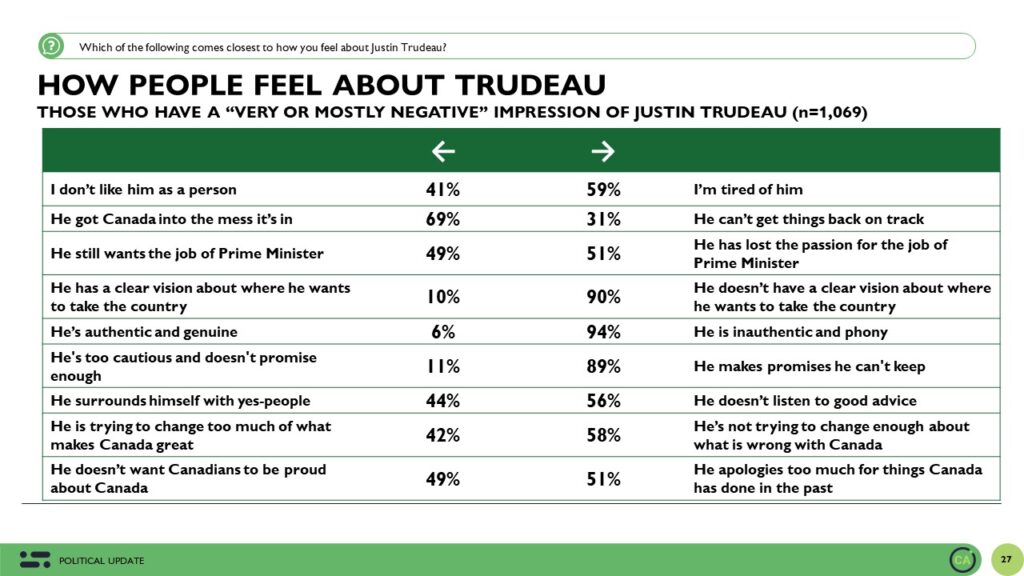
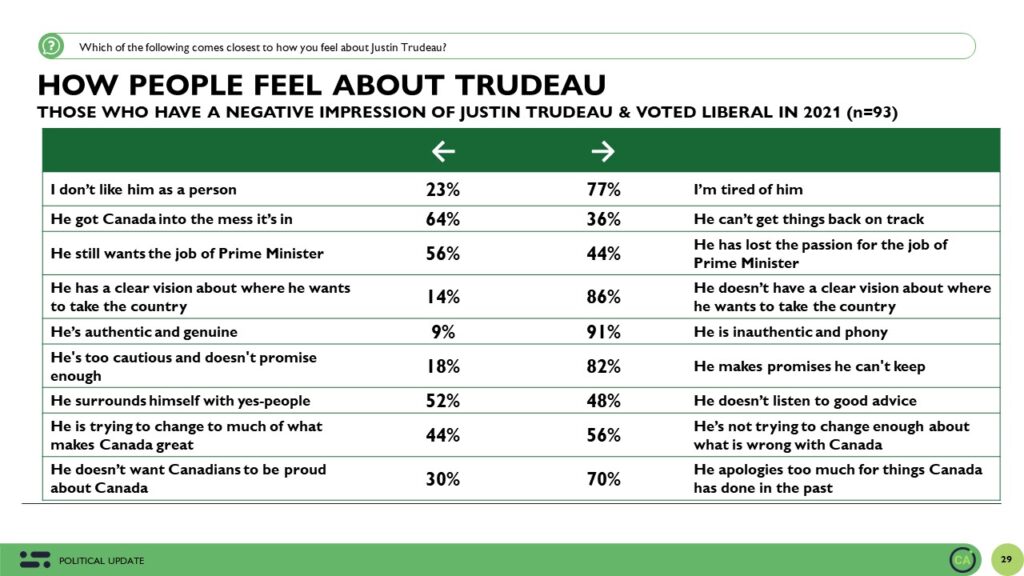
In this survey we also asked only those who said they have a negative impression of the Prime Minister to pick between two descriptors that they feel comes closest to their view. My objective is to try and uncover what it is about the Prime Minister that some don’t like – especially those who voted Liberal in 2021 but today say they don’t like the Prime Minister.
The answers are pretty striking.
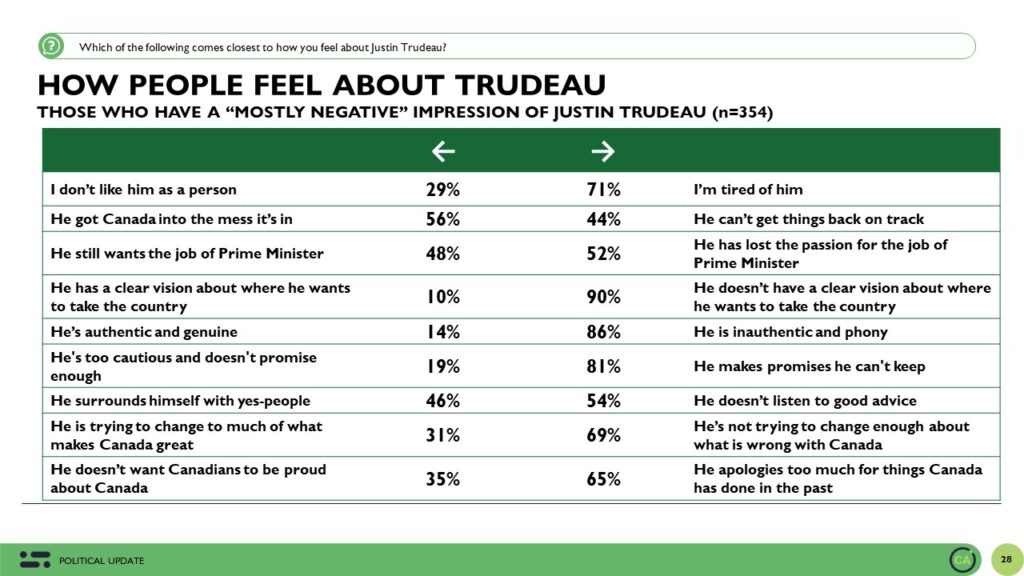
For everyone who has a negative view of Justin Trudeau, almost 6 in 10 say they are tired of him rather than not liking him as a person – in other words, 31% of Canadian adults say they have a negative view of the Prime Minister and one of the reasons they do is because they are tired of him. This is sense of fatigue is especially true of those who have a mostly negative view rather than a very negative view of him.
Digging deeper into those who are tired of Trudeau and have a negtive view of him, 11% of them who voted in 2021 voted for the Liberals. Only 9% think the country is headed in the right direction and only 16% would consider voting Liberal at the moment (69% are open to voting Conservative). If an election was today, 62% of these tired of Trudeau detractors would vote Conservative, 17% NDP, 8% BQ, 6% Green and only 3% Liberal.
Half say they think he has lost the passion for the job rather than still wanting the job of Prime Minister.
More than half think he doesn’t listen to good advice rather than he surrounding himself with yes-people.
And more than half feel he’s not trying to change enough about what is wrong with Canada rather than trying to change too much of what makes Canada great.
But perhaps most instructive, almost all Trudeau detractors agree that he doesn’t have a clear visision about where he wants to take the country, he is inauthentic and phony, and he makes promises he can’t keep.
The perceived lack of vision, authenticity, and ability or willingness to follow through on promises are fundamental to why more than half of Canadians have a negative view of the Prime Minister. Add to the fact that many are simply tired of him means it is unlikely that he himself can do much in the short term to change these views.
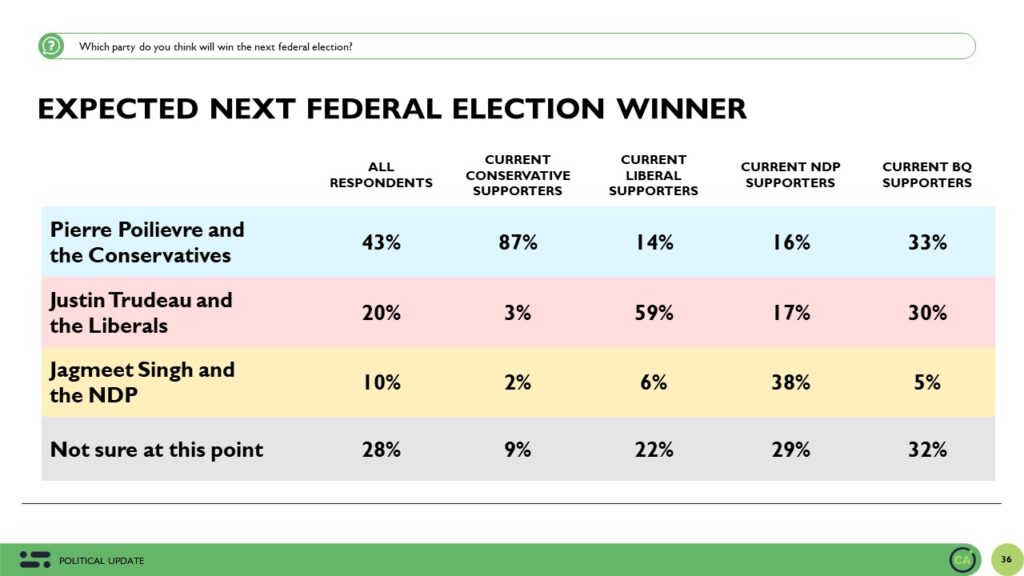
Who will win the next election?
For the first time since the last election, we asked Canadians who they thought would win the next election. By a significant margin, Canadians are far more likely to think the Conservatives will win than the Liberals (43% to 20%). Another 10% think the NDP will win with 28% saying they are undecided.
Among Conservative supporters, almost all (87%) think the Conservatives will win while a majority of Liberal supporters (59%) think the Liberals will win. 14% of Liberal and 16% of NDP supporters think the Conservatives are most likely to win.
The Upshot
According to Abacus Data CEO David Coletto: “These results suggest that the political opinion environment has solidified to some extent. After more than four years of a fairly competitive environment between the Liberals and Conservatives, we have clearly entered a new phase where the Conservatives have and sustain a sizeable lead over the Liberals.
This lead is built on widespread dissatisfaction with the Liberal government, a broad and deep desire for change, and fairly negative impressions of the Prime Minister along with improving impressions of Conservative Party leader Pierre Poilievre.
Most people who support the Conservartives expect them to win but that view isn’t shared yet among Liberal, NDP, or undecided voters. That factor is important in trying to understand how voters might react and behave if that outcome feels more and more likely to them. Will that encourage strategic voting? Will that push Liberals to seek alternative leadership? Will that increase scrutiny on the Conservatives?
The path back for the Liberal is there but it’s incredibly narrow. Once someone has a negative impression of you, it’s very hard to change that view. Once they decide they are tired of you, they are less likely to listen to what you say and may even discount your arguments simply because they have lost interest, respect, or affection. This is where the Liberals and Justin Trudeau find themselves right now.”
Methodology
The survey was conducted with 2,200 Canadian adults from October 27 to November 1, 2023. A random sample of panelists were invited to complete the survey from a set of partner panels based on the Lucid exchange platform. These partners are typically double opt-in survey panels, blended to manage out potential skews in the data from a single source.
The margin of error for a comparable probability-based random sample of the same size is +/- 2.1%, 19 times out of 20.
The data were weighted according to census data to ensure that the sample matched Canada’s population according to age, gender, educational attainment, and region. Totals may not add up to 100 due to rounding.
We are the only research and strategy firm that helps organizations respond to the disruptive risks and opportunities in a world where demographics and technology are changing more quickly than ever.
We are an innovative, fast-growing public opinion and marketing research consultancy. We use the latest technology, sound science, and deep experience to generate top-flight research-based advice to our clients. We offer global research capacity with a strong focus on customer service, attention to detail, and exceptional value.
We were one of the most accurate pollsters conducting research during the 2021 Canadian election following up on our outstanding record in 2019.
In the final segment of our four-part series investigating Canada’s housing crisis, conducted in collaboration with the Canadian Real Estate Association (CREA), we pivot our attention towards evaluating the Canadian public’s perceptions of government performance at all three levels.
These findings, sourced from a survey of 3,500 Canadian adults aged 18 and above, conducted between September 22 and 28, 2023, provide a comprehensive perspective on a crisis that necessitates the collective focus, collaboration, and innovative solutions of government bodies at every tier to ensure that all Canadians can exercise their fundamental right to a secure place they can call home.
Pervasive Housing Market Apprehensions
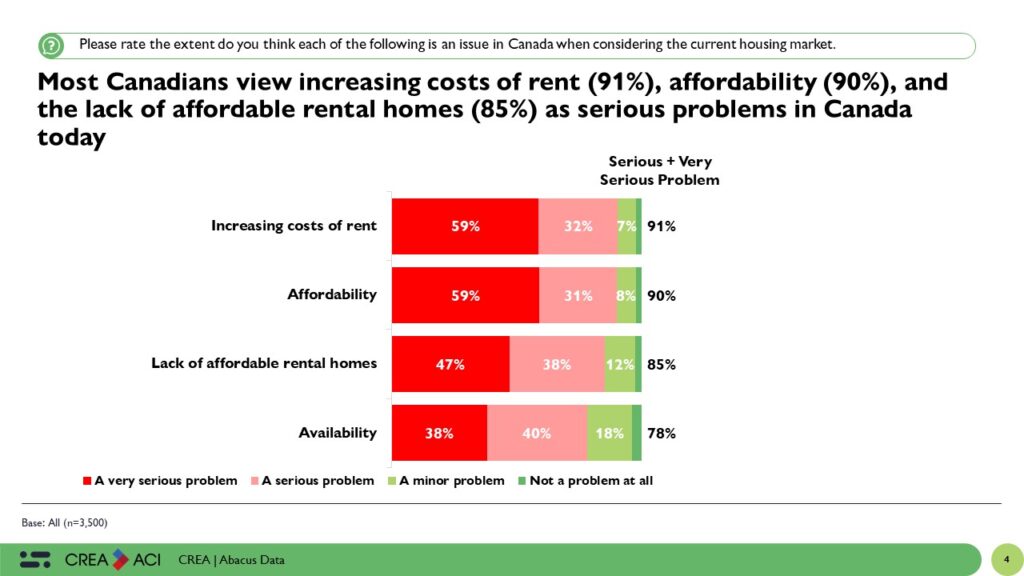
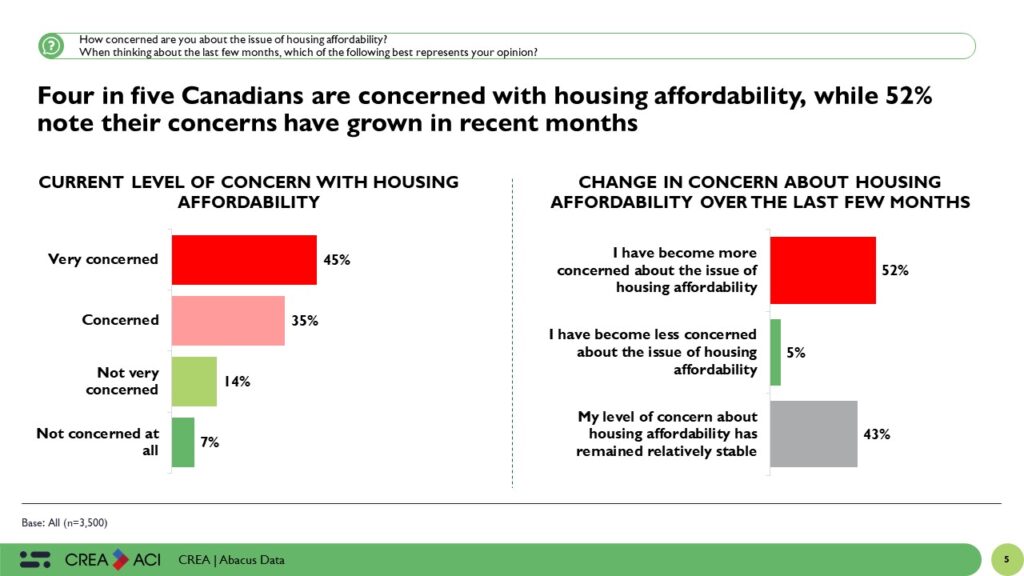
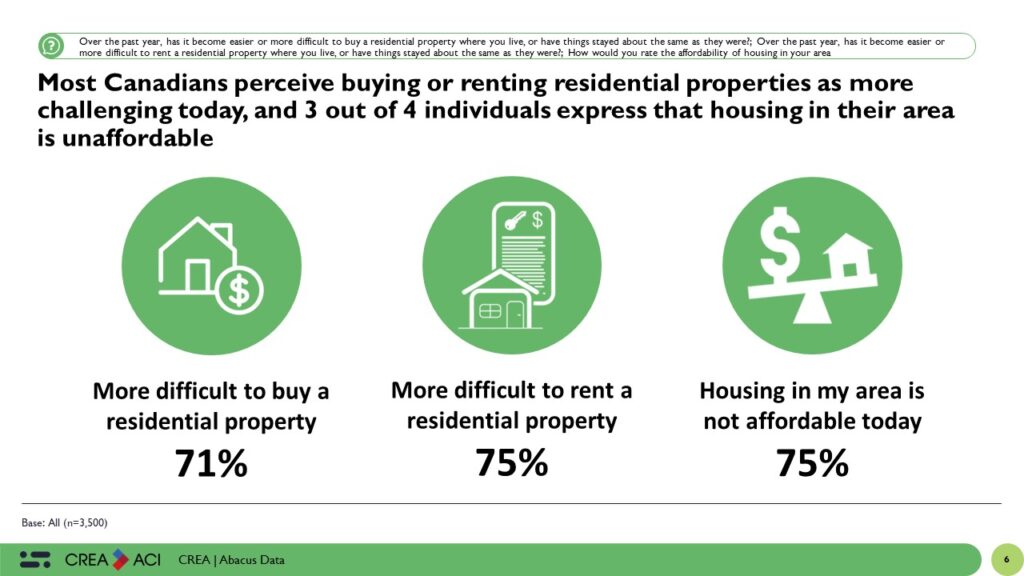
Housing market apprehensions permeate the Canadian landscape, with an overwhelming majority of citizens identifying escalating rent costs (91%), overall affordability challenges (90%), and the scarcity of affordable rental options (85%) as significant issues impacting Canadians today. Notably, 4 in 5 Canadians express overwhelming concerns regarding the affordability of housing in Canada. This collective unease is further underscored by the fact that half of the population has witnessed their concerns about housing affordability intensify in recent months (52%). These concerns are compounded by the prevailing perception that both buying (71%) and renting (75%) residential properties in Canada have become notably more difficult in recent months. Overall, results reveal that a striking 75% of Canadians firmly believe that housing, in its current state, is simply unaffordable.
Government Response and Public Perception: Bridging the Gap: Aligning Government Priorities with Public Expectations
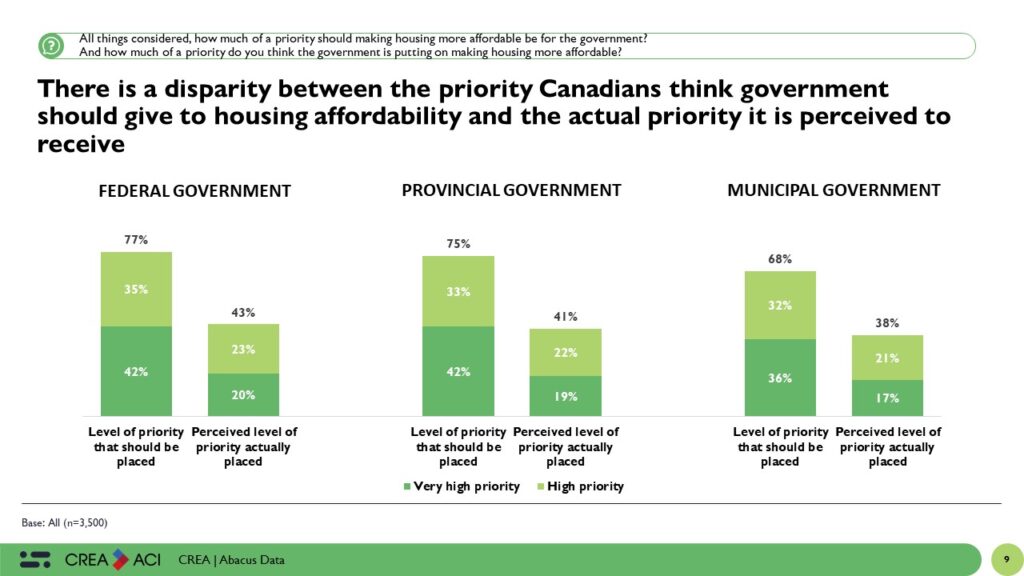
A stark divergence between the government’s perceived priorities and the expectations of Canadians has come to the forefront. The findings reveal that most Canadians believe that housing affordability should be a top priority for federal (77%), provincial (75%), and municipal (68%) governments, while fewer perceive these issues as current priorities (57% for federal, 59% for provincial, and 38% for municipal). This glaring disparity underscores the imperative for better synchronizing public expectations with government actions to effectively combat the housing crisis.
Scrutiny on Government Competence: A Three-Level Assessment
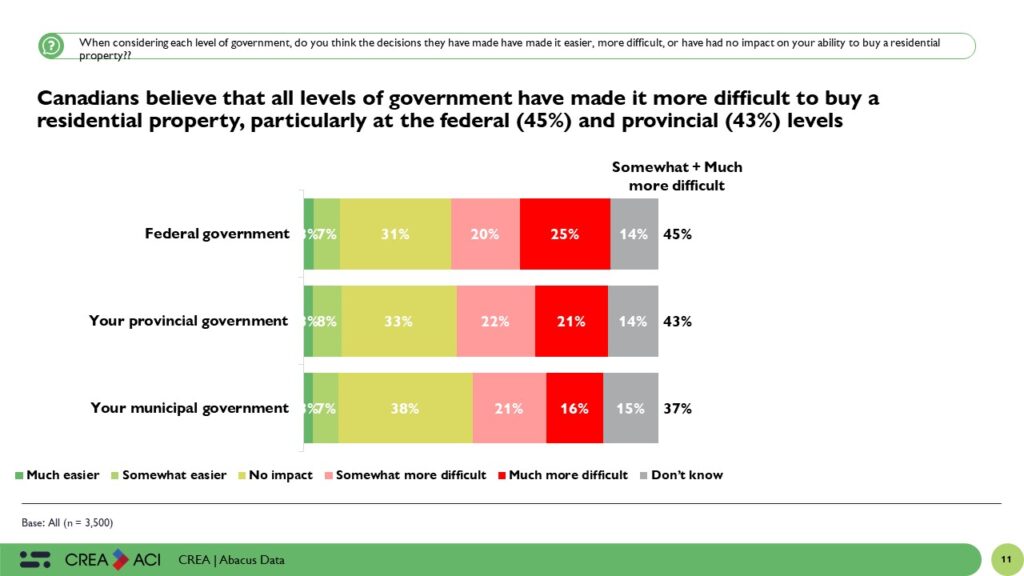
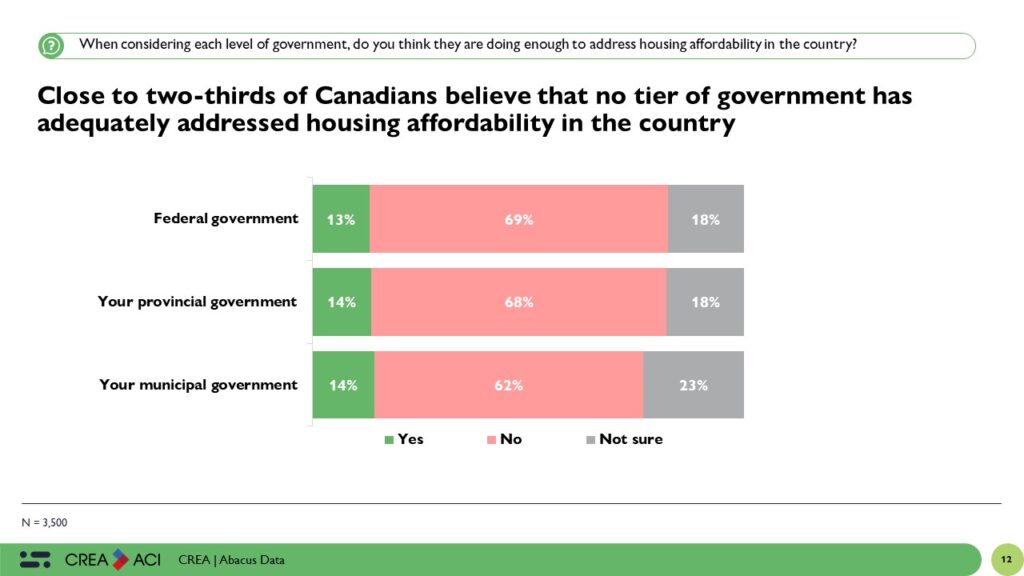
The competence and efficacy of government entities at all three levels in addressing housing concerns have now become a subject of intense scrutiny among the Canadian populace. A substantial 45% of Canadians assert that the federal government has actively contributed to the increased complexity of residential property acquisition, a sentiment mirrored by 43% regarding provincial governments. Even more astonishing, close to two-thirds of Canadians maintain the conviction that no tier of government – whether federal, provincial, or municipal – has exhibited adequate dedication to tackle the affordability crisis in the housing market.
Echoes of Dissatisfaction: Assigning Blame, Identifying Barriers, and the Cry for Effective Government Response
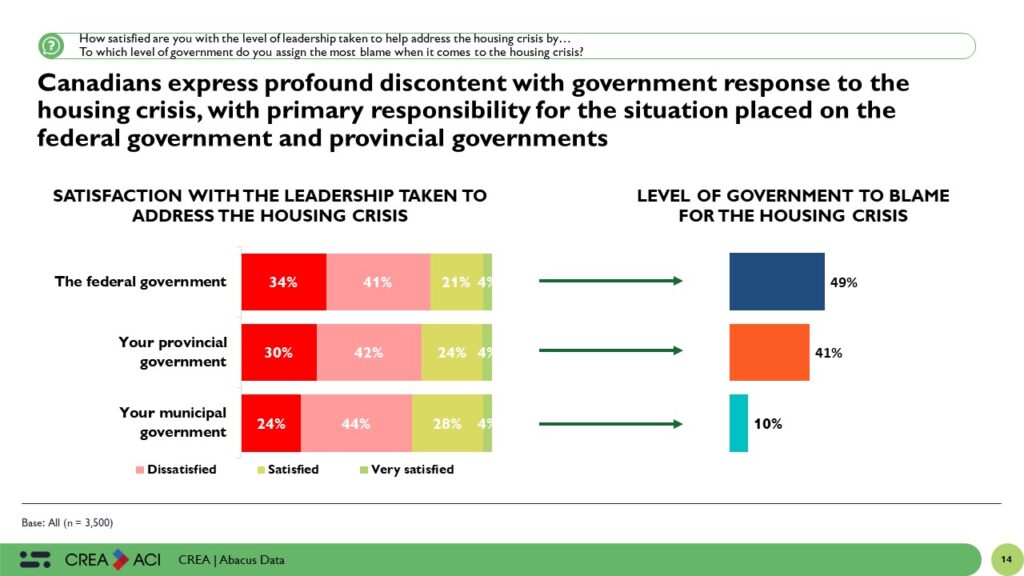
Canadians are highly dissatisfied with government responses to the housing crisis, with 75% expressing their discontent with the federal government, 72% with their provincial counterparts, and 68% with municipal authorities. These widespread discontented sentiments underscore the urgent demand for a more effective and coordinated approach from all levels of government. Additionally, when it comes to identifying responsibility for the ongoing housing crisis, 49% of Canadians attribute it to the federal government, closely followed by 41% placing blame on their provincial government. This prevailing perception highlights the need for improved collaboration between federal and provincial authorities, a sentiment held by two-thirds of the Canadian population (66%), to address the housing crisis effectively. This perception underscores the urgent need for enhanced cooperation and coordination between government tiers to address the housing crisis adequately.
Solutions and Opportunities for Change
The resounding call for immediate and resolute action resonates across the nation. Now, more than ever, Canadians anticipate government authorities at all levels to use to the occasion and assume a leadership role in addressing this urgent matter. As we conclude our four-part analysis of Canada’s housing crisis in partnership with the Canadian Real Estate Association, it is imperative to emphasize the need for a call to action. This call underscores the pivotal role government at all three levels must undertake to address this crisis effectively.
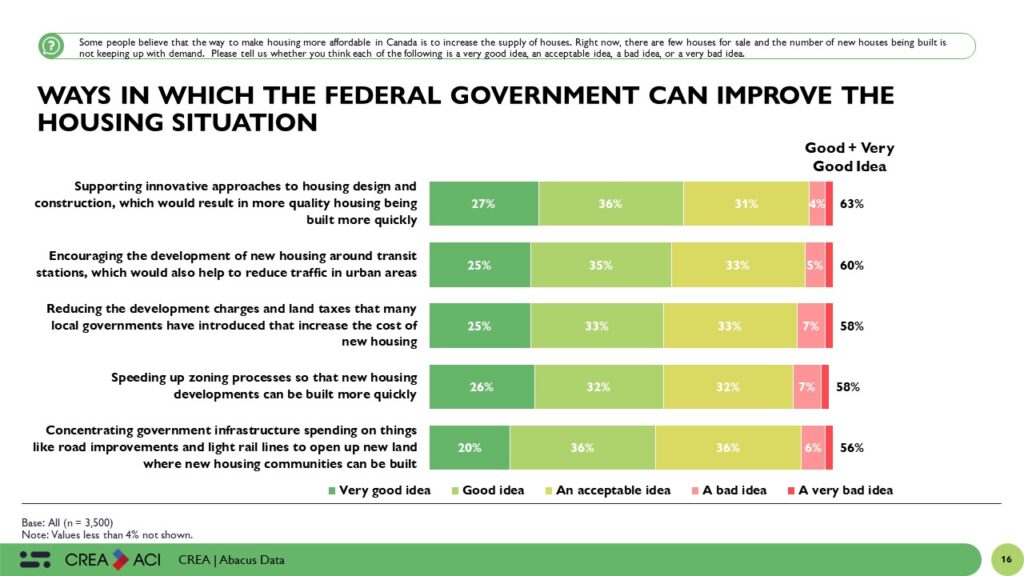
Support for Innovative Housing Design: A significant majority of Canadians endorse innovative housing design and construction (64%). This involves adopting modern construction techniques and technology to expedite the creation of high-quality housing, addressing the growing demand for homes while enhancing housing quality.
Reducing Development Charges and Land Taxes: A majority of Canadians, nearly 60%, back the idea of cutting local government development charges and land taxes. These charges often inflate the cost of new housing, limiting accessibility. Lowering these fees at the federal level can contribute to increased housing affordability.
Accelerating Zoning: Speeding up zoning procedures is a vital aspect of tackling the housing crisis. With 58% support, it’s evident that a substantial number of Canadians view it as an effective approach. Faster zoning translates to quicker construction and more housing units, addressing the demand in high-pressure housing regions.
Infrastructure Focus: Although not the most popular option, channeling federal infrastructure investments into road upgrades and light rail lines remains a viable approach with 56% support. This strategy seeks to create new housing development opportunities by enhancing transportation infrastructure. While it may take time to witness the full effects, these investments can have a lasting positive impact on housing availability.
Overall, the voices of Canadians underscore the urgency of addressing the housing crisis through a multifaceted approach. Innovative housing design, reductions in development charges and land taxes, expedited zoning procedures, and an emphasis on infrastructure investments reflect some of the initiatives that Canadians support. These findings illuminate the necessity of collaborations at all levels of government to implement solutions that resonate with the Canadian population, ultimately ensuring affordable and accessible housing for all.
The Upshot
The housing crisis in Canada has hit a critical juncture, characterized by significant challenges related to the affordability and availability of housing. The results underscore the widespread lack of confidence Canadians hold in all levels of government to effectively resolve the housing crisis. Dissatisfaction with current government actions, a perception that the issue isn’t receiving the priority it deserves, and the belief that insufficient measures have been taken to date are prevalent.
The resounding call for immediate and resolute action resonates across the nation. Now, more than ever, it falls upon the federal government to step into a leadership role and address this pressing issue. As we conclude our four-part analysis of Canada’s housing crisis in partnership with the Canadian Real Estate Association, it is imperative to emphasize the need for a call to action. This call underscores the pivotal role the federal government must undertake to address this crisis effectively.
Prioritize Housing Affordability: Recognize housing affordability as a top priority for the federal government. Listen to the voices of Canadians, where 82% have emphasized the paramount need for affordable housing. Align government priorities with the public’s expectations.
Coordinate Government Efforts: Housing affordability is a multifaceted issue that spans federal, provincial, and municipal jurisdictions. Forge strong partnerships and collaborative efforts between all levels of government to create a unified approach to addressing the crisis. Housing knows no boundaries; neither should our solutions.
Streamline Housing Policies: Develop comprehensive and streamlined housing policies that are responsive and effective. The current housing market apprehensions demand well-thought-out measures that ease financial burdens for both renters and homebuyers. This may involve tax incentives, subsidies, and strategic investments to make housing more affordable and accessible.
Innovate and Expedite: Embrace innovative housing design, streamline zoning processes, and reduce development charges and land taxes. These solutions have garnered significant support from Canadians and can expedite the availability of affordable housing units.
Crisis of Access and Affordability: It is important to remember that the housing crisis is not just about affordability but also about accessibility. Policies should address the needs of all Canadians, ensuring that everyone has a fair opportunity to access quality and affordable housing.
The time for action is now. The federal government has the opportunity to lead the way in ensuring that housing in Canada is accessible, affordable, and of high quality. By responding to the widespread concerns of Canadians and taking decisive steps, the government can make a lasting and positive impact on the housing landscape.
However, failure by the federal government to take a leadership role in addressing the housing crisis risks worsening an already dire situation with severe consequences. The crisis has caused widespread discontent among Canadians, and a lack of effective action could further erode public trust and confidence in the government. Failing to address the housing crisis prolongs suffering, tarnishes the government’s reputation, and may lead to political repercussions and public discontent. Inaction is not an option, as it jeopardizes the government’s standing in the eyes of the Canadian populace.
Methodology
The survey was conducted with 3,500 Canadian adults from September 22 to 28, 2023. A random sample of panelists were invited to complete the survey from a set of partner panels based on the Lucid exchange platform. These partners are typically double opt-in survey panels, blended to manage out potential skews in the data from a single source.
The margin of error for a comparable probability-based random sample of the same size is +/- 1.66%, 19 times out of 20.
The data were weighted according to census data to ensure that the sample matched Canada’s population according to age, gender, educational attainment, and region.
This survey was paid for by the Canadian Real Estate Association (CREA).
Canadians have “notable knowledge gaps” about the cost and performance of electric vehicles, which may be holding them back from making that first EV purchase, concludes a survey commissioned by Electric Mobility Canada (EMC).
The majority may still think EVs are more expensive and less dependable and durable than gas vehicles, judging by an Abacus Data survey of 1,500 Canadians just released by EMC. Dispelling these misconceptions through public education could be the key to ensuring their next car is a plug-in.
Abacus Data conducted a fascinating survey recently of smaller companies for Business Development Bank of Canada’s Small Business Week.
Entrepreneurs don’t feel good about where we’re at. More than 60 per cent of 600 respondents said they think the Canadian economy is doing poorly, while 29 per cent said they thought the economy was doing “pretty well” and only seven per cent said the economy was doing “very well.”