Conservatives and Liberals locked in a tie; TVA debate has limited impact.
September 7, 2021
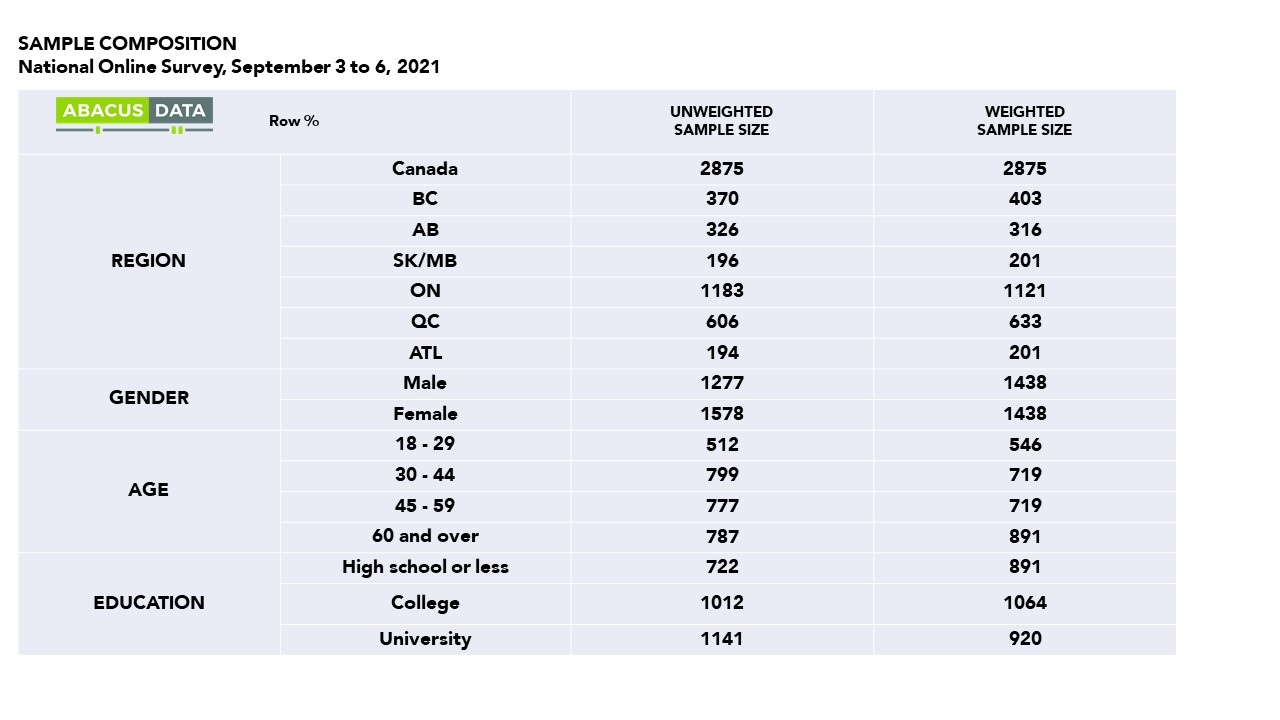
We just completed a national survey of 2,875 Canadians eligible to vote in the current federal election completed entirely after last Thursday’s TVA debate. Fieldwork was carried out from Friday to Monday.
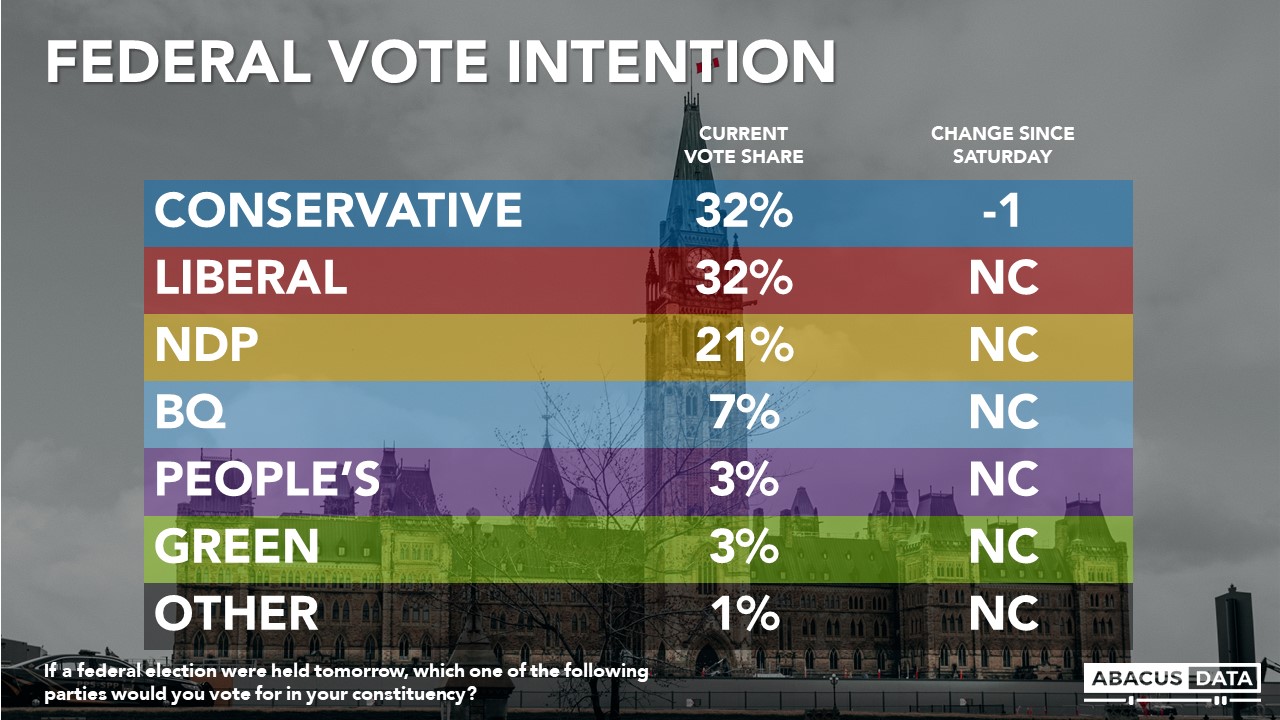
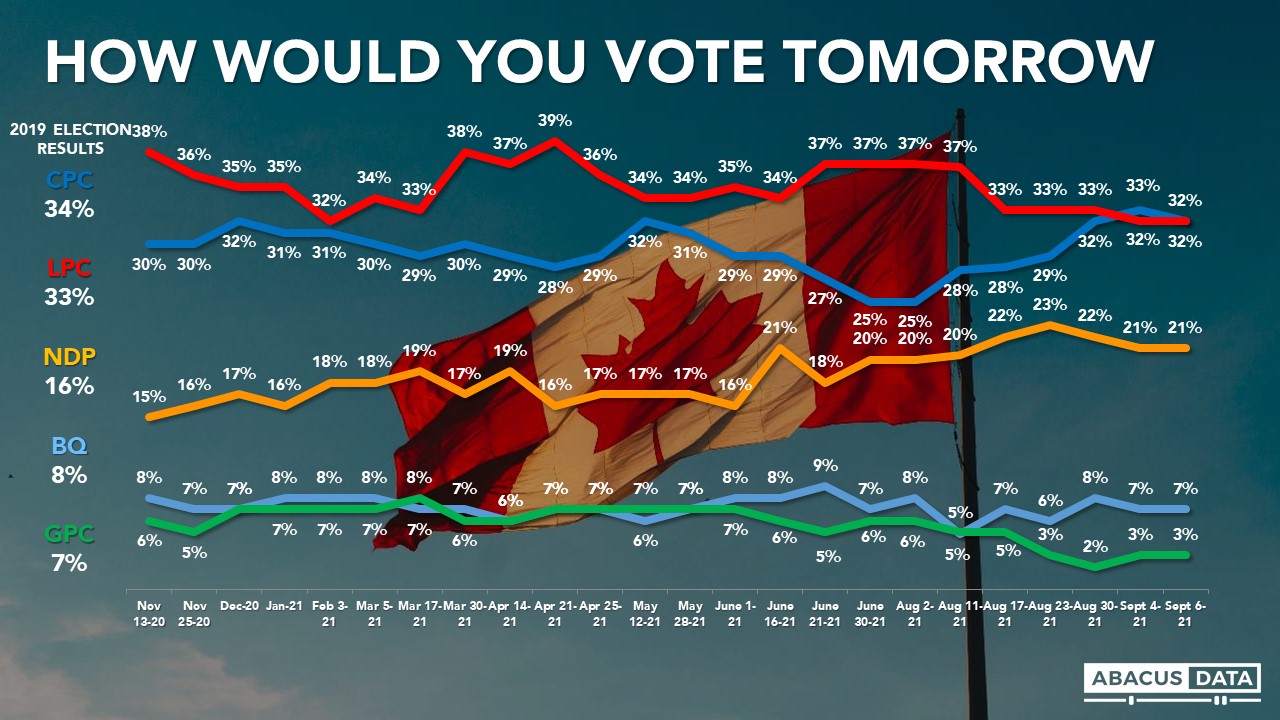
If an election were held now, the Conservatives would win 32% of the vote (-1 from our last poll), the Liberals 32% (unchanged), the NDP 21% (unchanged), the Green Party 3% (unchanged) and the BQ at 31% in Quebec (unchanged)
• In BC, we see a three-way race with the NDP at 35%, the Liberals at 29%, and the Conservatives at 27%.
• In Alberta, 50% would vote Conservative compared with 24% for the Liberals, 20% for the NDP, 3% for the People’s Party and 1% for the Maverick Party.
• In Manitoba and Saskatchewan, the Conservatives lead with 46% followed by the NDP at 24% and the Liberals at 24%.
• In Ontario, the Liberals have a three-point lead over the Conservatives (37% to 34%) with the NDP at 21%.
• Within Ontario, the Liberals have a 19-point lead in the 416 region of Toronto, lead by 5 over the Conservatives in the GTHA (postal codes start with L), the Liberals and Conservatives are statistically tied in Eastern Ontario while the Conservatives have a 9-point lead over the NDP in the Southwest.
• In Quebec, we see the LPC and BQ are neck and neck (32% to 31%) with the Conservatives at 21% and the NDP at 13%. Since our last full sample done before the debate in Quebec at the end of August, the Liberals are up 3 while the BQ is down 3 but this change is all within the margin of error.
• In the Atlantic provinces, the Liberal are ahead by 7 over the Conservatives (39% to 32%) with the NDP at 20%.

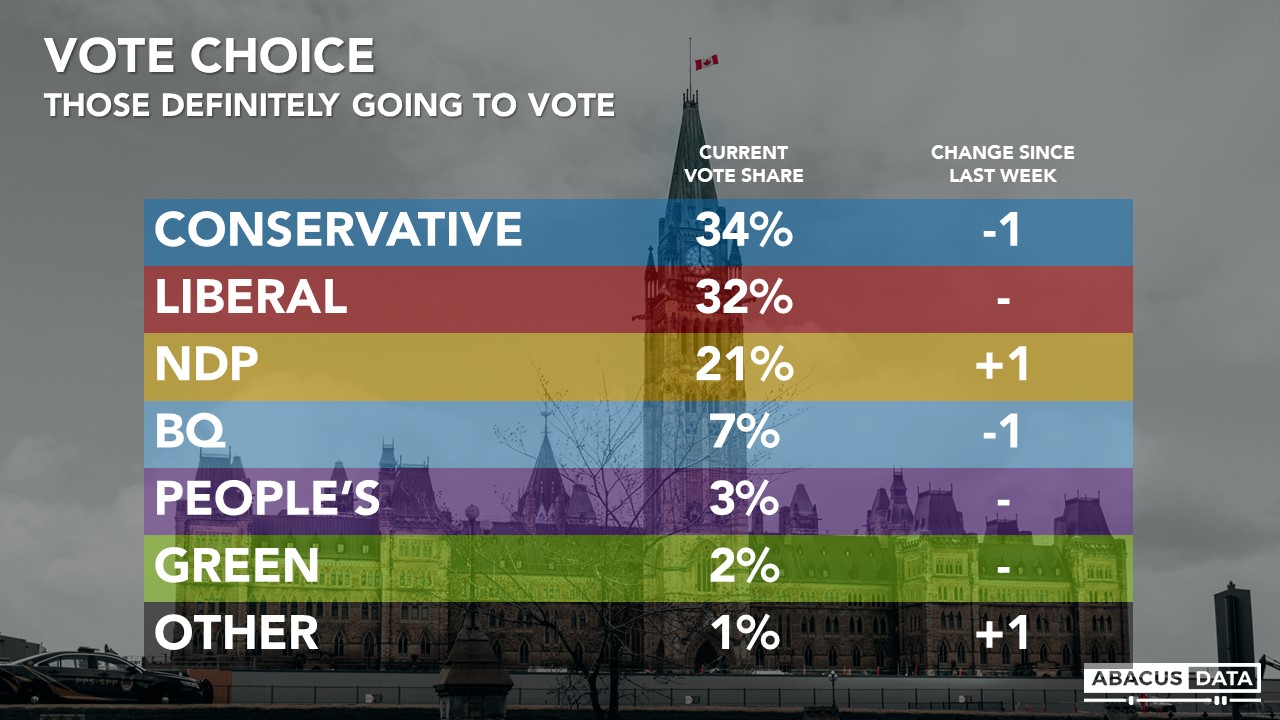
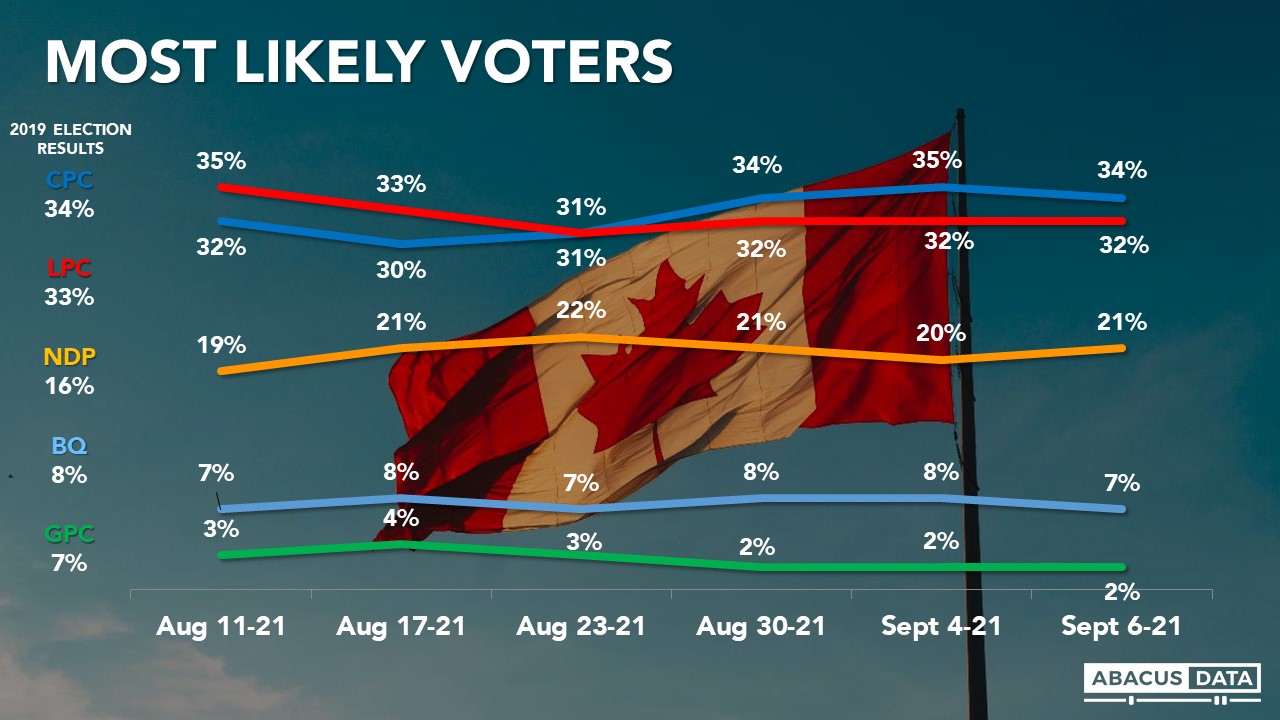
The Conservatives continue to have a marginal 2-point lead among those who are most likely to vote. Among the 69% of respondents who said they would definitely be voting, the Conservatives have 34% compared with 32% for the Liberals and 21% for the NDP. This is largely unchanged from our last poll.
TVA DEBATE REACTIONS
In Quebec, 48% of respondents said they watched all (20%) or some (28%) of the leaders’ debate on TVA Thursday night. Another 27% said they heard about it from others while 25% did not hear anything about the debate.
Outside Quebec, 6% said they watched all of the debate, 15% watched some of it, while 33% heard something about it from others or the news.

It appears the audience for this debate was slightly larger than in 2019. In a survey we did post-debate in 2019, 14% said they watched all of it, 27% watched some, while 37% heard something about it from others.
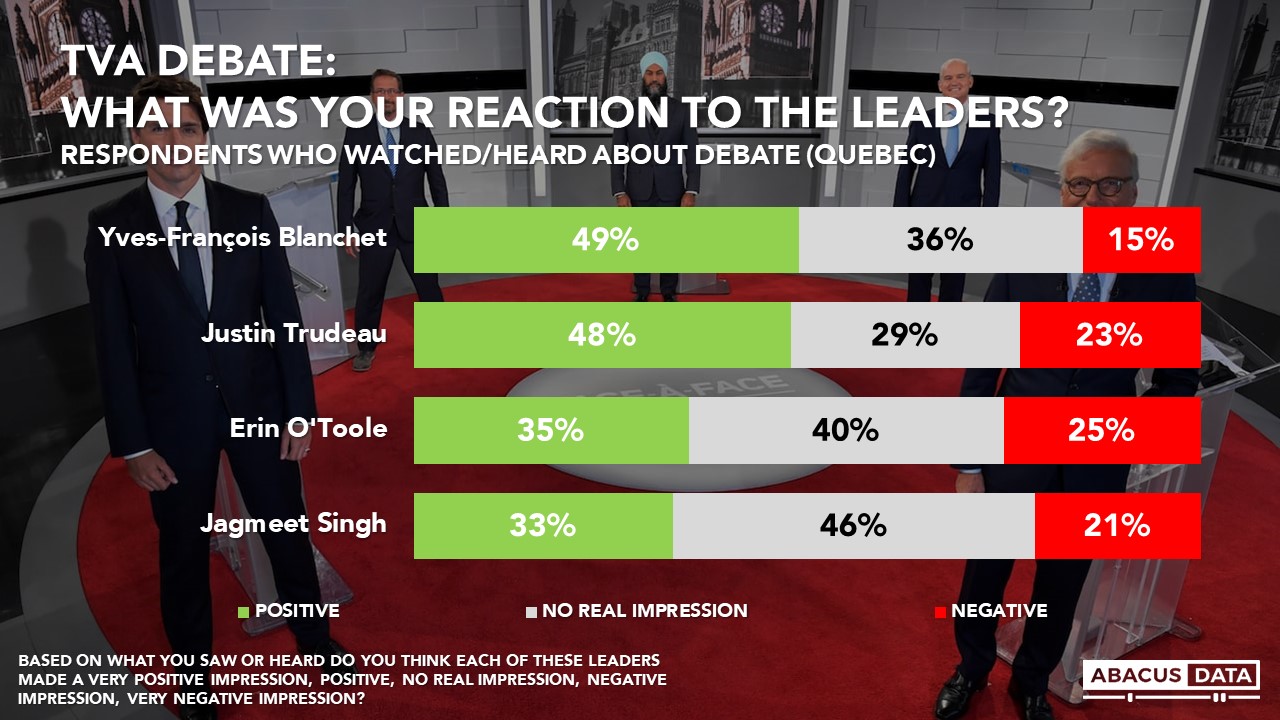
Those who watched or heard something about the debate were asked whether each leader made a positive or negative impression.
All four leaders left more positive than negative impressions, with Trudeau (+25) and Blanchet (+34) notching better net impacts than O’Toole (+10) and Singh (+12).
When asked specifically which leader did the most to earn their vote, Justin Trudeau was the choice of 33%, well ahead of Mr. Blanchet (22%), Mr. O’Toole (20%) and Mr. Singh (13%).

When asked which leader did the more to lose their vote, Mr. Trudeau also came out on top with 30% selecting the Liberal leader followed by Mr. O’Toole at 24%, Mr. Singh at 13%, and Mr. Blanchet at 12%. 1 in 5 felt that none of them did more to lose their vote.
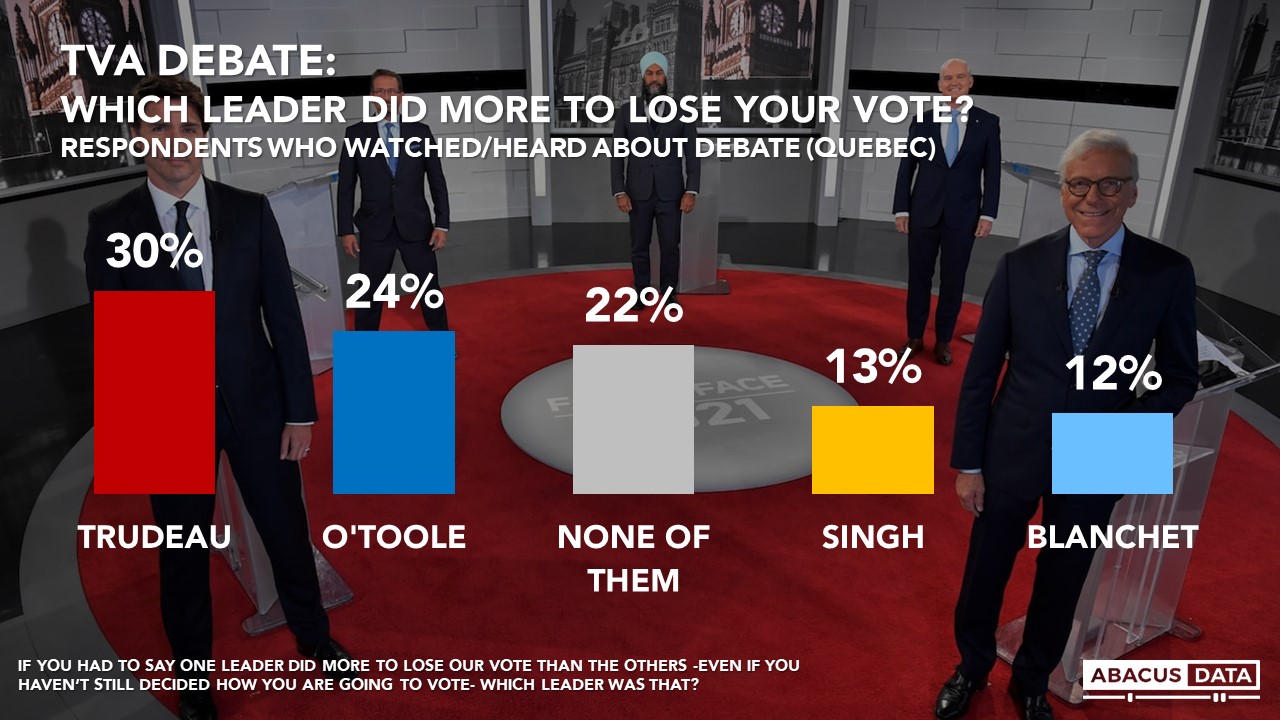
Overall, these results suggest that Mr. Trudeau and Mr. Blanchet had better nights than the other two leaders but that no leader performed poorly.
PREFERRED ELECTION OUTCOME
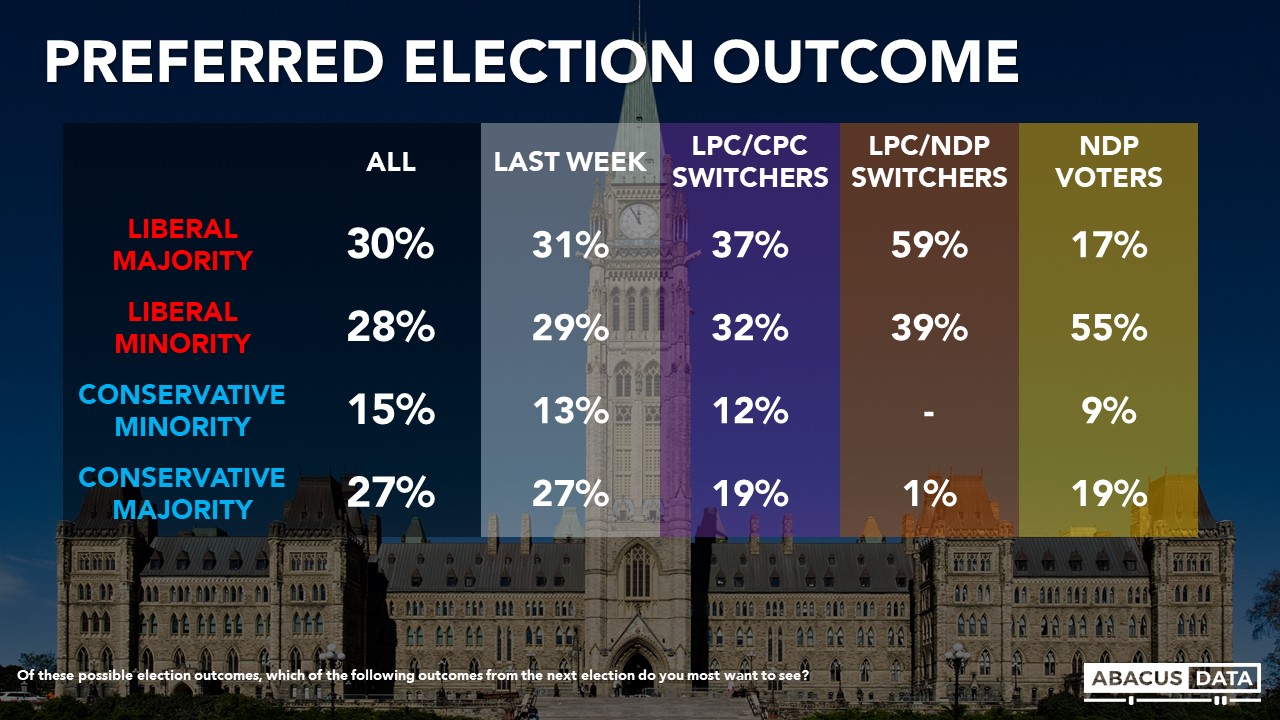
Asked which of four (most likely based on today’s numbers) outcomes they would prefer, 58% would prefer a Liberal victory (30% majority, 28% minority) while 42% would prefer a Conservative win (15% minority, 27% majority). This is unchanged from our previous survey.
A Liberal win is the preference of 65% in BC, 44% in Alberta, 48% in Manitoba/Saskatchewan, 62% in Ontario, 67% in Quebec, and 64% in Atlantic Canada.
Among Liberal/NDP switchers 99% would prefer a Liberal to a Conservative victory. Among NDP voters 72% would prefer a Liberal win.
Among BQ voters 51% would prefer the Liberals win, compared to 49% who would like the Conservatives to come out on top.
Among Liberal/Conservative switchers 72% would prefer to see the Liberals win.
EXPECTED ELECTION OUTCOME
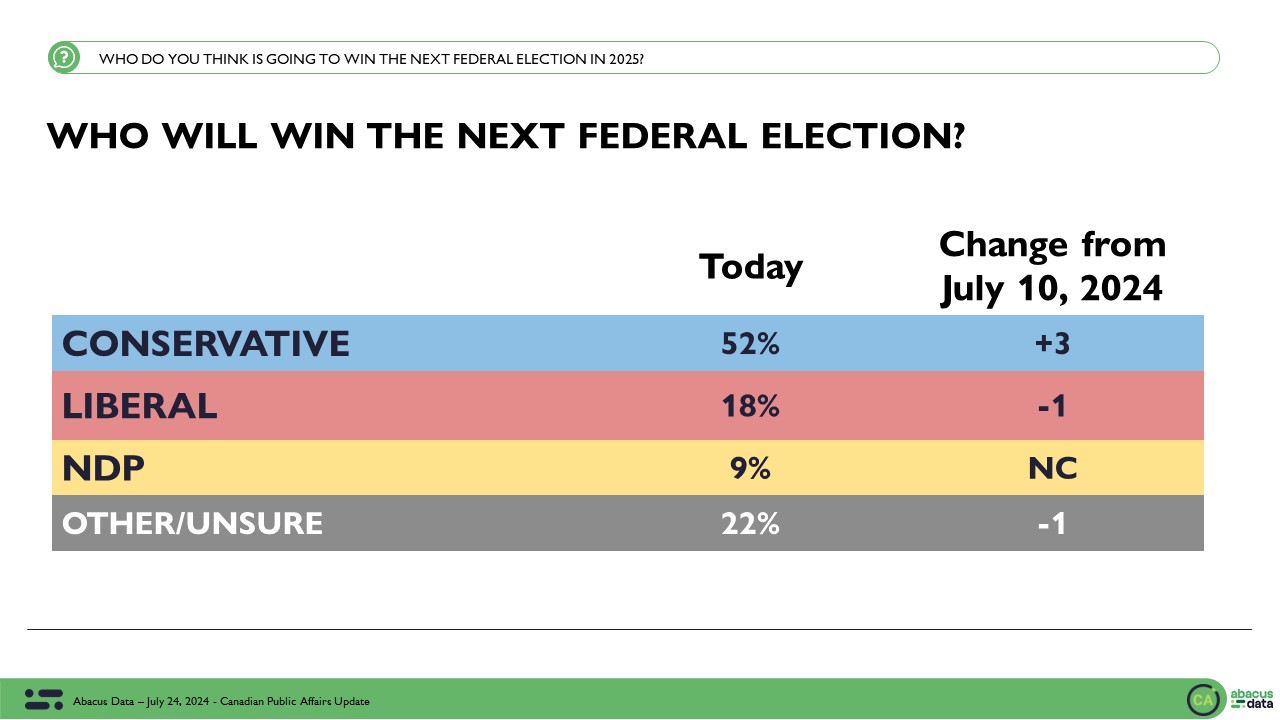
As of today, 37% expect the Liberals to win (unchanged from our last poll but down 6 since last week), followed by 30% who expect the Conservatives to win (up 2 since the last wave and +12 since the start of the campaign), and 7% who expect the NDP to come out on top.

When asked whether the election will be close or will one party win by a lot, 71% think it will be close while 14% think one party will win by a lot. 15% are not sure. Among LPC/NDP switchers 81% think it will be close.
Those who would prefer the LPC to win but think the Conservatives are going to win makes up 5% of the electorate – continuing to rise over the past week.
LEADER IMPRESSIONS
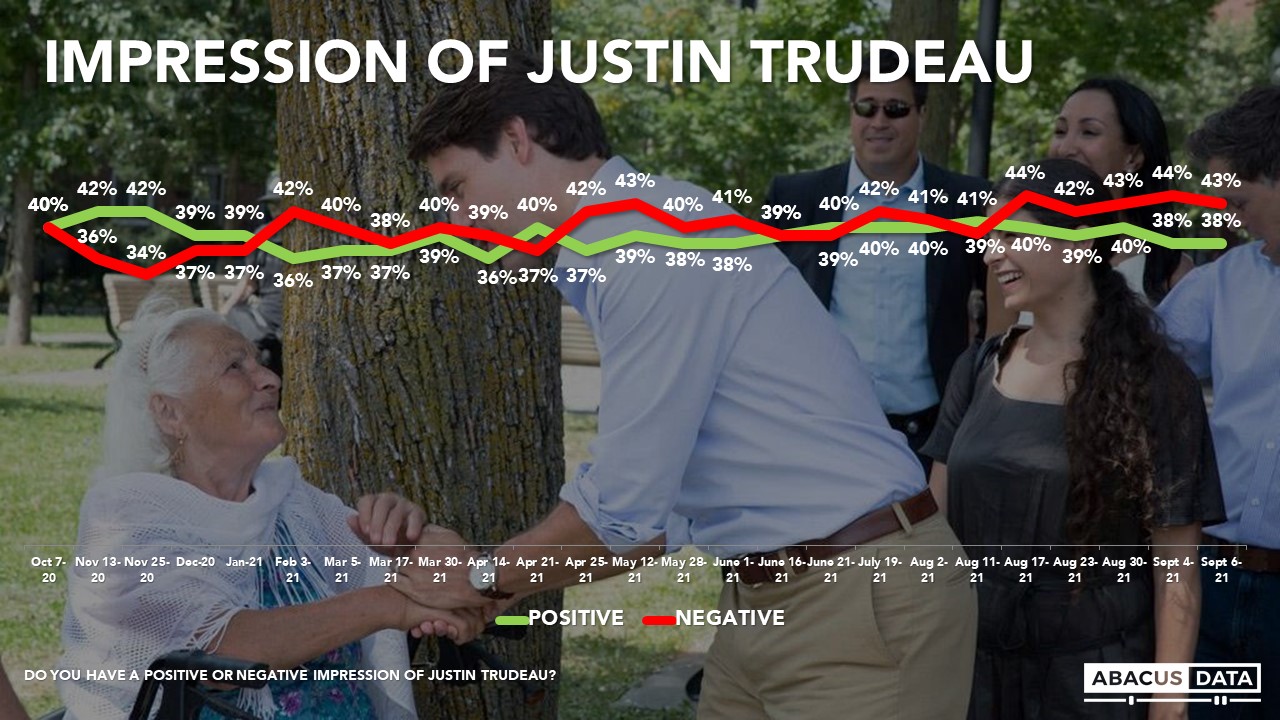
Justin Trudeau enjoys a positive impression among 38% and negative impressions among 43%, for a net score of -5. This is unchanged from last week. Regionally, Mr. Trudeau’s net favourables are -4 in BC, -24 in Alberta, -27 in SK/MB, 0 in Ontario, -2 in Quebec, and +6 in Atlantic Canada. Among Liberal/NDP switchers Trudeau is +71. Among Liberal/Conservative switchers he is +46.
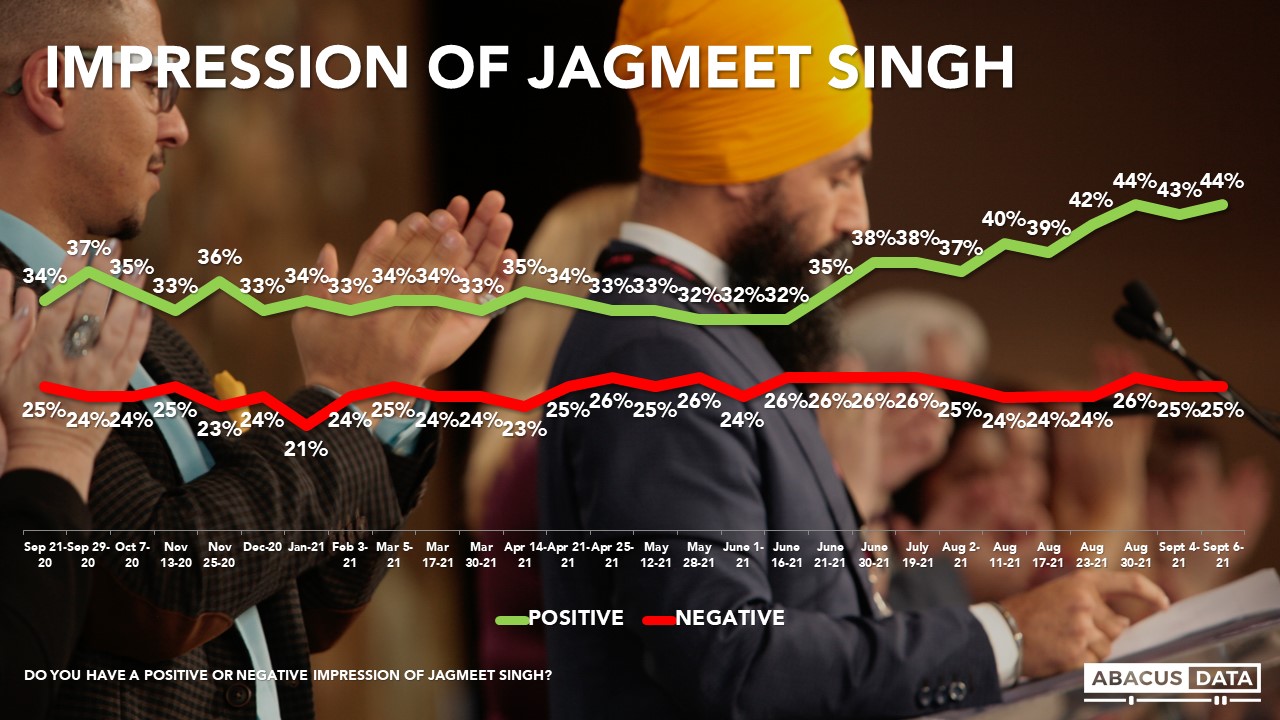
Jagmeet Singh enjoys a positive impression among 44% and finds negative impressions among 25% for a net score of +19.
Regionally, Mr. Singh’s net favourables are +29 in BC, +10 in AB, +20 in SK/MB, +25 in Ontario, +2 in Quebec, and +30 in Atlantic Canada. Among Liberal/NDP switchers Singh is +77.
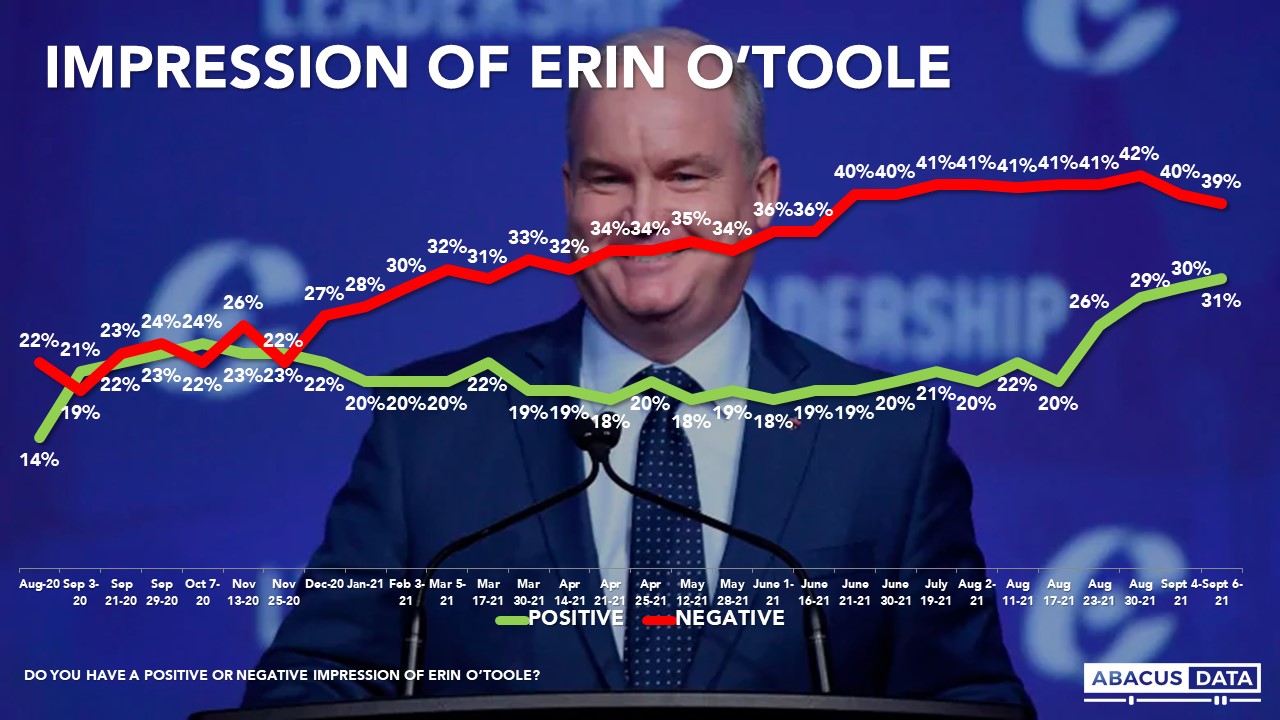
Today 31% have a positive impression of the Conservative leader Erin O’Toole (+1 from last wave) while his negatives are at 39% (-1) for a net score of -8.
Regionally, Mr. O’Toole’s net favourables are -21 in BC, +7 in AB, +5 in SK/MB, -7 in Ontario, -10 in Quebec, and -10 in Atlantic Canada. Among Liberal/Conservative switchers O’Toole is +47.
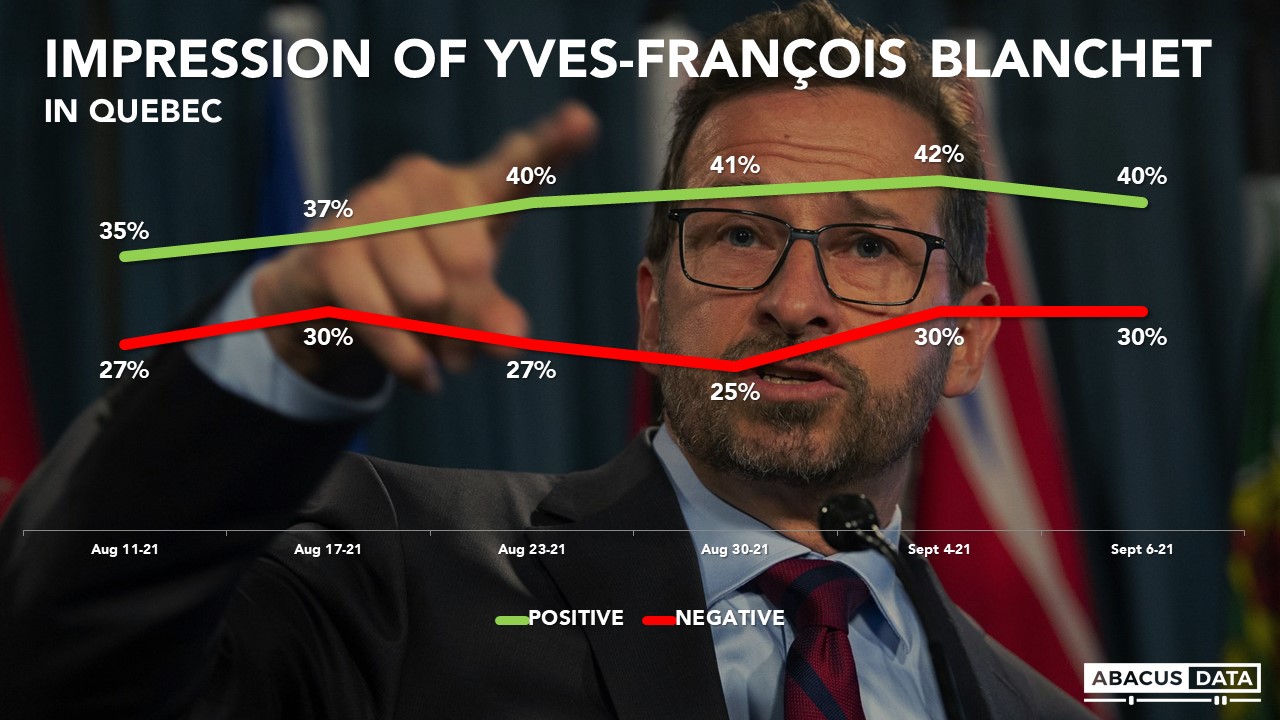
In Quebec, BQ Leader Mr. Blanchet is 40% positive and 30% negative for a net score of +10. Mr. Blanchet’s negatives are up 5 since the end of August.
ACCESSIBLE VOTER POOLS
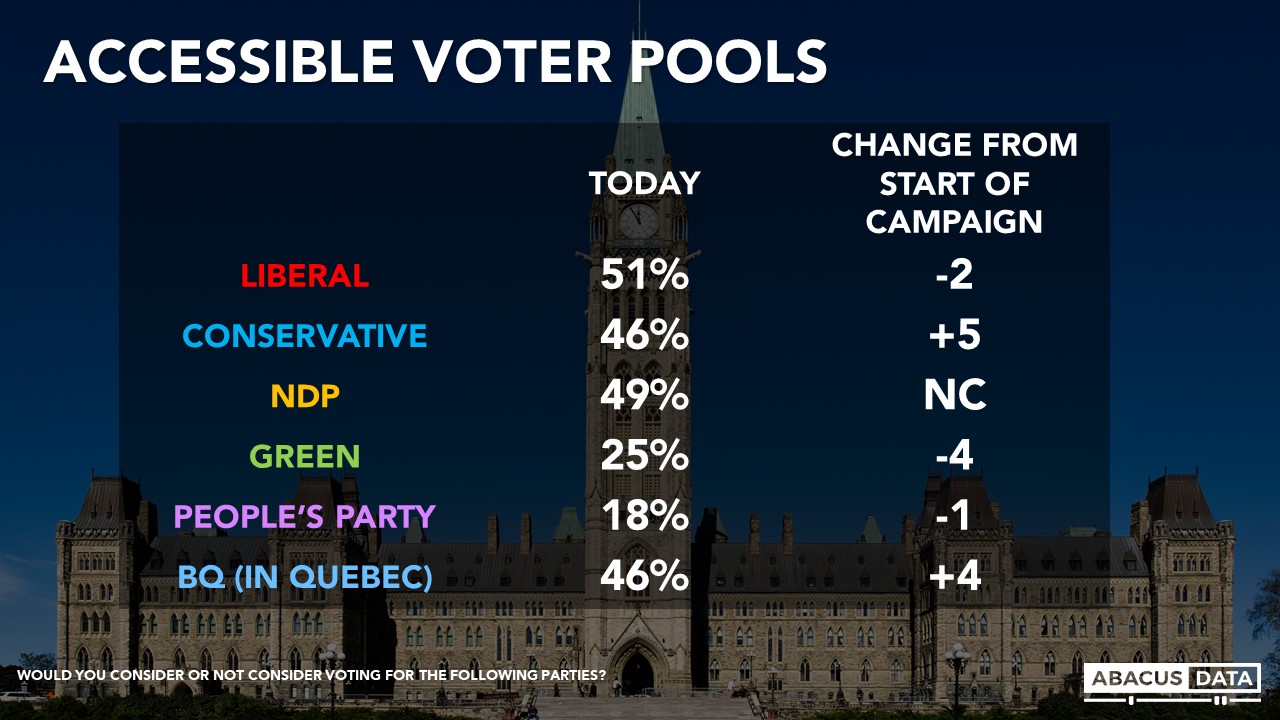
The Liberal Party continues to have the largest pool of accessible voters (those open to voting Liberal) at 51% followed by the NDP at 49% and the Conservatives at 46%. One in four are open to voting Green, 1 in 5 are open to voting for the People’s Party and almost half in Quebec say they are open to voting for the BQ.
Since the campaign started, the Conservative pool has grown by 5, the BQ by 4 while the Greens have seen their accessible voter pool drop by 4 points. The Liberal and NDP voter pools are largely unchanged.
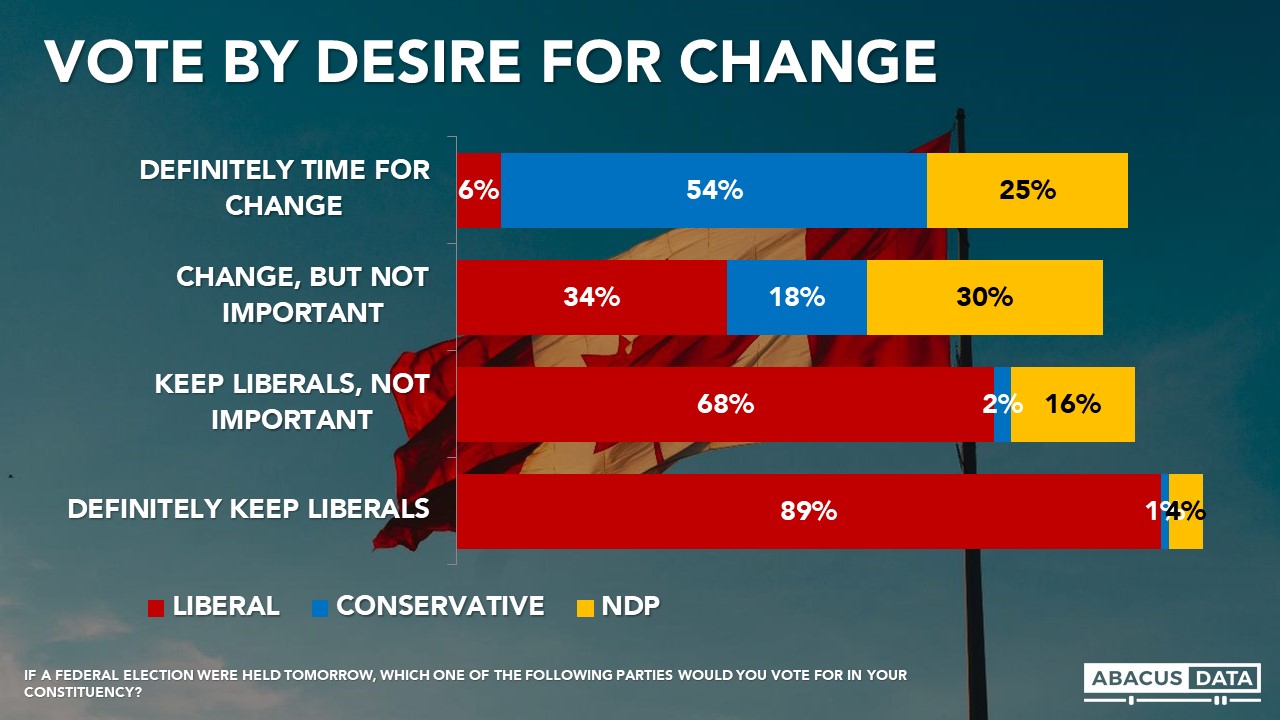
DESIRE FOR CHANGE
Today, 49% definitely want to see a change in government (up 1 since our last survey) while another 20% say it would be good to have a change, but it is not really that important to them (down 3), for a total of 69% who would prefer a change in government.
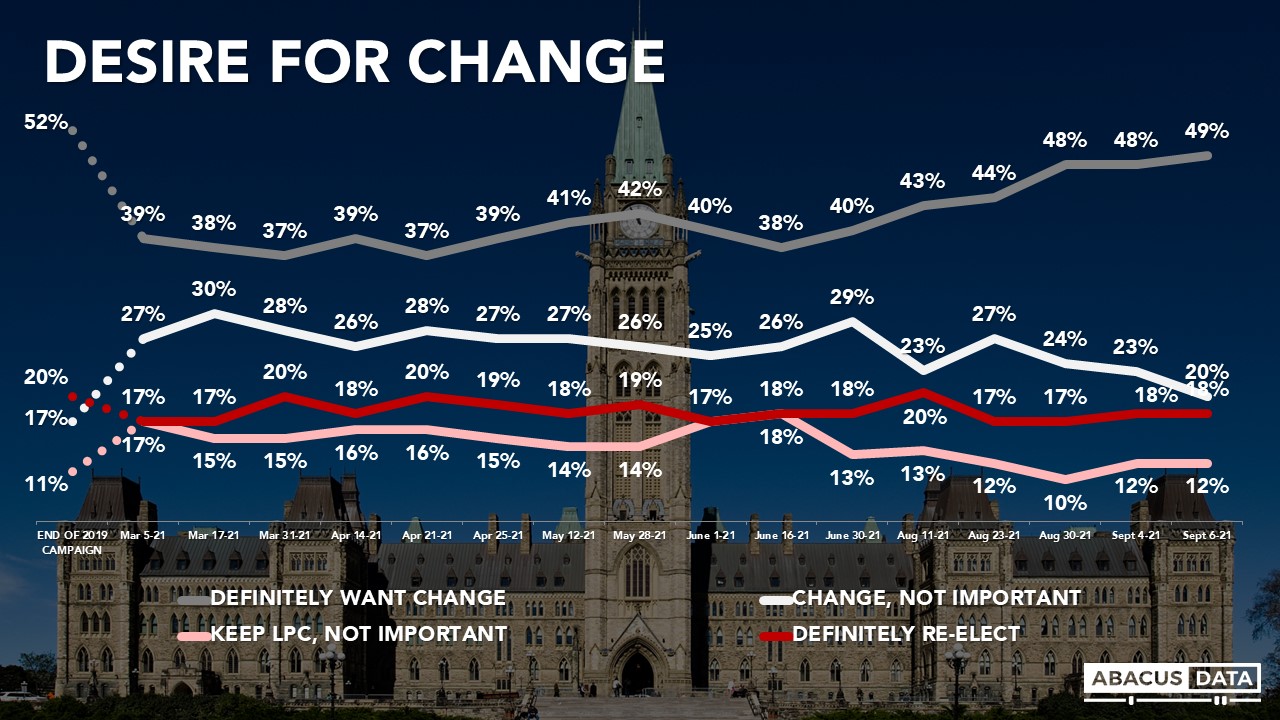
The vote preference by change group is important to understanding the election. Among those who prefer change but say it isn’t that important to them (20% of the electorate at the moment), the Liberals and NDP are statistically tied (LPC 34% vs. NDP 30%) with the Conservatives in third. Liberal re-election hopes likely ride on how this group ultimately leans.
Among those who say they want to keep the Liberals in office but it’s not important to them, 68% would vote Liberal compared with 16% who would vote NDP.
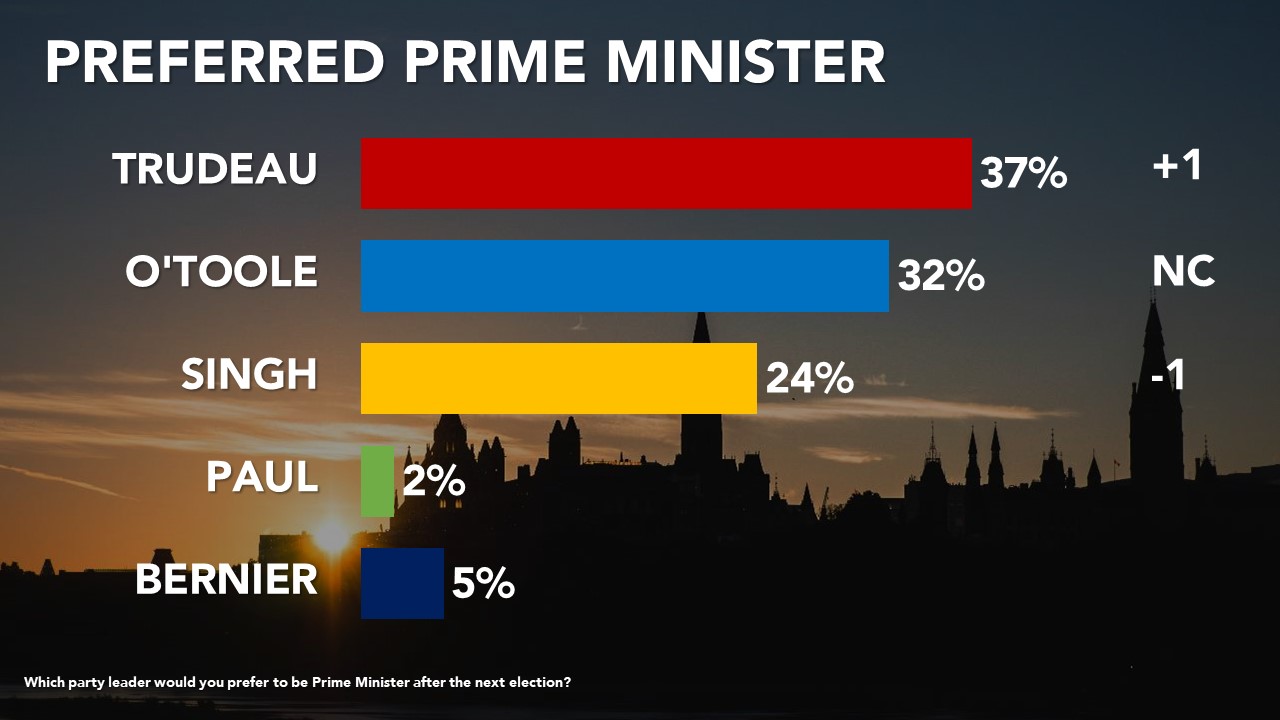
PREFERRED PRIME MINISTER
Today, 37% of voters would prefer Justin Trudeau be PM after the election, 32% would prefer Erin O’Toole, and 24% Jagmeet Singh. This is almost the exact same split as our last poll.
Asked if the choice was only between O’Toole and Trudeau, Trudeau would be the preference of 57% (up 1) and O’Toole 44% (down 1). When asked who they would prefer between Mr. O’Toole and Mr. Singh, the split is almost the same, 56% would prefer Mr. Singh and 44% would prefer Mr. O’Toole.
UPSHOT
According to Bruce Anderson: “Anyone who felt that this election had a locked-in trajectory will want to revisit that point of view as more data is suggesting this race can be won by either one of two parties and that many voters remain uncertain what they will do. The TVA debate was a good outing for Mr. Trudeau but also for his chief rival in Quebec, Mr. Blanchet. Battles in BC, Ontario and Quebec are too close to call and the coming week, with more debates and more advertising, will be of vital importance for all the campaigns.”
According to David Coletto: “The race remains deadlocked nationally with the Liberals ahead in Ontario and tied in Quebec. Even among those most likely to vote, the 2-point Conservative margin is unlikely to win them more seats than the Liberals.
The TVA debate doesn’t appear to have changed the trajectory of the campaign with more saying Mr. Trudeau and Mr. Blanchet left a positive impression and vote intentions and leader impressions largely the same as before the debate.
But the static horse-race numbers obscure some important shifts and underlying perceptions/views that give us a sense of where this campaign could go in the final two weeks:
1. Those thinking the Conservatives will win the election continue to grow. When the campaign started, the gap was 46% Liberal vs. 18% Conservative. Today it is 37% who think the Liberals will win versus 30% who think the Conservatives will win.
2. More voters continue to prefer a Liberal government to a Conservative one and this preference is not shifting much over time.
3. The Conservatives have been able to increase their pool of accessible voters over the campaign and have converted some new supporters. Among its current supporters, 76% voted for the party in 2019 while 23% are new supporters – either saying they voted for a different party in 2019 or did not vote at all. This is similar to what we are seeing for the Liberals (32%) which means it’s stuck tied with the Liberals now because it isn’t converting enough new supporters to build on its 2019 results.
4. So far, the NDP has done the best at growing supporting. Of its current supporters, 49% said they voted NDP in 2019 meaning half of its support is new – with the bulk coming from potentially new voters (24%) who say they didn’t vote in 2019 either cause they weren’t eligible or they chose not to.
5. The desire for change remains at about the level it was when the 2019 campaign ended (49% today vs. 52% in 2019). Keeping this number below 52% is critical for the Liberals. Getting it higher is a must for both the Conservatives and the NDP.
METHODOLOGY
The survey was conducted with 2,875 Canadian adults eligible to vote from September 3 to 6, 2021. A random sample of panelists were invited to complete the survey from a set of partner panels based on the Lucid exchange platform. These partners are typically double opt-in survey panels, blended to manage out potential skews in the data from a single source.
The margin of error for a comparable probability-based random sample of the same size is +/-1.9%, 19 times out of 20.
The data were weighted according to census data to ensure that the sample matched Canada’s population according to age, gender, educational attainment, and region. Totals may not add up to 100 due to rounding.
This survey was paid for by Abacus Data Inc.
Abacus Data follows the CRIC Public Opinion Research Standards and Disclosure Requirements that can be found here: https://

ABOUT ABACUS DATA
We are the only research and strategy firm that helps organizations respond to the disruptive risks and opportunities in a world where demographics and technology are changing more quickly than ever.
We are an innovative, fast-growing public opinion and marketing research consultancy. We use the latest technology, sound science, and deep experience to generate top-flight research-based advice to our clients. We offer global research capacity with a strong focus on customer service, attention to detail and exceptional value.
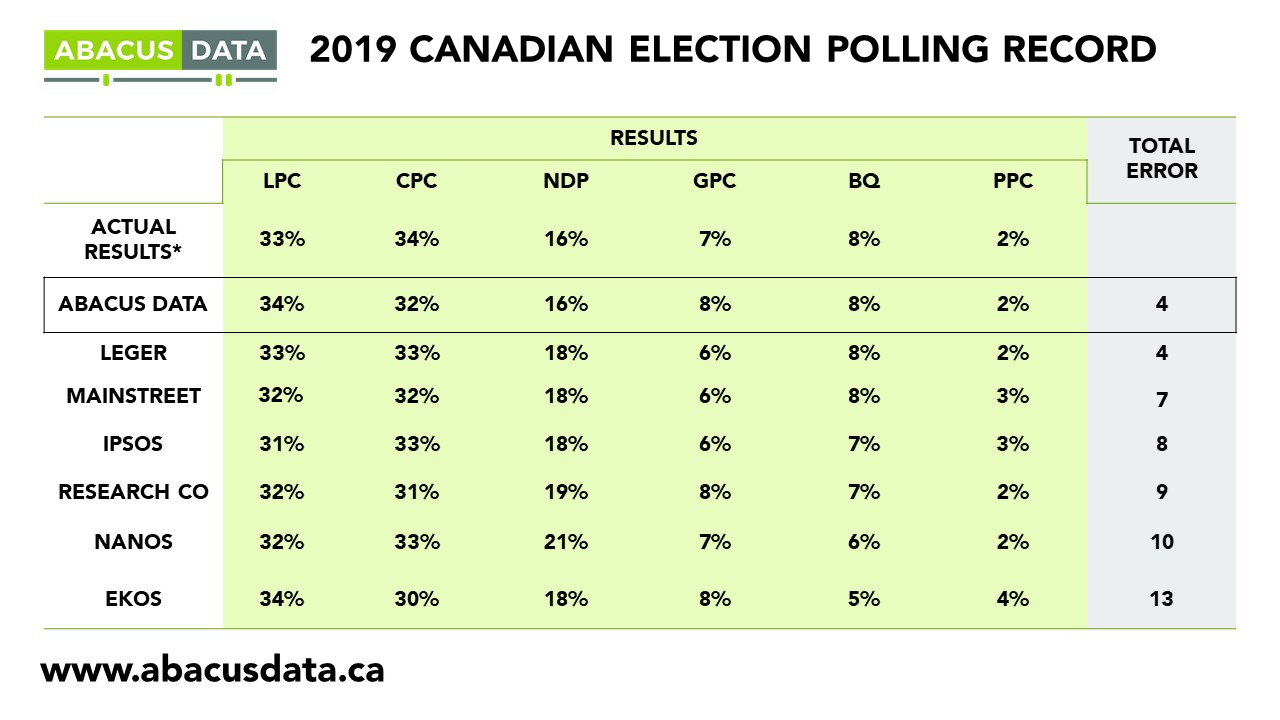
We were one of the most accurate pollsters conducting research during the 2019 Canadian Election.
Contact us with any questions.
Find out more about how we can help your organization by downloading our corporate profile and service offering.