Abacus Data New Brunswick Poll: One Year In, Susan Holt’s Liberals Strengthen Their Lead
We love Atlantic Canada, and we are continuing to raise the bar for public opinion and marketing research in the region.
That’s why we’ve established a Nova Scotia Omnibus survey and a New Brunswick Omnibus survey – both of which we intend to run regularly.
Today, we are also releasing our first New Brunswick-focused provincial politics poll. The results tell a clear story: Premier Susan Holt and the New Brunswick Liberals are more popular today than they were when they formed government, one year ago.
From October 24 to 30, 2025, we surveyed 600 adults across New Brunswick in French and English through our new New Brunswick Omnibus survey. The research started 72 hours after the 2025 Throne Speech was read, with the speech’s key themes and issue frames in the news cycle.
The results we’re sharing today provide a timely snapshot of how New Brunswickers feel about the Holt government and its progress, one year into the Liberal mandate. They also highlight the fact that the Progressive Conservatives are firmly in second place, as their search for a new leader kicks off.
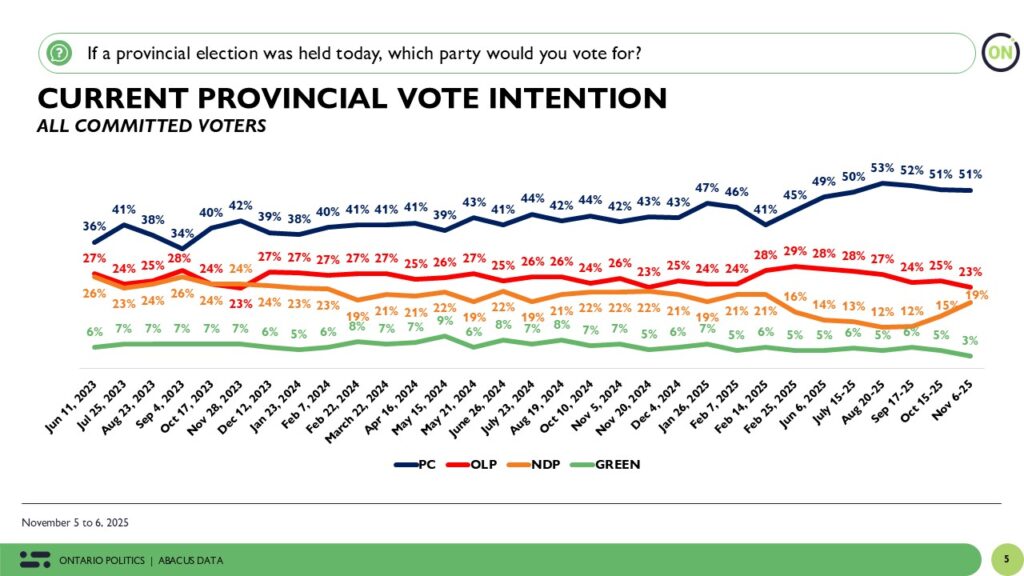
Holt Liberals with Commanding Lead at 53%
One-year after their decisive election win, the Holt Liberals continue to dominate New Brunswick’s political landscape.
If a provincial election was held today, the Holt Liberals would improve upon their 2024 election result, holding a commanding lead over their rivals, and winning every voter segment.
The Liberals currently sit at 53%, which is 5 points higher than what they received at the ballot box last October.
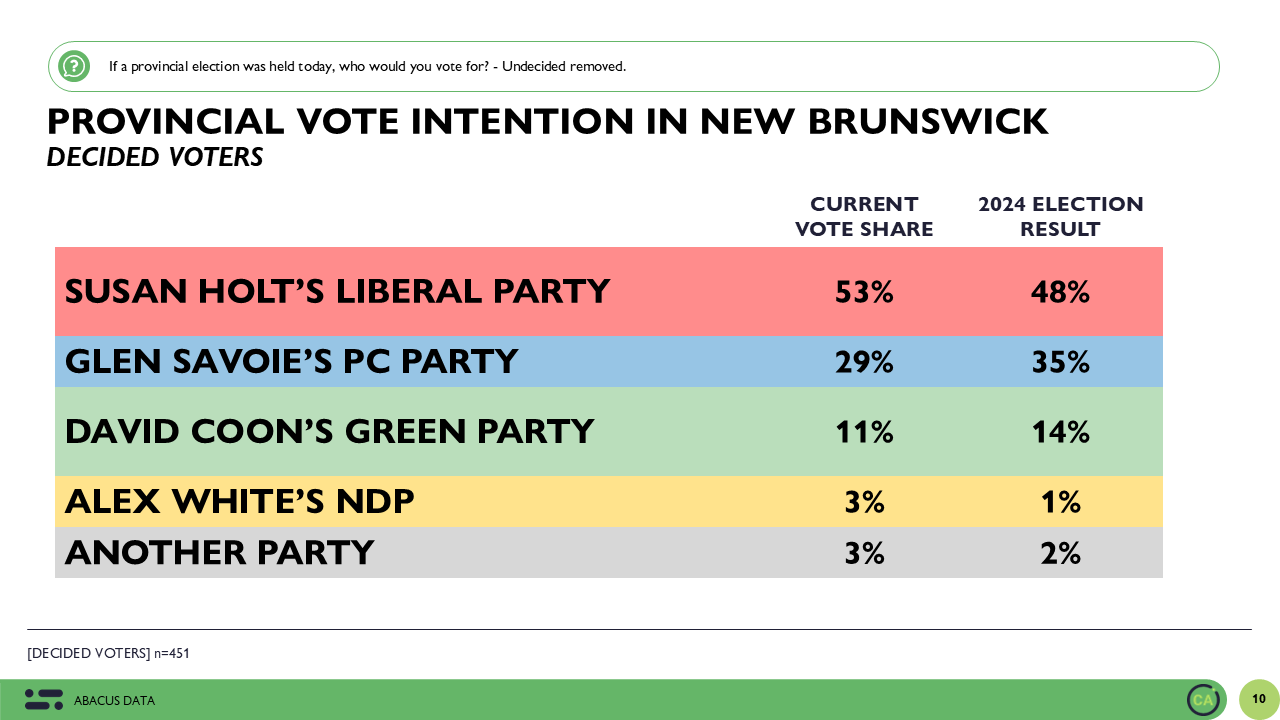
The Progressive Conservatives, now led on an interim basis by Glen Savoie, continue to be the governing party’s closest challenger. The PCs currently sit at 29%. That’s 24-points behind Holt’s Liberals and six points below their own 2024 election performance with Blaine Higgs as Leader.
For their part, the New Brunswick Greens, led by David Coon, continue to hold steady but modest support at 11%, and the NDP, led by Alex White, remain fourth at 3%.
All of these findings suggest that Holt’s Liberals have turned their strong election performance into durable support, with the opposition remaining far behind and divided.
A Strong First Year in Office
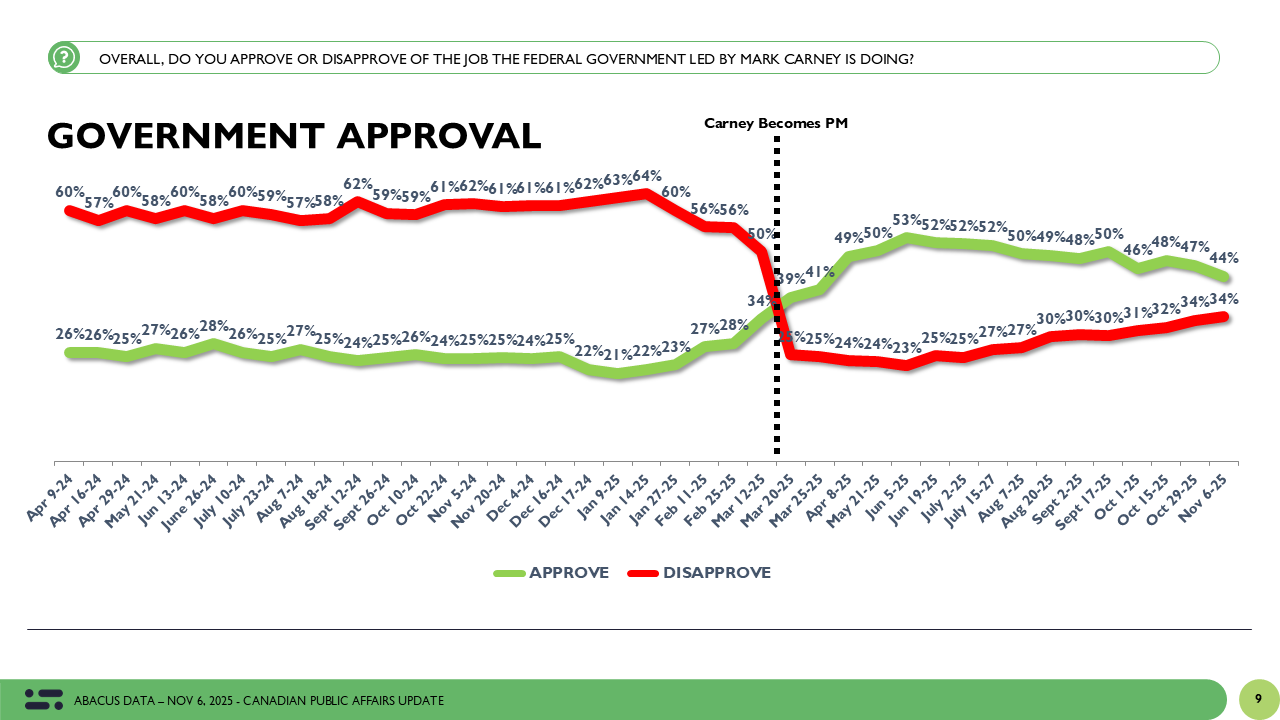
As the Holt Government starts its second year in office, twice as many New Brunswickers approve than disapprove of their overall performance.
42% like what they’ve seen and heard from the Premier and her Ministers in past few months, 28% dislike it and 7% are unsure.

This level of approval (and a net positive score) is a good result for any government currently. 42% approval also seems like a particularly strong results right now, with 2025 being a particularly challenging year.
Since the Holt Liberals were elected, larger geopolitical events like Donald Trump’s re-election and threats to our sovereignty and economy have complicated the work of governing.
The timing of this research – shortly after the Throne Speech was delivered – also suggests that New Brunswickers may be attracted to the Holt government’s promises of bold change in spite of the changing circumstances.
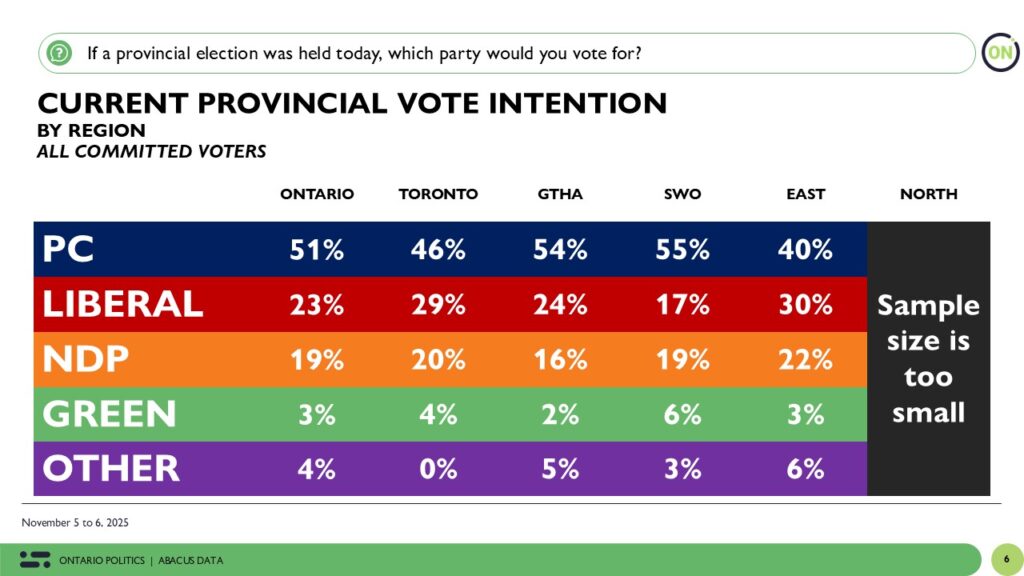
Liberals Dominate Across the Province
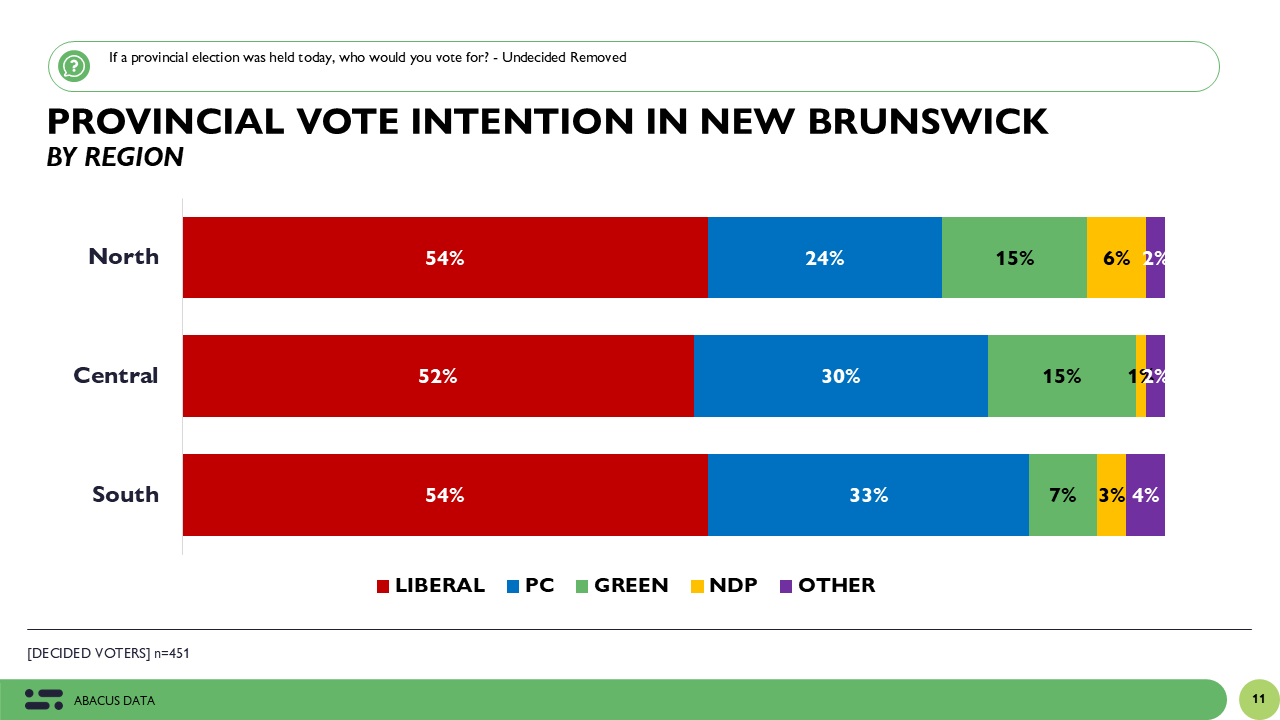
In addition to having the most support, the Liberals’ voter base remains broad, stretching right across the province.
- In northern and Francophone regions, the Liberals continue to dominate, with a thirty-point lead over the PCs.
- In southern and central New Brunswick, including urban areas like Fredericton, Saint John, Moncton, and surrounding communities, the Liberals continue to lead, building on their 2024 election gains.
- Among rural voters, the race is closer, but the Liberals still hold the advantage overall.
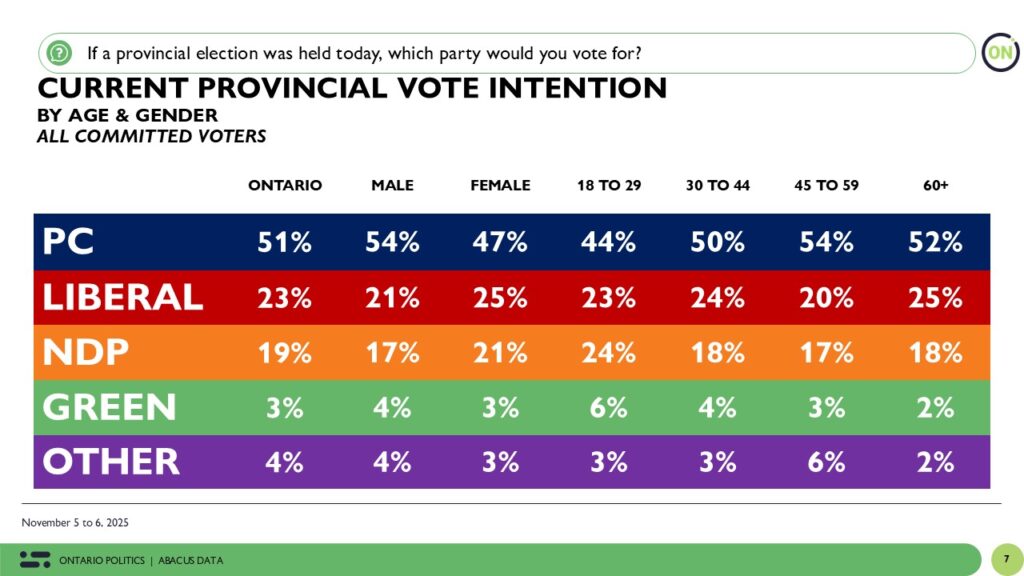
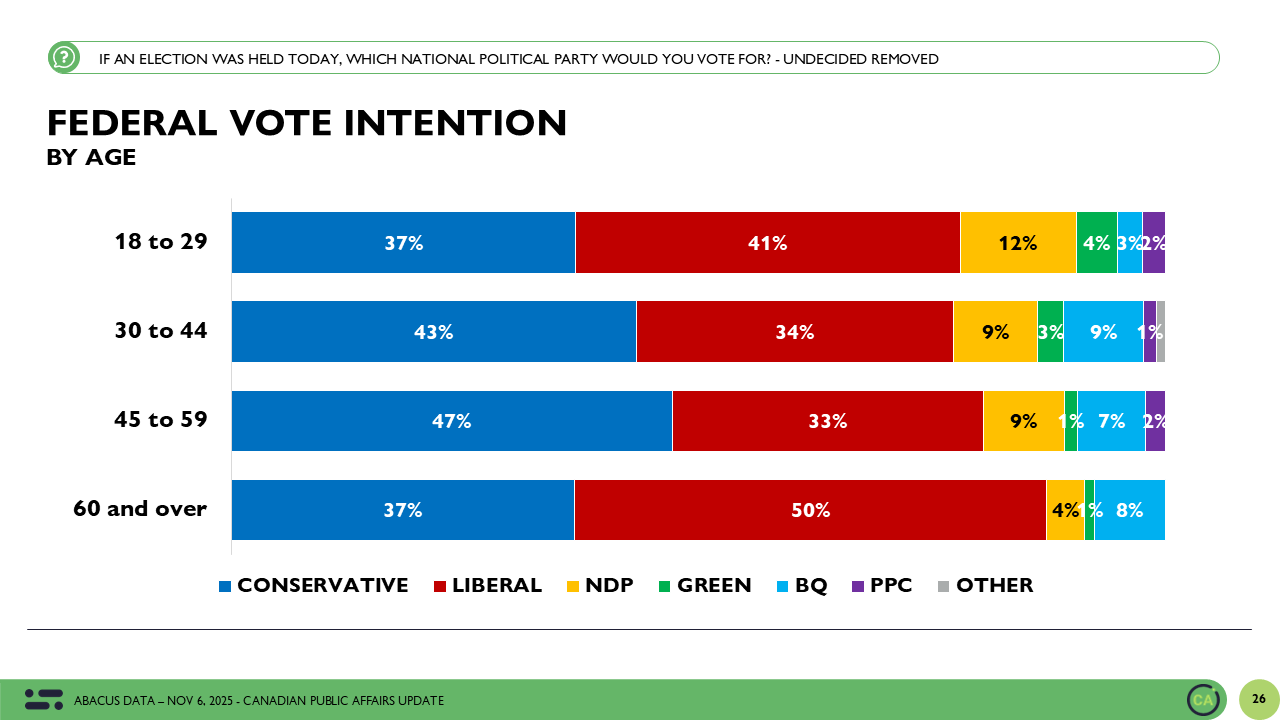
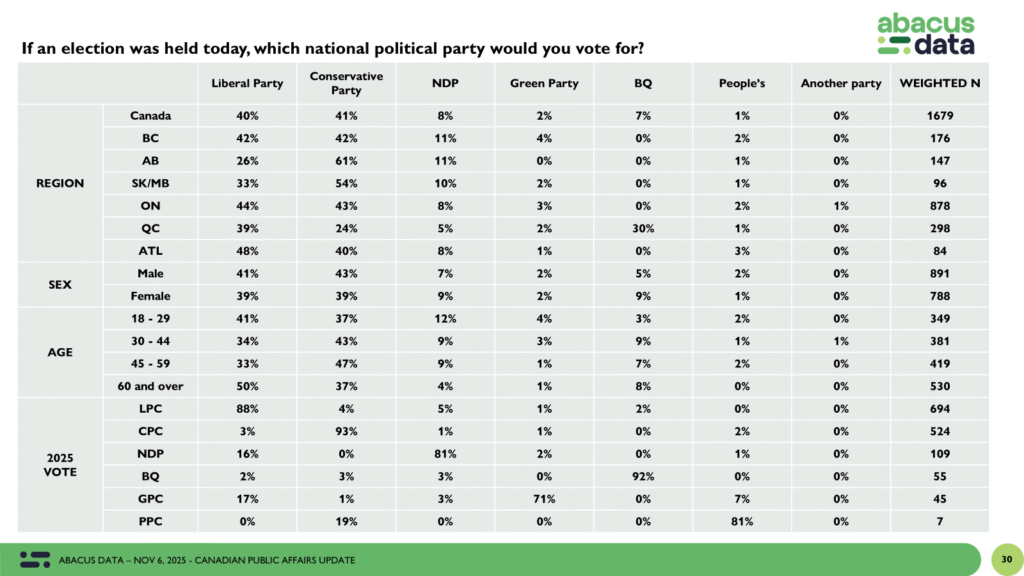
Age also continues to be a factor. Among younger voters under 45, the Liberals have picked up some support since the election, reflecting strong engagement with voters open to collaborative and forward-looking leadership. Among older voters, support for the party remains high, suggesting that Holt’s leadership appeals across generations.

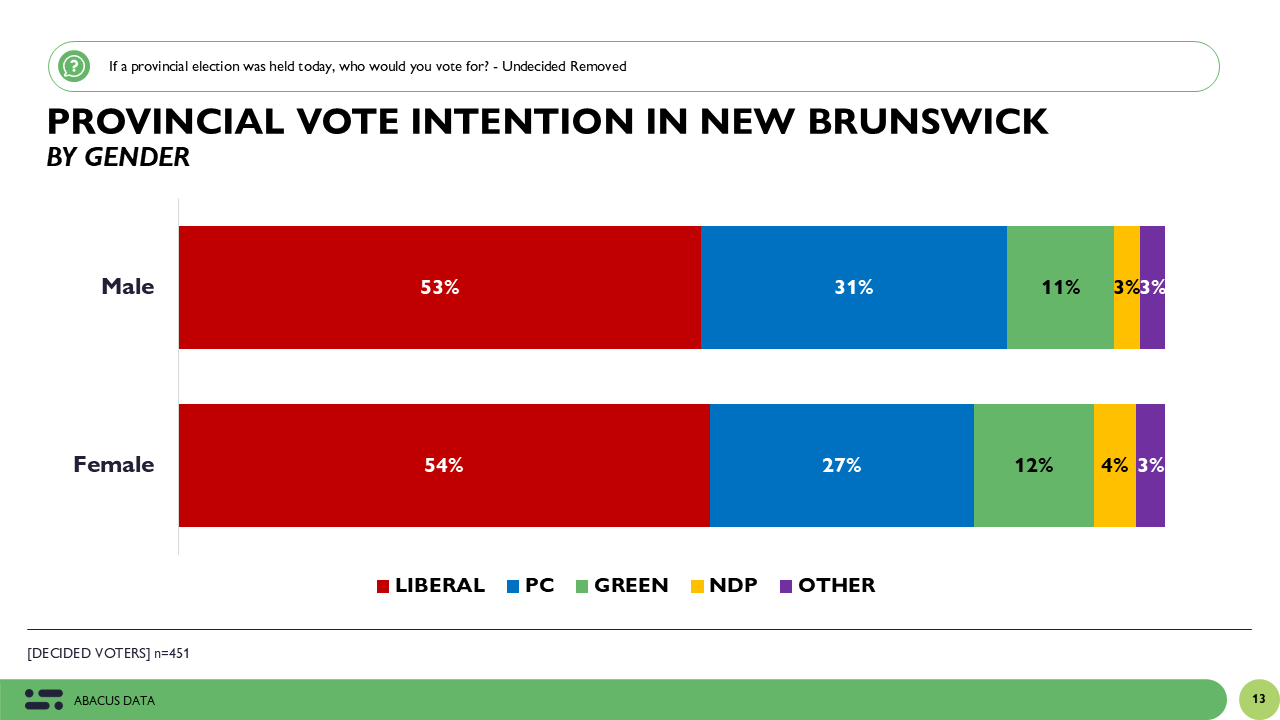
Gender differences also continue to surface. Women express higher approval of the Holt government and are more likely to say they would vote Liberal if an election were held today. Men are more evenly split between the Liberals and Progressive Conservatives, but the Liberals continue to lead among both groups.
This combination of regional, age, and gender appeal underscores the Liberals’ broad coalition and helps explain their political resilience after a year in office.
Leader Impressions
The Liberals also have the most popular leader.
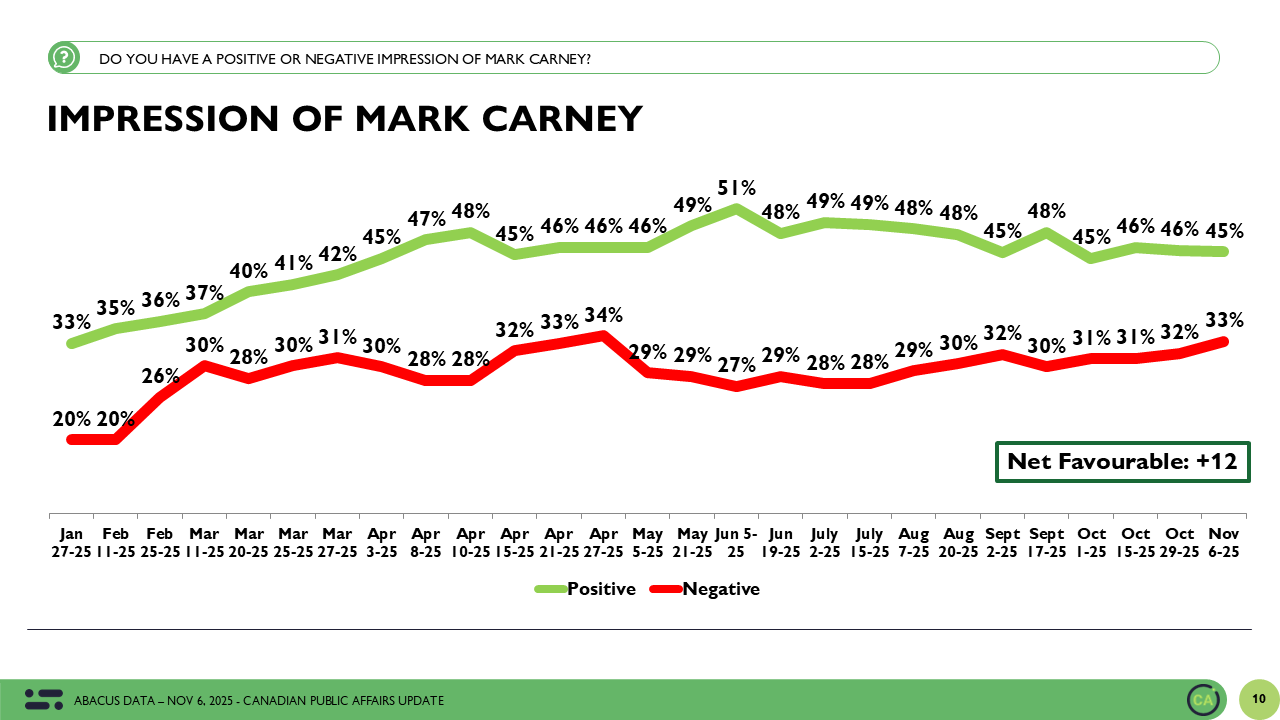
The current Premier Susan Holt is well-known and well-regarded across the province, with a net impression score of plus 21. This a strong result for any governing leader, and especially in a year like 2025.
Green Leader David Coon is also well-liked, recording a positive net score of plus 9.
Interim PC Leader Glen Savoie and NDP Leader Alex White are less well-known and therefore have higher neutral and unsure results.
And not surprisingly, U.S. President Donald Trump is extremely unpopular, with a current net impression score of negative 72 in the province.
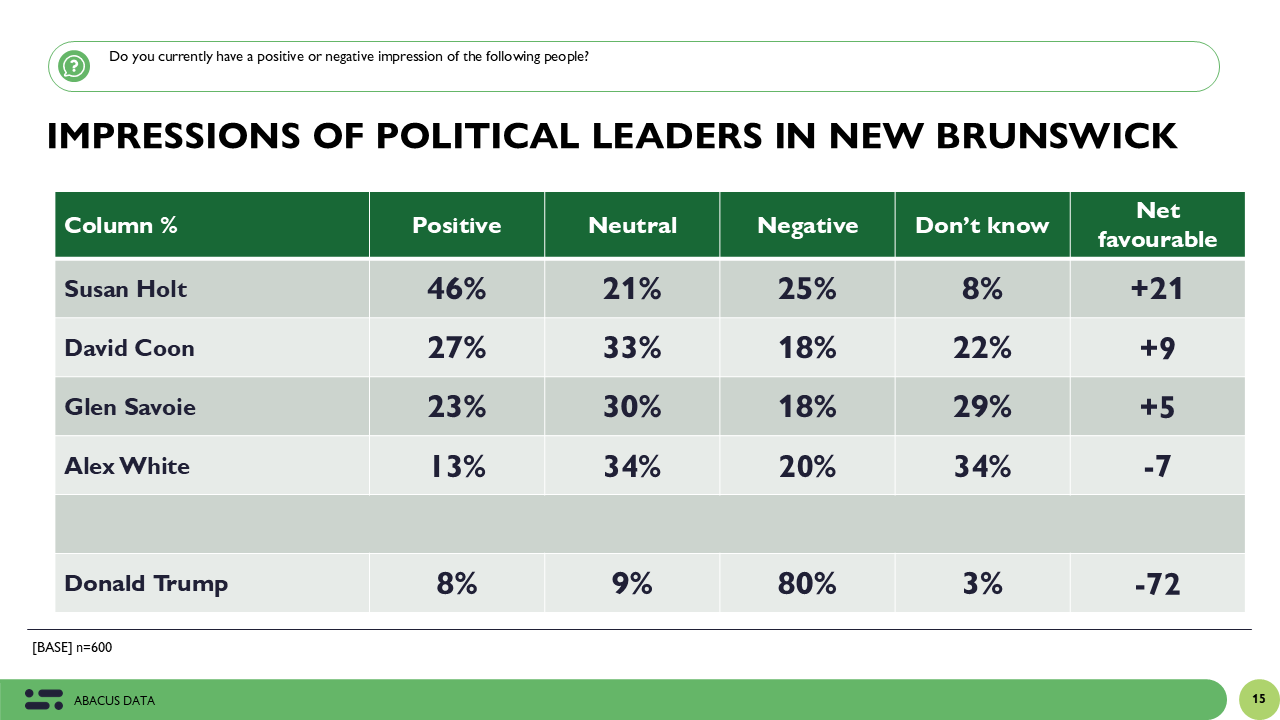
These findings only add to the governing party’s advantages, with no other leader coming close to Premier Holt’s name recognition or likeability.
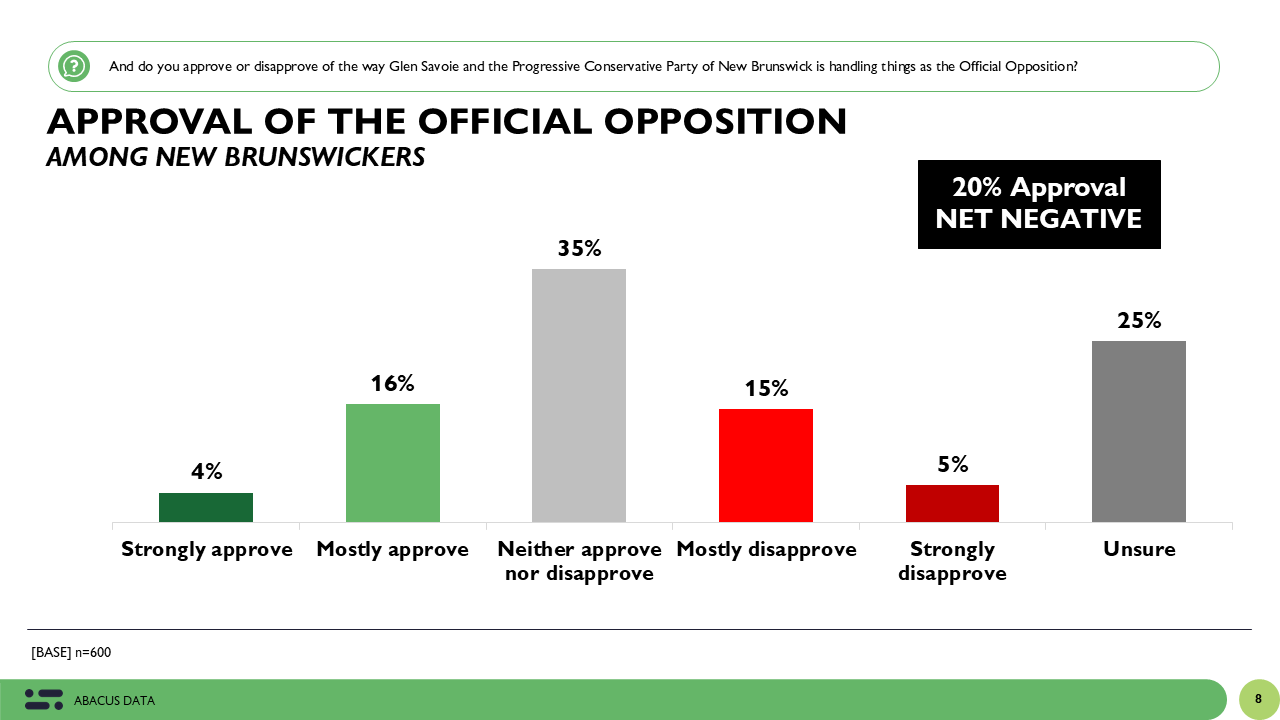
The Opposition: Searching for Direction
What about the Progressive Conservatives?
Twelve months after the last election, the PCs, under Interim Leader Glen Savoie, remain the primary alternative to the Liberals, but they are still rebuilding after last year’s big election loss.
Public familiarity with the interim leader remains limited, and only 20% of New Brunswickers express approval of the Official Opposition’s recent performance, with slightly more disapproving (21%), although only by a difference of one-point.
The party’s upcoming leadership race represents both an opportunity and a risk for the PCs: an opportunity to renew its message and reconnect with voters, and a risk of internal division if the contest becomes fractious.
Until a new leader is chosen, the PCs may struggle to command public attention in a province where the governing party continues to enjoy strong approval.
And what about the other opposition parties?
The Greens continue to attract stable support, particularly among younger and urban voters, while the NDP remains much further behind.
Public Mood: Cautious Optimism
Beyond vote intention, what is the mood in New Brunswick this fall?
It’s cautious optimism.
Like all Canadians, New Brunswickers are deeply concerned about larger geo-political events like Trump’s return to the White House and the U.S. trade war.
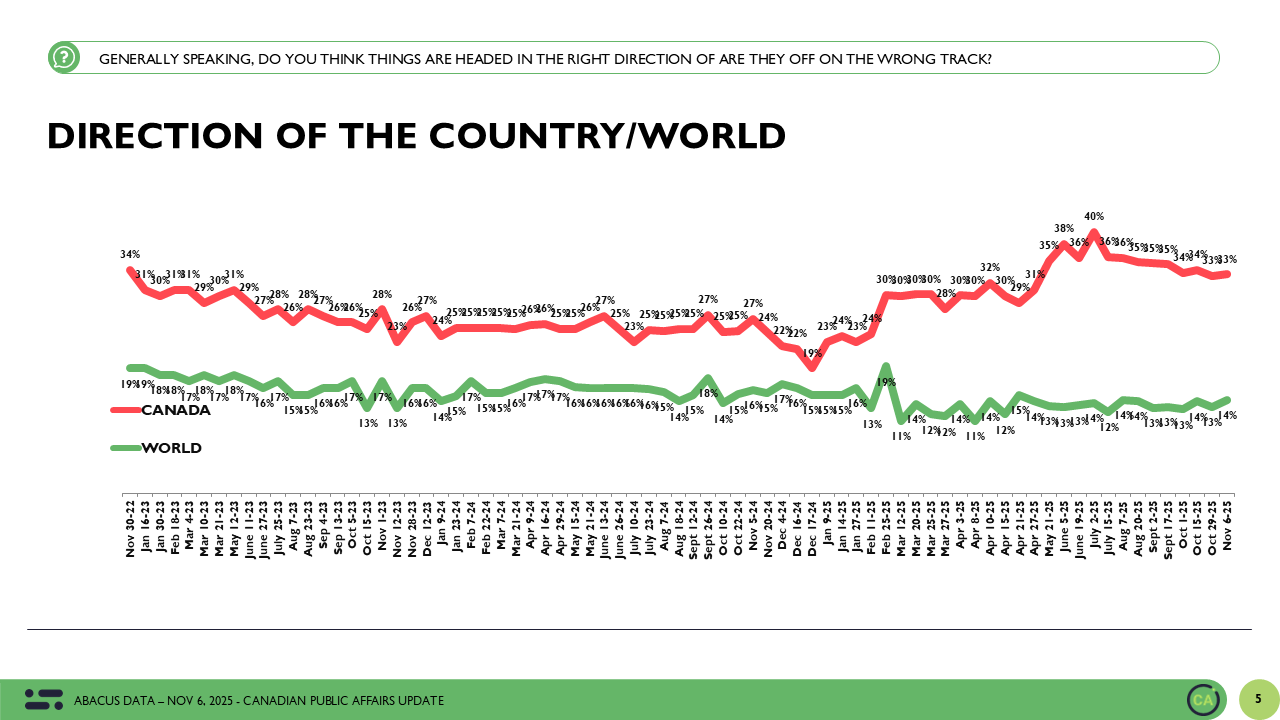
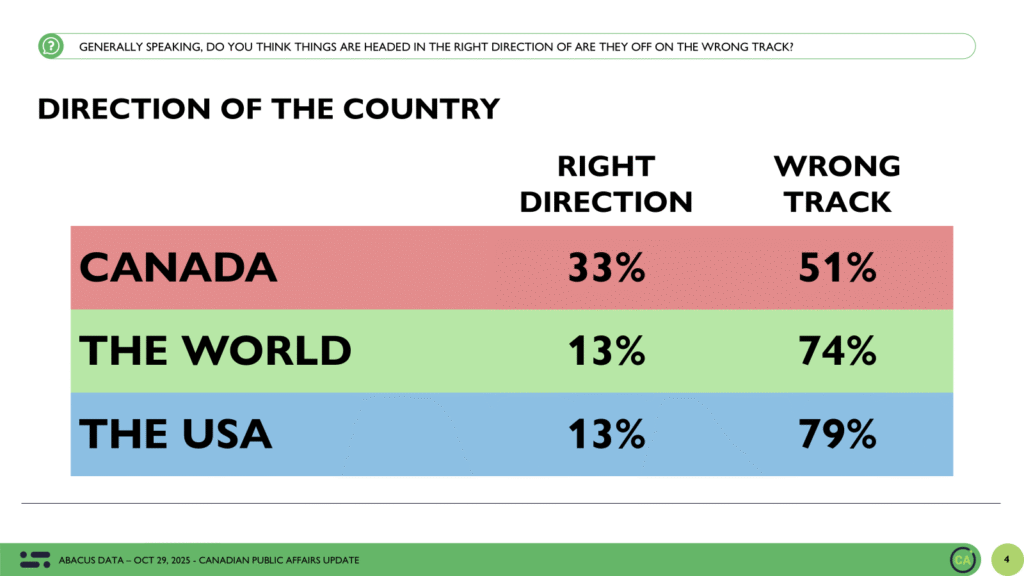
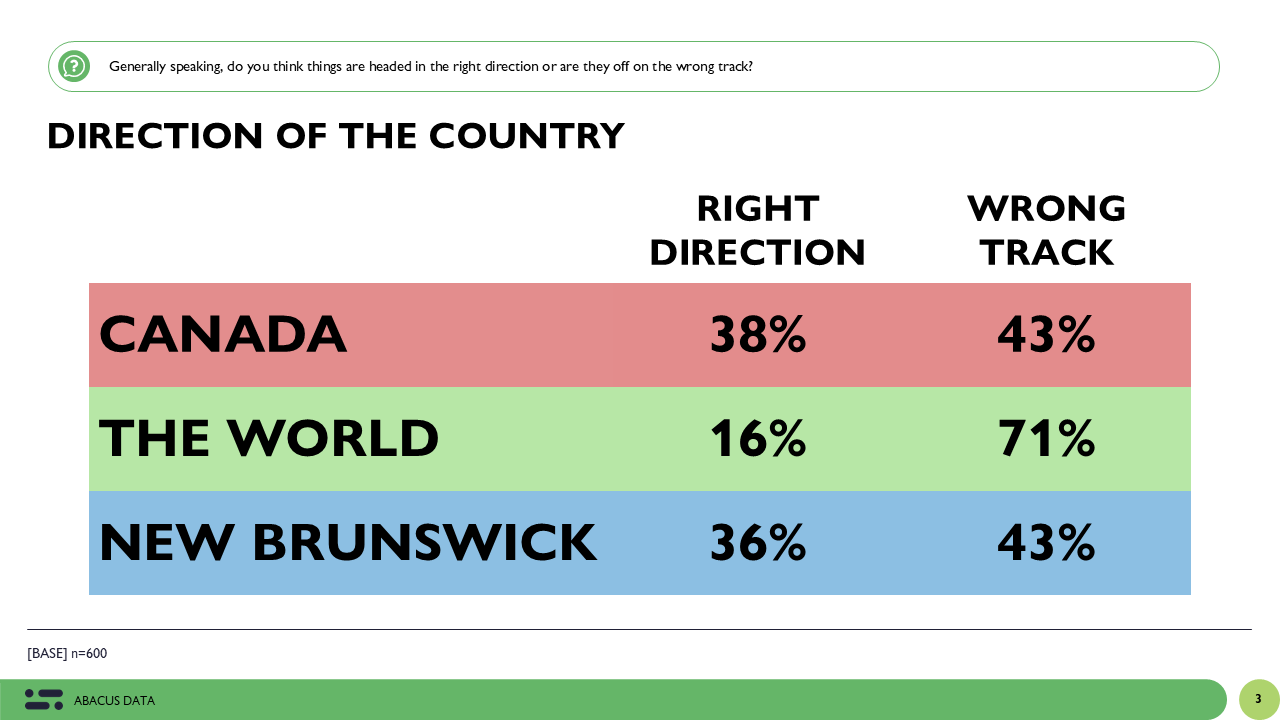
When asked whether things are mostly on- or off-track in the World, 71% of New Brunswickers choose the wrong track.
When asked to think specifically about Canada and their home province, the results are a bit better, but not overly optimistic.
38% of New Brunswickers think things in Canada are headed in the right direction and 36% think things in their home province are on-track.
What is driving concern in the province? It’s a combination of things.
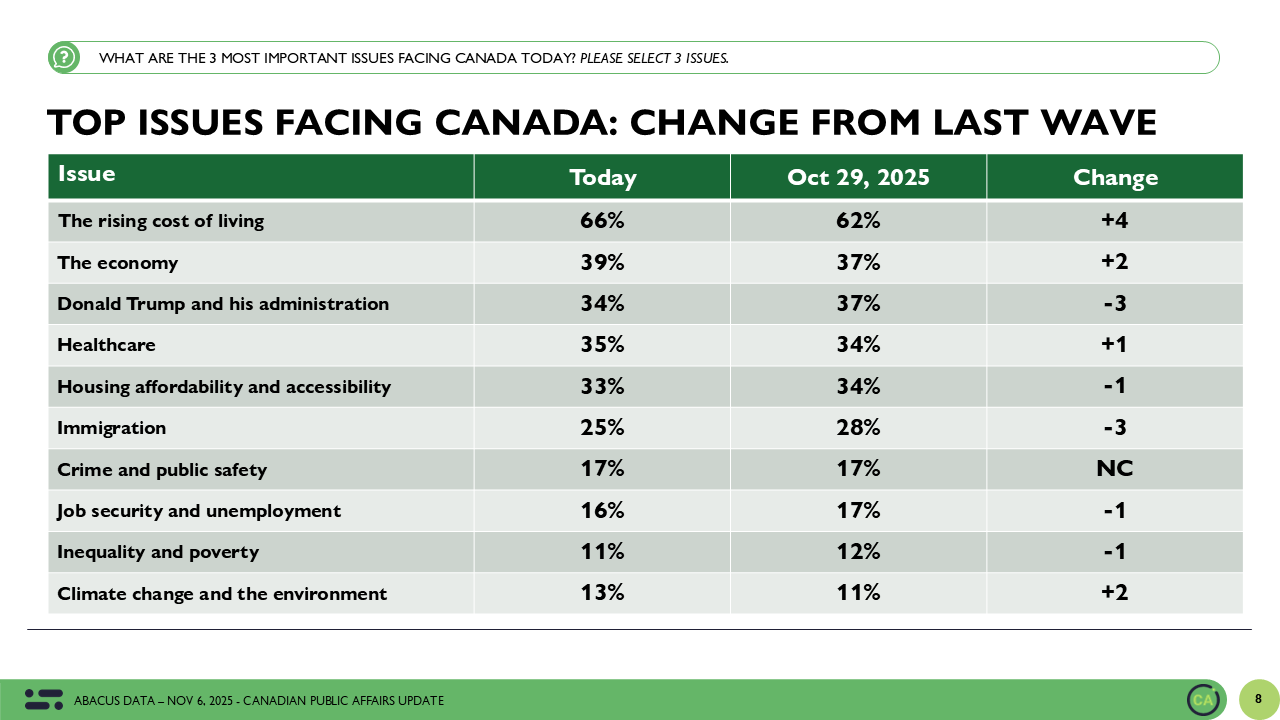
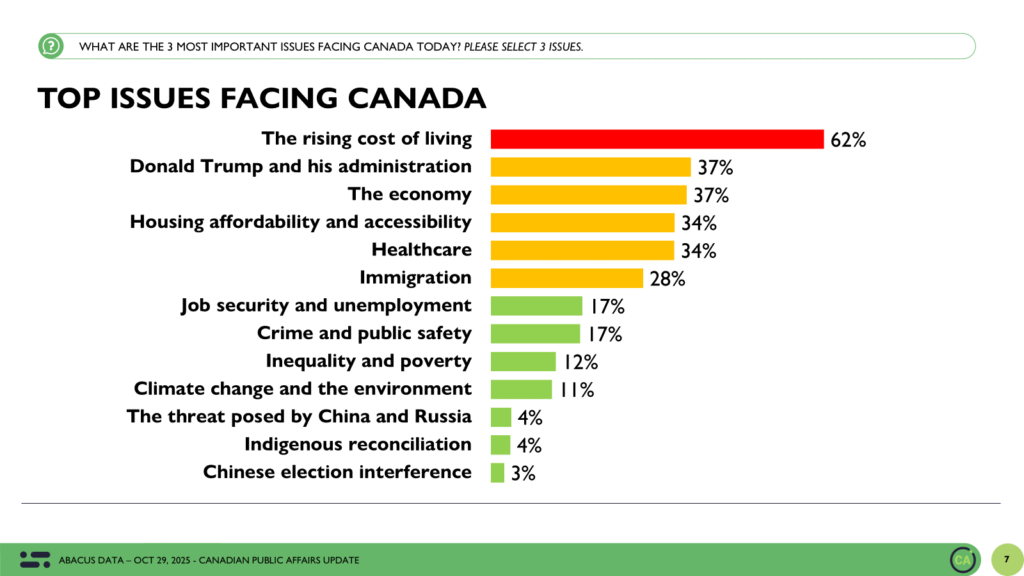
When New Brunswickers are asked what story in the news is most likely to keep them up at night, the most common answers are: Trump and the U.S. trade war, the economy, and inflation.
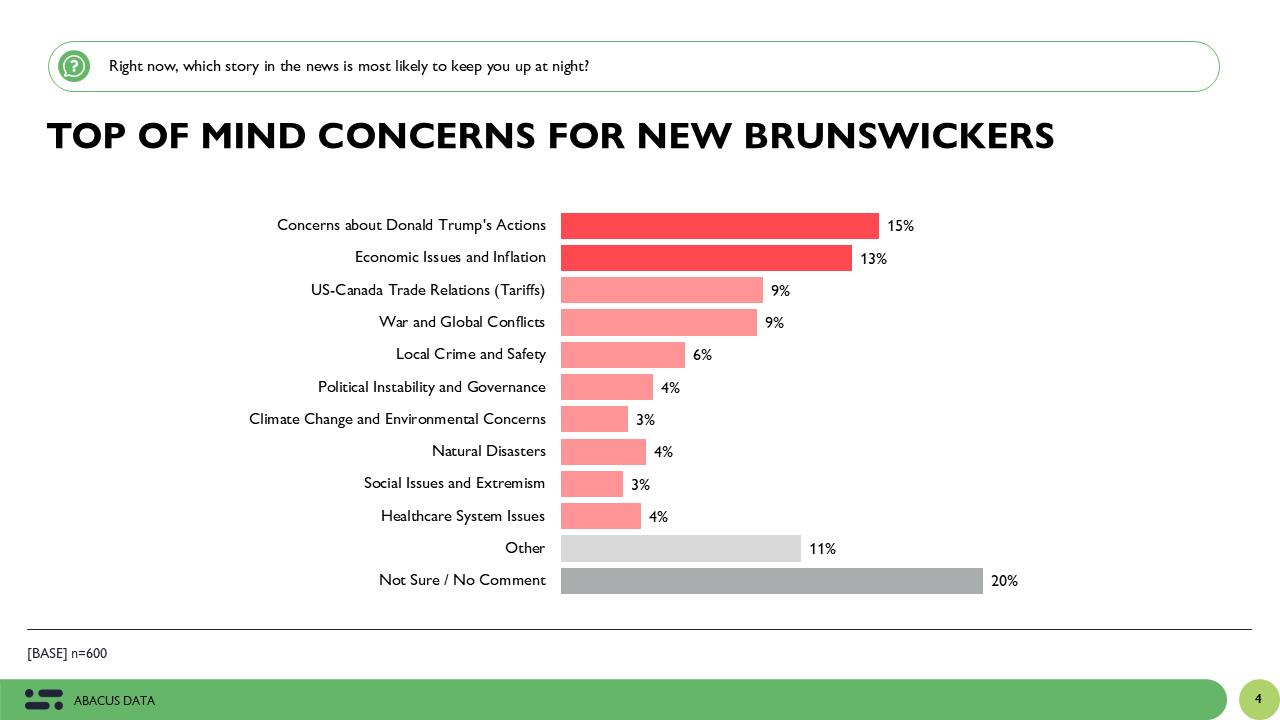
This trio of issues is definitely driving dissatisfaction in New Brunswick, making everyday life as well as the future seem more precarious.
However, there is also a sense that the Holt government is handling some of these issues responsibly and acting with purpose.
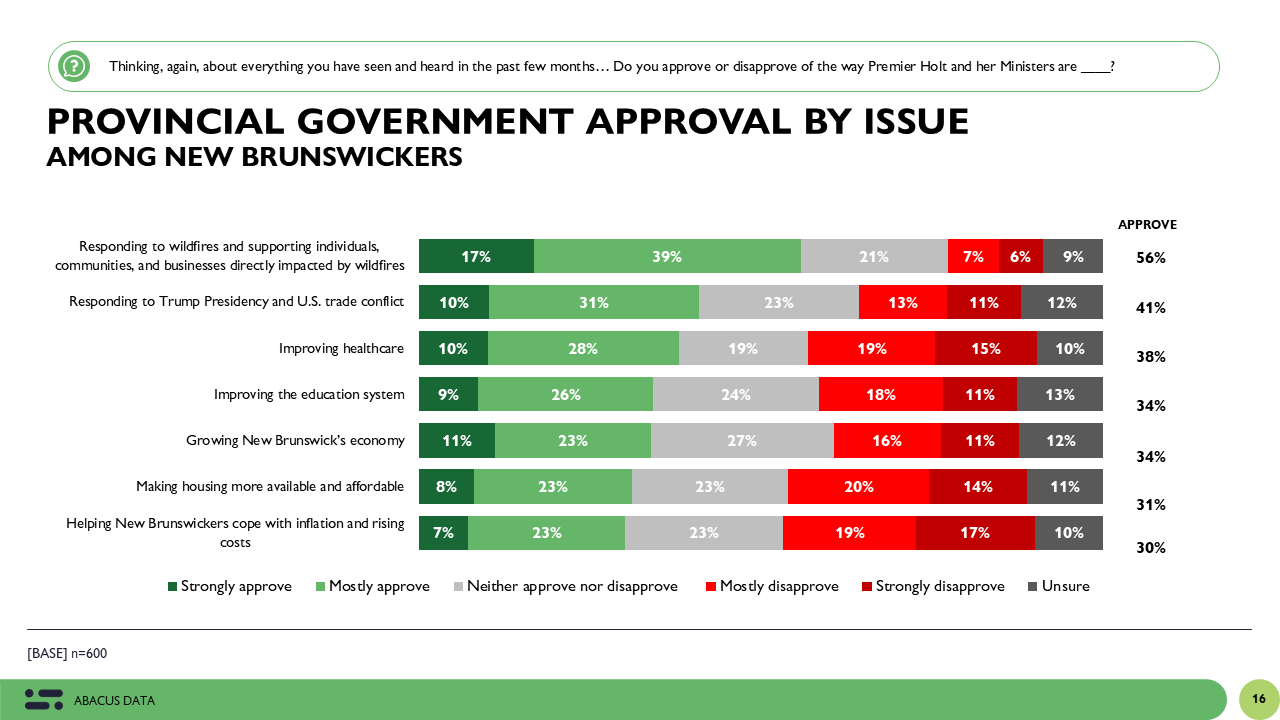
Holt Government Strong on Responding to Wildfires and Trump, Weak on Housing and Affordability
When asked to rate the recent performance of the Holt government in specific areas, 56% of New Brunswickers approve of the way Premier Holt and her Ministers responded to the wildfires that broke out last summer and caused significant damage.
41% also approve of the way the Holt government is dealing with Trumps’s threats and the U.S. trade war – giving them reasonably good marks in that area too.
Approval in other priority areas – such as improving healthcare, education, and growing New Brunswick’s economy – is more moderate (sitting in the mid-high 30s), with housing and the cost of living being the biggest areas for improvement (in the low 30s).
Falling a Bit Short of Own Expectations for Governing
When it comes to opinions about the way the Premier and her Minsters are governing, the results are also mixed.
43% agree that the Holt government has “hit the ground running since being elected.”
40% approve of the way they’re consulting and communicating with the public.
39% think they’re doing a good job of building trust.
And 38% agree that the “Holt government is putting people at the centre of decision-making” and “we are starting to see positive change happening in New Brunswick.”
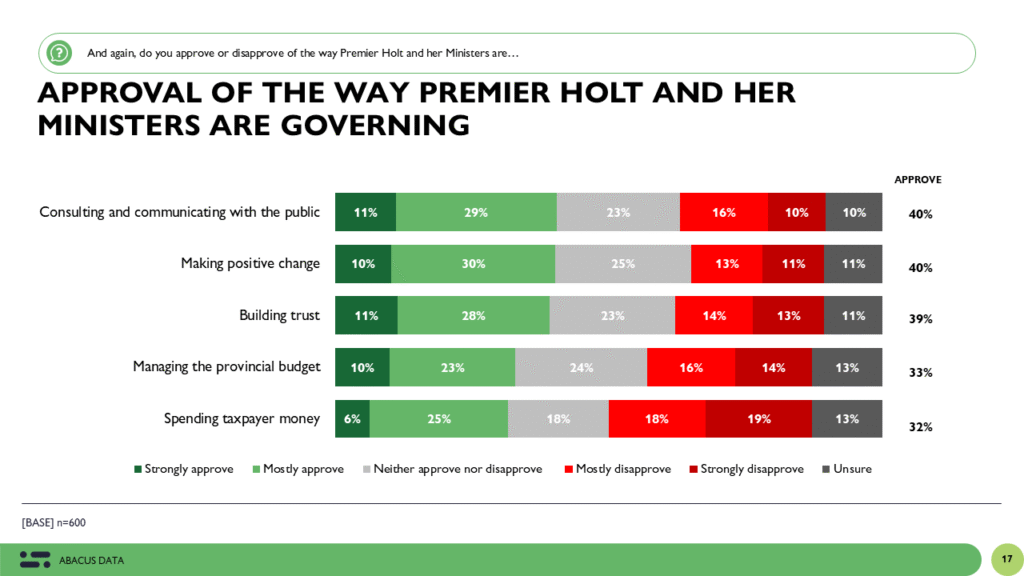

These are good results, but not outstanding ones for a government that has consistently emphasized the need for significant change and a different style of governing.
All eyes are now on the Holt government to show New Brunswickers what makes them better decision-makers, as they push their fall agenda forward and manage the business of the day.
The Upshot
One year into governing, Premier Susan Holt and the New Brunswick Liberals are in a stronger position this fall than they were last October. Support for their leadership is broad and stable across the province, and the opposition remains divided.
These results, collected right after the 2025 Throne Speech was delivered, also show that New Brunswickers are mostly on-board with the way that the Holt government is adjusting its plans to meet the current moment.
Holt’s party is starting their second year in office with the kind of leader, political capital, and goodwill that they need to “be bold” and deliver the significant change that they’ve promised. Showing New Brunswickers that they are, in fact, doing things differently and putting people at the centre of the decision-making is now the challenge as well as addressing affordability and housing concerns in a meaningful way.
About the New Brunswick Omnibus Survey
For Abacus Data, this release marks an exciting milestone: It’s our first public release from the New Brunswick Omnibus Survey, part of our ongoing investment in Atlantic Canada. With offices in Ottawa, Toronto, and Halifax, and with Kelly Bennett leading our Atlantic practice, Abacus Data continues to deliver high-quality, public opinion and marketing research that helps clients and the public understand the attitudes shaping this region’s future.
This research was conducted by Abacus Data through our New Brunswick Omnibus Survey, a new addition to our expanding portfolio of Atlantic Canadian products. The omnibus is a regularly scheduled survey, conducted in both French and English, with a representative sample of 600 New Brunswick residents (age 18 and over).
The survey was fielded online from October 24 to 30, 2025, using a random sample of panelists drawn from partner panels based on the Lucid exchange platform. The margin of error for a comparable probability-based random sample of this size is ±4.0 percentage points, 19 times out of 20. The data were weighted by age, gender, and region to ensure they reflect the province’s population according to the latest census data.
ABOUT ABACUS DATA
We are Canada’s most sought-after, influential, and impactful polling and market research firm. We are hired by many of North America’s most respected and influential brands and organizations.
We use the latest technology, sound science, and deep experience to generate top-flight research-based advice to our clients. We offer global research capacity with a strong focus on customer service, attention to detail, and exceptional value.
And we are growing throughout all parts of Canada and the United States and have capacity for new clients who want high quality research insights with enlightened hospitality.
Our record speaks for itself: we were one of the most accurate pollsters conducting research during the 2021 Canadian election following up on our outstanding record in the 2019, 2015, and 2011 federal elections.
Contact us with any questions.
Find out more about how we can help your organization by downloading our corporate profile and service offering.