Abacus Data is Hiring: Vice President, Insights
Role Summary
Position: Vice President, Insights
Location: Remote-Hybrid (Canada-based)
Typical Compensation Package: CA $162,000 – $190,000
About Us
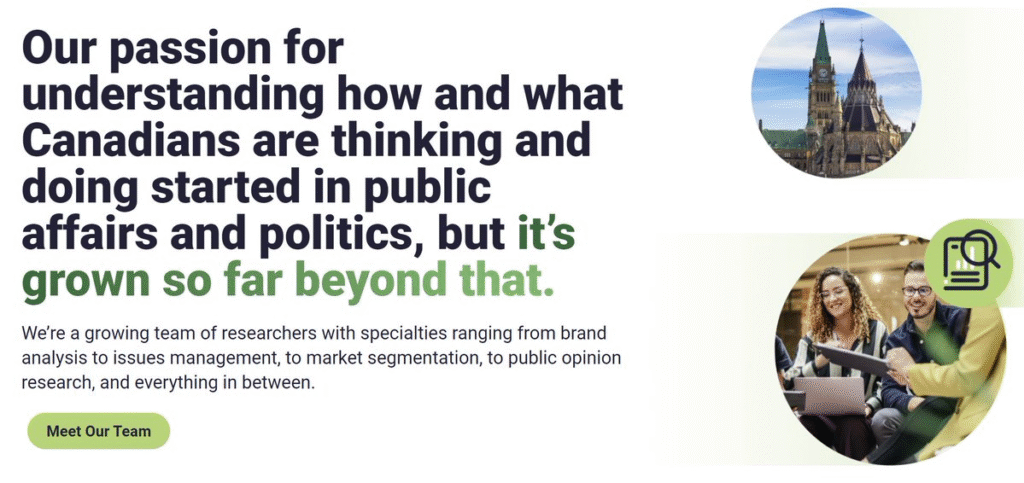
Abacus Data is a full-service public opinion and market research consultancy trusted by business leaders, advocacy organizations, and governments across Canada. Under the leadership of David Coletto, we help clients understand people – their beliefs, expectations, decisions, and behaviour – and translate that understanding into stories & strategies.
Our approach merges rigorous methodology with vivid, actionable insight. We combine qualitative depth with quantitative scale, grounded in a clear grasp of Canadian public sentiment. We move fast, make complicated issues accessible, and deliver research that helps leaders act with confidence. As we continue to expand and deepen our advisory work, we are adding a senior leader to guide and grow our public affairs, consumer and corporate research practices.

The Role
You will lead major research and advisory engagements focused on public affairs, corporate reputation, and stakeholder understanding. You will shape and elevate our advisory offering in a dynamic market and work with the rest of the team to drive our business strategy forward. Being a VP at Abacus means you are not merely working client files, you are part of the team deciding on the future of our business and how to execute on it.
In this role, you will:
Lead large-scale client engagements from design through delivery, with research grounded expertise in communications, policy, and business strategy.
Manage your roster of clients as its dedicated ongoing strategic partner through deep relationship building, continually adding value and going above and beyond simple report delivery. It’s an approach we call Enlightened Hospitality and it’s at the core of the Abacus Data promise.
Co-lead a high-performing and fast paced research team, ensuring outputs with analytical rigor, insightful interpretation, and compelling storytelling present in every product you ship.
Support business development through proposals, thought-leadership and relationship building with new and existing clients.
Ensure work is delivered on time, on budget, and to top-tier standards.
Contribute to continuous improvement in our research processes and product design.
While this role is primarily remote, occasional travel to Ottawa & Toronto will be necessary and some preference may be given to candidates more geographically accessible to Ontario.
Who You Are
You’ve built a career in research and consulting long enough to know the craft & clients intimately. You don’t need a playbook to understand what good looks like because you’ve delivered it repeatedly. You can walk into a complex file, orient quickly, and start adding value without waiting for someone to explain the basics. You’re comfortable owning decisions, guiding clients with confidence, and shaping a team’s focus. In summary; you come ready to contribute as a fully formed practitioner.
To us this means you have:
At least 7-10 years of relevant experience in public opinion research if not more, working in corporate reputation, stakeholder insights, public affairs, or adjacent fields, ideally in a consultancy or agency environment.
If currently in an adjacent role (in house research, strategy, communications), some previous agency or consultancy experience (~5+ years) in an explicitly market research consulting capacity.
Skills in qualitative and quantitative research design and interpretation.
Exceptional communication & writing skills – both author & public speaker.
Confidence developing new client opportunities and strengthening long-term relationships.
Some experience managing multidisciplinary teams and nurturing professional growth, though consulting experience is the primary consideration for this role.
Experience with Q Research Software (a bonus – not required).
A demonstrable expertise and interest in some facet of consumer research or public affairs.
A relevant graduate degree (asset), though deep practical expertise and leadership is most important.
Want to grow with us by living the Abacus Data promise to our team, our clients, our content community, and our suppliers.
What We Offer
This role is built for someone who thrives with autonomy and accountability. You’ll set your own schedule, manage your workload like the senior leader you are, and take time off responsibly in alignment with client and business needs. We trust you to balance flexibility with performance delivering excellent work while shaping how and when you do it. By joining our team you will get:
- A senior leadership role with influence over practice direction and market growth.
- A total compensation package within a pay band of CA $162,000-190,000, consisting of a base salary and performance-based incentives tied to engagement success and growth contribution.
- A primarily remote & highly flexible working model adaptable to your needs and schedule.
- Work that informs important conversations and decisions nationwide.
- A bright, collaborative team that values rigour and excellence, creativity, and continuous learning.
- Generous benefits & vacation time.
How to Apply
Please send us a succinct résumé and a brief email to ihor@abacusdata.ca outlining your fit for the role. A cover letter is not required – we are looking to start conversations with qualified professionals who can demonstrate fit.
Email: ihor@abacusdata.ca
Subject Line: Vice President, Insights #28796
Application Deadline: Open until filled – early applications before Dec. 12th strongly encouraged.