From July 31 to August 7, 2024, Abacus Data conducted a national survey of 1,550 adults exploring several topics related to Canadian politics and current events as part of our regular national omnibus surveys.
In this survey, we asked 239 back-to-school shoppers about their budgets and how they are feeling as the school year approaches and compared the results to last year.
On average, each Canadian shopper will be spending approximately $304.4 on back-to-school shopping this year ($20 more than in 2023). On average, those with more than one child will be spending approximately $60 more on back-to-school shopping than those with only one kid. Given that the average typical spend on one child is over $277, it is evident that many of those shopping for more than one child are doing so with a similar budget as those shopping for one, likely finding ways to cut back or find efficiencies.
Compared with 2023, those who say they will be spending more this year on back-to-school necessities has doubled. This reflects how rising prices continue to impact consumer spending.
Most back-to-school shoppers will have to budget their spending this year. Over half of back-to-school shoppers (56%) will have to budget their shopping this year, with 15% shopping beyond their means in order to purchase all of the needed supplies (+5 from 2023). 4% (or approximately 1.6 million Canadians) are certain that they will not be able to afford all of the necessary supplies their child(ren) needs.
When asked to consider how different factors are impacting their back-to-school budget this year, inflation, and the cost of other essentials (such as food and housing) continue to have the biggest impact on their budgets. 76% of back-to-school shoppers feel the cost of other essentials is having a major impact on their budget (+6 from 2023), and 81% feel the same way about Inflation (+5 from 2023).
In order to mitigate some of these concerns, many Canadians will be taking advantage of promotions, loyalty programs, and sales while back-to-school shopping. Only 13% of Canadian back-to-school shoppers do not plan on taking advantage of these offers.
71% will be taking advantage of in-store or online discounts, promotions, and sales.
45% plan on using their credit card or store points that they have earned throughout the year
16% will be using pay later payment plans such as PayBright, Afterpay, Klarna, etc.
However, even with these payment options and promotions, only three-quarters of Canadians (74%) are confident that they will be able to purchase all of the materials and supplies their child(ren) needs for this upcoming school year (-2 from 2023). Of those who are not feeling confident, half are certain that they will not be able to afford everything their child(ren) needs, while the other half remains uncertain. This represents over 9 million Canadians who are not confident that they will be able to afford everything their child(ren) needs for the upcoming school year.
Upshot
With the cost of living and inflation being top-of-mind concerns for many Canadians, back-to-school shopping is more daunting than ever before. And, with a sizeable number of Canadians concerned that they will not be able to afford all the supplies their child needs, many may look for assistance from back-to-school supply drives. No student should be limited by their parent’s income, especially when it comes to their education. That’s why it is more important than ever that those in more fortunate circumstances give back to their community and help ensure every child arrives on their first day of school, fully prepared for the school year ahead.
Here at Abacus Data, we have chosen to donate extra school supplies to the Start2Finish Backpack drive, which provides vital school supplies to thousands of kids who begin the school year without the proper essentials.
Methodology
The survey was conducted with 1,550 Canadian adults from July 31 to August 7, 2024. A random sample of panelists were invited to complete the survey from a set of partner panels based on the Lucid exchange platform. These partners are typically double opt-in survey panels, blended to manage out potential skews in the data from a single source.
The margin of error for a comparable probability-based random sample of the same size is +/- 2.489%, 19 times out of 20.
The data were weighted according to census data to ensure that the sample matched Canada’s population according to age, gender, educational attainment, and region. Totals may not add up to 100 due to rounding.
This survey was paid for by Abacus Data Inc.
ABOUT ABACUS DATA
We are Canada’s most sought-after, influential, and impactful polling and market research firm. We are hired by many of North America’s most respected and influential brands and organizations.
We use the latest technology, sound science, and deep experience to generate top-flight research-based advice to our clients. We offer global research capacity with a strong focus on customer service, attention to detail, and exceptional value.
And we are growing throughout all parts of Canada and the United States and have capacity for new clients who want high quality research insights with enlightened hospitality.
Our record speaks for itself: we were one of the most accurate pollsters conducting research during the 2021 Canadian election following up on our outstanding record in the 2019, 2015, and 2011 federal elections.
In politics, a “third rail” is an issue that’s so volatile, so dangerous, that politicians are afraid to touch it. The firm Abacus Data has just come out with a new poll that looks at the “third rails” of Canadian politics — the issues that would make people vote for or against a political party who promised that idea. And some of their findings — and the way they cut across the political spectrum — are actually pretty surprising. David Coletto, the founder, chair and CEO of Abacus Data, breaks down those findings and what they may mean about the state of the country.
From August 14 to 18, 2024 Abacus Data conducted a national survey of 2,300 Canadian adults exploring several topics related to Canadian politics and current events as part of our regular national omnibus surveys.
In this edition, we ask about our usual trackers, along with questions about what motivates Canadians to support the Conservative Party and the NDP, as well as questions about strategic voting.
Vote Intention: Conservatives remain well ahead, lead by 17 over the Liberals
The gap between the Conservatives and the Liberals remains largely unchanged, as Conservatives lead Liberals by 17 points nationally.
If an election were held today, 42% of committed voters would vote Conservative, while 25% would vote for the Liberals, 18% for the NDP, and 5% for the Greens. The BQ continues to hold 30% in Quebec.
As in previous surveys, every party’s vote share remains consistent, with very minor changes, as the Conservatives are down 1 and the Liberals are up 2, all within the margin of error.
Regionally, the Conservatives continue to lead across all regions. In our last survey, the Conservatives and the BQ were statistically tied in QC. The story is very much the same although we have the Liberals and BQ now statistically tied with the Conservatives three points back.
Learn about the game-changing tool from the Abacus Data team that makes it possible to estimate polling results to the riding level for improve advocacy and government relations.
Demographically, the Conservatives continue to lead among all groups, as vote intention remains relatively stable. Conservative support remains high at 42% among 30-to-44 (1 point down from our last survey) and 43% among 60-and-over (1 point up).
Conservative support among 18-to-29 remains unchanged, while support among those 45-to-59 is down 4 points, as support for the NDP shifts slightly from the last survey (3 points up).
For the last two waves of tracking, there is a slight gender gap in Conservative support. 47% of men would vote Conservative compared with 38% of women. Liberal support is consistent between men and women while NDP support is 6-points higher among women than among men.
Desire for change has also increased slightly. 86% want change (up 3 points), with 55% believing there’s a good alternative to the Liberals (up 2 points). Only 14% of Canadians believe that Justin Trudeau and the Liberals deserve to be re-elected.
This desire for change is also reflected on impressions of Justin Trudeau which remain negative. After a summer of travels across the country, the overall image of the Prime Minister is the same as it was when the summer started. Today, 24% (down one point) have a positive view of the Prime Minister, while 59% (up 1 point) have a negative impression of the Prime Minister, for a net score of -35.
In contrast, impressions of Pierre Poilievre remain in the net favourable territory. 40% of Canadians have a positive impression of Mr. Poilievre, while 35% have a negative impression, for a net score of +5.
In our last survey, 37% had a negative impression of NDP Leader Jagmeet Singh, the highest we have recorded. Today, impressions have improved slightly, although the shift remains within the margin of error, as 35% have a negative impression. Positive impressions hold at 33%, for a net score sore of -2.
Voting for the Conservative Party…and against Justin Trudeau
In this edition we also asked current Conservative Party supporters whether their motivation to vote Conservative was more about liking Mr. Poilievre and the Conservatives or more about disliking Mr. Trudeau and the Liberals. Very much reflective of Justin Trudeau’s negative impressions, we find that 40% of Conservative supporters say their vote is more about disliking the Prime Minister and the Liberals than liking the Conservative.
More strikingly, of those who voted Liberal in the 2021 election and who would vote Conservative today, 50% say their support is more impacted by their dislike for Trudeau and the Liberals than their affinity for the Conservatives. We also see a that dislike of the Liberals or Mr. Trudeau can even override someone’s dislike or lack of affinity for Mr. Poilievre. 65% of those whose impression of Mr. Poilievre is neutral or negative and plan to vote Conservative say it is because they dislike the Liberals and Mr. Trudeau.
When asked in a follow-up question, how Conservative supporters would react if Prime Minister Trudeau stepped down as Liberal leader, 68% said they would still vote Conservative, “no matter what”. Another 19% say they would probably still vote Conservative but could change their mind. Only 9% would be willing to consider voting Liberal depending on who the new leader is, and none say they would likely vote Liberal if Trudeau stepped down as leader.
Even among those who are motivated to vote for the Conservative Party out of dislike for Trudeau and the Liberals, only 156 would consider voting Liberal if Trudeau stepped down and depending on who was elected leader. This suggests that Trudeau stepping away may not immediately solve the Liberal Party’s problems, but it may allow a new leader to try and persuade people.
For context, those current Conservatives who might consider voting Liberal depending on who a new Liberal leader might be represents 3% of the electorate. Another 7% say they could change their mind away from the Conservatives. That’s a sizeable portion of the electorate.
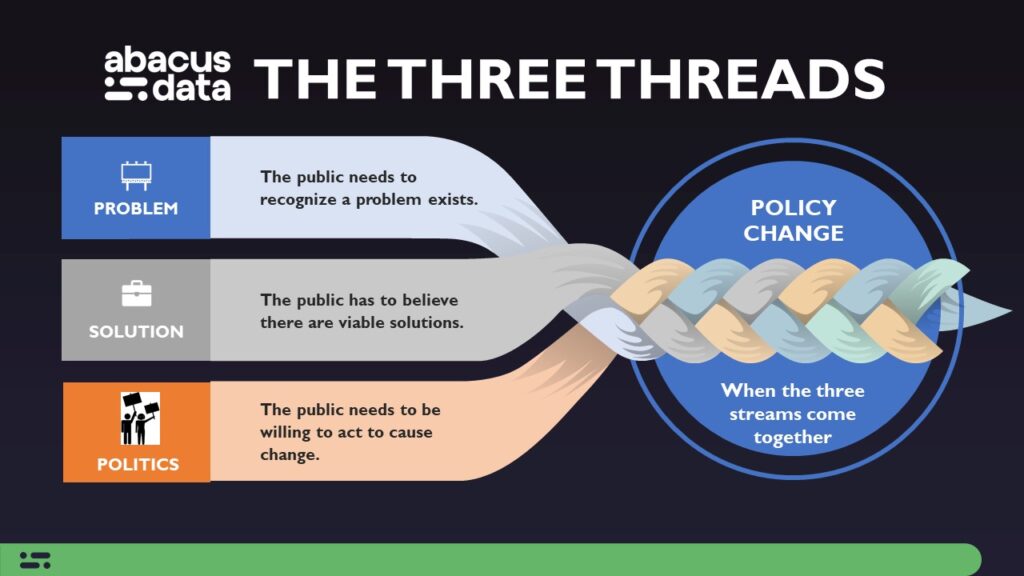
Find out more about the The Three Threads and how the Abacus Data team looks at polling for public affairs and advocacy.
We also posed the same question to individuals who indicated they would vote for the NDP if the election were held today. In contrast to Conservative supporters, NDP supporters are more likely to be motivated by their positive view of Jagmeet Singh and/or the NDP itself, with 79% citing this as their main reason. Only 21% of current NDP supporters are motivated by a dislike of the Liberals.
In term of strategic voting, we asked NDP supporters what would happen if it looked like Mr. Poilievre, and the Conservatives were likely to win the election if the NDP and the Liberals split the vote. 41% said they would still vote for the NDP, while 21% might consider voting Liberal to defeat a Conservative candidate.
Strategic voting increases among those who hold very negative impressions of Poilievre (with 38%).
We also wanted to gauge the possibility of strategic voting. We asked current NDP, Green and BQ supporters the likelihood of them voting Liberal, if it became clear that the Liberal Party had the best chance of stopping the Conservatives from winning the election. We find that 8% of committed of the electorate or 32% of NDP, Green, and BQ voters say they would probably vote Liberal, while 3% of the committed electorate or 14% of NDP, Green, and BQ say they would definitely vote Liberal. If all 11% of these voters switched to the Liberals, the 17-point Conservative lead would shrink to 6-points.
And as we showed earlier, if Prime Minister Trudeau stepped aside, the combination of a new leader and strategic voting could make the election far closer than it appears now. But the odds of that remain quite low, based on our polling.
Interestingly when we asked the likelihood of current Liberal, Green and BQ supporters voting NDP, if it became clear that the NDP had the best chance of stopping the Conservatives from winning the election, we find that 11% of committed voters or 35% of Liberal, Green, and BQ supporters would probably vote NDP, while 6% of the committed electorate or 20% of Liberal, Green, and BQ supporters would definitely vote NDP. If the definitely and probably groups did switch to the NDP, the NDP vote share would rise from 18% to 35%, 7-points behind the Conservatives.
The Upshot
According to Abacus Data CEO David Coletto: “The overall aspects of political opinion in Canada remain very consistent and have remained so for the whole spring and summer. The Conservatives lead by a wide-margin, impressions of Pierre Poilievre remain substantially more positive than Justin Trudeau, and the desire for change is broad and fairly deep. These are the fundamentals of Canadian public opinion today.
But underneath these attributes, our polling this week does indicate the possibility for change if circumstances change.
If Justin Trudeau were to step aside, the Liberals would not instantly leap into contention. But enough current Conservative supporters say they might be persuaded to vote Liberal if that were to happen,
Moreover, the possibility of strategic voting remains. We know from previous polling that Canadians increasingly believe that Poilievre and the Conservatives will win the next election. But there is less clarity on which party (Liberal or NDP) has the better chance at defeating them. If that view crystalizes, we show that a sizeable portion of voters in the Liberal, NDP, Green, and BQ voter universe could coalesce around one option and if the Liberals change leaders, that could drive some current Conservatives into the new leaders arms.
Now this is all hypothetical and depends on several variables we can’t easily measure or gauge.
What is clear, and has been for over a year now, the most likely outcome after the next election is a change in government. The Conservative Party’s lead is truly national, and crosses all demographics. But that lead is built on 4 in 10 of its supporters being motivated more by rejecting the government than embracing the alternative. There is still space for that outcome to change, no matter how unlikely it might be.”
Methodology
The survey was conducted with 2,300 Canadian adults from August 14 to 18, 2024. A random sample of panelists were invited to complete the survey from a set of partner panels based on the Lucid exchange platform. These partners are typically double opt-in survey panels, blended to manage out potential skews in the data from a single source.
The margin of error for a comparable probability-based random sample of the same size is +/- 2.1%, 19 times out of 20.
The data were weighted according to census data to ensure that the sample matched Canada’s population according to age, gender, educational attainment, and region. Totals may not add up to 100 due to rounding.
We are Canada’s most sought-after, influential, and impactful polling and market research firm. We are hired by many of North America’s most respected and influential brands and organizations.
We use the latest technology, sound science, and deep experience to generate top-flight research-based advice to our clients. We offer global research capacity with a strong focus on customer service, attention to detail, and exceptional value.
And we are growing throughout all parts of Canada and the United States and have capacity for new clients who want high quality research insights with enlightened hospitality.
Our record speaks for itself: we were one of the most accurate pollsters conducting research during the 2021 Canadian election following up on our outstanding record in the 2019, 2015, and 2011 federal elections.
What are the “third rail” policy issues of Canadian politics?
The “third rail” of politics refers to a controversial issue that is so politically charged and potentially damaging that touching it can result in severe political consequences, much like the dangerous third rail on a subway track that carries a lethal electric charge.
The phrase “third rail” of politics is often attributed to Tip O’Neill, a former Speaker of the U.S. House of Representatives. He is said to have used it to describe Social Security, implying that any politician who attempted to alter the program would suffer severe political consequences. While the exact origins are not definitively documented, O’Neill’s usage popularized the metaphor.
As Canada’s political parties prepare their election platforms, and advocacy organizations look to influence the agenda and the issue, I thought it might be useful to understand what are the “third rail” issues in Canadian politics.
So on one of our national omnibus surveys in July, I asked Canadians whether a list of policy ideas would make them vote for or against a political party who promised the idea. Specifically, we asked
“In this question, we want you to think about policies that a political party could announce that would completely rule out you voting for that party, EVEN if you like the party’s other policies. For each of the following policies, please indicate if you would vote for the party proposing that policy.”
Respondents could respond one of four ways: They would definitely vote for the party, they might vote for the party, they never vote for that party, or they don’t know.
We included several ideas that may never be proposed but we wanted to test ideas that some would find controversal and others might find appealing.
The full list of policy ideas test are:
Increase income taxes for the richest 1% of Canadians Make public transit free in every Canadian city Make university and college free for all Canadian students Eliminate the federal carbon tax Force religious organizations to pay taxes Abolish the monarchy and establish a republic Eliminate all government funding to the CBC Expand the use of nuclear energy Bring back the dealth penalty Allow people to pay to access most healthcare procedures Add new taxes on sugary beverages Abolish official bilingualism in Canada Tax the profit people make when they sell their primary residence Criminalize abortion Introduce mandatory military service for everyone aged 18 to 20 Raise the eligibility age for retirement benefits like CPP & OAS Legalize the use of all drugs, including hard drugs like heroin and cocaine
Let’s dig into the results
What Pushes and Pulls Voters?
We categorized the policy ideas into three groups:
Vote Winners – Ideas where more people say they would definitely vote for a party that promised it than said they would never vote for that party.
Neutral – Ideas where the push and pull are about equal
Vote Losers – Ideas where those who say they would never vote for a party that promised it clearly outnumbered those who would definitely vote for a party that promised it.
In the vote winner category, raising taxes on the richest 1%, making public transit free in every Canadian city, make university and college free for all Canadian students, eliminating the federal carbon tax, and forcing religious organizations to pay taxes all had far more Canadians indicate they would definitely vote for a party that promised those ideas than those who would never vote for the party.
In the neutral category, abolishing the monarchy, eliminating funding to the CBC, expanding the role of nuclear energy, and bringing back the death penalty all had about equal numbers of Canadians who would definitely vote for a party that promised those and Canadians who would never support a party that did. There was also a sizeable number of people who said they might vote for a party that promised the ideas or were unsure.
Vote losers, or issues we consider “third rail” issues, include legalizing the use of all drugs,raising the eligibility age for retirement benefits, mandatory military service, criminalizing abortion, taxing the profit people make when they sell their primary residence, and abolishing official bilingualism. New taxes on sugary beverages and allowing people to pay to access most healthcare procedures were on the edge but far more would never vote for a party that promised those than definitely would.
Four items in particular – legalizing all drugs, raising the retirement age, mandatory military service, and criminalizing abortion – all had a clear majority saying they would never vote for a party that promised them.
The chart below reports the data into quadrants and shows the group of vote losers compared to the group of vote winners.
Left vs. Right: How do Canadians on either end of the specrtum compare?
As expected, voters on the left and right of the political spectrum react differently to the policy ideas.
The chart below maps the issues based on the percentage of Canadians who self-identify on the right of the spectrum who would never vote for a party that promised the idea against the percentage of Canadians on the left who would never vote for the idea.
Items in the top left repel right-wingers more than left-wingers. Items in the bottom right repel left-wingers more than those on the right, while items in the top right repel both left- and right-wingers equally. Items in the bottom left don’t repel either very much.
What this tell us is that new sugar taxes, for example, are more repelling to those on the right, while the death penalty, defunding the CBC, abolishing bilingualism, eliminating the carbon tax, and paying for health procedures repels the left far more than the right.
Legalizing drugs, taxing gains on primary residences, raising the retirement age, and mandatory military service repels both left and right equally.
The Partisan Drivers: What are “third rails” for Conservative and Liberal voters?
Digging even deeper, when we isolate for Canadians currently supporting the Conservative Party, we find that the biggest losers for them are legalizing all drugs, raising the retirement age, criminalizing abortion, and taxing gains on primary residences. This shows just how risky the abortion issue for Conservatives and the prospect that a Poilievre government might raise the retirement age (which it has not proposed doing).
On the flip side, eliminating the carbon tax is a big winner, alientating only a very small minority of current Conservative supporters. Interestingly, there is fairly wide support for increasing taxes on the top 1% and forcing religious organizations to pay taxes – ideas we would might not normally think are favoured by Conservative-oriented people.
Although Pierre Poilievre has promised to defund English CBC, there could be some risk in that policy if more people become aware of it. 1 in 5 Conservative supporters say they would never vote for a party that promised to eliminate government funding to the CBC, which is not exactly what Poilievre is promising to do but could be perceived that way.
This analysis highlights both the opportunities and risks for the Conservatives as they try to hold onto their new support (our latest poll has them leading by 20-points over the Liberals).
When we look at the 39% of Canadians open to voting Liberal – the audience the Liberals need to convert if they have any chance of winning again – the main “third rails” are criminalizing abortion, abolishing official bilingualism, raising the retirement age, and introducing mandatory military service. These are all issues that the Liberals might use (or haved used) against the Conservatives if they want to pull voters away from the Conservatives or consolidate progressives around them.
Legalizing all drugs is also a “third rail” policy idea for Liberal supporters which explains why the Conservatives have used this issue to try and wedge voters against the Liberal drug policy (which is not to legalize all drugs).
Ideas that pull large numbers of people towards the Liberals could be increasing taxes on the top 1% – although they tried to do this with the captial gains tax changes without much effect. Making public transit free and eliminating tuition fees are other issues that would attract a lot of voters without must risk of alienting accessible Liberals.
Digging Deeper: Looking at Specific Policy Ideas
This section explores several of the issues we tested, looking at the demographic and political dynamics behind them.
Criminalizing Abortion
64% of Canadians say they would never vote for a political party that promised to criminalize abortion, including 56% of those currently supporting the Conservative Party. A majority of both men and women are repelled by this idea, although there is a 13-point difference between men (57%) and women (70%).
Allow People to Pay to Access Most Healthcare Procedures
Changing Canada’s single-payer healthcare system has often been considered a “third rail” of Canadian politics, but the results suggest that’s not true for everyone. Almost 4 in 10 Canadians say they would never vote for a party that promised to do this but 19% say they would definitely vote for a party would would. Another 30% say they might – suggesting a degree of openness to the idea.
Younger Canadians are less repelled by the idea than older Canadians as are men compared with women. Paying for healthcare procedures is certaintly a third rail issue for women, but not so for men. Conservative supporters are also more open to it but even there, about 3 in 10 say they would never for vote a party that promises to do this.
These dynamics – the cross-partisan, cross-demographic opposition to the idea – likely means it is too politically risky to propose and advocate for.
Eliminating the Federal Carbon Tax
Only 19% of Canadians say they would never vote for a party that promised to eliminate the carbon tax. 37% say they definitely would vote for the a party that promised to do this.
Not surprising, Conservatives overwhelmingly love this idea while Liberals and BQ supporters are the most against it, although it’s not a concensus. Interestingly, NDP supporters are the most divided. 27% say they would never vote for a party that promised to eliminate the carbon tax while 25% say they definitely would vote for such a party. The rest are either unsure or say they might vote for that party.
This data confirms that eliminating the carbon tax has become a vote winner for the Conservatives and a real liability for the Liberals.
Raise the Eligibility Age for Receiving Retirement Benefits, such as Old Age Security and the Canada Pension Plan to 70
Raising the retirement age is another “third rail” of Canadian politics. Similar to Tip O’Neil’s warning about anyone touching Social Security in the US. 56% of Canadians say they would never vote for a party that promised to do this including 54% of Conservative supporters, 59% of Liberal supporters, and 61% of NDP supporters. Older Canadians are particularly repelled by the idea with 2 in 3 saying they would never vote for a party that promised this (or maybe even they thought might do it). Younger Canadians (under 36) are far more open to it – although 36% still say it’s a no-go for them.
Legalize the Use of All Drugs, Including Hard Drugs like Heroin and Cocaine
The biggest “third rail” issue in this study appears to be the idea of legalizing all drugs. This is different than decriminalization (although I’m not convinced people understand the difference). 68% of Canadians say they would never vote for a party that promised (and thereby they think might) to do this. Only 8% say they would definitely vote for that party.
78% of Conservative supporters, 65% of Liberal supporters, and 50% of NDP supporters say they would never vote for a party that promised this idea. There is also fairly wide cross-generational and gender agreement that this is a no-go for people.
The Upshot
As we approach the next federal election in Canada, the findings of our study underscore the critical importance of perception in shaping voter behaviour. Even if a political party does not formally propose certain policies, the mere perception that it might or could introduce such ideas can profoundly impact voter decisions. This dynamic is crucial for the main political parties as they strategize for the coming election.
For the Liberal Party, issues like raising the retirement age, criminalizing abortion, or defunding the CBC could serve as potent tools to re-engage their base or at least sway uncommitted voters away from the Conservative Party. By highlighting these issues, the Liberals could create a narrative that paints the Conservatives as a threat on these “third rails”, thereby rallying their supporters and softening the Conservative appeal to those new to the Conservative universe.
On the other hand, the Conservatives have clearly been successful with issues like the carbon tax, which not only energizes their voter base but also creates division among Liberal and NDP supporters. Additionally, drug policy emerges as another area where the Conservatives can both mobilize their own base and potentially weaken the voter coalitions of the Bloc Québécois, Liberals, and NDP. The perception that the Liberals might consider taxing gains on primary residences—whether true or not—illustrates how powerful these perceptions can be as wedge issues in the election campaign.
This exercise also tested ideas that, while not currently proposed by any mainstream party, help us understand how political dynamics and opinions might interact as voters make their decisions. The findings highlight potential wedge issues such as taxing religious organizations, abolishing the monarchy, or defunding the CBC—topics that could provoke strong reactions and influence voter behaviour.
Moreover, the data confirms that policies focused on taxing the rich and making life more affordable remain popular and effective “products” during a campaign.
I think this study is valuable in helping us to understand first, what are some “third rail” issues in Canadian politics but also how other issues could be used to shape the narrative and voter behaviour both federally and provincially. Political managers and public affairs professionals can benefit from digging deeper into perceptions like these to understand how to engage and mobilize the public.
Methodology
The survey was conducted with 2,000 Canadian adults from July 16 to 22, 2024. A random sample of panelists were invited to complete the survey from a set of partner panels based on the Lucid exchange platform. These partners are typically double opt-in survey panels, blended to manage out potential skews in the data from a single source.
The margin of error for a comparable probability-based random sample of the same size is +/- 2.191%, 19 times out of 20.
The data were weighted according to census data to ensure that the sample matched Canada’s population according to age, gender, educational attainment, and region. Totals may not add up to 100 due to rounding.
We are Canada’s most sought-after, influential, and impactful polling and market research firm. We are hired by many of North America’s most respected and influential brands and organizations.
We use the latest technology, sound science, and deep experience to generate top-flight research-based advice to our clients. We offer global research capacity with a strong focus on customer service, attention to detail, and exceptional value.
And we are growing throughout all parts of Canada and the United States and have capacity for new clients who want high quality research insights with enlightened hospitality.
Our record speaks for itself: we were one of the most accurate pollsters conducting research during the 2021 Canadian election following up on our outstanding record in the 2019, 2015, and 2011 federal elections.
Despite BC United’s pledge to eliminate provincial income tax on the first $50,000 earned by people in B.C., the latest polling shows the campaign-style promise has done little, if anything, to recover possible votes.
From August 14 to 16, 2024, Abacus Data conducted a survey of 1,000 eligible voters in British Columbia exploring their views on provincial politics and government. This survey was a standalone survey in which questions about provincial politics came before any questions about federal politics. Stay tuned for results on the federal political questions.
If an election was held at the time of the survey, the BC NDP would likely win another majority government although the 18-point lead we measured in November of 2023 remains much tighter – at only 5 percentage over the BC Conservatives.
The BC NDP has the support of 42% of committed voters, a two point increase from May. The BC Conservatives are second with 37%, up 3 while the official opposition BC United is at 10%, down 3. The BC Greens are at 10%, changed from our last survey.
Among those British Columbians who say they are certain to vote, the BC NDP lead grows to 7-points with the NDP at 45%, the BC Conservatives at 38%, BC United at 9% and the Greens at 7%
Regionally, the BC NDP is ahead by 9-points in Metro Vancouver, by 9-points on Vancouver Island while the BC Conservatives are ahead by 11 in the Interior and Northern regions of the province.
The BC NDP continues to lead by 15 points among those aged 45 and over while trailing among those under 44. In fact, among those 60+, the BC NDP is ahead by 20-points, and that lead has grown, while millennials favour the BC Conservatives by 11-points (a gap that has also grown).
The BC NDP leads by 17 among women (47% to 30% for the BC Conservatives) and trails the BC Conservatives by 6-points among men. The gender gap in voting intentions has grown since our last survey in May.
When we compare current provincial vote intentions with reported vote in the 2022 provincial election, we find that the BC NDP has held onto 73% of its current vote with 21% of past NDP voters now saying they would vote for the BC Conservatives.
50% of past BC Liberal voters are voting BC Conservative now while 28% are sticking with BC United (formerly the BC Liberals). 1 in 5 BC Liberal voters are now voting NDP.
Has the Context Changed?
British Columbians remain somewhat more positive about the direction of the province than Canadians feel about the direction of the country and the mood is pretty much where things were in May.
29% of British Columbians feel the province is headed in the right direction. Half think its off on the wrong track.
Economic evaluations remain pretty statics from May. 17% describe the BC economy as excellent or good, up 1 from May while half feel it is poor or terrible, unchanged from the spring.
When we ask about incomes relative to the cost of living, we find some improvement in perceptions. Those who say they are falling behind are still the majority (61%) but is down 4 points since May.
Since May, we see an increase in those who definitely want to see a change in government. Today, 54% say they definitely want change, up 7-points since May while those in the middle categories dropped by 5 points.
1 in 5 British Columbians definitely want to see David Eby and the NDP re-elected, down a marginal one point since May.
In terms of leader impressions, Premier Eby continues to be the most popular provincial party leader. 39% have a positive impression (down 1 from May) while 26% have a negative view (down 1). for a net score of +13.
In comparison, BC United Leader Kevin Falcon is net -21 (worse than in May) with 16% positive and 37% negative. The income tax cut announcement doesn’t seem to have made much difference in improving impressions of Mr. Falcon, at least when compared to our last survey.
BC Greens Leader Sonia Furstenau is +2 with 23% positive and 22% negative while BC Conservative Leader John Rustad is +1 with 30% positive (up 5) and 29% negative (unchanged) for an overall slight improvement in his personal image.
When we ask people to rate the three issues facing the province, the cost of living, housing, and healthcare continue to be the top three issues. And they are the top three issues for pretty much all party supporters.
But we have seen a 4-point increase in those rating taxes as a top issue. Note, this question was asked before any questions about the BC United tax cut promise (see results below).
NDP supporters are more likely to rate housing, healthcare, and climate change as a top issue while Conservative supporters are more likely to rate the cost of living, drug addiction, taxes, and the economy as a top issue.
When we ask those who rated an issue in their top 3 which party is best able to handle it, we find the BC Conservatives with a slight 4-point advantage over the NDP on the cost of living. The NDP leads by 13-points on housing, 12-points on healthcare, and 17-points on poverty and homelessness.
The BC Conservatives have a 17-point advantage among those who rate drug addiction as a top issue, and a 10-point lead on taxes.
Of note, despite the tax cut pledge, only 10% of those who care about taxes say BC United is better able to handle the issue, 14-points behind the NDP and 24-points behind the Conservatives.
On climate and the environment, 46% of those who care most about that issue think the BC Greens are best able to handle the issue followed by the BC NDP at 27%.
Awareness and Reaction to the BC United Tax Cut Pledge
In this survey, we also asked several questions about the income tax promise made by BC United Leader Kevin Falcon on Tuesday, August 13.
Within 3 days of the announcement, about 4 in 10 British Columbians say they are aware of the announcement. Awareness was higher among those who would vote BC United today (53%). This level of awareness is pretty high based on our experience.
But support for BC United is only marginally higher among those aware of the promise than those unaware suggesting the announcement has had little impact so far and if awareness increases, it may not change voting intentions.
This is despite the fact that most British Columbians think the promise is a good idea (60%) compared with 24% who think it’s a bad idea. Even a half of NDP supporters think the tax cut idea is a good idea.
However, when we tell respondents that the tax cut proposal would cost about $5.4 billion and Mr. Falcon stated this cost would be covered by finding and eliminating government waste, many British Columbians were skeptical.
Only 9% of BCers think it is definitely possible to implement the proposed tax cut without cutting services or raising other fees or taxes. Another 28% think it’s probably possible. Half of British Columbians believe it’s probably or definitely not possible to achieve, including half of BC Conservative supporters and 1 in 3 BC United supporters.
Will the tax cut promise move votes? So far, the evidence in this survey is that it hasn’t. BC United has a lower vote share in this survey than in our previous May survey.
However, when we ask people whether the promise makes them more or less likely to vote for BC United, 1 in 4 say yes. But far more say they are either less likely to vote BC United (15%) or the promise won’t impact their vote (45%).
Those who aren’t currently supporting BC United and say they are more likely to support BC United because of the tax cut promise represent 21% of the electorate. That’s a sizeable portion.
In 2022, 31% of this group voted NDP, 24% BC Liberal, 4% Green, 5% for another party and 35% didn’t vote.
So although the promise hasn’t yet had any impact on BC United vote share or feelings towards Kevin Falcon, it still may.
The Upshot
According to Abacus Data founder, Chair & CEO, David Coletto:As we head towards October’s provincial election in BC, the BC NDP remain the favourites to win thanks to their advantage in Metro Vancouver and on Vancouver Island and the party’s lead among those most likely to vote.
The split on the centre-right continues to help the BC NDP, even as the BC Green vote holding together, makes the race tigher.
If voters perceive the election to be much closer, especially as move towards Election Day, we should expect even more consolidation between the two parties people expect to be in a winning position.
Premier Eby continues to have a net positive impression despite an intensifying desire for change. Conservative Leader John Rustad has slightly higher negatives, but he too has a relatively good personal image, especially when compared to BC United leader Kevin Falcon.
Mr. Falcon’s bold pledge to cut provincial income taxes has yet to change minds about him or a willingness to vote for his party. In May, 36% of British Columbians said they were open to voting BC United. Today, that number is largely unchanged at 35%. So far, this so-called “Hail Mary” play has yet to bear any political fruit for official opposition leader.
Methodology
The survey was conducted with 1,000 eligible voters living in British Columbia from August 14 to 16, 2024. A random sample of panelists were invited to complete the survey from a set of partner panels based on the Lucid exchange platform. These partners are typically double opt-in survey panels, blended to manage out potential skews in the data from a single source.
The margin of error for a comparable probability-based random sample of the same size is +/- 3.1%, 19 times out of 20.
The data were weighted according to census data to ensure that the sample matched BC’s population according to age, gender, educational attainment, and region. Totals may not add up to 100 due to rounding.
We are the only research and strategy firm that helps organizations respond to the disruptive risks and opportunities in a world where demographics and technology are changing more quickly than ever.
We are an innovative, fast-growing public opinion and marketing research consultancy. We use the latest technology, sound science, and deep experience to generate top-flight research-based advice to our clients. We offer global research capacity with a strong focus on customer service, attention to detail, and exceptional value.
We were one of the most accurate pollsters conducting research during the 2021 Canadian election following up on our outstanding record in 2019.
Bloc Québécois Leader Yves-François Blanchet took the rare step of denying the Conservatives are surging in Quebec, despite recent Abacus Data polling to the contrary, saying Pierre Poilievre’s party “is not in my flowerbed and my flowers are doing very well.”
As the US political landscape rapidly shifted over the past three weeks, Abacus Data conducted a national survey of 1,550 Canadian adults, from July 31 to August 7, 2024, to explore their impressions of US presidential candidates. We also asked which candidate is more likely to win the election.
In terms of positive impressions, Vice President Kamala Harris has a significant favourable advantage among Canadians with a net impression of +27. More specifically, positive impressions of Vice President Harris more than double negative impressions (48% vs 21%).
In clear contrast, impressions of former President Donald Trump are overwhelming negative with a net score of -37. 61% of surveyed Canadians hold a negative impression, with nearly 50% holding a “very negative” impression, while only 24% hold a positive impression.
For former President Trump’s running mate, Ohio Senator JD Vance, impressions are somewhat mixed. While a majority of Canadians have negative perception of the VP candidate (with 38%) and a net score of -24, 26% of Canadians report not knowing enough yet to have an opinion and 22% have neutral impressions.
For context, Joe Biden’s net favourable score in Canada right now is -12 with 27% positive and 39% negative.
Positive impressions of Vice President Harris are particularly high among those 60-and-over (with 61%), while only 37% of younger Canadians, those 18-to-29, hold positive impressions of the candidate. Interestingly, there is almost no gender gap, as positive impressions are nearly the same among men and women.
Regionally, Canadians are more likely to have a positive impression of Vice President Harris in nearly all provinces, with the exception of Alberta, where 33% hold a negative impression. Still, those with a negative impression in Alberta are statistically tied with those who hold a positive impression. Harris also enjoys positive impressions with a clear majority of Liberal and NDP supporters (68% and 65% respectively), while more Conservatives hold a negative view than a positive one (although 33% of Conservative supporters say they have a favourable impression of Harris).
Learn about the game-changing tool from the Abacus Data team that makes it possible to estimate polling results to the riding level for improve advocacy and government relations.
Across all demographic, regional, and political groups, a majority of Canadians have a negative impression of Donald Trump.
In terms of age, positive impressions of former President Trump are highest among those 30-to-44 and 45-to-59 (with 30%), while an overwhelming 78% of those 60-and-over have a negative impression. A higher percentage of women hold negative impressions of former President Trump (64%), compared to men (58%).
Among Conservative supporters, 38% hold a positive view of Trump while 43% have a negative view, which is comparable to the 34% of respondents in Saskatchewan and Manitoba, and 31% in Alberta.
In contrast, 80% of NDP supporters and 69% of Liberal supporters hold a negative impression of Trump.
Who do Canadians think will win the US presidential election?
More Canadians believe Kamala Harris will win the election than do those who think Trump will win. 41% think Harris will win compared with 33% who think Trump will win. 1 in 4 are unsure.
Conservative supporters and Albertans are most likely to predict a Trump victory while every other regional, demographic, and political group believes Harris will win.
The Upshot
A majority of Canadians, across nearly all demographic groups, hold a negative impression of former President Donald Trump, as he remains an unpopular and controversial political figure. in Canada In contrast, Vice President Kamala Harris is widely liked and would be the most popular political leader in Canada if she was leader of a Canadian political party. For context, she is also much more favourably viewed than President Joe Biden, even after he announced he was not running for re-election.
Impressions of both Harris and Trump, however, are related to age and political affiliation. Harris is particularly popular among older Canadians, as well as Liberal and NDP supporters. For Conservative supporters, impressions of Trump are more evenly distributed.
With President Joe Biden withdrawing from the US presidential race, Vice President Kamala Harris has seen a surge in support among the American electorate, and Democrats are now more confident in their chances of winning the next election. We find that a majority of Canadians believe Harris is more like to become the next US president. suggesting the rapidly evolving election in the United States is being watched closely by Canadians and views about the outcome have shifted to favour the Democratic candidate.
Methodology
The survey was conducted with 1,550 Canadian adults from July 31 to August 7, 2024. A random sample of panelists were invited to complete the survey from a set of partner panels based on the Lucid exchange platform. These partners are typically double opt-in survey panels, blended to manage out potential skews in the data from a single source.
The margin of error for a comparable probability-based random sample of the same size is +/- 2.489%, 19 times out of 20.
The data were weighted according to census data to ensure that the sample matched Canada’s population according to age, gender, educational attainment, and region. Totals may not add up to 100 due to rounding.
We are Canada’s most sought-after, influential, and impactful polling and market research firm. We are hired by many of North America’s most respected and influential brands and organizations.
We use the latest technology, sound science, and deep experience to generate top-flight research-based advice to our clients. We offer global research capacity with a strong focus on customer service, attention to detail, and exceptional value.
And we are growing throughout all parts of Canada and the United States and have capacity for new clients who want high quality research insights with enlightened hospitality.
Our record speaks for itself: we were one of the most accurate pollsters conducting research during the 2021 Canadian election following up on our outstanding record in the 2019, 2015, and 2011 federal elections.
From July 31 to August 7, 2024 Abacus Data conducted a national survey of 1,550 Canadian adults exploring several topics related to Canadian politics and current events as part of our regular national omnibus surveys.
In this edition of our Canadian politics tracking, we ask about the most important issues facing Canadians, along with our usual trackers.
Vote Intention: Conservatives continue ahead, lead by 20 over the Liberals
In what is now a persistent trend (and now the sixteenth survey in a row), the gap between the Conservatives and the Liberals remains close to 20 points.
If an election were held today, 43% of committed voters would vote Conservative, while 23% would vote for the Liberals, 18% for the NDP, and 4% for the Greens. The BQ holds 30% in Quebec.
Every party’s vote share is consistent with our last survey, with very minor changes, as the Conservatives are up 1 and the NDP are down 2. These changes are also within the margin of error.
Regionally, the Conservatives continue to lead in all provinces or regions and in this survey are statistically tied with the BQ in Quebec.
Learn about the game-changing tool from the Abacus Data team that makes it possible to estimate polling results to the riding level for improve advocacy and government relations.
Outside Quebec, the Conservatives have a 25-point lead over the Liberals and are close to earning half of those who are committed to a political party at the moment. The Liberals and the NDP are statistically tied outside Quebec.
As vote intention remains relatively stable, Conservatives remain ahead among all demographic groups. Conservative support remains high among 30-to-44 (2 points down from our last survey) and 42% among 60-and-over (no changes).
Still, there is a small change from our last survey. Conservative support among those 45-to-59 increased 7 points, as support for the NDP shrunk slightly (4 points down) and support for the Liberals remans steady.
As we have consistently found in recent surveys, there is little difference in vote intention between men and women. Liberal vote share is slightly higher among men than women while the NDP does better among women than men. The Conservative vote share is consistent regardless of gender.
Poilievre’s positive impressions rise, as Conservatives’ accessible voter pools widens
While we have not seen any noticeable shift in vote intention, there have been other notable changes.
The size of the Conservative Party’s accessible voter pools has increased. Today the Conservative pool is 16-points larger than the Liberal one. 55% of Canadians say they are open to voting Conservative compared with 39% for the Liberals. 42% are open to voting for the NDP.
As the Conservatives work to grow their support by going after past Liberal, NDP, and BQ supporters, here’s the percentage of each of those party’s CURRENT supporters who are open to voting Conservative:
24% of Liberal supporters are open to voting Conservative (5% of the electorate) 20% of NDP supporters are open to voting Conservative (3% of the electorate) 10% of BQ supporters are open to voting Conservative (1% of the electorate)
In contrast, when we look at CURRENT Conservative, NDP, and BQ supporters, the following percentages are open to voting Liberal:
9% of Conservative supporters are open to voting Liberal (3% of the electorate) 41% of NDP supporters are open to voting Liberal (7% of the electorate) 20% of BQ supporters are open to voting Liberal (1% of the electorate)
Along with growth in its accessible voter pool, impressions of Conservative leader Pierre Poilievre have also improved.
Today, 42% of Canadians have a positive impression of Mr. Poilievre (the highest we have ever measured) compared with 35% who have a negative view. The net score of +7 is close to the highest we have measured for the Conservative leader. Over the summer, Mr. Poilievre’s positive impressions have increased by 4 points.
At the same time, we have not seen any change in how people feel about Justin Trudeau. Today, 25% have a positive view and 58% have a negative one for a net score of -33. Negative views of the Prime Minister have ranged between 57% to 59% consistently since the start of the year.
We have also seen a shift in views about NDP Leader Jagmeet Singh. Today, 37% have a negative view of Mr. Singh, the hghest we have recorded compared with 33% who have a positive view for a net score of -4. This may indicate that the Conservative Party ads against Mr. Singh, may be putting pressure on his image. Among current CPC supporters, 63% have a negative impression of Mr. Singh compared with only 11% who have a positive view. Among NDP supporters open to voting Conservative (6% of the electorate), 41% have a positive impression, 41% neutral, and 16% negative towards Mr. Singh.
Other Measures
Beyond vote intention, the desire for change remains largely consistent and within the margin of error. 84% want change, with 53% believing there’s a good alternative to the Liberals (down 1).
Negative impressions of the federal government’s performance are trending down with 57% disapproving (down 3 since July) and 27% approving (up 2).
Find out more about the The Three Threads and how the Abacus Data team looks at polling for public affairs and advocacy.
Most important issues facing Canadians
In this edition, we also asked Canadians about the most important policy issues today. We changed the list of items adding in the prospect of another Trump presidency and job security and removing Chinese election interference and freedom in Canada.
As in previous surveys, the majority of Canadians (64%) believe the rising cost of living is among the 3 most important issues, followed by healthcare (44%) and housing affordability and accessibility (43%).
The top three issues for Conservative supporters are the cost of living, the economy, and housing. They are more likely to rate immigration, political correctness, and crime as a top issue than other party supporters and far less likely to rate climate change as a top issue.
Liberal supporters rate the cost of living, healthcare, and housing as their top three issues. They are more likely to rate climate change and the environment and another Trump presidency as a top issue than other party supporters.
NDP supporters rate the cost of living, housing, and healthcare as their top three issues and overindex on inequality and poverty and climate change and the environment.
In this edition, we also asked about job security and the possibility of another Trump presidency. In both cases, only 10% of Canadians believe either issue is among the top 3. This, however, differs considerably among party supporters. While 18% of Liberal supporters believe another Trump presidency is a top issue, only 5% of Conservative supporters believe so.
When we ask those who rated an issue as a top issue which party they think will best handle the issue, the Conservatives lead on 4 of the top 6 issues (cost of living, housing, economy, and immigration). The Conservatives and NDP are tied on healthcare while the Liberals are slightly ahead of the Greens among those who care most about climate change and the environment.
The Liberals are in third on the cost of living, housing, and immigration and trail the Conservatives by 34 among those who rate the economy as a top issue.
The Upshot
According to Abacus Data CEO David Coletto: “As August begins, the political opinion environment looks almost exactly as it was when summer started and even when the year started.
There remains a deep and broad desire for change. Canadians remain focused on affordability issues and healthcare, and the Prime Minister trails the opposition leaders on net favourability by a wide margin.
If we use this poll to assess who is winning and losing the summer so far, it’s clear the Conservatives are. They continue to not only hold onto their 20-point lead but are making important gains in what I believe are more important underlying metrics.
Views of Pierre Poilievre are improving (hitting the highest level of positive impressions we have ever measured) and more Canadians are now open to voting Conservative than at any point since the 2015 federal election. Growing the pool of accessible voters and protecting Mr. Poilievre’s image are essential to holding current supporters but more importantly, gives the party room to expand its vote share. With a massive fundraising advantage, the Conservatives are able to be on the offensive against all three of its main opponents – the Liberals, NDP, and BQ and there’s evidence in this survey that their strategy is working.
For the Liberals, this survey continues to offer little in the way of good news. There’s been no progress in shifting public opinion about the Prime Minister. As I noted in my last analysis, the relationship between how people feel abotu Trudeau and how they intend to vote is strong and has not changed since 2015. Unless they can change how people feel about the Prime Minister, the path back to competitiveness will be very difficult.
And there doesn’t appear to be any impact of the rapid shift in American politics. The excitement for Kamala Harris in the US and the re-engagement of Democrats there has not had any discernable impact on Canadian public opinion.
We will have new data out shortly that shows Kamala Harris’ net favourable far exceeds any political leader in Canada already. Even among Conservative supporters, there’s considerable positive feelings toward her. That has not carried over to Trudeau or Singh.
For the NDP, these results should highlight the fragility of its coalition. Mr. Singh’s negatives are rising (to the highest point we have ever measured) and the sustained assault on his image by the Conservatives could cost the party considerable support. 1 in 5 of current NDP supporters are open to voting Conservative and 1 in 10 say the Conservative Party is their second choice. That vote is likely highly concentrated in ridings where even a few point swing could flip several NDP seats to the Conservatives.”
Methodology
The survey was conducted with 1,550 Canadian adults from July 31 to August 7, 2024. A random sample of panelists were invited to complete the survey from a set of partner panels based on the Lucid exchange platform. These partners are typically double opt-in survey panels, blended to manage out potential skews in the data from a single source.
The margin of error for a comparable probability-based random sample of the same size is +/- 2.489%, 19 times out of 20.
The data were weighted according to census data to ensure that the sample matched Canada’s population according to age, gender, educational attainment, and region. Totals may not add up to 100 due to rounding.
We are Canada’s most sought-after, influential, and impactful polling and market research firm. We are hired by many of North America’s most respected and influential brands and organizations.
We use the latest technology, sound science, and deep experience to generate top-flight research-based advice to our clients. We offer global research capacity with a strong focus on customer service, attention to detail, and exceptional value.
And we are growing throughout all parts of Canada and the United States and have capacity for new clients who want high quality research insights with enlightened hospitality.
Our record speaks for itself: we were one of the most accurate pollsters conducting research during the 2021 Canadian election following up on our outstanding record in the 2019, 2015, and 2011 federal elections.
From July 16 to 21, 2024, Abacus Data conducted a survey of 1,000 eligible voters in Ontario exploring several topics as part of our regular national omnibus surveys.
Every month, with our media partner the Toronto Star, we track how Ontarians are feeling about their political choices and add new topics based on current events and discussions. In this edition of the survey, we explore impressions of party leaders, along with our usual trackers.
Doug Ford’s and Ontario PCs lead by 18 over Bonnie Crombie’s Ontario Liberals
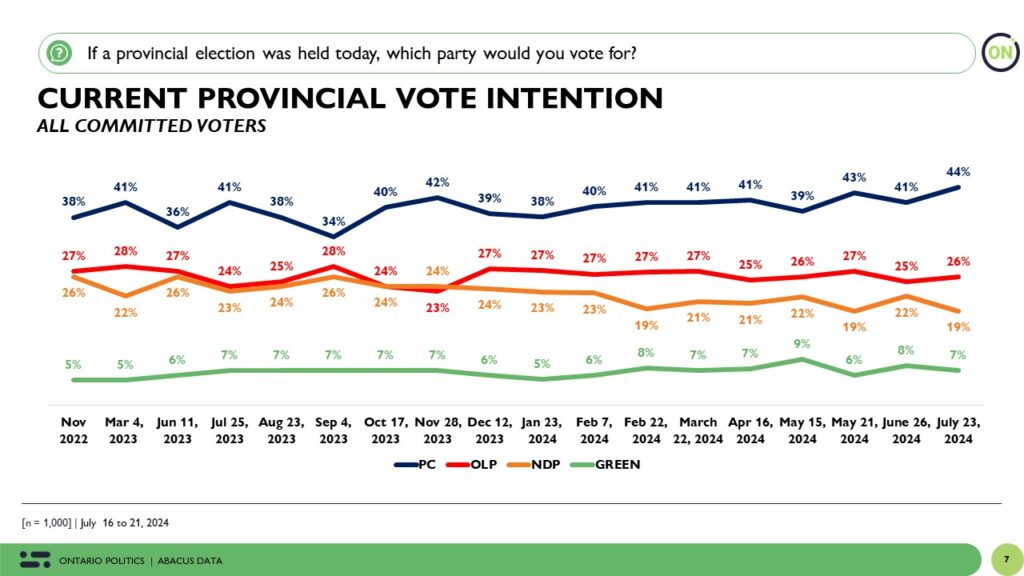
If an election were held today, 44% of committed voters in Ontario would vote PC. The Ontario Liberals are at 26%, with the Ontario NDP closely behind at 19%, and the Greens at 7%.
PC vote share is up 3 points since last month, the highest point since our tracking started in November 2022.
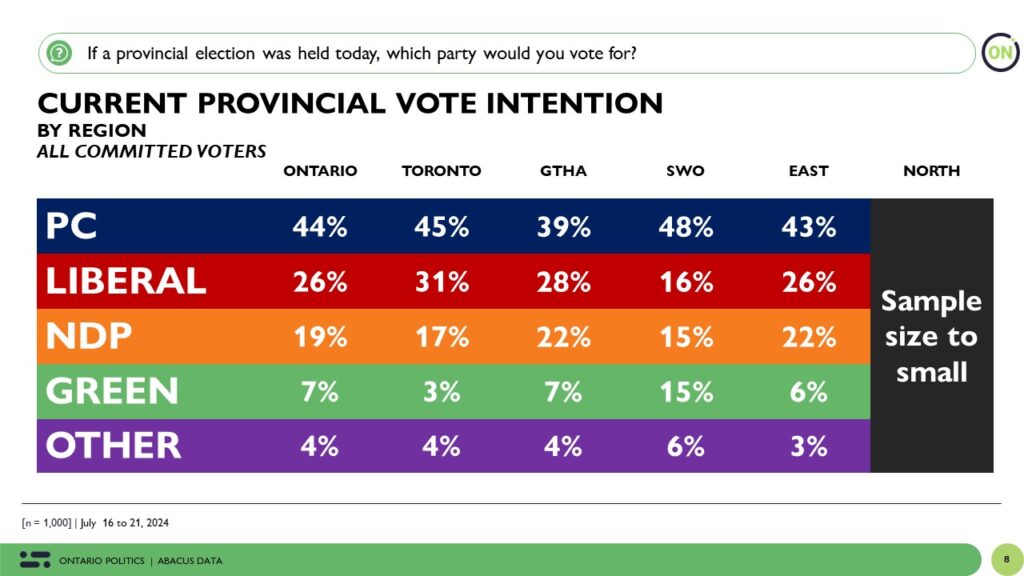
The Ontario PCs also lead across the province. They are ahead by 14 points ahead in Toronto, 11 in the GTHA, 31 in southwestern Ontario, and 17 in eastern Ontario. The strong support in Toronto may be related to the focus and attention the Premier has personally given to the city.
Compared to our last survey, the Ontario PCs continue to gain ground in southwestern Ontario (rising by 4 points) and Toronto (rising by 4 points). For the Ontario NDPs support is slightly down across most regions and 5 points down in southwestern Ontario. Ontario Liberals hold steady.
The Ontario PCs continue to lead across all demographic groups.
They are well ahead among men at 46% (2 points up) and among women at 39% (2 points up). The gap between the PCs and the Liberals, among women, as held from our last survey when support for the PCs increased 6 points.
This month, Ontario PCs’ also lead over the Liberals by 19 points, among those 60+ and by 22 points among those 45-to-59.
In a change from our last survey, among those 18-to-29, support for the PCs increased by 3 points, while support for the Liberals increased 8 points. This increase coincides with a change in support for the NDP, down 7 points.
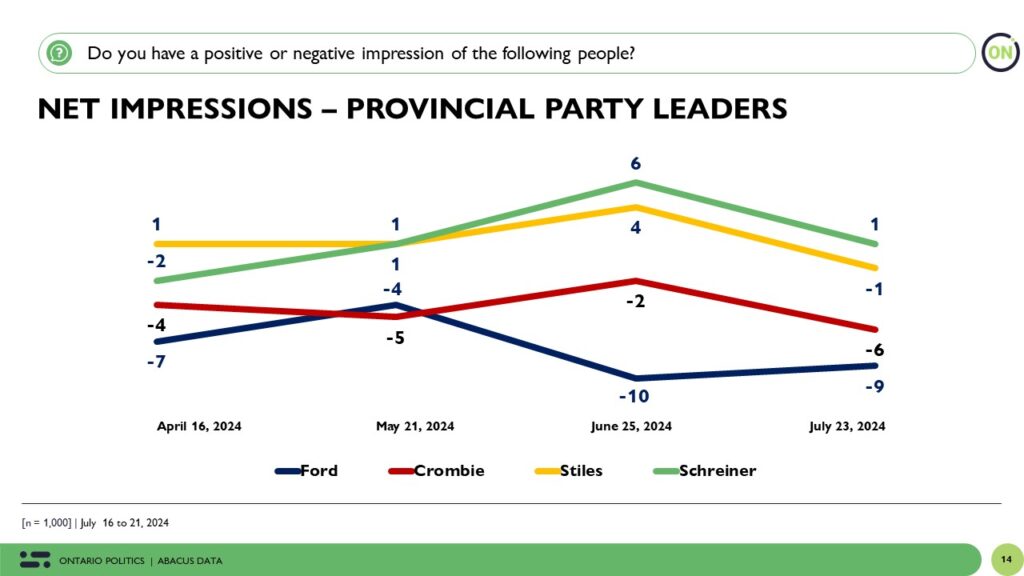
Doug Ford’s personal numbers are holding steady and show little change. 34% have a positive view of Premier Ford (1 point down), he has net score of -9. This represents a 1-point increase since last month.
In contrast, impressions of opposition party leaders have shifted since our last survey. NDP leader Marit Stiles has a net score of -1 (it was +4 in the last survey), and Green Party leader Mike Schreiner has a net score of +1 (it was +5 in the last survey). For Ontario Liberal Party leader, Bonnie Crombie, impressions decreased, with a net impression of -6 (4 points down).
Provincial Government Approval Holds Steady
Today, 33% of Ontarians say they approve of the job performance of Doug Ford and the provincial government, down 1-point from last month while those disapproving is also down 1-point.
The LCBO Strike
In this survey, we also asked some questions about the LCBO strike.
Overall, 16% of Ontarians say they were following the strike closely with another 38% following it pretty closely. 5% of Ontarians didn’t know there was even a strike happening, including 14% of those under 30.
When asked how the strike makes them feel, 4% said they are very happy, 12% are pleased, 54% say they are indifferent to it, 24% are disappointed while 6% are angry.
Interestingly, current PC Party supporters were the most likely to be disappointed or angry, suggesting the PCs did benefit from the strike and seem to have successful framed it in a positive way for the government.
The Upshot
The strike at the LCBO strike has not had a noticeable impact on Premier Ford’s image or the Ontario PCs vote share. In fact, the PC vote share has increased to its highest point since our tracking started in November 2022. Demographically and regionally, the PCs are also well ahead.
Our data show that Ford’s personal numbers are holding steady. He’s not loved but not deeply unpopular either. Impressions over time show that Ford continues to do what a lot of other incumbents aren’t doing – holding a lead despite the economic situation.
Ford’s lead with everyone and everywhere also reflect a divided opposition. Since the election of Bonnue Crombie the Ontario Liberal vote share in unchanged and we’ve seen a slight worsening of Ms. Crombie’s personal image. The Ontario NDP remains in third place with many Ontarians having a neutral or no opinion of its leader Marit Stules.
All in, the 18-points lead shows that Ford Nation is holding together and that, at this point, he’s in the driver seat. However, there is risk in these numbers. The government’s approval rating is modest and the opposition leaders are not well known. These suggests uncertainty around how voters react if and when they are engaged during what many believe will be an early provincial election.
Methodology
The survey was conducted with 1,000 eligible voters in Ontario from July 16 to 21, 2024.
A random sample of panelists were invited to complete the survey from a set of partner panels based on the Lucid exchange platform. These partners are typically double opt-in survey panels, blended to manage out potential skews in the data from a single source.
The margin of error for a comparable probability-based random sample of the same size is +/- 3.1%, 19 times out of 20.
The data were weighted according to census data to ensure that the sample matched Ontario’s population according to age, gender, educational attainment, and region. Totals may not add up to 100 due to rounding.
This survey was paid for by Abacus Data Inc. Abacus Data follows the CRIC Public Opinion Research Standards and Disclosure Requirements that can be found here: https://canadianresearchinsightscouncil.ca/standards/
ABOUT ABACUS DATA
We are Canada’s most sought-after, influential, and impactful polling and market research firm. We are hired by many of North America’s most respected and influential brands and organizations.
We use the latest technology, sound science, and deep experience to generate top-flight research-based advice to our clients. We offer global research capacity with a strong focus on customer service, attention to detail, and exceptional value.
And we are growing throughout all parts of Canada and the United States and have capacity for new clients who want high quality research insights with enlightened hospitality.
Our record speaks for itself: we were one of the most accurate pollsters conducting research during the 2021 Canadian election following up on our outstanding record in the 2019, 2015, and 2011 federal elections.