Alberta Politics Deep Dive: Notley’s NDP leads Smith and the UCP by 8 but a core group of “reluctant” UCP voters will likely decide the election

Earlier this week I was in Calgary speaking to a business group about the political environments in Canada and Alberta. I shared some data from a new survey Abacus Data completed last week exploring the public mood as well as political opinions and perceptions.

The data in this briefing comes from an online survey of a representative sample of 1,000 Albertan adults from December 6 to 10, 2023.

Key Takeaways:
1. Only 25% of Albertans think the province is headed in the right direction.
2. The top issues are cost of living, healthcare, the economy, taxes, and housing.
3. Rachel Notley is viewed more positively than Danielle Smith.
4. NDP leads the UCP by 9 among decided voters. 25% of Albertans are undecided.
5. But the gap is only 4 points on preferred premier: Notley 52% vs. Smith 48%.
6. Understanding how “reluctant UCP” voters react over the next few months will be critical to anticipating the results of the next election.
Here’s my full read of the data and what it means about five months from a provincial election.

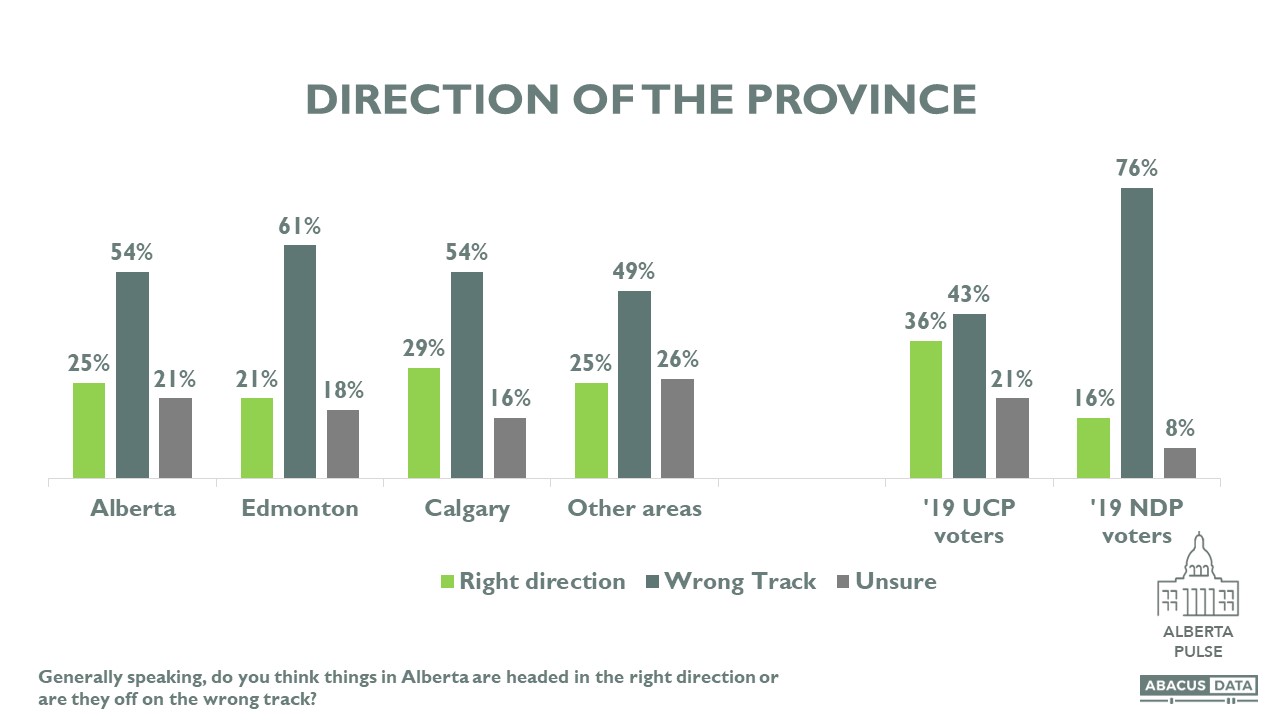
ONLY 1 IN 4 THINK THE PROVINCE IS HEADED IN THE RIGHT DIRECTION

The overall mood of the public is fairly negative. 1 in 4 think the province is headed in the right direction while a slight majority (54%) think it’s off the track. This view is consistent across the province. Perhaps most important, more 2019 UCP voters think the province is off on the wrong track than think it’s headed in the right direction.

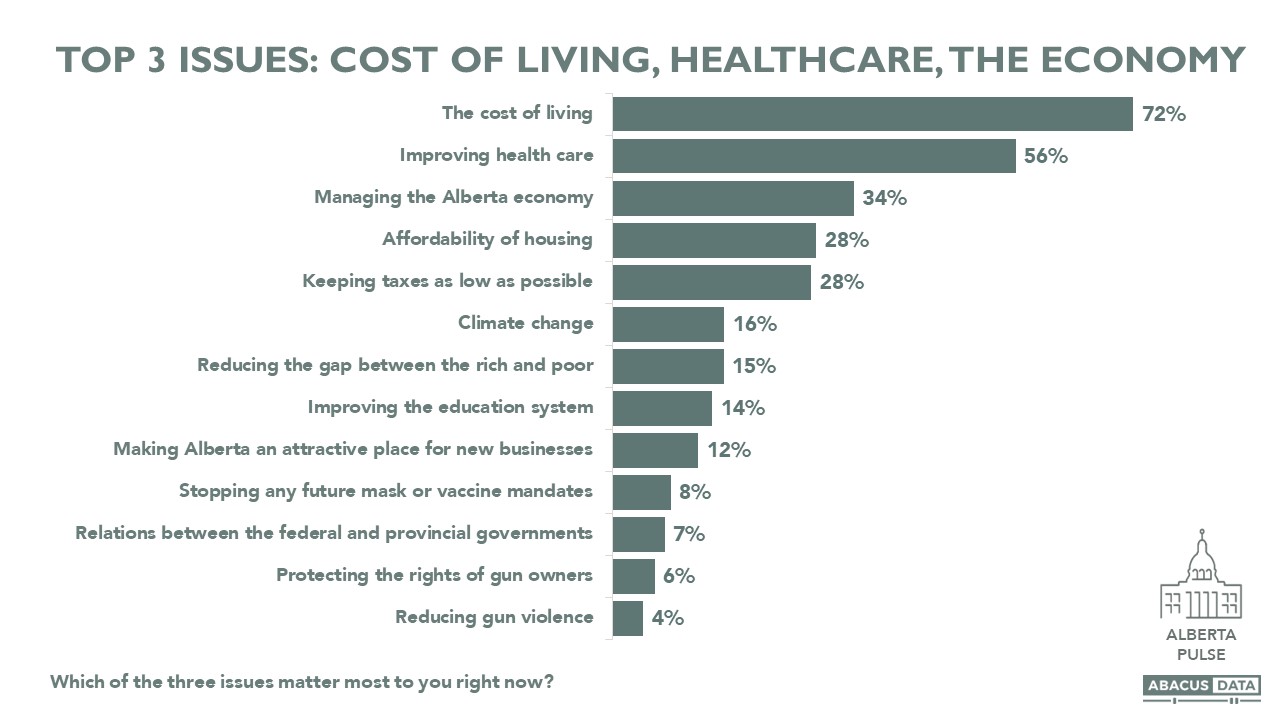
COST OF LIVING, HEALTHCARE & THE ECONOMY ARE THE TOP ISSUES

Albertans are most likely to rank the cost of living, improving health care and managing the economy as their top three issues right now. Housing affordability and keeping taxes low round out the top 5 with about 1 in 4 ranking it in their top three. Only 16% rate climate change as a top issue. For less than 10%, federal/provincial relations, stopping future mask or vaccine mandates or protecting the rights of gun owners are a top issue.

Comparing those who currently support the UCP with NDP supporters, we find both voter groups rank the cost of living as their top issue and are as equally as likely to feel housing affordability is a top issue. NDP supporters are 23 points more likely to rate healthcare as a top issue while UCP supporters are more likely to rate managing the economy (+13) and keeping taxes as low as possible (+22) as a top issue.
There’s a wide gap on other issues as well. NDP supporters are more likely to rate climate change, income inequality, and improving the education system as top issues while UCP voters are more likely to rate gun rights and mask or vaccine mandates as primary issues of concern.

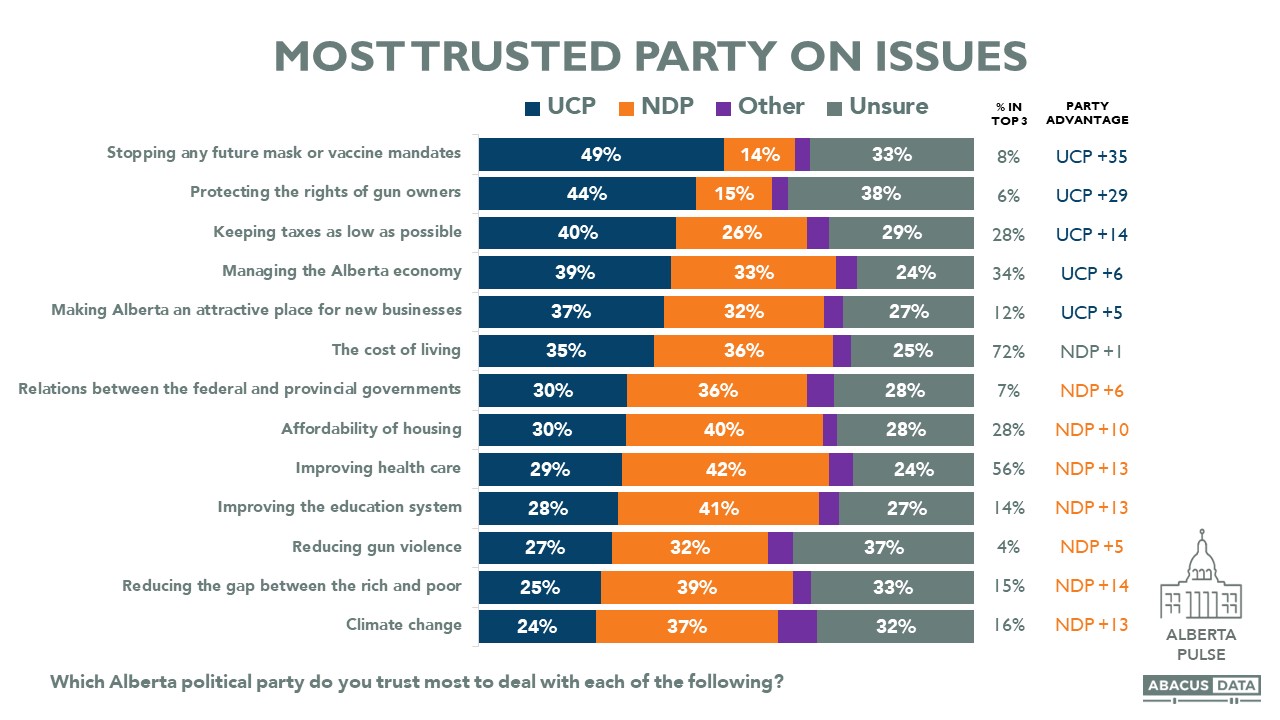
When asked which political party they trust most to deal with each of these issues, we find some clear advantages for both major parties.

Albertans are more likely to trust the UCP to stop future mask/vaccine mandates, protect gun rights, keep taxes low, and manage the economy.

In contrast, they are more likely to trust the NDP on climate change, reducing the gap between the rich and the poor, and improving education and healthcare, on housing, and on federal/provincial relations.

However, it’s worth focusing most on the top 3 issues of the cost of living, healthcare, and managing the economy. Neither party has an advantage on the cost of living (NDP 36% vs. UCP 35%). The UCP has a 6-point advantage on the economy (39% to 33%) while the NDP has a larger 13-point advantage on improving the healthcare system (42% to 29%).

This sorting gives us insight into how framing the election may have an impact on the outcome. As neither party has an advantage on the top issue – the cost of living – that issue may be neutralized. However, an election focused on healthcare would benefit the NDP while one focused on the economy may benefit the UCP.

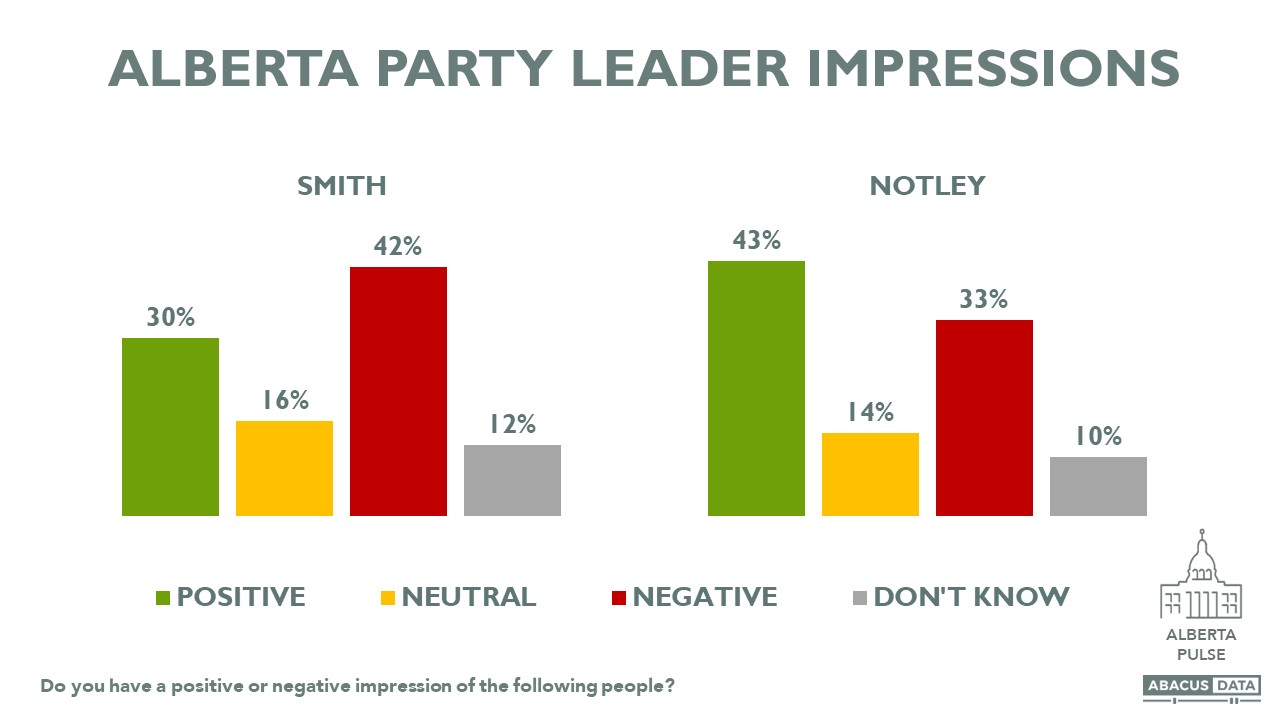
LEADER IMPRESSIONS: NOTLEY VIEWED MORE POSITIVELY THAN SMITH

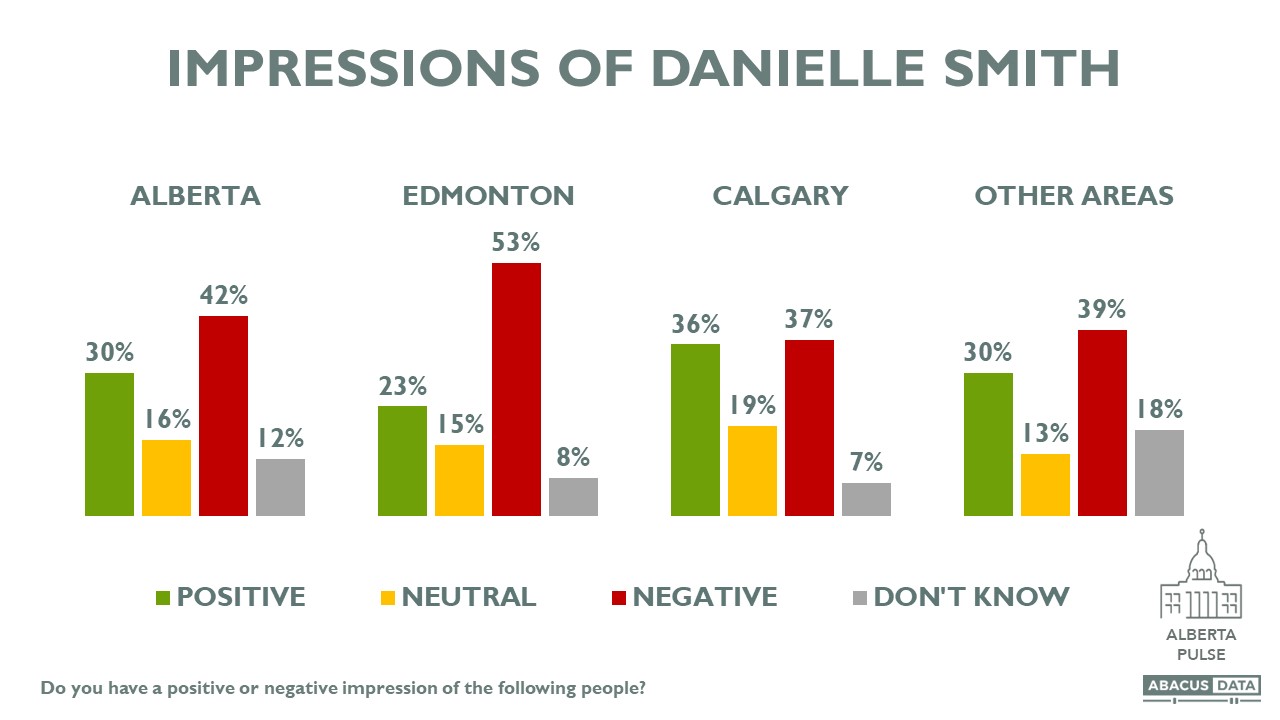
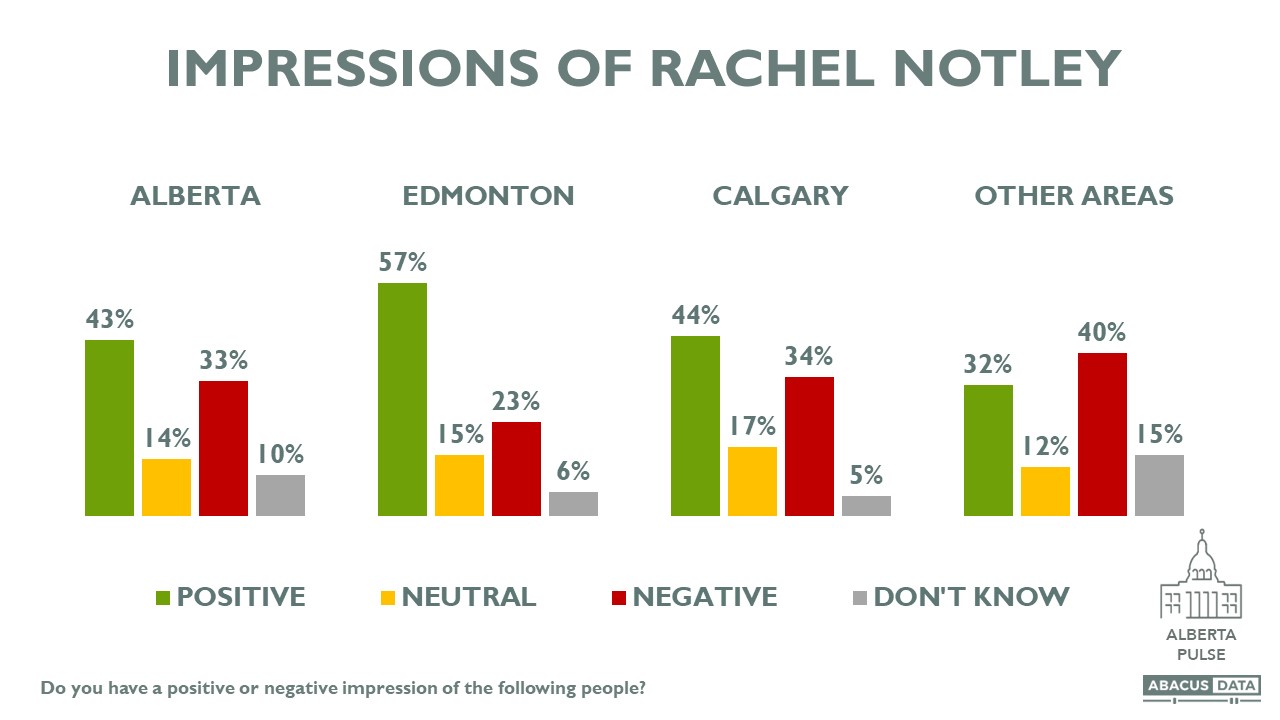
NDP Leader Rachel Notley has a net favourable rating of +10 with 43% having a positive view of her and 33% viewing her negatively. In contrast, Premier Danielle Smith’s net favourable rating is -12 with 30% positive and 42% negative. Both leaders are quite well known with about 1 in 10 Albertans saying they don’t know enough about both leaders to have an opinion. This suggests that views of these leaders are unlikely to change much – especially in the positive direction – given how well known they are. It’s hard to change people’s perceptions of you once they have an impression.

Regionally, Danielle Smith is viewed more negatively in Edmonton (-30) than in Calgary (-1) or other areas of Alberta (-9). Among past UCP voters, 50% have a positive view of her while 28% have a negative view (+22). Among those who voted for the Alberta Party in 2019, 37% have a positive view while 57% negative.

For Rachel Notley, she is viewed positively in Edmonton (+34), Calgary (+10) and negatively outside those two cities (-8). However, in all three regions, her net favourables are better than they are for Danielle Smith. Among past NDP voters, 89% have a positive view of Notley while 3% have a negative view – an very impressive +85 net rating. Among past UCP voters, her net rating is -39 with 20% having a positive view and 59% negative. Among those who voted for the Alberta Party in 2019, 58% have a positive view while 24% negative.

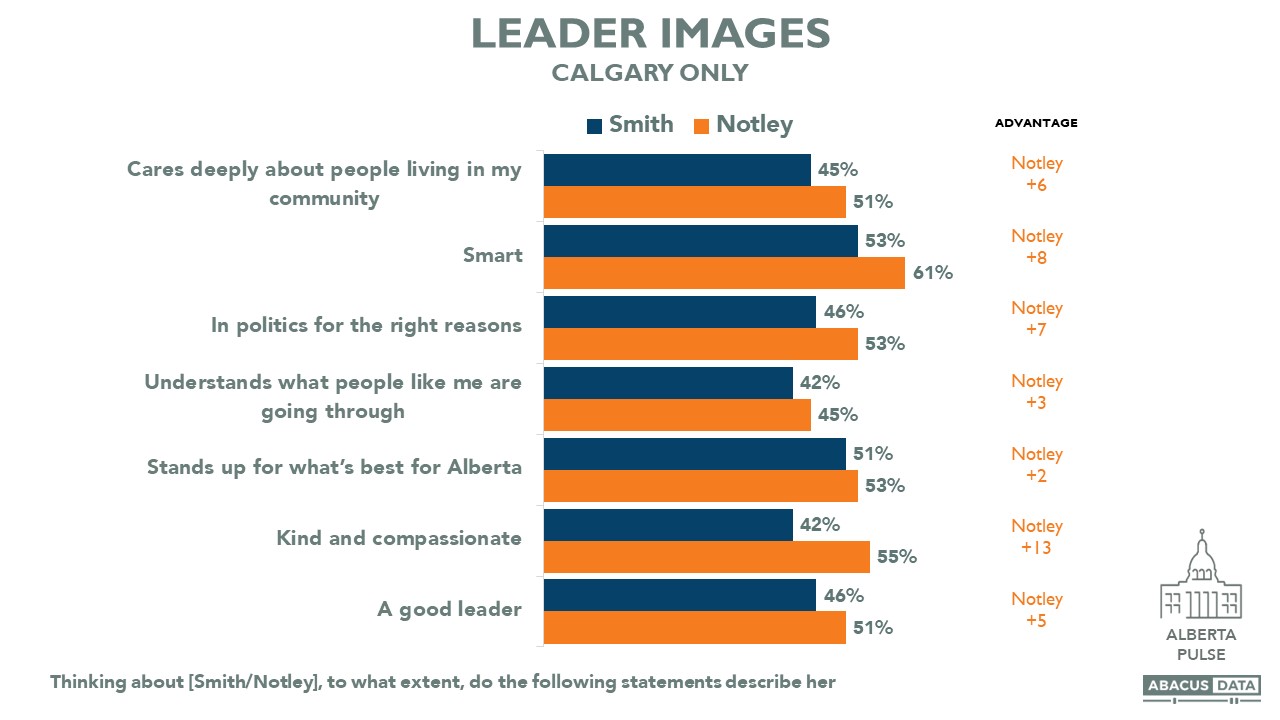
The survey also asked Albertans to rate the two leaders on several attributes. Overall, Rachel Notley’s image is more favourable than Danielle Smith. When asked whether the attribute describe each leader very well, pretty well, not that well, or not at all, among those with an opinion of both leaders (which is about the same across the board) Notley has a clear advantage on all except for standing up for what’s best for Alberta. There’s only a 2-point difference on that.

Even when we isolate only those living in battleground Calgary, Rachel Notley has an advantage on all, albeit to a lesser extent. Notley’s biggest advantage over Smith is on whether people think they are kind and compassionate (Notley ahead by 13), smart (Notley +8), and in politics for the right reason (Notley +7). For the other attributes, the gap between Notley and Smith are not as substantial.

Of note, the attribute that both leaders perform worst on is empathy – “understands what people like me are going through”. 45% think that terms applies well to Notley versus 42% for Danielle Smith.

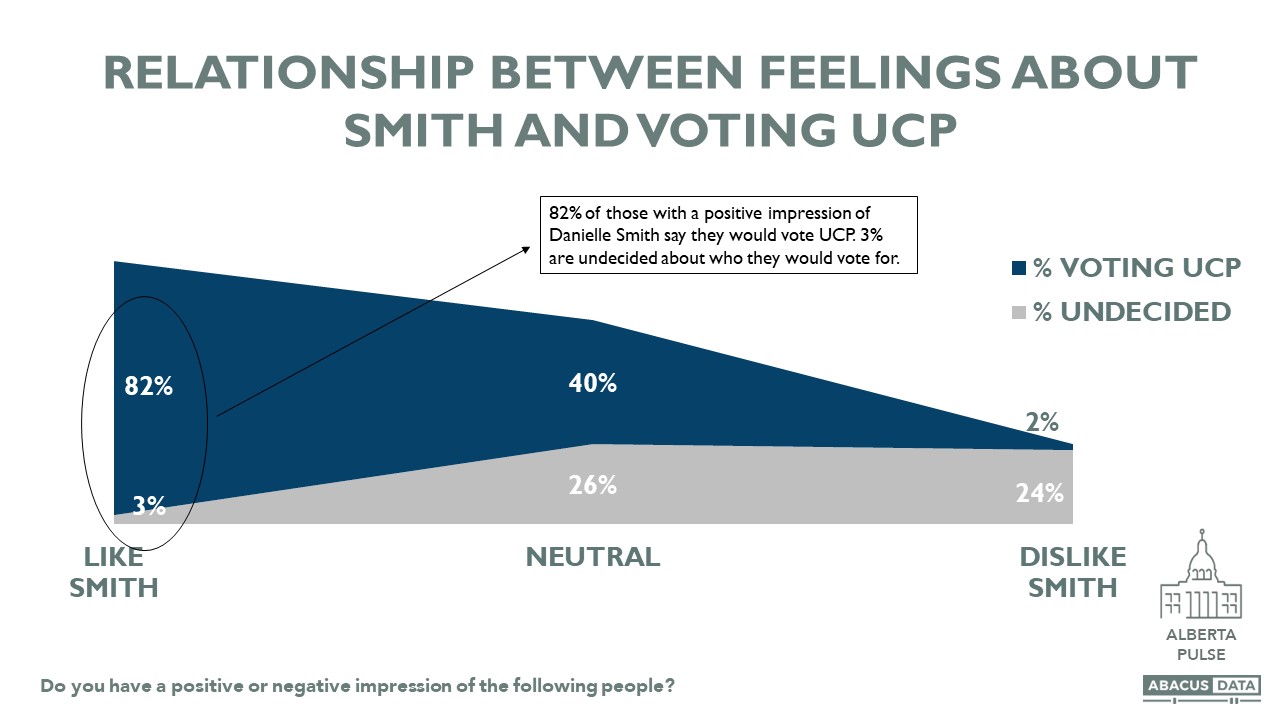
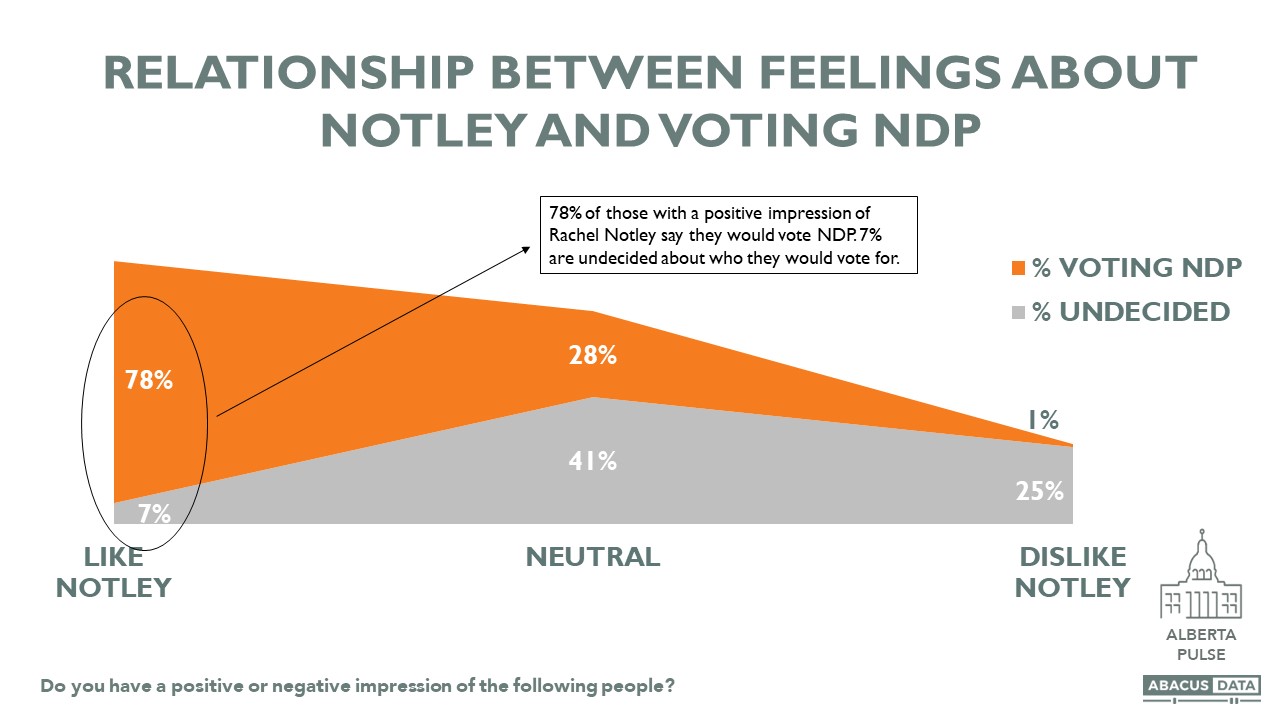
To underscore the importance of leader images to vote choice, the charts below show the vote share for both Danielle Smith and Rachel Notley depending on how a respondent feels about the leader.
82% of those who like Danielle Smith say they will vote UCP. That drops to 40% among those with a neutral opinion and to 2% among those who dislike Smith. Of note, 26% of those with a neutral view of Smith and 24% of those with a negative view of her say they are undecided about how they’d vote if an election was today.

The same pattern exists for Rachel Notley. 78% of those who like the NDP leader say they would vote NDP. This drops to 28% among those neutral towards her and down to 1% who dislike her. Of note, 41% of those with a neutral view of Notley say they are undecided, significantly higher than the vote intention of those neutral towards Smith.

Danielle Smith’s initial weeks in office have been challenging from a public opinion perspective.

Case in point, when asked whether Danielle Smith will be a better or worse premier than Jason Kenney, 29% think she will be better, 38% think she will be worse while the rest are either unsure or think she will be about the same as Jason Kenney. But importantly, those thinking Danielle Smith will be much worse – the more intensely negative category – is more than double the percentage who think she will be much better (21% vs. 9%).

Moreover, among 2019 UCP voters, 39% think she will be better but 32% think she will be worse – an indication that rebuilding the 2019 voter coalition that easily elected Jason Kenney and the UCP won’t be easy.
In Calgary, opinion is just as split with 30% thinking Smith will be a better premier and 34% thinking she would be worse.

This evaluation could change as Smith continues to implement her agenda, but the early reaction is quite mixed.

WHAT DO ALBERTANS WANT? TO SHAKE THINGS UP OR FOR A FOCUS ON THE BASICS

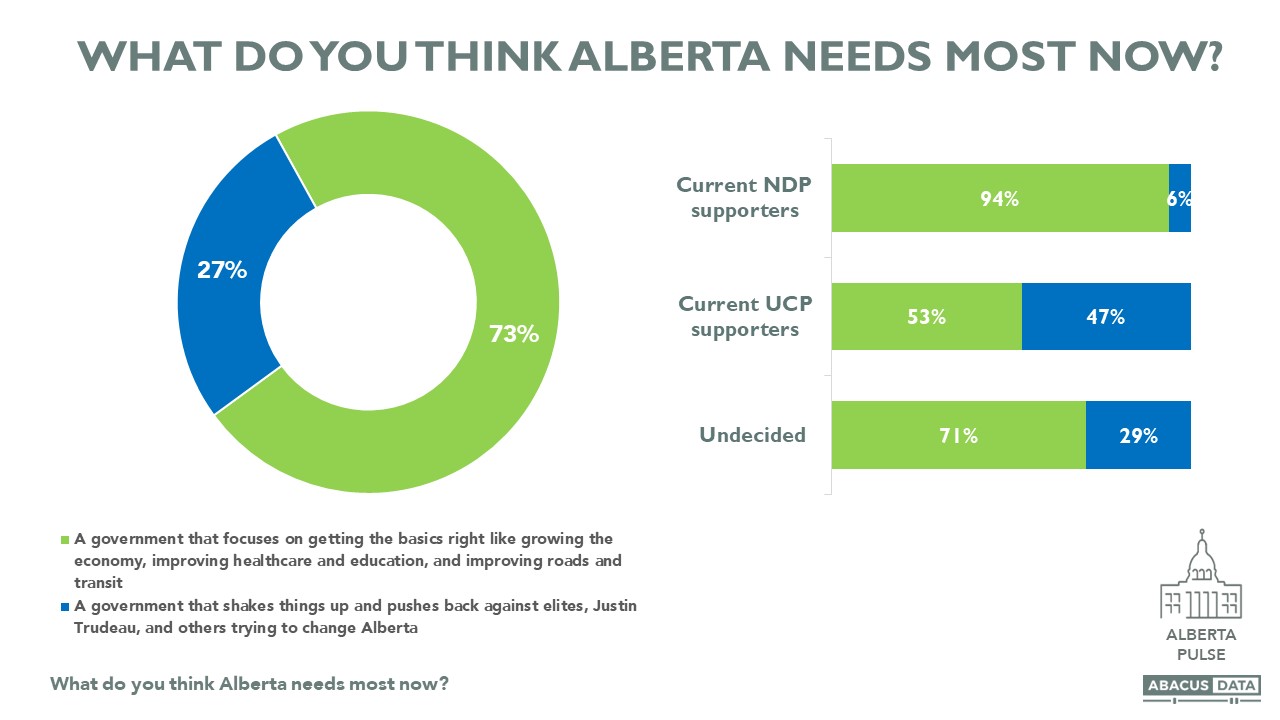
To understand the general orientation of Albertans, we asked people which of two statements they feel Alberta most needs now:
• A government that focuses on getting the basics right like growing the economy, improving healthcare and education, and improving roads and transit.
• A government that shakes things up and pushes back against elites, Justin Trudeau, and others trying to change Alberta

Overall, 3 in 4 want a government that focuses on the basics – the economy, healthcare, education, and transportation. 1 in 4 want a government that shakes things up.

Among current NDP supporters, 94% want a government to focus on the basics. Among undecided voters it’s 71%. But among current UCP supporters, views are split. 53% want a government that focuses on the basics while 47% wants a government that shakes things up and pushes back on people like Justin Trudeau. This divide within the UCP voter universe underscores the challenges facing Premier Smith. Her government’s initial focus on the Sovereignty Act and picking fights with Ottawa may find favour with a large part of her natural party base, but it may be off-putting to those she needs to convince to vote UCP again.

HOW ARE DANIELLE SMITH’S IDEAS PLAYING WITH ALBERTANS?

We asked Albertans whether four ideas were good or bad.
• Sovereignty Act: 29% think it’s a good idea versus 41% who think it’s a bad idea. Those who think it’s a very bad idea outnumber those who think it’s a very good idea almost 3 to 1.
• Alberta Police Force: 27% think it’s a good idea while 49% think it’s a bad idea.
• Private delivery in Alberta’s healthcare system: 35% think it’s a good idea while 41% think it’s a bad idea.
• Preventing school boards from bringing in mask mandates: 30% think it’s a good idea while 51% think it’s a bad idea.

HOW WOULD ALBERTANS VOTE? NDP LEADS BY 8 AMONG DECIDED VOTERS.

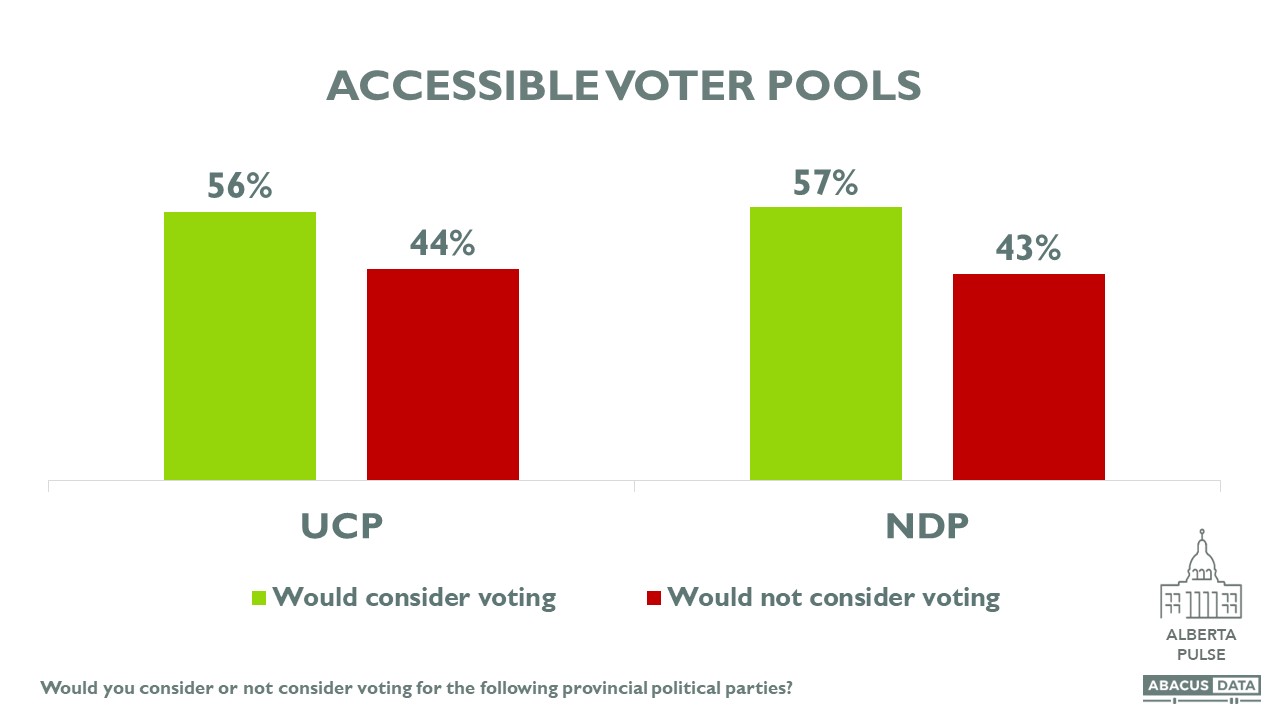
The UCP and NDP have equal-sized accessible voter pools. 57% of Albertans say they would consider voting NDP while 56% would consider voting UCP. The fact that the Alberta NDP has the same sized accessible voter pool as the UCP is noteworthy given Alberta’s political history.

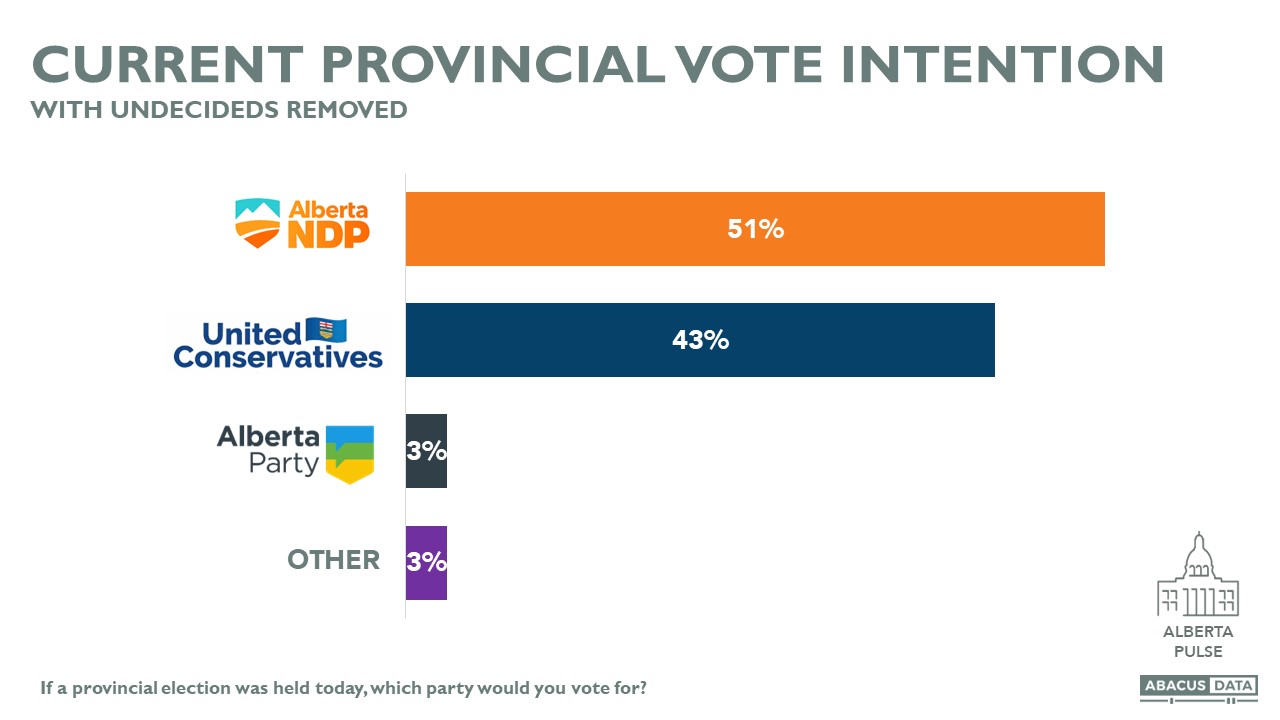
If an election was held today, the Alberta NDP would likely win more votes. Among the entire electorate, 38% would vote NDP, 32% UCP, 3% for the Alberta Party and 2% for other parties. 25% say they are undecided.

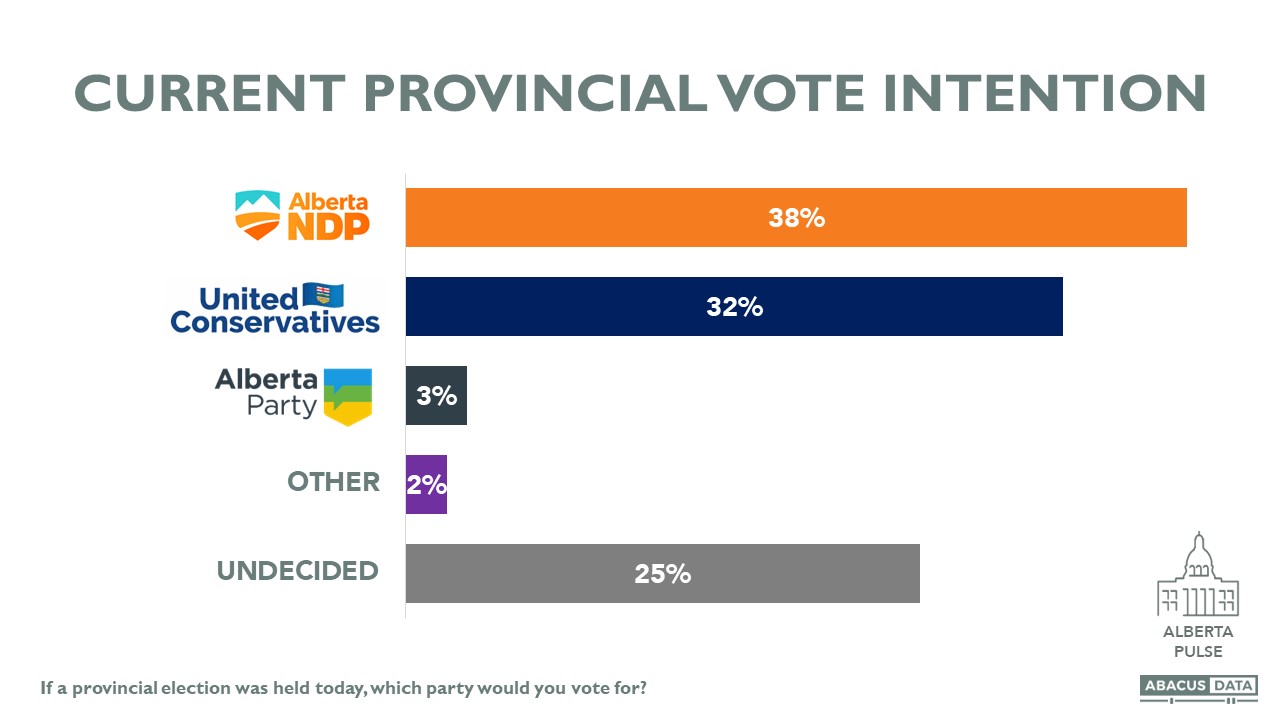
Among decided voters, the NDP leads the UCP by 8 – 51% to 43%.

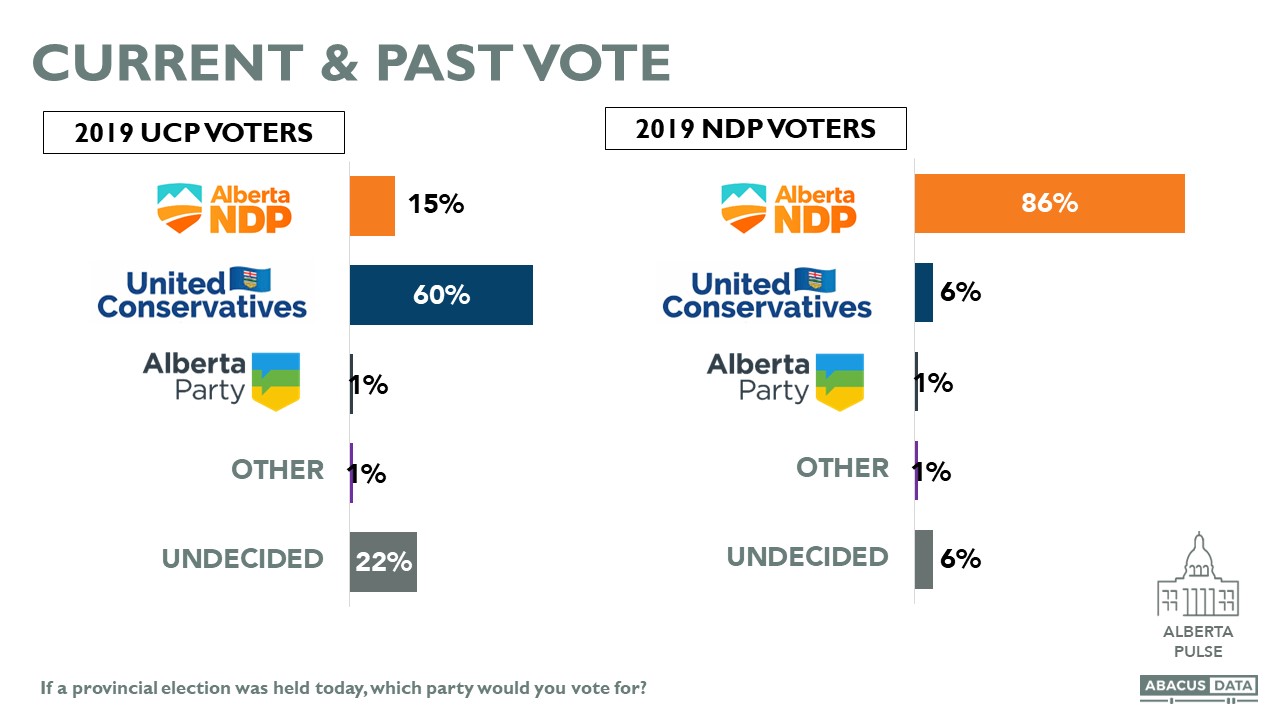
When we compare current vote intention with past vote, 86% of past NDP voters say they would vote NDP again. 6% would defect to the UCP, 2% to other parties, and 6% are undecided.

Among past UCP voters, only 60% say they would vote UCP again with 15% defecting to the NDP and 2% to other parties. Almost 1 in 4 past UCP voters say they are undecided.

Demographically, the NDP and UCP are statistically tied among those under 45 with younger Albertans be far more likely to be undecided than older Albertans. The NDP leads among those 45+. The NDP also leads among men and women.

Regionally, the NDP is well ahead in Edmonton, tied with the UCP in Calgary, and trail the UCP outside of the two major cities.

NOTLEY BARELY AHEAD OF SMITH AS PREFERRED PREMIER

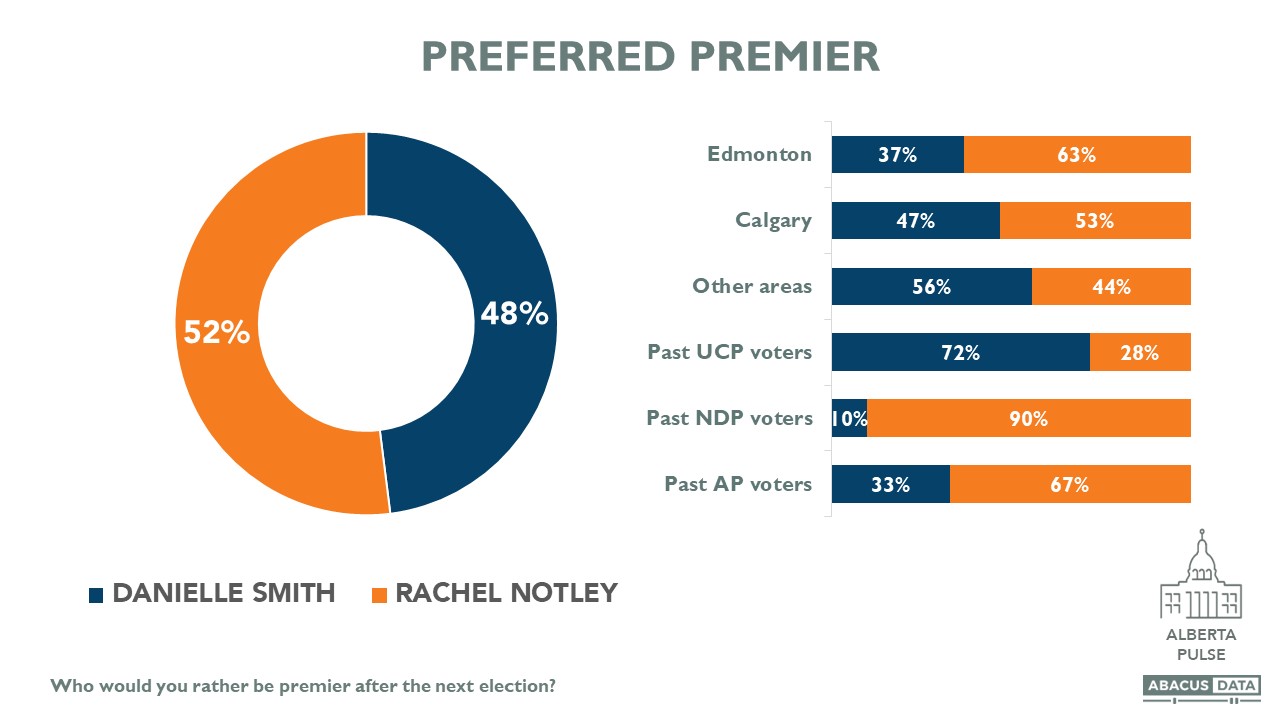
Despite a 9-point lead among decided voters, Albertans are split on who they would prefer to be Premier after the next election. 52% would prefer Rachel Notley while 48% would prefer Danielle Smith.

90% of past NDP supporters would prefer Notley while 10% would prefer Smith. Among past UCP supporters, 72% would prefer Smith while 28% would prefer Notley. In Edmonton, Notley leads by almost 30 points while in Calgary, it’s almost evenly divided 53% to 47%. In other areas of the province, Smith leads Notley by 12 (56% to 44%).

CONCLUSIONS SO FAR

This snapshot of Alberta public opinion points to an advantage for the Alberta NDP and Rachel Notley in the early days of Danielle Smith’s time in office. The Alberta NDP has a lead in vote intentions, the more popular leader, and issues ownership on more of the top issues for voters.

Danielle Smith starts her mandate as Premier with a mixed-opinion environment. The UCP has an equal-sized voter pool as the NDP but the Premier’s image is more negative than Rachel Notley’s, a significant portion of 2019 UCP voters believe she will be worse as premier than Jason Kenney, and she trails Notley on some key issues.

But to really understand the dynamics heading into the next election, we need to step away from demographic or regional comparisons, and focus on segments of the electorate based on their past and intended behaviours and preferences.

THE ROAD TO THE 2023 PROVINCIAL ELECTION

There are four key voter segments within the electorate that will be key to the outcome of the next provincial election.

• Loyal UCP voters are those who voted UCP in 2019 and say they would vote UCP again today. They represent about 27% of eligible voters.
• Loyal NDP voters are those who voted NDP in 2019 and say they would vote NDP again today. They represent about 24% of eligible voters.
• Smaller party voters are those who voted for the Alberta Party, Liberal Party or another one of the smaller parties in the last election.
• Reluctant UCP voters are those who voted UCP in 2019 and today say they are undecided or would vote for another party, not the UCP. They represent about 16% of the electorate. In my opinion, understanding and tracking this group is critical to anticipating how the next election will turnout.
• The remaining electorates either didn’t vote in the last election (and likely won’t vote again unless they are newly eligible) or are the small segment who voted NDP but say they wouldn’t vote NDP again.

Let’s unpack how these four groups differ and put a spotlight on that reluctant UCP group.

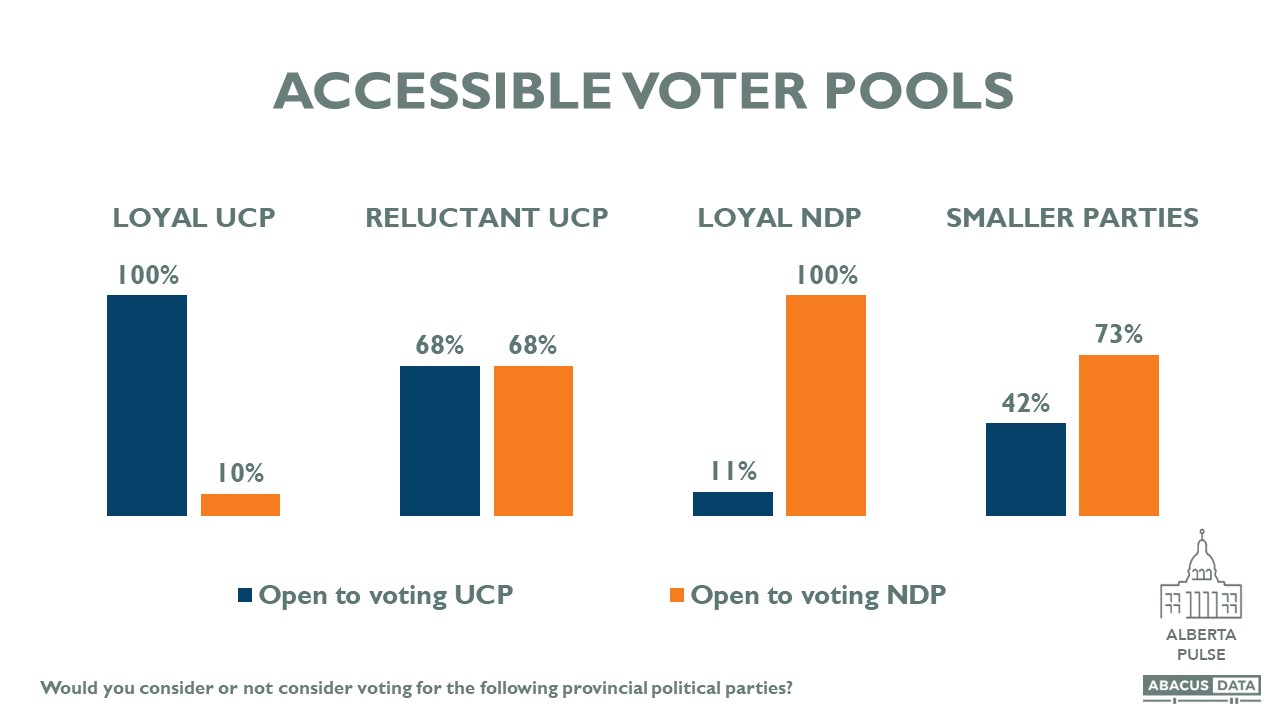
First, let’s look at accessible voter pools. 100% of loyal UCP voters would consider voting UCP but only 10% would consider the NDP. In contrast, 100% of loyal NDP voters would consider voting NDP but only 11% would consider the UCP. There’s not much growth for the opposing party in these two groups so we can expect these two to remain constant in size and mobilizing them becomes more important.

But interestingly, among the reluctant UCP group, 68% are open to voting UCP and 68% are open to voting for the NDP. That’s a high level of overlap demonstrating the potential “swingness” (I know, not a word) of this segment.

Among the smaller party voters, 73% are open to voting NDP while 42% are open to voting UCP.

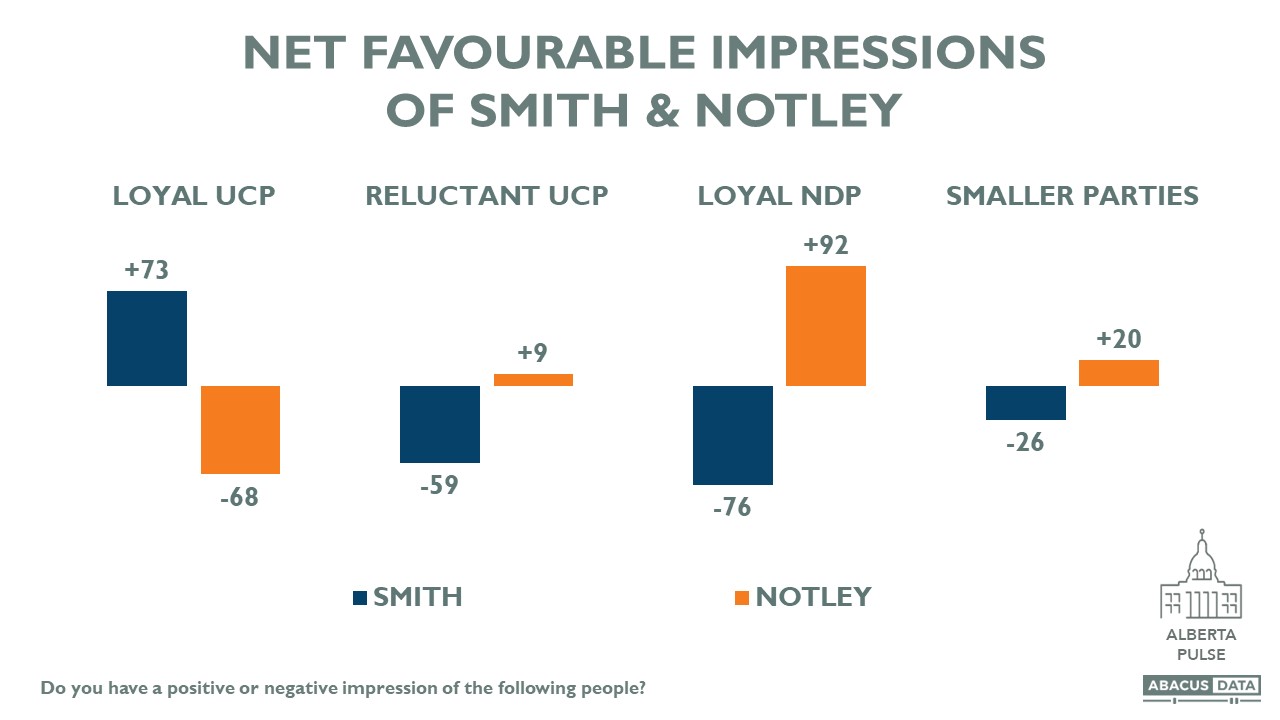
Second, when it comes to leader images, loyal UCP and NDP voters like their party’s leader and dislike the other major party leader. Among smaller party voters, Rachel Notley’s image is generally positive while Danielle Smith’s is negative.

But among the reluctant UCP group, Smith has a pretty negative net favourable rating (-59) while Notley has a net positive (+9). The Upshot: Notley is largely accepted by the group while Smith is disliked.

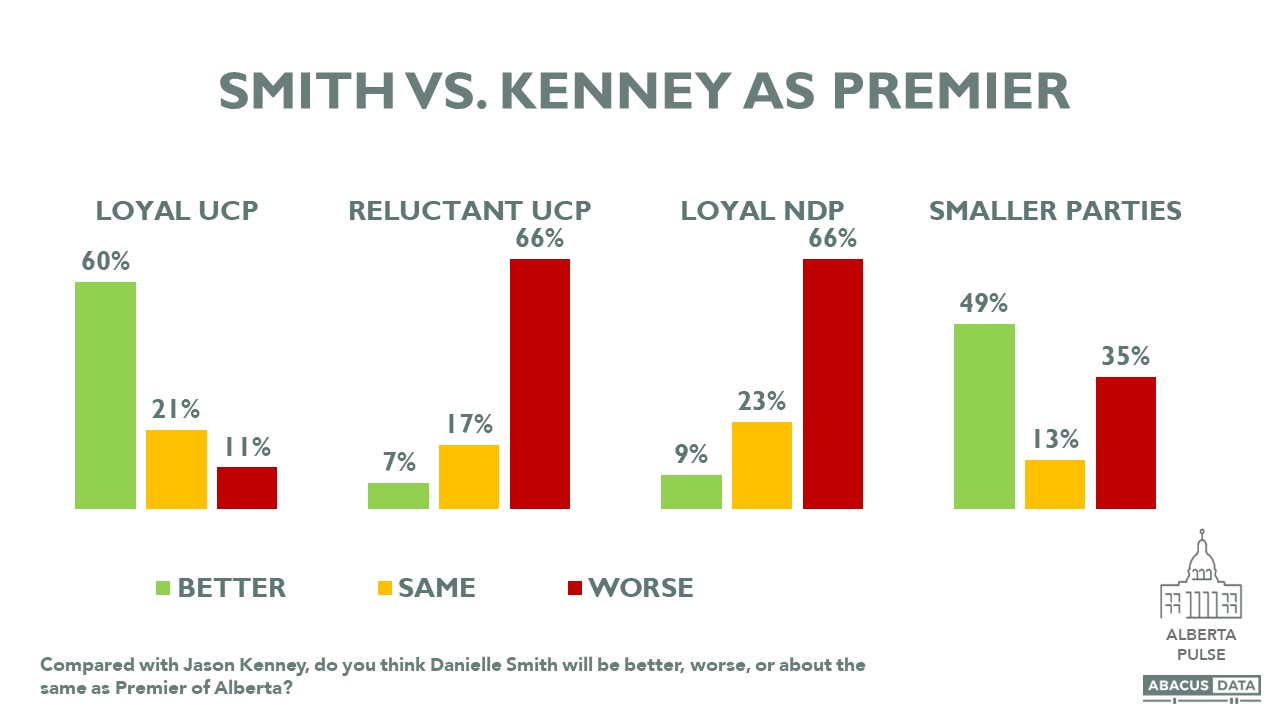
One challenge for Danielle Smith among the reluctant UCP group is that 2 in 3 think she will be a worse premier than Jason Kenney and only 7% think she will be better. This group’s perception is almost an exact replica of the loyal NDP group and a mirror opposite of the loyal UCP group. The Upshot: Smith needs to change this view among the reluctant group. One way to do that is to focus on issues they care about.

On issues, the priorities for reluctant UCP voters look more similar to loyal NDP voters than they do for loyal UCP voters. Healthcare is a top priority for 2 in 3 while only 46% of loyal UCP voters put healthcare as their top issue. But, reluctant UCP voters are more likely to rank keeping taxes low and managing the economy as a priority than loyal NDP voters. The Upshot: Framing the choice in the next election becomes critical. For the UCP to win over the reluctants, they should focus on the economy and taxes while NDP should make it all about healthcare.

And issue salience and ownership becomes important, depending on how the election is framed. For example, among reluctant UCP voters, the UCP has a 5-point advantage on who they would trust most to manage the economy. But they trail the NDP by almost 30 points on healthcare and 7 points on the cost of living. On the two most important issues for these voters today, the NDP has a clear advantage.

The Upshot: Many are unsure – which leaves the door open for this to change over time – but right now, this is advantage NDP.

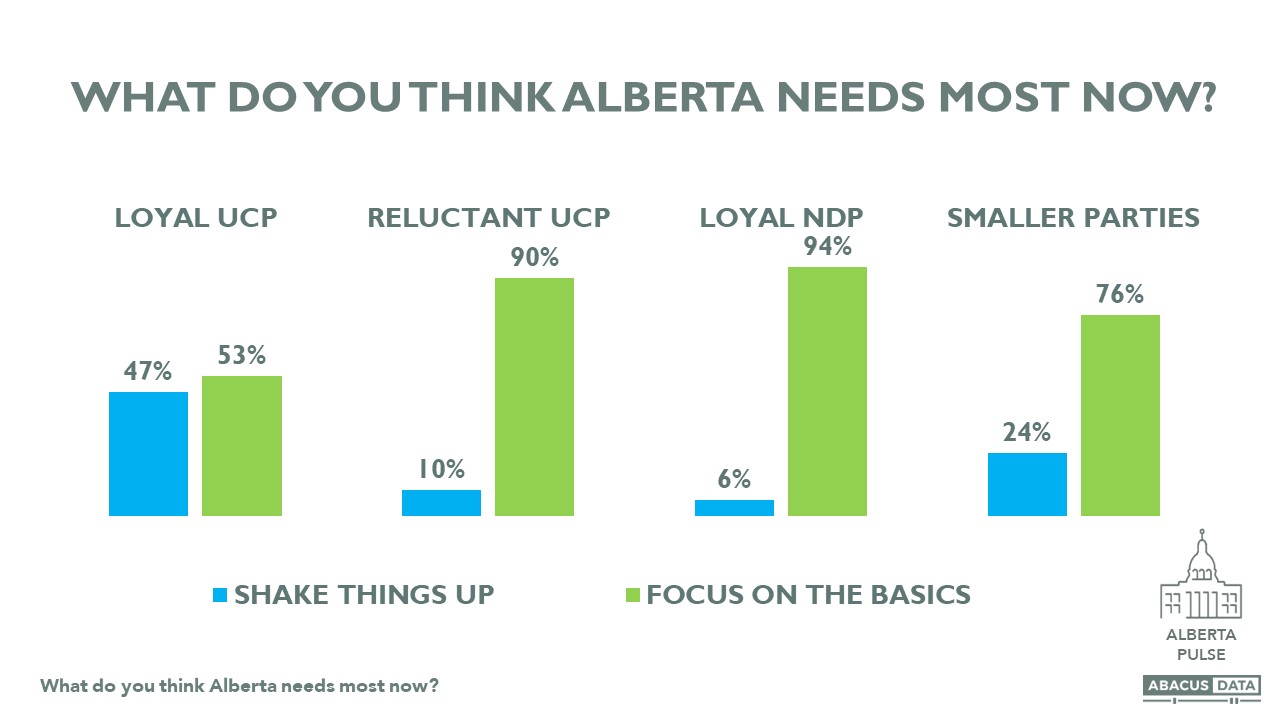
Beyond specific issues, the perceived approach the government and government-in-waiting take in governing is important. Earlier I shared the results of a question asking Albertans to choose between two approaches. 1 in 4 overall wanted a government that would shake things up and takes on the elites and Justin Trudeau who are trying to change Alberta.

The results across these four groups are instructive, in my view, to explain why so many of the reluctant UCP voters have defected from the UCP. They aren’t interested in shaking things up – they just want a government that focuses on the basics – manage the economy, improve health and education, and improve transit and transportation.

But among the loyal UCP, views are more split. Almost equal numbers are divided between the two options. The Upshot: Smith and her government have done a good job engaging a big part of their base in the early days but they have alienated a key component of the 2019 coalition. That has exposed them and opened a door for the NDP to convert this group.

The survey also asked Albertans to rate several political leaders on a scale from 0 to 100 where 0 means they really dislike the person and 100 means they really like them.

The results provide a useful look the differences between the groups. Perhaps most important are these two findings. First, loyal UCP voters have a more positive impression of Donald Trump than they do of Rachel Notley or Justin Trudeau. In fact, it’s fair to say that the loyal UCP group hates Justin Trudeau.

But views are quite different among the reluctant UCP group. They really dislike Trump, are less angry with Trudeau and like Jason Kenney far more than they like Daniel Smith. In fact, Smith’s average rating is only slightly higher than that of Justin Trudeau in this group.

Then there’s a comparison about how these groups feel about some surrounding issues.

Reluctant UCP voters are closer to the loyal UCP group when it comes to views about the influence of oil companies in politics (they are pro-energy) and they share the view that the economic policies of the federal government seem to help other provinces at the expense of Alberta.

But they are in between the two loyal groups on climate change, social conservatism, and on whether vaccine mandates are wrong and go against people’s basic human rights. 59% of loyal UCP voters agree that mandates are wrong compared with only 27% of the reluctant group and 11% of loyal NDP voters.

Finally, you’re probably wondering who are these reluctant UCP voters?

They are more likely to be female than male (62% vs. 38%). They are evenly distributed across age groups. They are more concentrated in Calgary and in other communities across the province and less likely to be living in Edmonton. 88% of them voted Conservative in the last federal election.

Perhaps the best way to describe them is they are traditional PC voters. Think those who felt comfortable voting for Alison Redford, Jim Prentice, or Ed Stelmach. These are likely the same voters who also cast ballots for Nenshi or Gondek in Calgary.

They are pro-growth, pro-energy in their outlook, but are looking for sensible, responsible government. They don’t want drama, they want a policy focus on things that matter to them – a strong economy, good public services, and stability.

This group is leaning NDP right now because they don’t think Danielle Smith and her government are offering that.

Take their views on the Sovereignty Act. Only 10% think it’s a good idea while 65% think it’s a bad idea – including 42% who think it’s a very bad idea.

FINAL THOUGHTS

If the next election will be won or loss in Calgary and some of the smaller cities like Lethbridge and Red Deer, then how this reluctant UCP votes (if they vote at all), will likely be the determining factor in the election. They represent about 15% of voters in Calgary and about 20% in the smaller cities across the province.

Alberta is now a two-party province. The core UCP and NDP vote pools are similar in size. The swing vote, a group of mostly female, progressively conservative voters, will decide the outcome of the next provincial election. If the UCP and Danielle Smith think they will win simply by motivating their core base to vote with policy ideas that repel far more voters than they attract, Alberta may wake up the day after the election with another NDP government.

METHODOLOGY

The survey was conducted with 1,000 Alberta adults from December 6 to 10, 2022. A random sample of panelists were invited to complete the survey from a set of partner panels based on the Lucid exchange platform. These partners are typically double opt-in survey panels, blended to manage out potential skews in the data from a single source.

The margin of error for a comparable probability-based random sample of the same size is +/- 3.1%, 19 times out of 20.

The data were weighted according to census data to ensure that the sample matched Alberta’s population according to age, gender, educational attainment, and region. Totals may not add up to 100 due to rounding.

This survey was paid for by Abacus Data Inc.

Abacus Data follows the CRIC Public Opinion Research Standards and Disclosure Requirements that can be found here:  https://canadianresearchinsightscouncil.ca/standards/

ABOUT DAVID COLETTO

David Coletto is CEO and a founding partner of Abacus Data a full-service market research and strategy firm based in Ottawa and Toronto. With over a decade and a half of experience in the industry, David and his partners founded Abacus 12 years ago and since then David has become one of Canada’s most respected social researchers regularly commenting on politics, the labour market, and consumer behaviour.

He earned a PhD in Political Science from the University of Calgary in 2010 is an adjunct professor at Carleton University. He is the host and producer of inFocus with David Coletto a podcast that explores the intersection of public opinion, politics, public policy, and consumer behaviour.

ABOUT ABACUS DATA

We are the only research and strategy firm that helps organizations respond to the disruptive risks and opportunities in a world where demographics and technology are changing more quickly than ever.

We are an innovative, fast-growing public opinion and marketing research consultancy. We use the latest technology, sound science, and deep experience to generate top-flight research-based advice to our clients. We offer global research capacity with a strong focus on customer service, attention to detail, and exceptional value.

We were one of the most accurate pollsters conducting research during the 2021 Canadian election following up on our outstanding record in 2019.

Contact us with any questions.

Find out more about how we can help your organization by downloading our corporate profile and service offering.

Six in ten Canadians believe an electric vehicle will ultimately cost them less than a gas car

Most Canadians believe that an electric vehicle will end up costing them less, despite a higher upfront cost, than a gas vehicle. Almost six in ten Canadians believe that an electric vehicle will end up being cheaper for them over a gas vehicle, while 41% think gas will end up being cheaper.

At the same time, 72% of Canadians believe that it is certain, very likely, or likely that a majority of consumer vehicles sold around the world will be electric. 28% think it is unlikely to happen.

A majority in every region of the country and across the political spectrum believe that it is likely that most vehicles sold around the world will be electric vehicles.

When asked whether they are more likely to purchase an electric or gas vehicle, 29% say they are likely or certain to choose an electric vehicle, while another 29% say they are inclined to buy electric. In contrast, 17% say they are inclined to buy a gas or diesel vehicle, while 25% say they are very likely or certain to buy a gas vehicle for their next car.

Younger Canadians (those under 45) and those in B.C., Ontario, and Quebec are more likely to say they will purchase an electric vehicle than those in other regions/provinces or in older age groups. 72% of Liberal supporters, 64% of NDP supporters, and 74% of Green Party supporters are inclined to buy an EV, while 42% of Conservative Party supporters say they will.

Canadian consumers who say they are very likely or certain to buy gas or diesel has held consistent over time (ranging from 23% to 25%), while those certain or very likely to buy an EV are up slightly from January 2022, but still down from 2021.

UPSHOT

According to David Coletto, Chief Executive Officer of Abacus Data: “While interest in electric vehicles hasn’t increased substantially, most Canadians continue to believe that EVs will be the majority of consumer vehicles sold around the world and most are inclined to purchase one as their next vehicle because consumers believe they will save them money in the long run, even if the upfront cost remains higher than a gas vehicle.”

According to Trevor Melanson, Communications Director of Clean Energy Canada: “It’s encouraging to see that a majority of Canadians understand the benefits of switching to electric, even though most haven’t done so yet. Research conducted by Clean Energy Canada has shown that driving an EV—while generally pricier upfront—will ultimately cost thousands of dollars less than driving an equivalent gas car over eight years of ownership.”

METHODOLOGY

The survey was conducted with 1,500 Canadian adults from November 25 to December 1, 2022. A random sample of panelists were invited to complete the survey from a set of partner panels based on the Lucid exchange platform. These partners are typically double opt-in survey panels, blended to manage out potential skews in the data from a single source.

The margin of error for a comparable probability-based random sample of the same size is +/- 2.5%, 19 times out of 20.

The data were weighted according to census data to ensure that the sample matched Canada’s population according to age, gender, educational attainment, and region. Totals may not add up to 100 due to rounding.

The survey was paid for by Clean Energy Canada.

ABOUT ABACUS DATA

We are the only research and strategy firm that helps organizations respond to the disruptive risks and opportunities in a world where demographics and technology are changing more quickly than ever.

We are an innovative, fast-growing public opinion and marketing research consultancy. We use the latest technology, sound science, and deep experience to generate top-flight research-based advice to our clients. We offer global research capacity with a strong focus on customer service, attention to detail and exceptional value.

We were one of the most accurate pollsters conducting research during the 2021 Canadian election following up on our outstanding record in 2019.

Contact us with any questions.

Find out more about how we can help your organization by downloading our corporate profile and service offering.

Canadians see a Clean Energy System as More Affordable and More Secure than a Fossil Fuel Energy System

Eight in ten think it’s important for Canada to invest in clean energy opportunities in response to the American Inflation Reduction Act investments in climate action.

In the latest round of survey work by Clean Energy Canada and Abacus Data, Canadians believe a clean energy system that includes hydro, wind, solar power and electric vehicles would be both more affordable and more secure than a fossil fuel energy system.

Key findings include:

• Two-thirds think a clean energy system would be more affordable than a fossil fuel energy system. This view is shared by a majority in every region or province, except for Alberta. Over seven in ten Liberal, NDP, and Green Party supporters feel this way, as do 4 in 10 Conservative Party supporters.

• Two-thirds also think a clean energy system would be more secure – that is, a system where prices and supply are less influenced by goal markets. This view is shared by a majority in every region or province, including in Alberta. Over three in four Liberal, NDP, and Green Party supporters feel this way, as do half of Conservative Party supporters.

• Just under half of Canadians are aware of the Inflation Reduction Act passed by the U.S. government which invests $370 billion dollars into climate action to spur investment in clean energy and greenhouse gas emission reductions.

• When asked whether it is important or not for Canada to also invest in clean-energy-related economic opportunities, 83% say it is either very or somewhat important. Large majorities in every region of the country and across the political spectrum share this view.

UPSHOT

According to David Coletto, Chief Executive Officer of Abacus Data: “Perceptions about the affordability and security of clean energy are becoming clearer as geopolitical conflict and rising inflation impact Canadians directly. A clear majority believe that a clean energy system will be both more affordable and more secure than one based on fossil fuels.”

According to Trevor Melanson, Communications Director of Clean Energy Canada: “Increasingly, Canadians see that the transition to clean energy is not only an economic opportunity—but an opportunity to lower their energy bills. Canadians also recognize clean energy as more secure. This view reflects reality, as clean energy electricity rates are less beholden to global markets.”

METHODOLOGY

The survey was conducted with 1,500 Canadian adults from January 20 to 25th, 2022. A random sample of panelists were invited to complete the survey from a set of partner panels based on the Lucid exchange platform. These partners are typically double opt-in survey panels, blended to manage out potential skews in the data from a single source.

The margin of error for a comparable probability-based random sample of the same size is +/- 2.53%, 19 times out of 20.

The data were weighted according to census data to ensure that the sample matched Canada’s population according to age, gender, educational attainment, and region. Totals may not add up to 100 due to rounding.

The survey was paid for by Clean Energy Canada.

ABOUT ABACUS DATA

We are the only research and strategy firm that helps organizations respond to the disruptive risks and opportunities in a world where demographics and technology are changing more quickly than ever.

We are an innovative, fast-growing public opinion and marketing research consultancy. We use the latest technology, sound science, and deep experience to generate top-flight research-based advice to our clients. We offer global research capacity with a strong focus on customer service, attention to detail and exceptional value.

We were one of the most accurate pollsters conducting research during the 2021 Canadian election following up on our outstanding record in 2019.

Contact us with any questions.

Find out more about how we can help your organization by downloading our corporate profile and service offering.

Changes at Abacus Data and spark*advocacy

After many enjoyable and successful years collaborating on the growth of Abacus Data, Bruce Anderson and David Coletto are pleased to announce some changes.

Bruce Anderson will leave his role as Chairman at the end of 2022 and launch a new market research and intelligence division of spark*advocacy, called spark*insights. David Coletto, currently Abacus Data’s Chief Executive Officer, will take on the role of Abacus Chairman starting January 1, 2023.

“When we started our work together almost 10 years ago, the intent was to spend a couple of years on that collaboration. We had so much fun and success, it never seemed like the right time to bring it to a close. David is a talented and experienced research professional and a friend. I will continue to cheer him and the whole team on,” said Anderson.

“Bruce has helped Abacus Data become one of Canada’s premier insights firms, serving as a mentor and partner. Since we started working together, Abacus has grown and developed deep relationships with some of Canada’s leading companies, unions, and associations. We’ve built a stellar team of professionals and now have offices in both Toronto and Ottawa,” said Coletto. “Our current and future clients can expect the quality, attention to detail, and responsiveness that has helped differentiate our team in the marketplace.”

spark*insights will provide consulting, research and data-based insights into communications and advocacy, employing a wide range of data inputs, including data from the hundreds of advocacy and reputation campaigns spark* has developed and managed. Anderson will continue to provide clients with reputation and issue-based polling, leveraging Abacus Data’s research team.

Bruce Anderson is one of the founding partners of spark*advocacy, Canada’s most successful agency exclusively working in the field of public affairs communications, creative, and audience targeting. spark* works closely with associations, NGOs, charities, and corporations to support their reputation, advocacy, activation and ESG activities. spark*advocacy is owned by Anderson, Perry Tsergas (President & Chief Executive Officer) and Adrian Jean (Chief Creative Officer).

“Over the last few years, the pull to put more of my time into spark*advocacy (along with the pull of grandkids, Scotland, and oil painting) has been strong,” said Anderson. “I’m excited about our groundbreaking measurement around advocacy.”

David Coletto has been CEO of Abacus Data since he and his partners founded the firm in 2010. David is regularly asked to comment on politics, public policy, consumer behaviour, and the labour market by news organizations. He is an adjunct professor at Clayton H. Riddell Graduate Program in Political Management at Carleton University and serves on the boards of Ottawa Riverkeeper and the Ottawa Board of Trade.

“For the past 12 years, Abacus Data has been delivering top-flight research and insights consulting services to some of North America’s leading brands, associations, and companies,” said Coletto.

“We help leaders make better decisions and use research and data to help organizations drive change by fully understanding their audiences. Our experienced, diverse, and talented team is ready to continue the remarkable trajectory the company has taken since we launched in 2010.”

For more information, please contact:

David Coletto
david@stagesite.abacusdata.ca

Bruce Anderson
banderson@sparkadvocacy.ca

ABOUT ABACUS DATA

We are the only research and strategy firm that helps organizations respond to the disruptive risks and opportunities in a world where demographics and technology are changing more quickly than ever.

We are an innovative, fast-growing public opinion and marketing research consultancy. We use the latest technology, sound science, and deep experience to generate top-flight research-based advice to our clients. We offer global research capacity with a strong focus on customer service, attention to detail, and exceptional value.

We were one of the most accurate pollsters conducting research during the 2021 Canadian election following up on our outstanding record in 2019.

Contact us with any questions.

Find out more about how we can help your organization by downloading our corporate profile and service offering.

Holiday Celebrations Reborn, Regardless of What Public Health and Officials Say

In our latest national survey completed on November 30th, we asked Canadians about their plans for holiday gatherings. Comparing our results to last year, Canadians are significantly more comfortable celebrating with family and friends this holiday season.

This year, only 12% intend to restrict their holiday plans to household members only. This is down from 51% who said the same last year.

As of right now 44% are taking a wait and see approach- saying they may still get together with family from different households, but will be extra cautious and safe (33% in 2021). 38% say they will get together with family for the holidays like they usually do, regardless of what health authorities say (8% in 2021).

If health authorities were to discourage gatherings as they have done in the past, close to 1 in 5 say they would no longer gather, but overall, Canadians wouldn’t be halting their plans. In this situation only 20% indicated that they would follow these recommendations. 39% would still gather, but be extra cautious, and 34% would celebrate as usual, regardless of what health authorities say.

Results were fairly consistent across the country with BC residents being the most likely to follow recommendations and stay home,  and Ontario and Quebec residents being the least likely.

UPSHOT

Although provincial governments and health authorities have not yet suggested any limitations to holiday gatherings this season, there is a sizeable minority concerned about the risks.

However, what’s most concerning is the number of individuals who would not follow the guidance of provincial governments and health authorities. Holiday celebrations have been reborn, and are back to pre-pandemic intentions, regardless of what public health and officials say.

METHODOLOGY

The survey was conducted with 1,500 Canadian adults from November 25 to 30, 2022. A random sample of panelists were invited to complete the survey from a set of partner panels based on the Lucid exchange platform. These partners are typically double opt-in survey panels, blended to manage out potential skews in the data from a single source.

The margin of error for a comparable probability-based random sample of the same size is +/- 2.1%, 19 times out of 20.

The data were weighted according to census data to ensure that the sample matched Canada’s population according to age, gender, educational attainment, and region. Totals may not add up to 100 due to rounding.

ABOUT ABACUS DATA

We are the only research and strategy firm that helps organizations respond to the disruptive risks and opportunities in a world where demographics and technology are changing more quickly than ever.

We are an innovative, fast-growing public opinion and marketing research consultancy. We use the latest technology, sound science, and deep experience to generate top-flight research-based advice to our clients. We offer global research capacity with a strong focus on customer service, attention to detail, and exceptional value.

We were one of the most accurate pollsters conducting research during the 2021 Canadian election following up on our outstanding record in 2019.

Contact us with any questions.

Find out more about how we can help your organization by downloading our corporate profile and service offering.


Satisfaction Levels High with Segregated Funds and Mutual Funds

On behalf of the Canadian Life and Health Insurance Association, Abacus Data conducted research among a national sample of adult Canadians, including 709 people who had experience with segregated funds and 782 who had experience with mutual funds. This research was conducted between September 4th and October 3, 2022. Here are the key findings.

• 22% of Canadians have used segregated funds, and 52% have used mutual funds.

• Satisfaction levels with both investment product is high. Segregated funds enjoy stronger satisfaction levels compared to mutual funds especially when it comes to “protection against risk” and “reliable income in retirement”.

• In terms of the fees charged for the two products satisfaction levels are high, and somewhat higher for segregated funds. For segregated funds, 82% are satisfied that the “fees are comparable to other investments”, 9 points higher than for mutual funds.

• 85% are satisfied buyers are “given clear and transparent information” when they are sold segregated funds, compared to 78% for mutual funds.

• 88% of those with experience with segregated funds are satisfied they are “sold in an ethical and responsible way”.

We examined for regional, generational, or affluence-based differences of opinion. These differences were marginal: opinions were largely consistent across the country and different walks of life.

UPSHOT

The large majority of consumers who have invested in segregated funds feel they have been dealt with fairly, with transparency, and were charged fees that were comparable to other investment choices. When compared to results among those who have used mutual funds, satisfaction levels with segregated funds are higher across several criteria.

METHODOLOGY

Abacus Data conducted research among a national sample of adult Canadians, including 709 people who had experience with segregated funds and 782 who had experience with mutual funds. This research was conducted between September 4th and October 3, 2022. The survey was conducted online.

The survey was weighted to match the Canadian adult population by age, gender, region, education, and official language.

The research was paid for by the Canadian Life and Health Insurance Association.

ABOUT ABACUS DATA

We are the only research and strategy firm that helps organizations respond to the disruptive risks and opportunities in a world where demographics and technology are changing more quickly than ever.

We are an innovative, fast-growing public opinion and marketing research consultancy. We use the latest technology, sound science, and deep experience to generate top-flight research-based advice to our clients. We offer global research capacity with a strong focus on customer service, attention to detail, and exceptional value.

We were one of the most accurate pollsters conducting research during the 2021 Canadian election following up on our outstanding record in 2019.

Contact us with any questions.

Find out more about how we can help your organization by downloading our corporate profile and service offering.


Ford vs. Education Workers: How are Ontarians reacting?

On November 4th and 5th, we conducted a province-wide survey of 1,000 adults to explore initial public reaction to the labour dispute between the Ontario government and the province’s education workers who were set to strike on Friday.

The survey finds:

1. There is widespread awareness and significant attention being paid to the issue by the public.
2. More Ontarians blame the provincial government for school closures than education workers.
3. Half would support more unions walking off the job to protest with education workers.
4. 71% want the provincial government to negotiate a fair deal with education workers rather than continue with its current approach.
5. The political impact on the PCs has been limited thus far. They would win easily again if an election was held today.

Here are the detailed results:

ATTENTION AND AWARENESS OF THE LABOUR DISPUTE

Millions of Ontarians are paying attention and following news about education workers in Ontario going into a strike position and the provincial government’s response. 59% are following it very or pretty closely and over 80% are aware that the provincial government passed a law that forces workers back to work. 76% are aware that the provincial government invoked the notwithstanding clause.

Not surprisingly, parents of school-aged children are following the issue more closely. 36% are following very closely while 32% are following it pretty closely.

USE OF THE NOTWITHSTANDING CLAUSE

Half of Ontarians think it is a bad idea to use the notwithstanding clause to force education workers back to work while about 1 in 3 think it is a good idea.

Parents are more divided than Ontarians generally. 42% think it’s a good idea while 46% think it’s a bad idea. Among PC voters, 60% approve while about 3 in 10 disapprove of using the notwithstanding clause. Men are also 13-points more likely to think it’s a good idea to invoke the clause than women.

WHO IS TO BLAME FOR SCHOOLS BEING CLOSED?

More than 6 in 10 Ontarians blame the provincial government most for schools being closed while 4 in 10 blame education workers the most.

68% of parents of school-aged children blame the provincial government most, as do 70% of women, 69% of those following the issue closely, and 37% of 2022 PC voters.

WHAT SHOULD THE FORD GOVERNMENT DO NEXT?

More than 7 in 10 Ontarians want the Ford government to negotiate a fair deal with education workers to end the strike rather than continue the approach they have taken so far and insist on a lower wage increase for education workers. 29% prefer if the government continues its approach.

69% of parents and 56% of PC voters want the government to negotiate a fair deal.

One reason why Ontarians want the provincial government to negotiate a fair deal with education workers is because about half think they don’t make enough money. When asked whether non-teaching staff in schools make too much, not enough, or about the right amount, 50% say don’t make enough, 28% feel they make the right amount, while 7% say they make too much.

In fact, when we ask – “Do you think making $39,000 per year is enough or not enough given the rising cost of living across Ontario?”- 78% of Ontarians say that salary is not enough given the rising cost of living.

SHOULD OTHER UNIONS PROTEST WITH CUPE?

Almost half of Ontarians (48%) support other unions in Ontario walking off the job to protest the way the provincial government has handled the negotiation with education workers in the province. 33% are opposed while 20% are unsure.

51% of parents, 29% of PC voters, and 65% of those following the issue closely support other unions protesting with education workers.

THE POTENTIAL POLITICAL CONSEQUENCES

By a 2 to 1 margin, Ontarians say the way Doug Ford and the provincial government has dealt with negotiations makes them less likely to vote PC than more likely to vote PC. But, at this point, it doesn’t look like the issue is hurting the Ford government.

For example, while 1 in 5 past PC voters say they are less likely to vote PC, about 1 in 10 NDP and Liberal voters say they are more likely to vote PC because of it.

Parents of school-aged children are split at this point. 31% say they are more likely to vote PC while 38% say they are less likely to.

IMPRESSIONS OF PREMIER FORD & MINISTER LECCE

Since the June provincial election, Premier Ford’s personal image has become less positive and more negative. Today, 29% have a positive impression of the Premier (down 10 points) while 45% have a negative view (up 5 points).

When we asked about Education Minister Stephen Lecce, 15% have a positive view of him compared with 42% who have a negative view.

PROVINCIAL VOTE INTENTION

If an election was held at the time of the survey, the PCs would easily win another majority. 38% would vote PC, down 3 from the June election results. The Ontario Liberals and NDP are basically tied for second at 27% and 26% respectively. Both are up slightly from the results of the spring election.

The PCs have a wide lead among men, and among those over the age of 45 while being competitive among women and those aged 30 to 44. Of note, parents with children aged 15 or younger are slightly more likely to say they would vote PC than the province as a whole (40% vs. 38%). Among those parents, the PCs lead the Liberals by 13-points.

UPSHOT

This initial survey of public opinion in Ontario finds that many people are following this issue closely and are aware of the provincial government’s actions thus far. By a 2 to 1 margin, Ontarians blame the provincial government for schools being closed rather than education workers and about 7 in 10 want the provincial government to negotiate a fair deal with workers rather than continue with its current approach. We also find fairly wide support for other unions joining education workers in protesting the government’s approach to dealing with the labour dispute – especially among other unionized workers in both the private and public sectors.

Despite all of this, the Ford government hasn’t been hurt politically. While Doug Ford’s personal numbers are more negative than when the election campaign ended in June, the PCs would easily be re-elected today if an election was held at the time of the survey. Furthermore, while more say they would be less likely to vote PC than more likely to vote PC because of how the government has handled this issue, the proportion of those moving away from the PCs isn’t large enough to worry the Tories and the next election isn’t for more than 3 years from now.

But this is the starting point and views can shift over time depending on what happens next. We’ll continue to monitor public opinion and reactions.

METHODOLOGY

The survey was conducted with 1,000 Ontario residents aged 18 and over on November 4 to 5, 2022.

A random sample of panelists were invited to complete the survey from a set of partner panels based on the Lucid exchange platform. These partners are typically double opt-in survey panels, blended to manage out potential skews in the data from a single source.

The margin of error for a comparable probability-based random sample of the same size is +/- 3.1%, 19 times out of 20.

The data were weighted according to census data to ensure that the sample matched Ontario’s population according to age, gender, education, and region. Totals may not add up to 100 due to rounding.

This study was paid for by Abacus Data Inc.

ABOUT ABACUS DATA

We are the only research and strategy firm that helps organizations respond to the disruptive risks and opportunities in a world where demographics and technology are changing more quickly than ever.

We are an innovative, fast-growing public opinion and marketing research consultancy. We use the latest technology, sound science, and deep experience to generate top-flight research-based advice to our clients. We offer global research capacity with a strong focus on customer service, attention to detail, and exceptional value.

We were one of the most accurate pollsters conducting research during the 2021 Canadian election following up on our outstanding record in 2019.

Contact us with any questions.

Find out more about how we can help your organization by downloading our corporate profile and service offering.


Millions Following Emergencies Act Commission. Most are Concluding Ottawa Had No Better Choice

ATTENTION PAID TO THE EMERGENCIES ACT COMMISSION

About 1 in 5 people (16%) say they have been following the commission hearings closely, and another 50% “a little” while 34% are not following it at all.

Conservative (21%), Liberal (20%), and NDP (16%) voters are about as likely to be following the Commission closely.

DID OTTAWA MAKE THE RIGHT DECISION IN USING THE EMERGENCIES ACT

The majority (63%) believe the federal government “made the best choice it could in the circumstances, to use that law to deal with the situation” with the Ottawa convoy occupation.

A majority in every province think it was the best choice possible, although the majority was slim at 53%-47% in the three prairie provinces. Large majorities of NDP (68%) and Liberal voters (83%) feel it was the best available choice while Conservative Party voters are split (46% best choice -54% bad choice).

REACTION TO EMERGENCIES ACT HEARINGS

Based on what they are seeing or hearing from the hearings and the testimony, 62% say they are becoming more inclined to think the government had no better choice, while 38% say they are becoming more inclined to think the government made the wrong choice. The patterns suggest that few minds are being changed – original views are being reinforced.

The testimony heard at the committee thus far doesn’t seem to be moving many people from their original perspective on the use of the Emergencies Act although it may be moving more people toward accepting the use of the Act than rejecting its use.

Of those who think the federal government made the best choice it could in the circumstances, 88% said the inquiry has made them more inclined to think the government had no better choice but to use the law while 12% are more inclined to think the government made the wrong choice.

In contrast, among those who felt the government made a bad choice to use the Emergencies Act, 18% say they are now more inclined to think the government had no better choice but to use that law while 82% are more inclined to think the government made the wrong choice.

UPSHOT

Just as the Convoy generated a lot of attention last February, so too are the hearings about the use of the Emergencies Act that have attracted a lot of attention. So far, to this point in the proceedings (October 26th), the public assessment is not changing – most people supported the use of the Emergencies Act last winter and continue to think it was the best choice available.

METHODOLOGY

The survey was conducted with 1,500 Canadian adults from October 22 to 26, 2022. A random sample of panelists were invited to complete the survey from a set of partner panels based on the Lucid exchange platform. These partners are typically double opt-in survey panels, blended to manage out potential skews in the data from a single source.

The margin of error for a comparable probability-based random sample of the same size is +/- 2.1%, 19 times out of 20.

The data were weighted according to census data to ensure that the sample matched Canada’s population according to age, gender, educational attainment, and region. Totals may not add up to 100 due to rounding.

This survey was paid for by Abacus Data Inc.

Abacus Data follows the CRIC Public Opinion Research Standards and Disclosure Requirements that can be found here:  https://canadianresearchinsightscouncil.ca/standards/

ABOUT ABACUS DATA

We are the only research and strategy firm that helps organizations respond to the disruptive risks and opportunities in a world where demographics and technology are changing more quickly than ever.

We are an innovative, fast-growing public opinion and marketing research consultancy. We use the latest technology, sound science, and deep experience to generate top-flight research-based advice to our clients. We offer global research capacity with a strong focus on customer service, attention to detail, and exceptional value.

We were one of the most accurate pollsters conducting research during the 2021 Canadian election following up on our outstanding record in 2019.

Contact us with any questions.

Find out more about how we can help your organization by downloading our corporate profile and service offering.


COVID Anxiety Ticks Up, More Take Vaccine Boosters

WORRY LEVELS LOW, BUT NOTCHING UPWARD

5% are “extremely worried” or “worried a lot” about Covid19, which is only a marginal change from our last wave, but 29% say their level of concern has increased recently, which is up 10 points. The degree of worry hasn’t intensified, but awareness of growing risk is up.

INFECTION RATES, AND SYMPTOM REPORTS UNCHANGED

A total of 44% say they are sure they had or probably had Covid, up 4 points.  70% of those who believe they were infected say that their symptoms were “uncomfortable but not bad” or had hardly any symptoms. Older people and those with more doses of vaccine reported less severe symptoms.

LARGE MAJORITY EXPECT MILD OR DISAPPEARING COVID THIS FALL

Just 11% anticipate that there will be a lot of severe illness and hospitalizations from Covid this fall, unchanged over the month.  The majority expects a lot of cases, but mild symptoms (66%) or that “fewer and fewer will get Covid and eventually it will disappear” (23%).

MOST WANT GOVERNMENT TO BE VIGILANT BUT RESTRAINED

Most (52%) want government is to be prepared to introduce measures if things worsen, “but not to push too hard”. About a quarter (28%) say under no circumstances should government put in mask, vaccine or other rules.  One in five (20%) say government should take all possible measures to reduce the spread of the disease. These numbers are relatively stable.

RISING NUMBERS GETTING BOOSTED, BUT HESITANCY STILL ELEVATED.

While 90% of the adults surveyed have had some vaccination against Covid, but not all of those are willing to take a booster this fall.  We have seen a significant uptick in the number who report that they either already have or will take a booster this fall (totalling 52%) and 16% say they will not take one.  The total persuadable but hesitant group is now 32%.

Two out of three (69%) think it is certain or probably that the high vaccination rate for Covid in Canada helped save lives compared to what would have happened if fewer people had been vaccinated.  Another 18% say this may be the case, while 13% are doubtful or reject the value of the vaccinations.

MASK MANDATES: MOST WOULD FOLLOW, BUT NOT ALL HAPPILY

If their provincial government mandated wearing masks in public places, 59% would support and follow that guidance, while 28% say they would follow the guidance but be unhappy about that decision by government.  13% say they would dislike the decision and ignore it.

UPSHOT

Anxiety levels of Covid are up slightly, but people remain broadly of the view that the severity will be moderate and hospitalizations relatively few.  While more people are taking the recommended fall boosters, a significant proportion of those who have been vaccinated in the past is holding off getting another shot.  People are not wanting governments to abandon vigilance but they do want public policy that errs on the side of restraint when it comes to additional actions, unless and until they become more aware and worried about what is happening with the virus.

METHODOLOGY

The survey was conducted with 1,500 Canadian adults from October 22 to 26, 2022. A random sample of panelists were invited to complete the survey from a set of partner panels based on the Lucid exchange platform. These partners are typically double opt-in survey panels, blended to manage out potential skews in the data from a single source.

The margin of error for a comparable probability-based random sample of the same size is +/- 2.1%, 19 times out of 20.

The data were weighted according to census data to ensure that the sample matched Canada’s population according to age, gender, educational attainment, and region. Totals may not add up to 100 due to rounding.

This survey was paid for by Abacus Data Inc.

Abacus Data follows the CRIC Public Opinion Research Standards and Disclosure Requirements that can be found here:  https://canadianresearchinsightscouncil.ca/standards/

ABOUT ABACUS DATA

We are the only research and strategy firm that helps organizations respond to the disruptive risks and opportunities in a world where demographics and technology are changing more quickly than ever.

We are an innovative, fast-growing public opinion and marketing research consultancy. We use the latest technology, sound science, and deep experience to generate top-flight research-based advice to our clients. We offer global research capacity with a strong focus on customer service, attention to detail, and exceptional value.

We were one of the most accurate pollsters conducting research during the 2021 Canadian election following up on our outstanding record in 2019.

Contact us with any questions.

Find out more about how we can help your organization by downloading our corporate profile and service offering.