The Happiness Monitor- Who is the happiest?
December 15, 2020
One of the things we are most interested in when starting the Happiness Monitor was answering the question; ‘who is the happiest?’. We took a look at some difference demographics to see how happiness compares to build a portrait of national happiness.
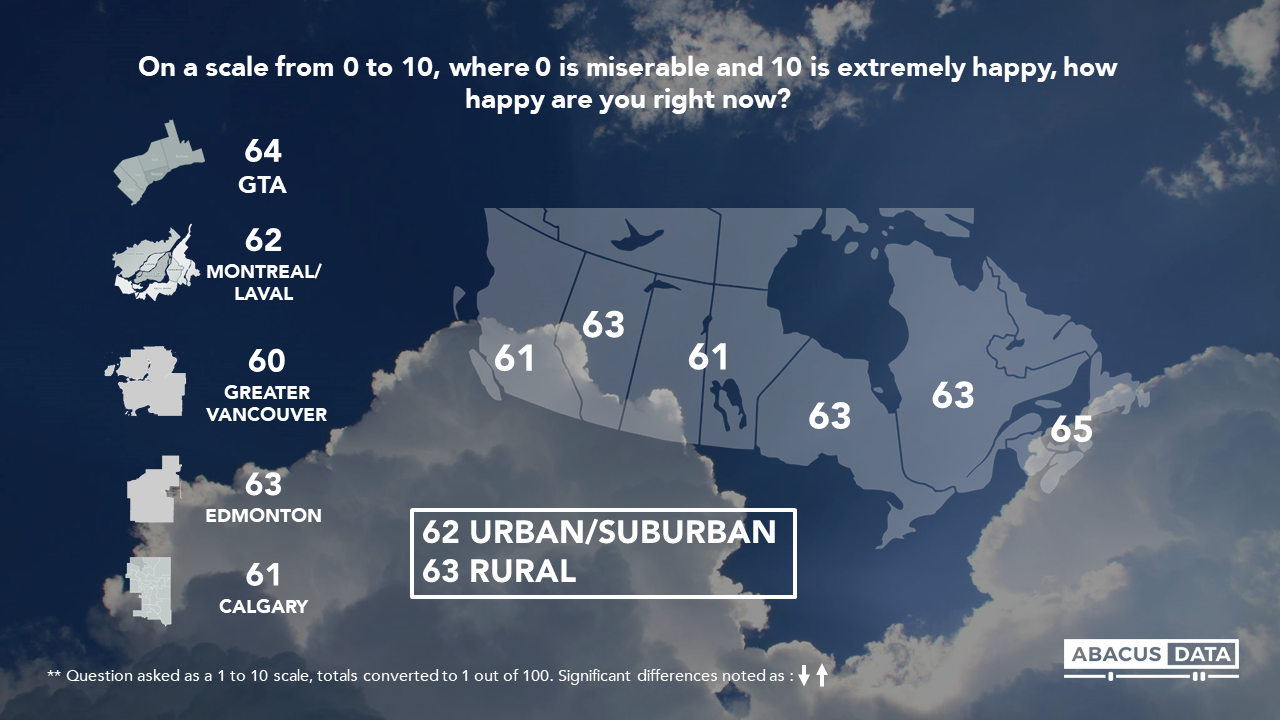
Where are the happiest people in Canada?
Looking at the data from our latest survey- out of field last week-happiness is fairly consistent across the country.
There isn’t much difference between the happiness of people in major cities, nor is there a difference if you’re living in an urban or rural area.
Does age bring happiness? What about money?
It turns out that in Canada, older people tend to be happier than younger people. Aside from a big jump in happiness once you get past 30, happiness grows steadily.
Education and household income both do bring some level of happiness but they too also have limits. Once someone’s household income exceeds $50K the changes to their level of happiness are negligible. Turns out that the phrase ‘money buys happiness’ has its limits.
What does bring happiness however, is employment. The stability offered by employment, does more for our happiness than education and even income. Retirement also bring happiness.
Are religious people more happy?
At least in Canada, the answer right now is yes. There is a notable difference in happiness, between those who are religious and those who are not. Perhaps belonging to a religious denomination also brings stability to one’s life.
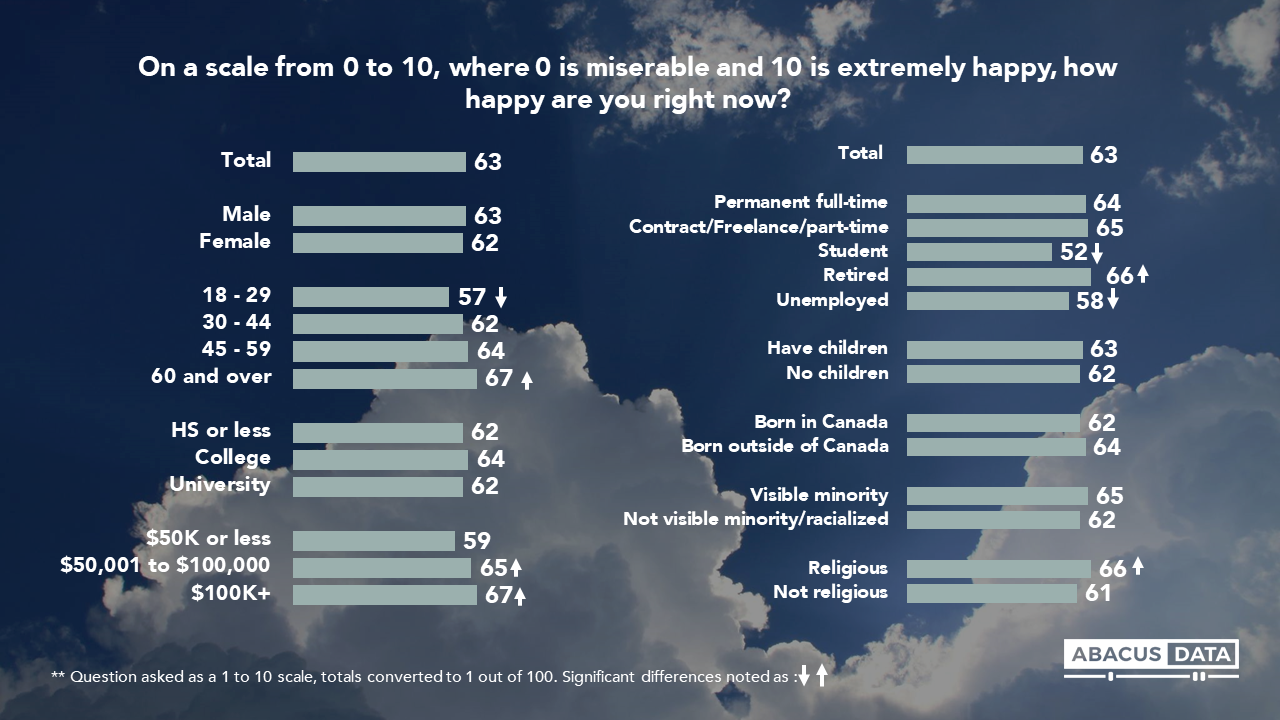
We found very little differences between the happiness of people with children vs. people without, those born in Canada vs. those born elsewhere, and those who identify as part of a visible minority/racialized community and those who do not. And surprisingly, there is little difference between men and women.
What about politics?
There are some interesting differences in the happiness of difference political party supporters. Conservative supporters are happier than the average Canadian-but not any more happy that Liberal voters. And NDP and Green Party voters are the least happy.
Perhaps most importantly though, is the difference in happiness between those who did vote and those who did not. The average happiness score among those who did vote was 6.3. Among those who did not vote it fell to 5.6.

UPSHOT
According to Richard Jenkins: Social determinants of happiness are clearly evident but not overwhelming. Overall, our collective happiness is a great indicator of public mood and the gaps between the happiness of different groups in society are a yardstick for understanding changes in inequality.
According to Oksana Kishchuk: These findings take me back to psychology classes on Maslow’s hierarchy of needs. In Canada, happy people tend to be those that are given more upward mobility by virtue of their age, income, employment or school. All of these things give us more stability to think beyond our basic needs and look instead for what we find most fulfilling. We can take the time to be aspirational and optimistic about our own futures, and the future of our country. But there is also an upper limit- once we’ve satisfied these basic needs for quality of life-enough income to eat well, and an income that will give us financial stability, its harder to make bigger gains in our happiness.
To subscribe to updates and releases on the Happiness Monitor, click here.
ABOUT ABACUS DATA
We are the only research and strategy firm that helps organizations respond to the disruptive risks and opportunities in a world where demographics and technology are changing more quickly than ever.
Find out more about what we are doing to help clients respond to the COVID-19 pandemic.
We are an innovative, fast-growing public opinion and marketing research consultancy. We use the latest technology, sound science, and deep experience to generate top-flight research-based advice to our clients. We offer global research capacity with a strong focus on customer service, attention to detail and exceptional value.
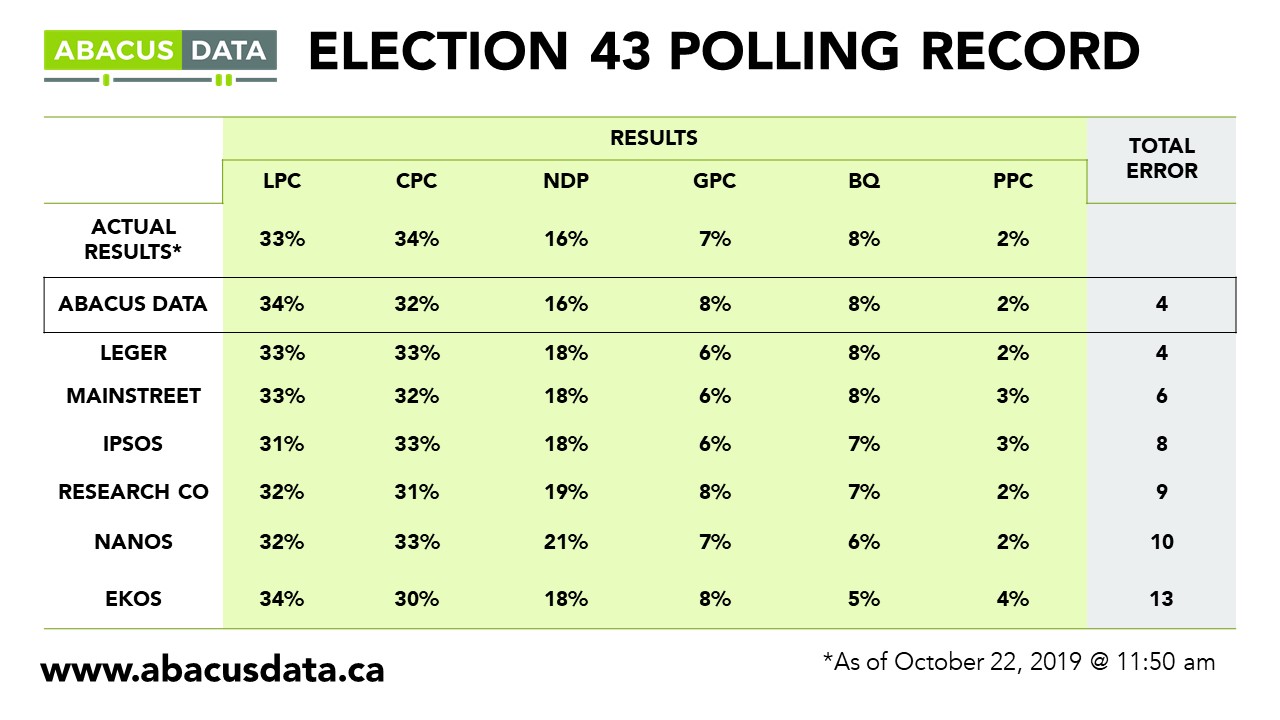
We were one of the most accurate pollsters conducting research during the 2019 Canadian Election.
Contact us with any questions.
Find out more about how we can help your organization by downloading our corporate profile and service offering.
METHODOLOGY
The survey was conducted with 2,000 Canadian adults from December 2nd to 6th, 2020. A random sample of panellists was invited to complete the survey from a set of partner panels based on the Lucid exchange platform. These partners are typically double opt-in survey panels, blended to manage out potential skews in the data from a single source.
The margin of error for a comparable probability-based random sample of the same size is +/- 2.1%, 19 times out of 20.
The data were weighted according to census data to ensure that the sample matched Canada’s population according to age, gender, educational attainment, and region. Totals may not add up to 100 due to rounding.
**The results were converted to an index from 0-100.