In the final days of the 2021 Canadian general election, our team is tracking public opinion and intentions about the election daily.
Each evening from Wednesday, September 15 to Saturday, September 18, we will be releasing the results of a three-day rolling poll of about 1,500 eligible voters who say they will definitely be voting or have already voted in the election. Each day about 500 interviews are conducted online.
SUMMARY
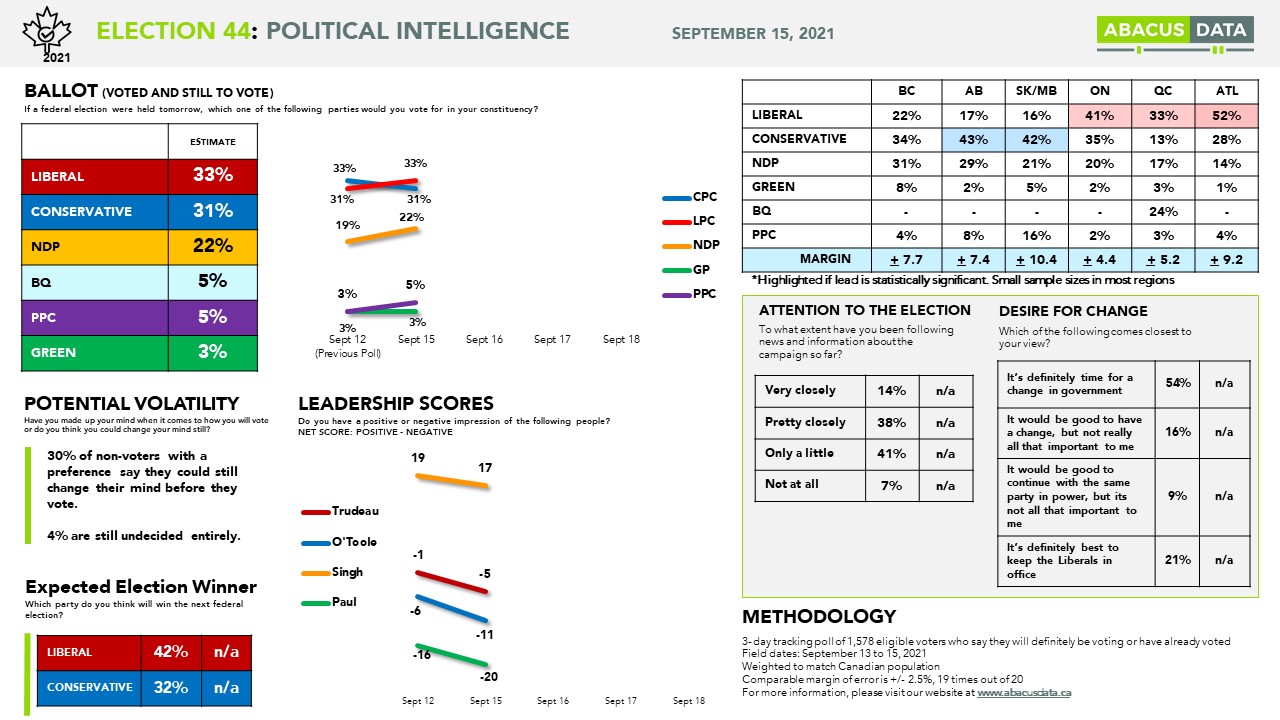
The Liberals and Conservatives remain in a statistical tie nationally. The Conservatives have clear leads in the Prairies whereas the Liberals have leads in Ontario, Quebec, and Atlantic Canada. BC is a close race overall.
54% of those who have voted or definitely plan to vote say it’s definitely time for a change of government whereas 21% say it’s definitely best to keep the Liberals in office.
NDP leader Jagmeet Singh has the most favourable image (+17), while Mr. Trudeau, Mr. O’Toole, and Ms. Paul all have net negatives. All have seen their images become more negative since the weekend.
30% of those who haven’t voted but have a first preference say they could still change their mind before they vote. 4% of non-voters are entirely undecided.
With five days to go, this election is still close but at this point, the Liberals have a clear advantage thanks to their leads in the country’s two largest provinces.
METHODOLOGY
The survey was conducted online with 1,578 Canadian adults eligible to vote who say they will definitely vote or have already voted from September 13 to 15, 2021. Each day a random sample of about 500 panelists were invited to complete the survey from a set of partner panels based on the Lucid exchange platform. These partners are typically double opt-in survey panels, blended to manage out potential skews in the data from a single source.
The margin of error for a comparable probability-based random sample of the same size is +/- 2.9%, 19 times out of 20.
The data were weighted according to census data to ensure that the sample matched Canada’s population according to age, gender, educational attainment, and region. Totals may not add up to 100 due to rounding.
We are the only research and strategy firm that helps organizations respond to the disruptive risks and opportunities in a world where demographics and technology are changing more quickly than ever.
We are an innovative, fast-growing public opinion and marketing research consultancy. We use the latest technology, sound science, and deep experience to generate top-flight research-based advice to our clients. We offer global research capacity with a strong focus on customer service, attention to detail and exceptional value.
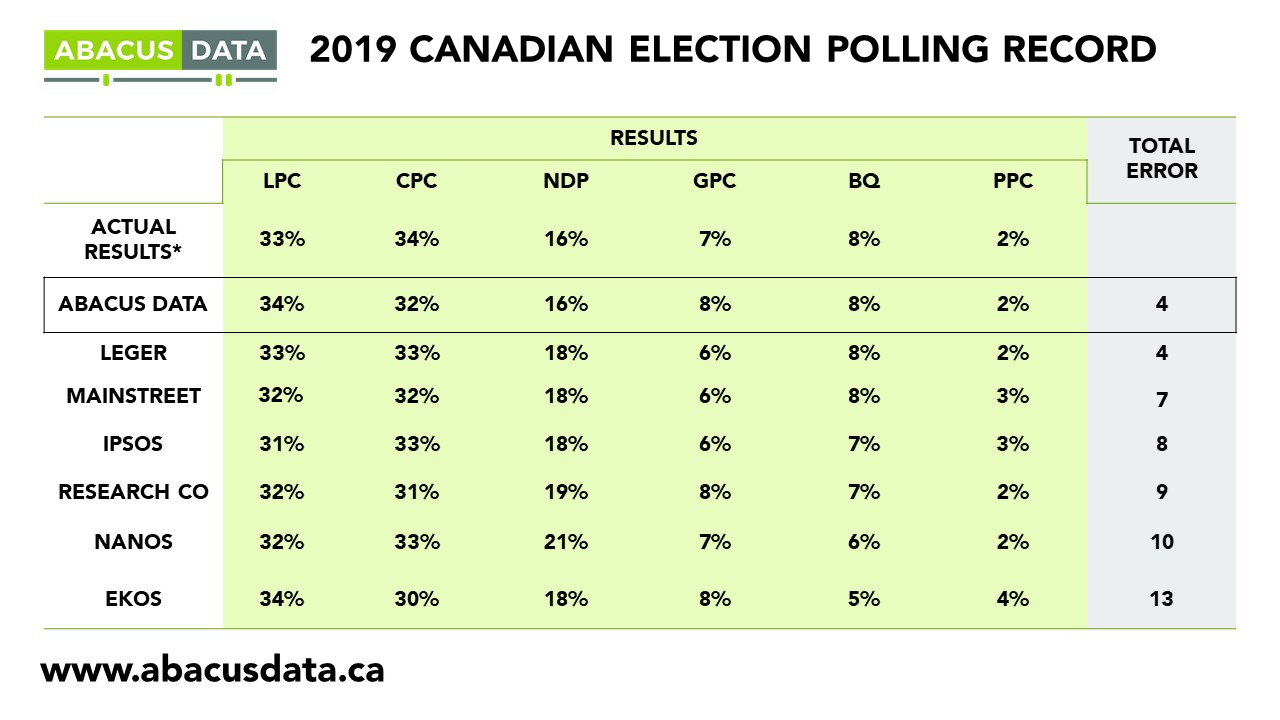
We were one of the most accurate pollsters conducting research during the 2019 Canadian Election.
Each day during the 2021 Federal Election campaign, researchers at Abacus Data will share insights and analysis from our polling in concise, insights-focused reports. To never miss our polls and analysis, subscribe to our newsletter.
Over the last four weeks we’ve been tracking a lot of data points about the federal election. Everything from where the parties, stand, to how we are getting our content about the election. As we go into the final week of this election I wanted to review some of the biggest jumps we’ve seen in the numbers, and what they might as we head into this final week.
The following are some of the biggest changes I’ve noted since the start of the election period, and are presented in no particular order.
#4: Have you made up your mind about who you are voting for?
One number that we saw climb at the start of the election is the percentage of eligible voters who’ve made up their mind.
However, this number may be more of an honourable mention, if you just consider the last couple weeks.
After about week three, the number of decided Canadians sat at two thirds and has been fairly stable since, with the debates doing little to sway the number. With one week to go, a third of the electorate still has yet to decide. Still, the jump in decided voters in late August was a big one, and lines up with what we are seeing in the other data as well (larger swings early on in the campaign with a stabilization heading into the final week).
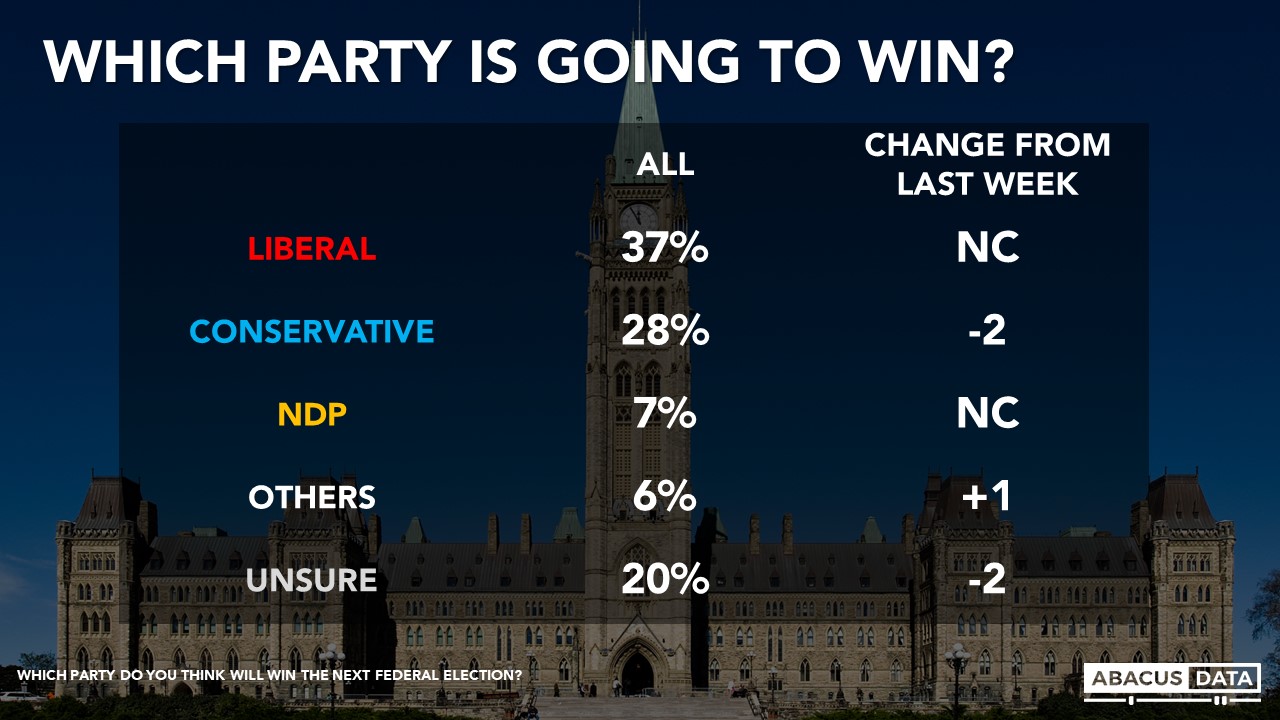
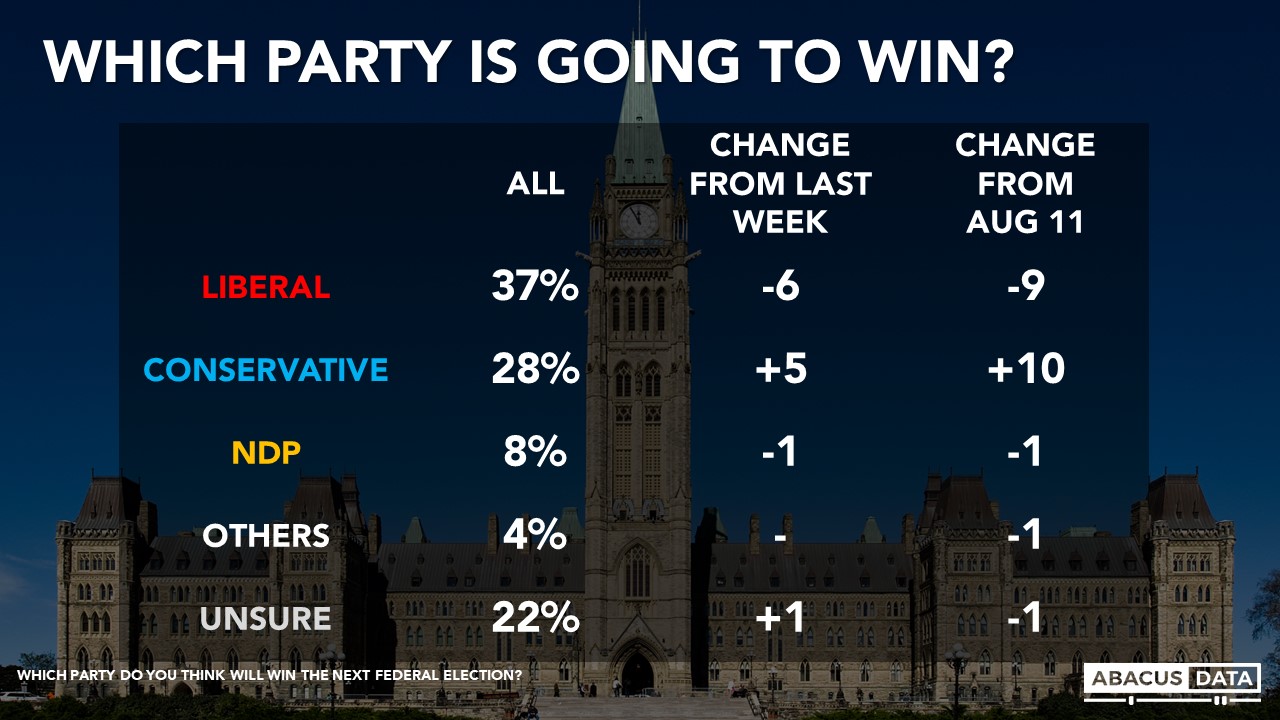
#3: Which party is going to win?
Up next is the question of who voters think will win the next election. TLDR: most think the Liberals, but the margins have tightened significantly.
At the beginning of the election, one in two voters felt the Liberals would take the win, but this steadily declined over the next two weeks. Like the previous, these numbers seem to have stabilized as well, and a majority of voters still think the Liberals will win, but since we started tracking the Liberals have seen a 10-pt decrease while the Conservatives have seen an almost equal increase.
There may be many reasons for this stabilization but one possible gain from the Liberals may be them pulling the electorate back towards them on cost of living issues. Early on, we saw a near tie between the Conservatives and Liberals when we asked which party was best positioned to address this issue. The gap widened slightly, as Erin O’Toole took a 3-4 pt lead. But our latest poll shows this is back to a tie.
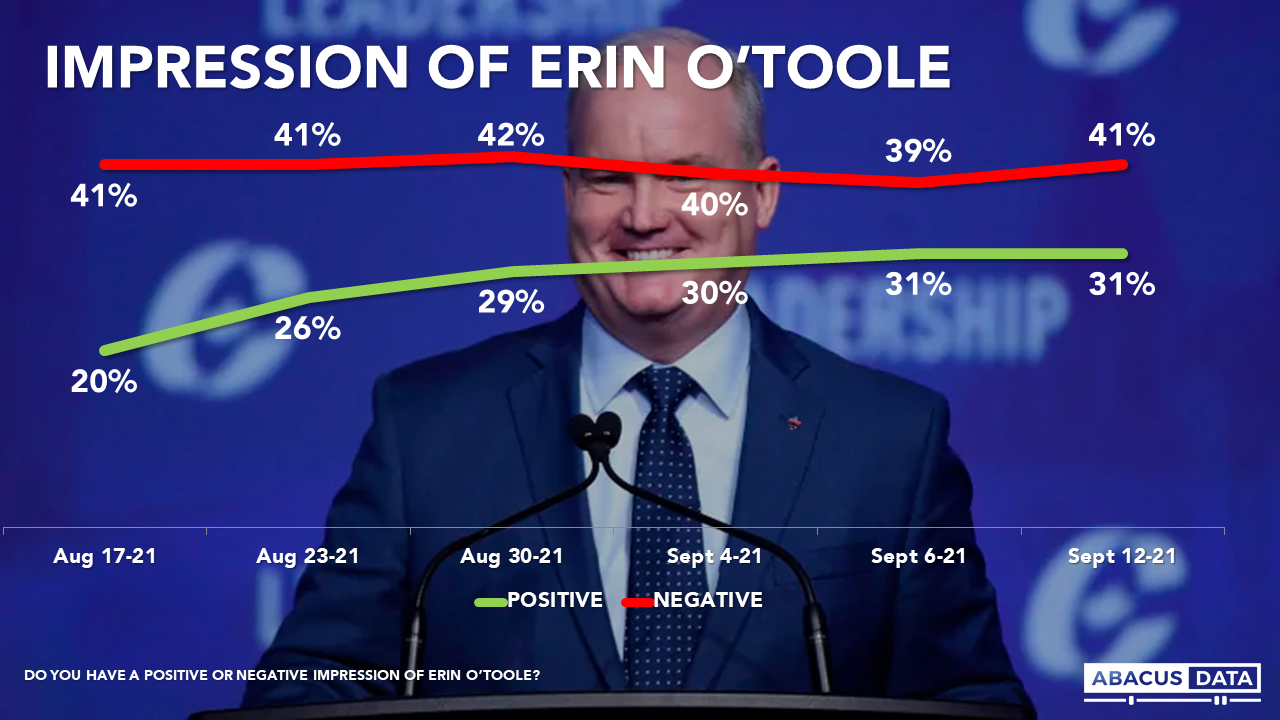
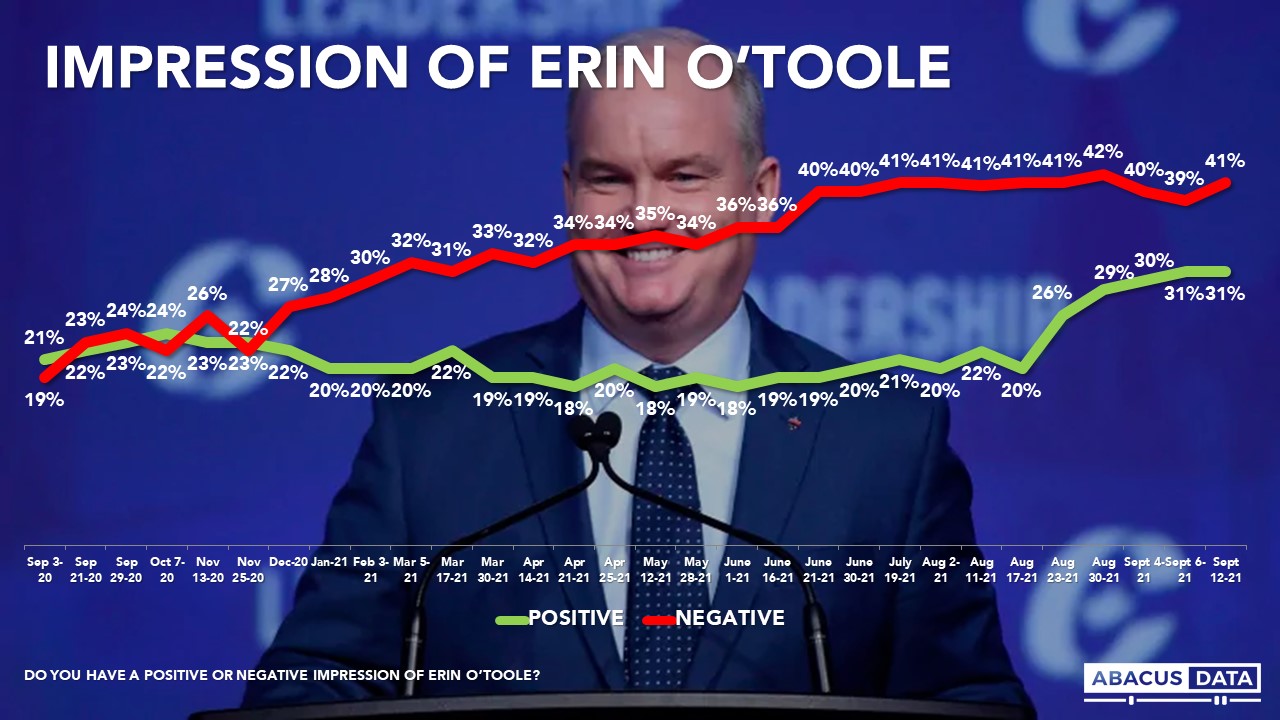
#2: Impressions of Erin O’Toole
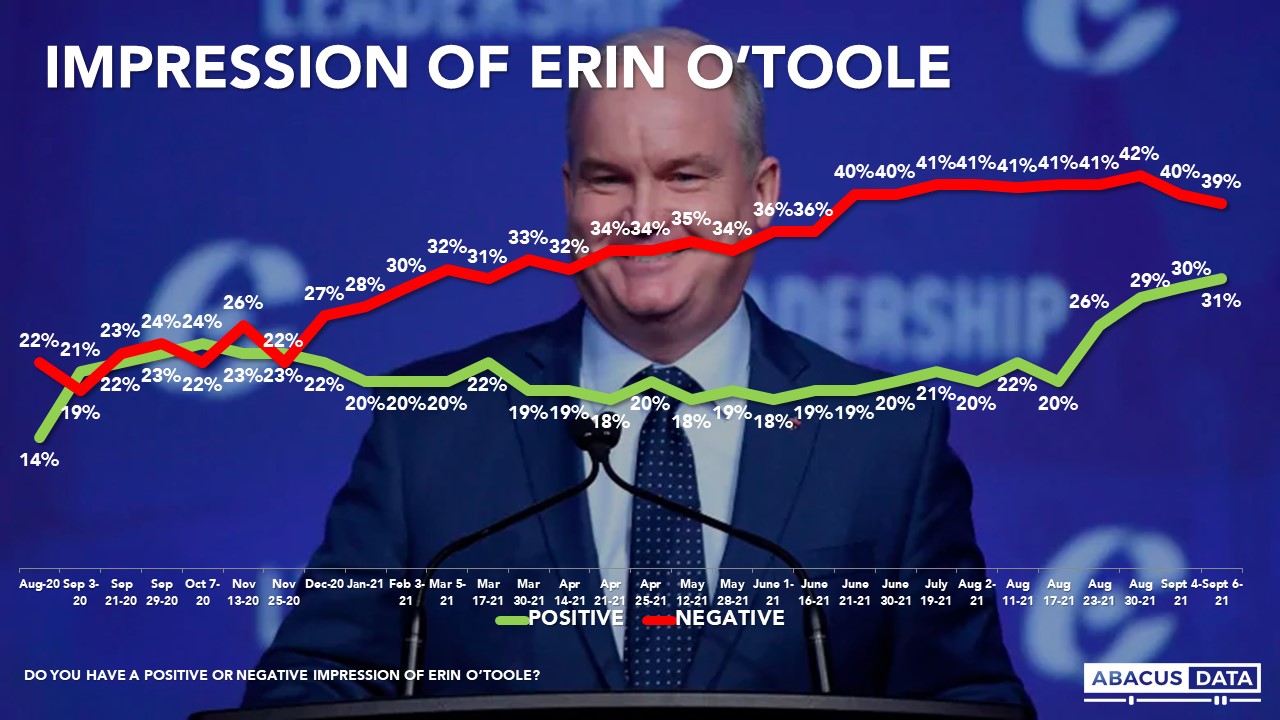
Next up are impressions of Conservative leader Erin O’Toole. As we started the election, 40% of voters didn’t know enough about the Conservative leader to form impressions. But once the campaign kicked off, Canadians became more familiar and that increased awareness seems to have translated directly to the positives. Positive impressions have risen 11-pts, a significant climb, negatives have stayed consistent.
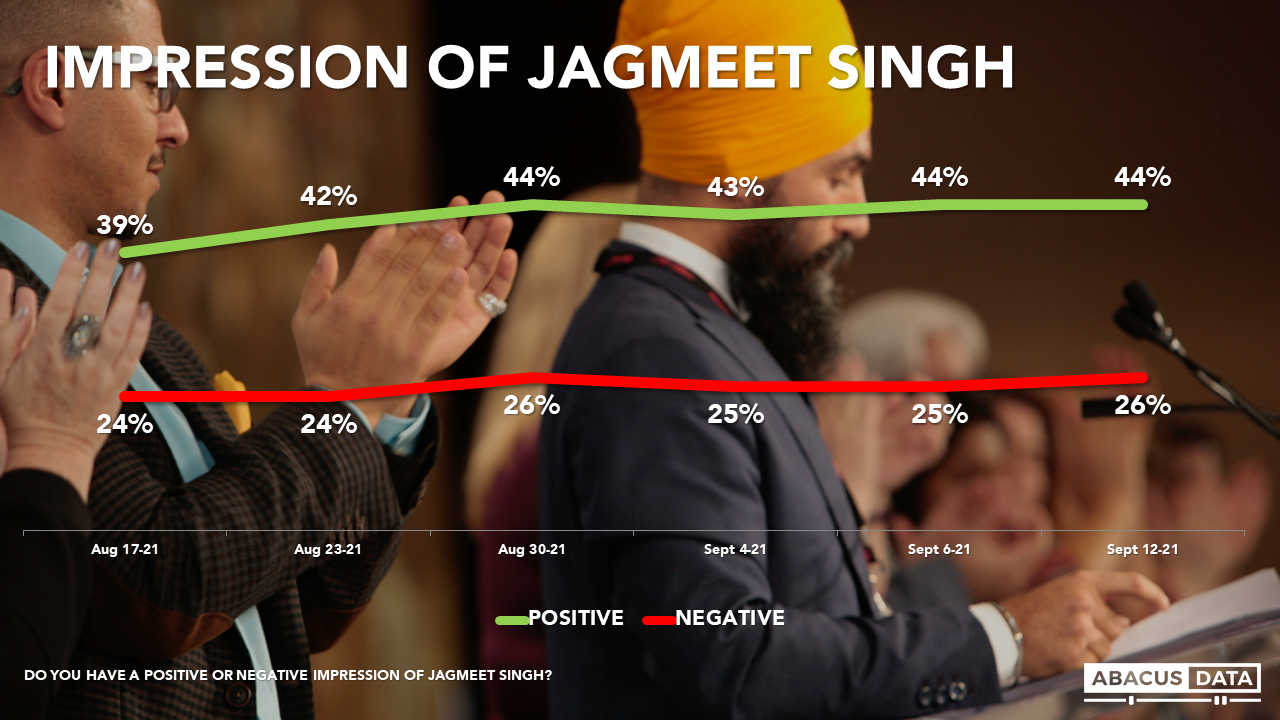
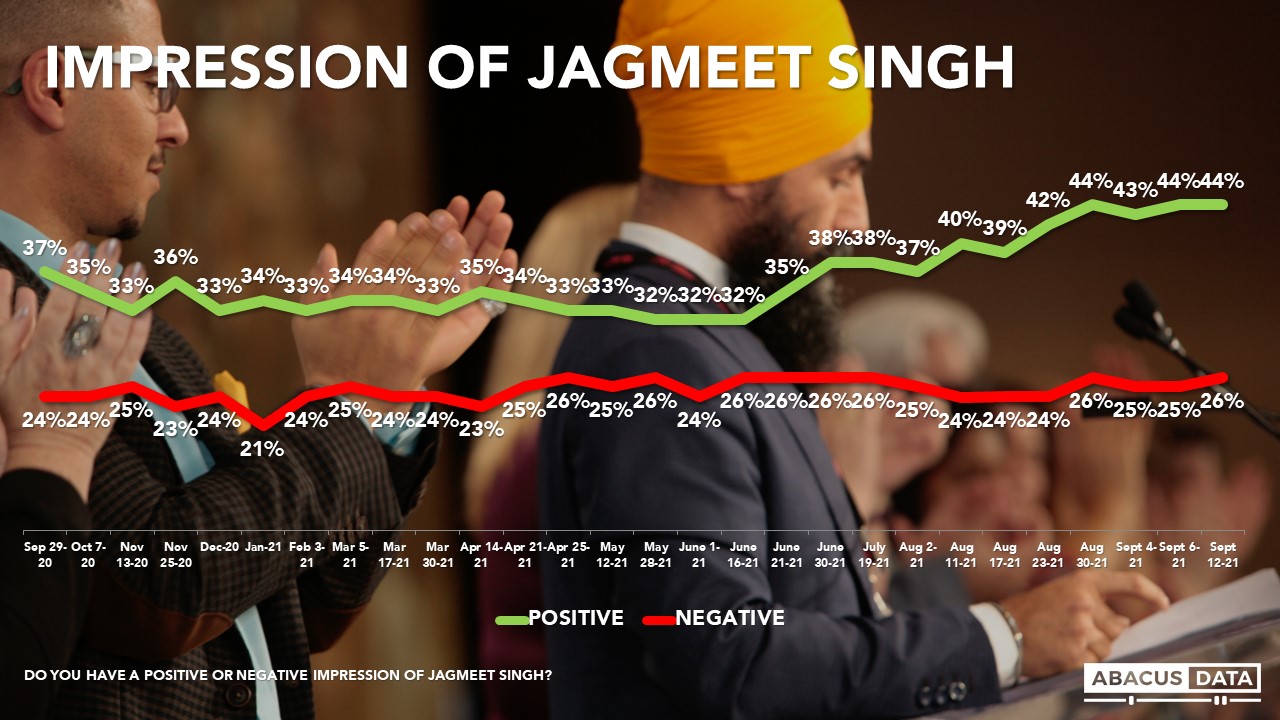
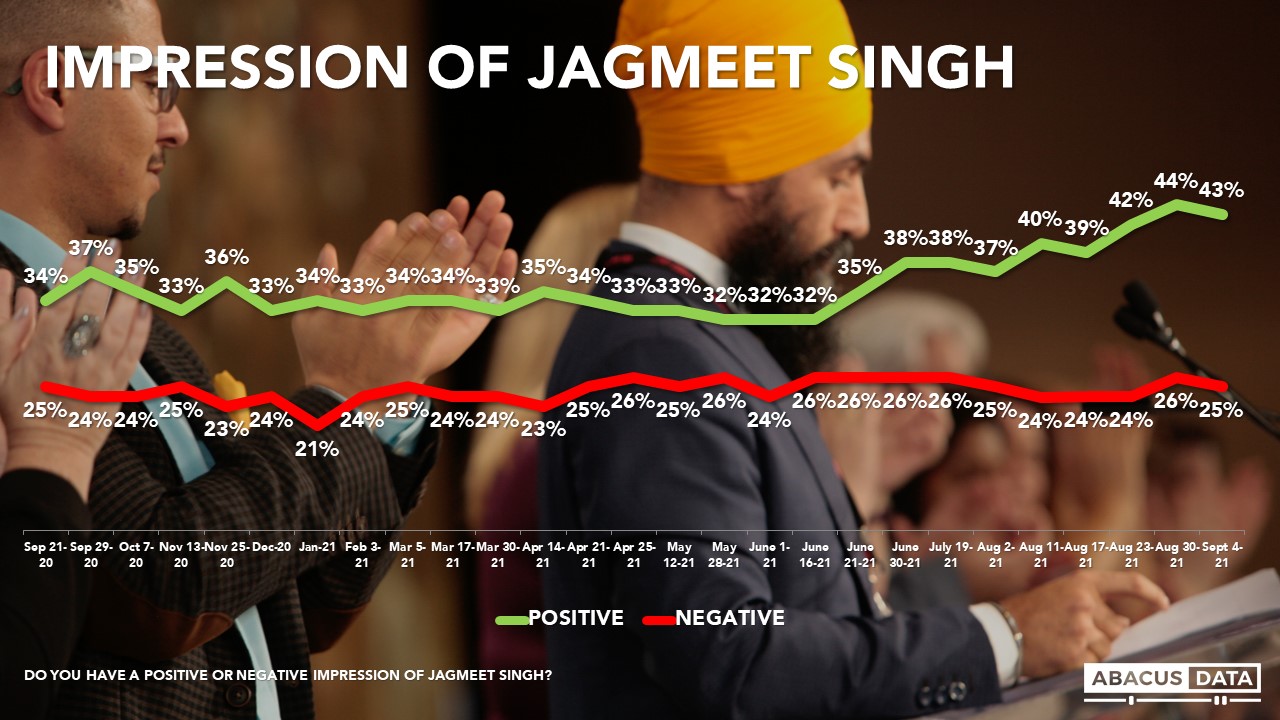
#1: Impressions of Jagmeet Singh
And finally, finishing off some of the biggest changes we’ve seen so far are impressions of Jagmeet Singh. Awareness of Singh at the start of the campaign was about in line with awareness of O’Toole. And also like O’Toole, Singh experienced a significant shift in awareness, that trended almost entirely positive. Since the start of the election Singh has seen an increase in positive impressions, 5 pts in a month.
During this election we saw some big shifts at the start, but heading into the final week numbers have leveled off, making this a tight race. With a third of eligible voters undecided, there is still room for the increased positive impressions of O’Toole and Singh to have an impact. The same can be said for the narrowing race of which party voters think will win the election- the majority still think the Liberals will win but the Conservative momentum seen early on could impact vote decisions in the end.
We will continue tracking these insights and more, daily, during the final week of the 2021 federal election.
METHODOLOGY
Our survey were conducted over 5 waves:
August 12-16th: 1,500 Canadian adults from August 12 to 16, 2021. The margin of error for a comparable probability-based random sample of the same size is +/- 2.6%, 19 times out of 20.
August 17 to 22nd: 2,000 Canadian adults from August 17 to 22, 2021. The margin of error for a comparable probability-based random sample of the same size is +/- 2.2%, 19 times out of 20.
August 24 to 29th: 2,000 Canadian adults eligible to vote from August 24 to 29, 2021.The margin of error for a comparable probability-based random sample of the same size is +/- 2.2%, 19 times out of 20.
September 1 to 4th: 2,692 Canadian adults eligible to vote from September 1 to 4, 2021.The margin of error for a comparable probability-based random sample of the same size is +/-1.9%, 19 times out of 20.
September 3 to 6th: 2,875 Canadian adults eligible to vote from September 3 to 6, 2021. The margin of error for a comparable probability-based random sample of the same size is +/-1.9%, 19 times out of 20.
September 10 to 12th: 2,000 Canadian adults eligible to vote from September 10 to 12, 2021. The margin of error for a comparable probability-based random sample of the same size is +/-2.1%, 19 times out of 20.
All surveys were conducted using a random sample of panellists was invited to complete the survey from a set of partner panels based on the Lucid exchange platform. These partners are double opt-in survey panels, blended to manage out potential skews in the data from a single source.
In Canada the data were weighted according to census data to ensure that the sample matched Canada’s population according to age, gender, educational attainment, and region.
We are the only research and strategy firm that helps organizations respond to the disruptive risks and opportunities in a world where demographics and technology are changing more quickly than ever.
We are an innovative, fast-growing public opinion and marketing research consultancy. We use the latest technology, sound science, and deep experience to generate top-flight research-based advice to our clients. We offer global research capacity with a strong focus on customer service, attention to detail and exceptional value.
We were one of the most accurate pollsters conducting research during the 2019 Canadian Election.
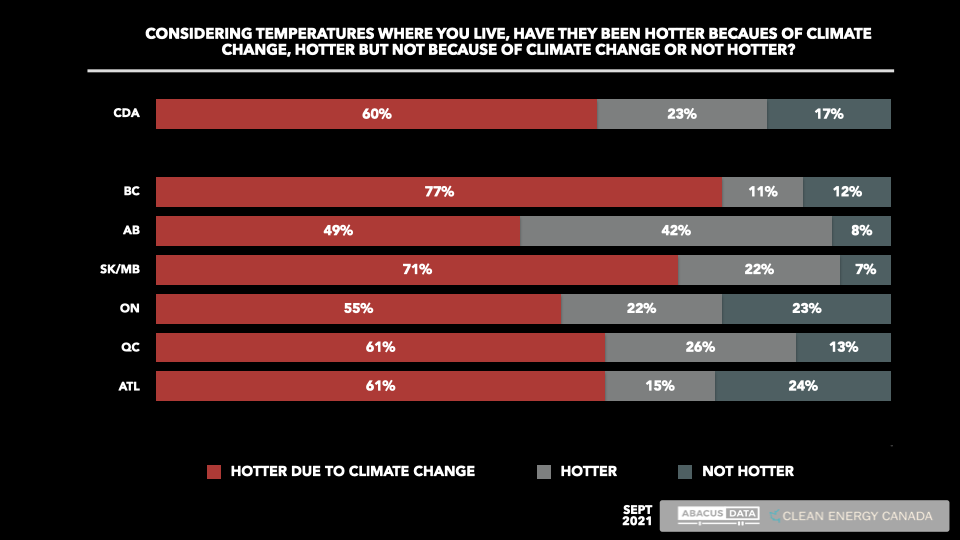
In the latest round of survey work by Clean Energy Canada and Abacus Data, we found that a majority of Canadians saw this summer’s forest fires and temperature records as evidence that climate change is happening and action is more urgent.
Across the country, 60% say that temperatures, where they live, have been hotter than usual due to climate change. Another quarter says temperatures have been hotter but do not ascribe that to climate change. And 17% say the temperatures have not been hotter in their part of the country.
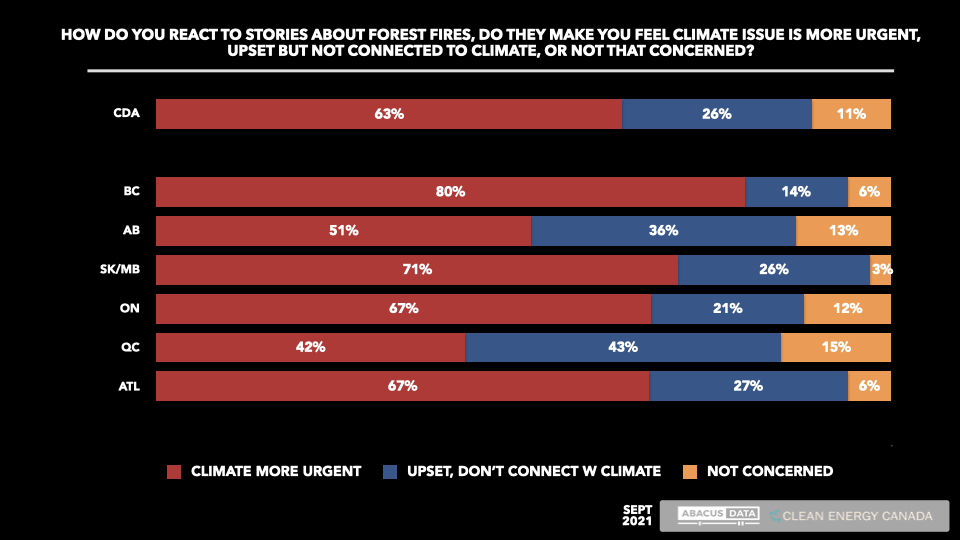
This summer has also seen significant numbers of forest fires. A majority of Canadians (63%) say that these fires have been making them feel that climate change is a more urgent issue to deal with. A quarter (26%) say the fireset is upsetting but they do not connect them to climate change and 11% are not concerned about the fires.
UPSHOT
According to Bruce Anderson: “Climate change is one of the most prominent issues in this election campaign and the issue for many people is no longer about long term changes happening in distant parts of the world – but real-life situations where Canadians live. The pressure to act more aggressively is growing and heatwaves and fires, along with floods and storms are a big part of why.”
According to Trevor Melanson, Clean Energy Canada’s communications director: “For Canadians, climate change is no longer simply an abstract idea. We’ve now entered the era of truly feeling its impacts, and public opinion reflects that. The tone has shifted, and politicians need to read the room. Climate action isn’t only about doing the right thing for the world—it’s also about protecting Canadians and safeguarding their future.”
ABOUT ABACUS DATA
We are the only research and strategy firm that helps organizations respond to the disruptive risks and opportunities in a world where demographics and technology are changing more quickly than ever.
We are an innovative, fast-growing public opinion and marketing research consultancy. We use the latest technology, sound science, and deep experience to generate top-flight research-based advice to our clients. We offer global research capacity with a strong focus on customer service, attention to detail and exceptional value.
We were one of the most accurate pollsters conducting research during the 2019 Canadian Election.
Find out more about how we can help your organization by downloading our corporate profile and service offering.
METHODOLOGY
The survey was conducted with 2,000 Canadian adults eligible to vote from September 3 to 6, 2021. A random sample of panellists was invited to complete the survey from a set of partner panels based on the Lucid exchange platform. These partners are typically double opt-in survey panels, blended to manage out potential skews in the data from a single source.
The margin of error for a comparable probability-based random sample of the same size is +/- 2.1%, 19 times out of 20.
The data were weighted according to census data to ensure that the sample matched Canada’s population according to age, gender, educational attainment, and region. Totals may not add up to 100 due to rounding.
We just completed a national survey of 2,000 Canadians eligible to vote in the current federal election completed entirely after the French and English leaders’ debates last week.
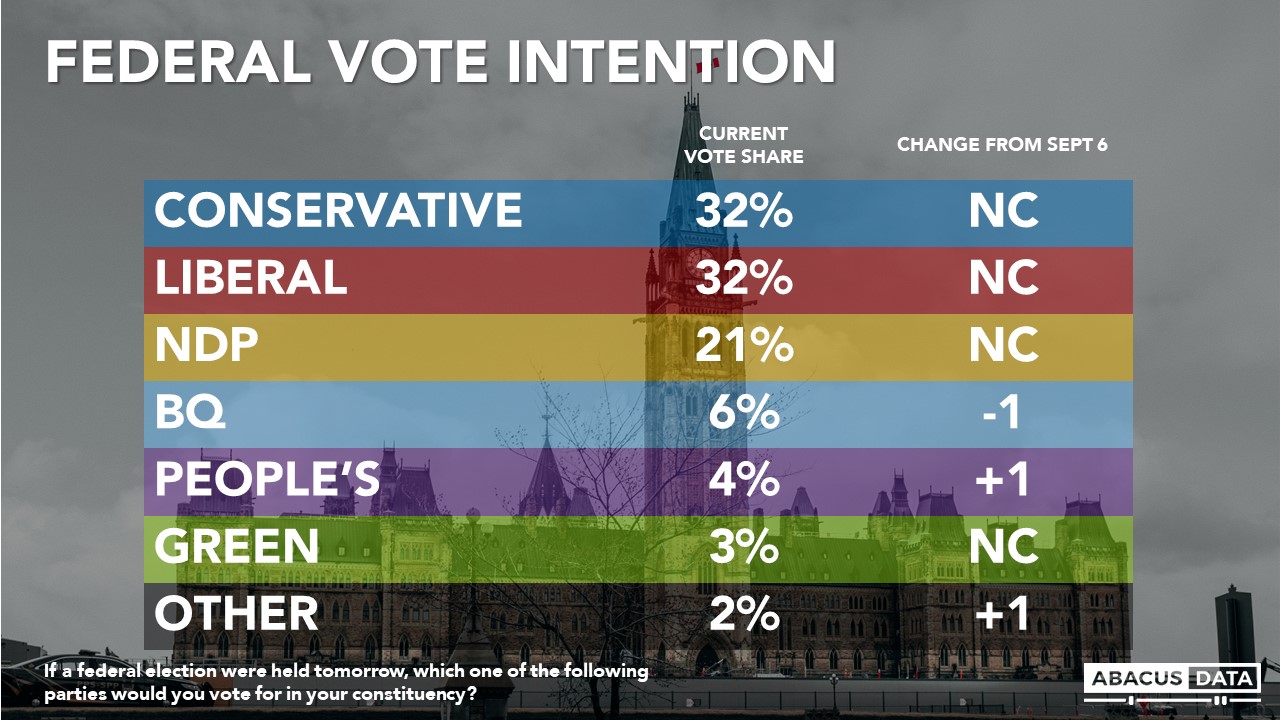
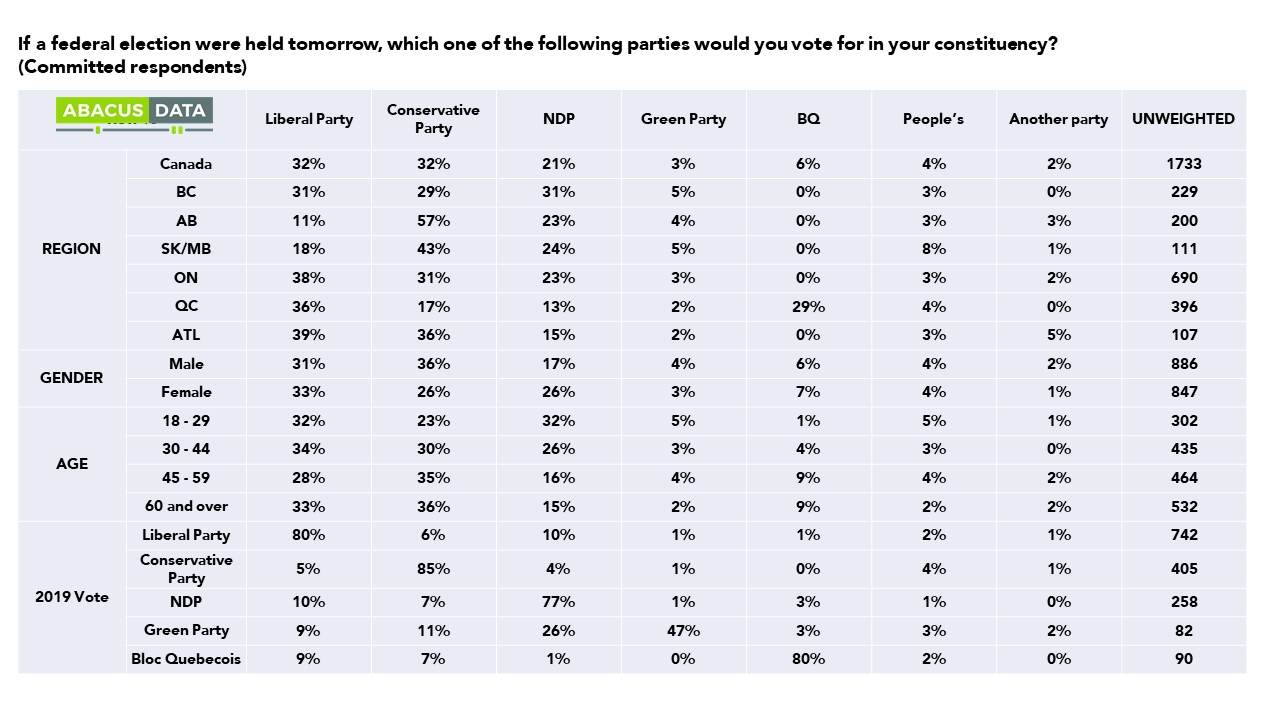
If an election were held now, the Conservatives would win 32% of the vote (unchanged), the Liberals 32% (unchanged), the NDP 21% (unchanged), the Green Party 3% (unchanged) and the BQ at 29% in Quebec (down 2). The People’s Party is at 4% nationally.
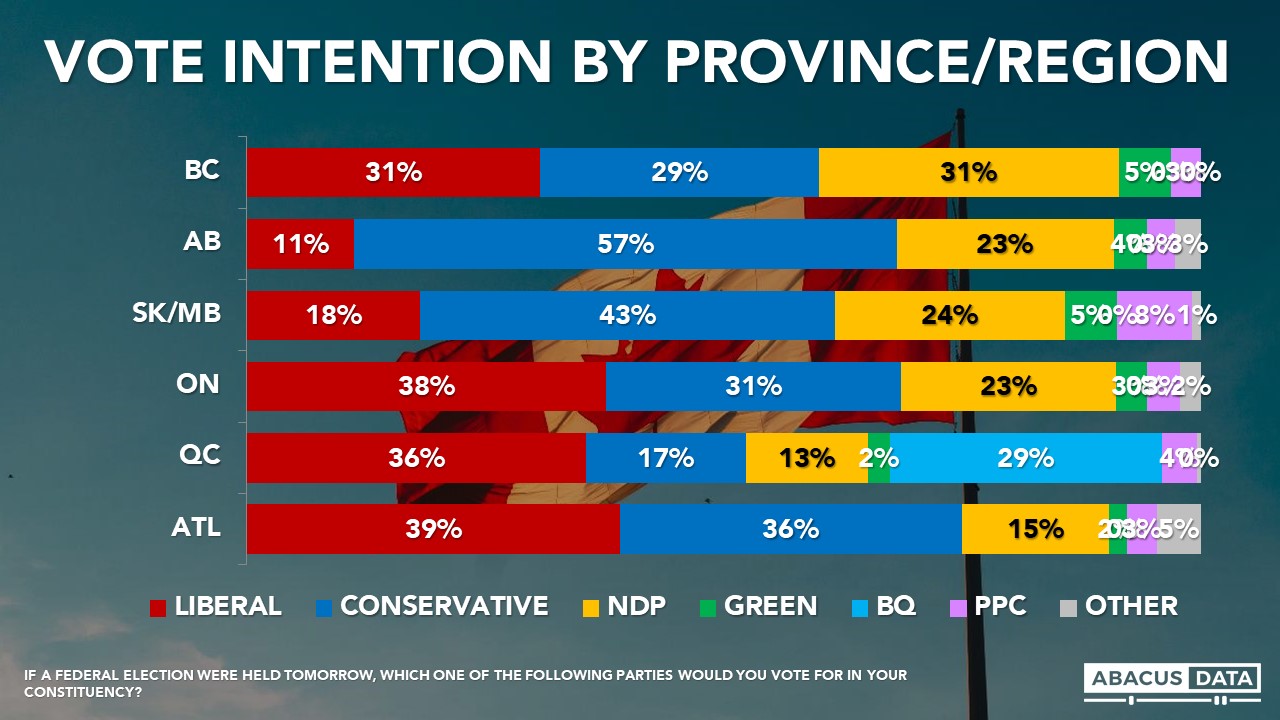
• In BC, we see a very tight three-way race with the NDP at 31%, the Liberals at 31%, and the Conservatives at 29%.
• In Alberta, 57% would vote Conservative compared with 23% for the NDP, 11% for the Liberals, 3% for the People’s Party and 1% for the Maverick Party.
• In Manitoba and Saskatchewan, the Conservatives lead with 43% followed by the NDP at 24% and the Liberals at 18%.
• In Ontario, the Liberals have opened up a 7-point lead over the Conservatives (38% to 31%) with the NDP at 23%.
• Within Ontario, the Liberals have a 21-point lead over the Conservatives in Toronto and a 14-point lead in the surrounding region. The Liberals and Conservatives are tied in eastern Ontario while the Conservatives lead by 12 in the southwest.
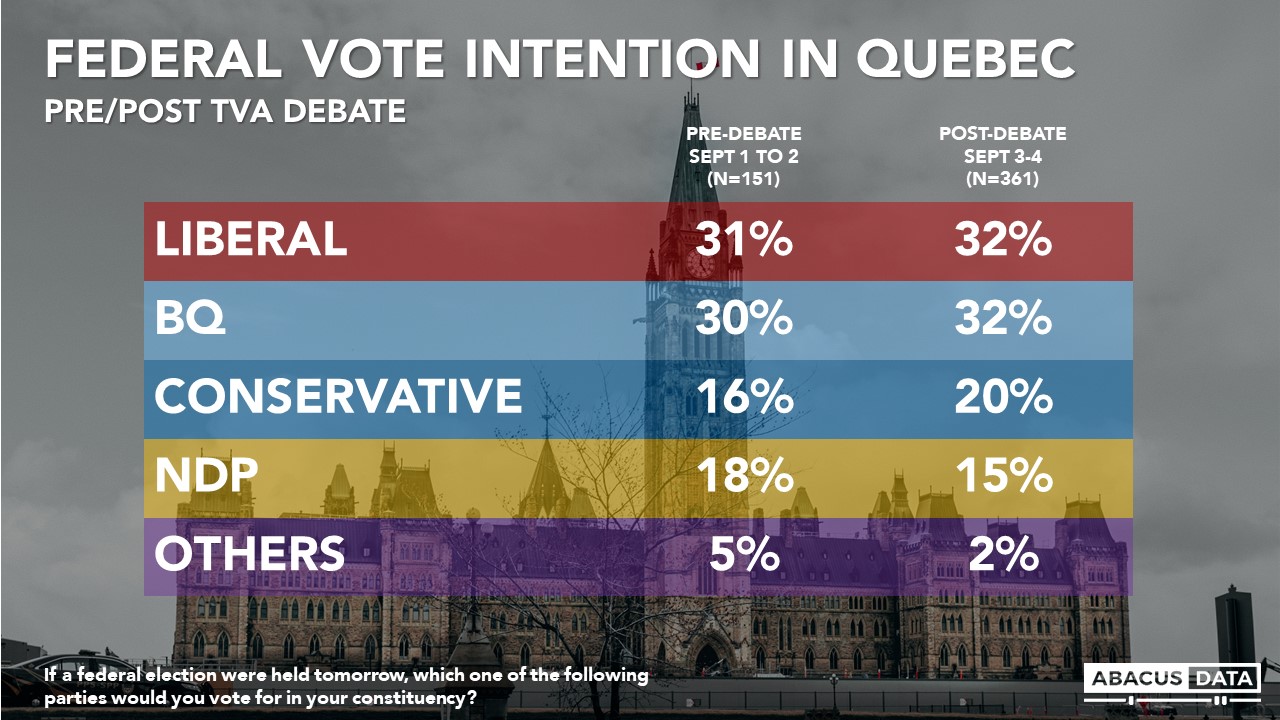
• In Quebec, we see the Liberals ahead of the BQ by 7-points with the Conservatives at 17% and the NDP at 13%. This is a rise for the Liberals of 4-points and a drop for the BQ of 2-points.
• In the Atlantic provinces, the liberals are ahead by 3 over the Conservatives (39% to 36%) with the NDP at 15%.
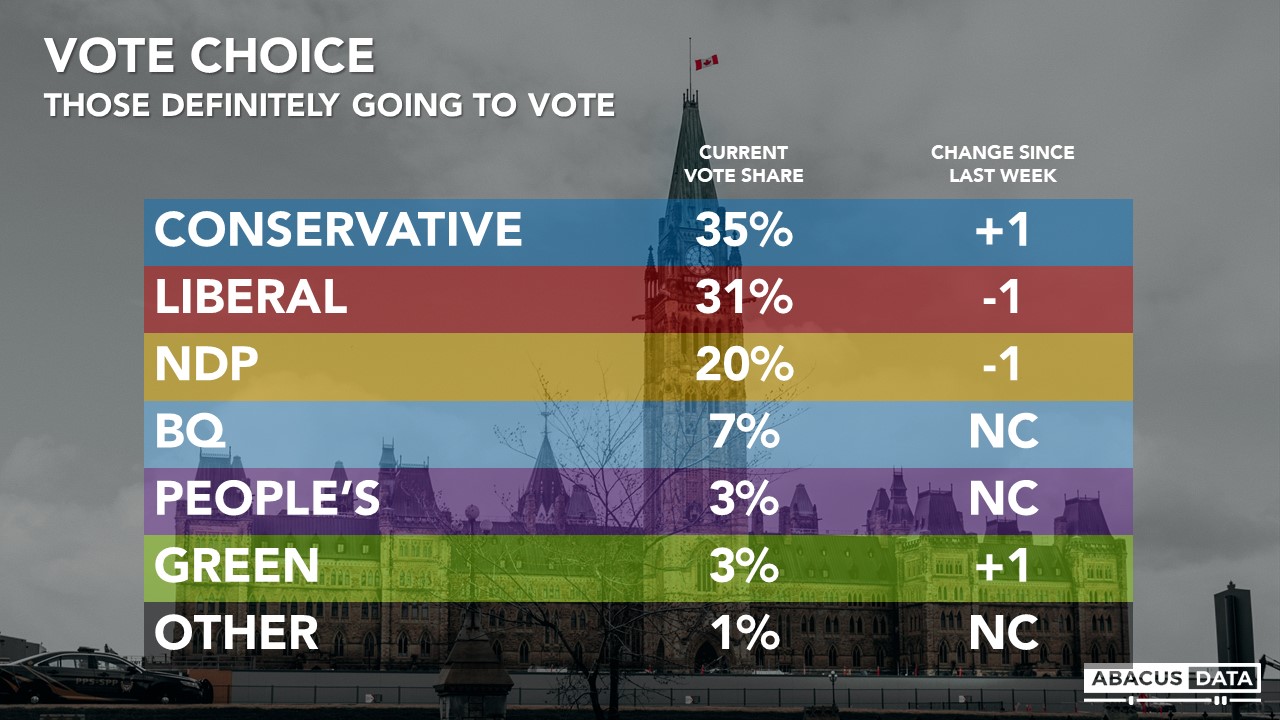
The Conservatives lead among those who say they will definitely vote by 4-points (35% to 31%) This is largely unchanged from our last poll.
LEADERS’ DEBATES
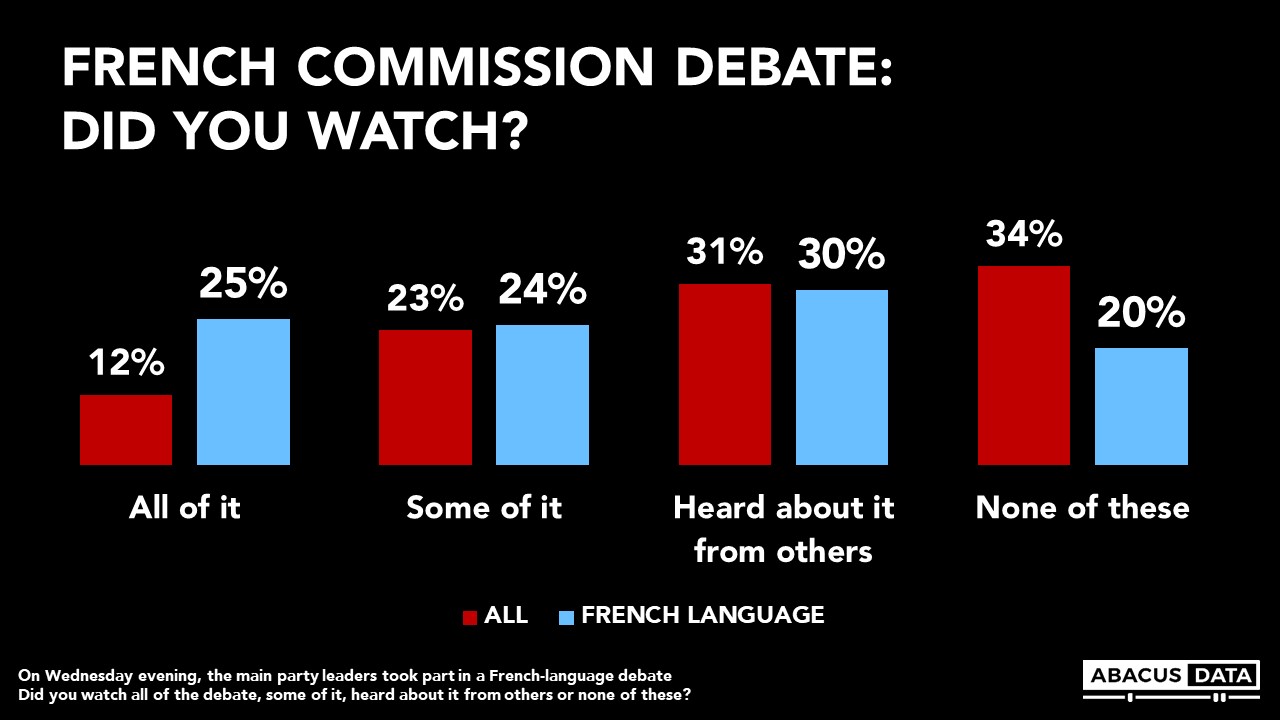
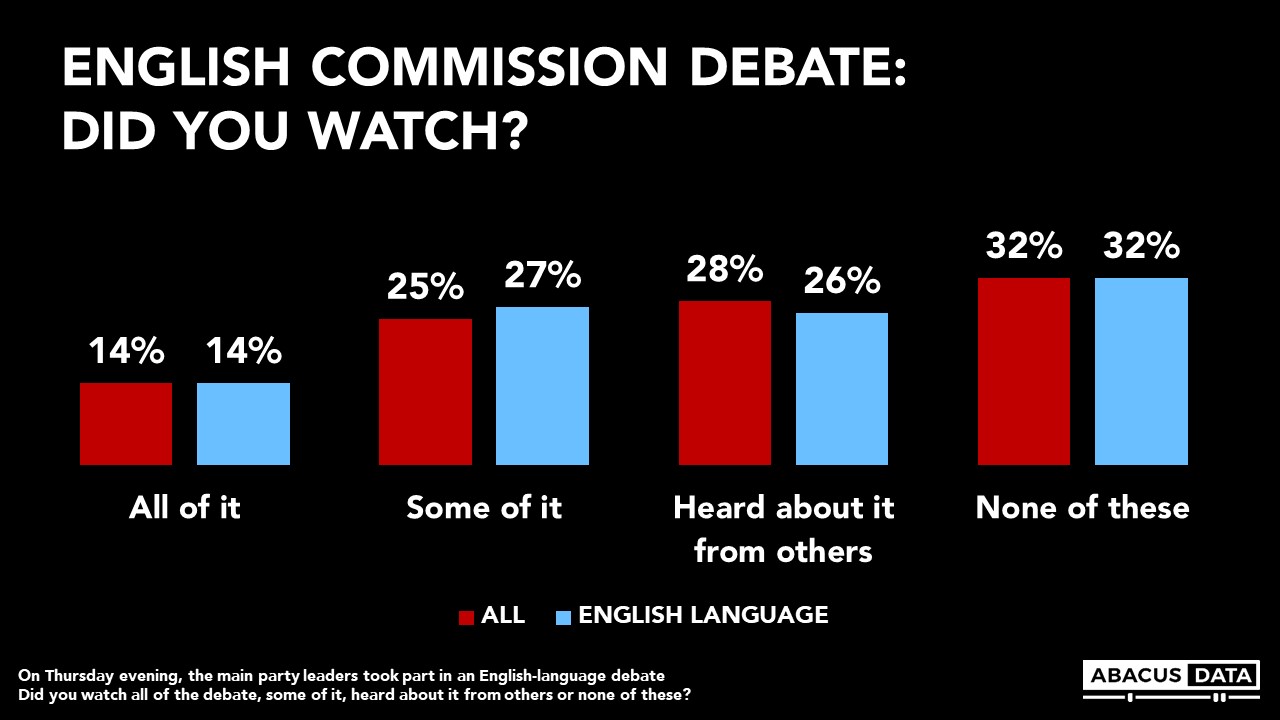
About half of francophones (49%) said they watched all of some of the French language Commission debate. The audience among anglophones for the English language debate was smaller, with only 41% indicating they had watched some or all of it.
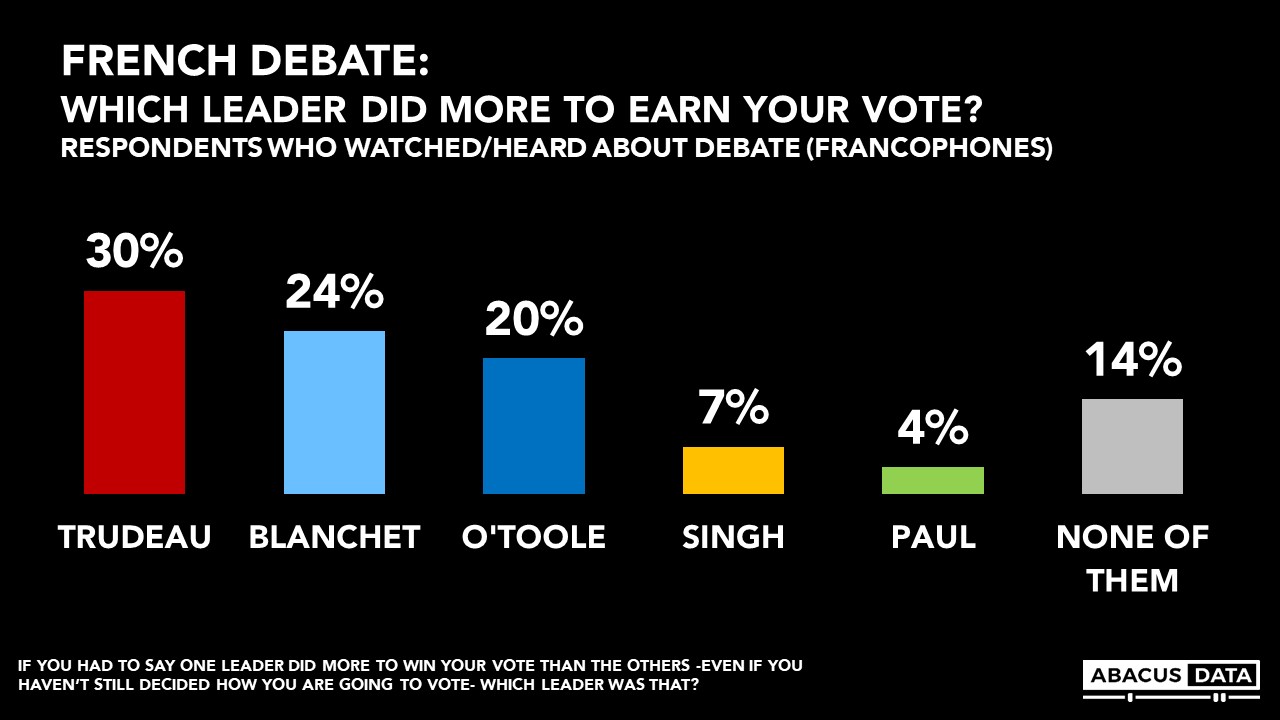
For the French debate, four of the five leaders left more positive than negative impressions, with Mr. Blanchet (+25), Mr. Trudeau (+14), Mr. Singh (+8), and Mr. O’Toole (+7). More said Ms. Paul’s performance left a negative view than a positive one (-13).
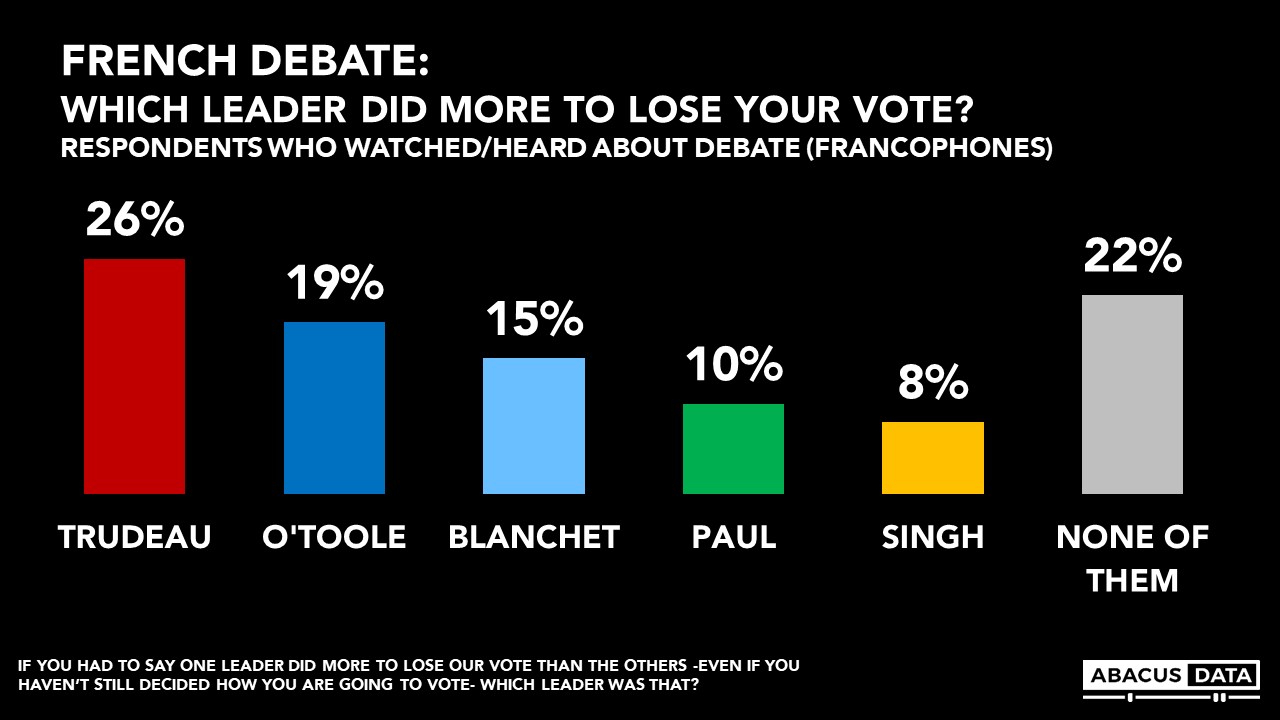
When asked which leader did the most to earn their vote, Justin Trudeau was the choice of 30% ahead of Mr. Blanchet 24% and Mr. O’Toole at 20%. When asked which leader did the more to lose their vote, Mr. Trudeau also came out on top with 26% selecting the Liberal leader followed by Mr. O’Toole at 19%, and Mr. Blanchet at 15%.
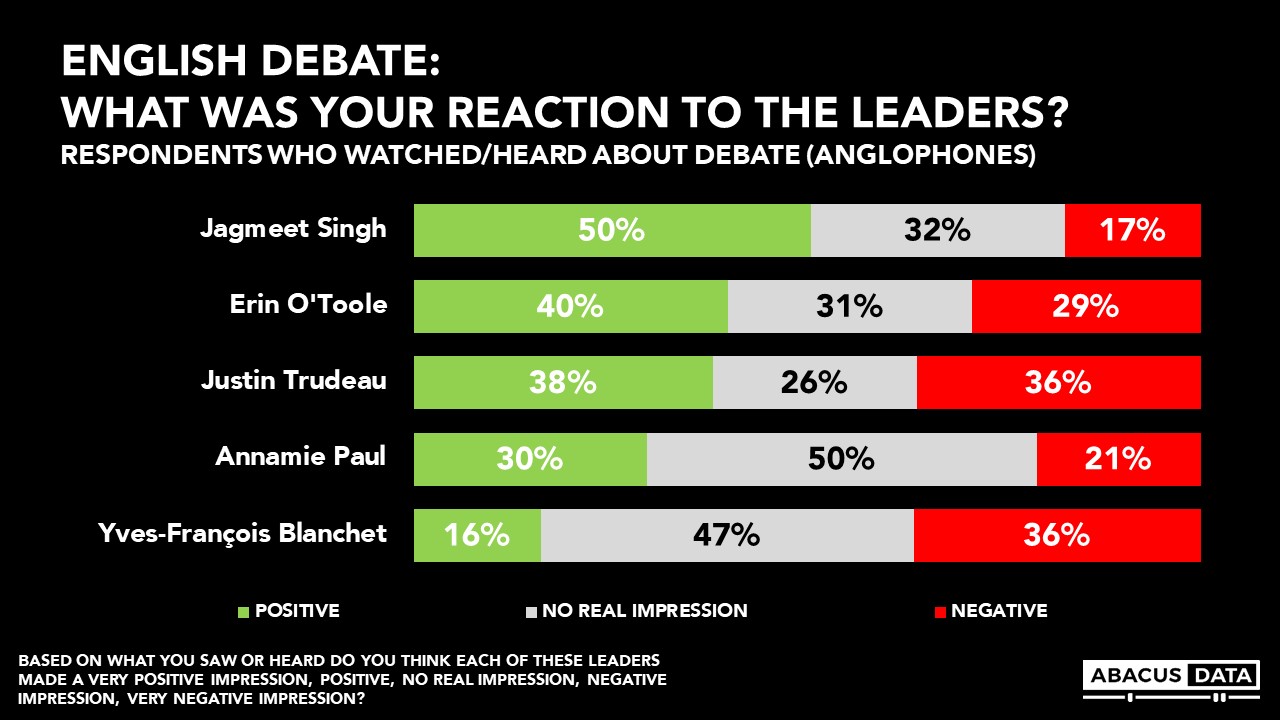
For the English debate, four of the five leaders left more positive than negative impressions, led by Mr. Singh (33), Mr. O’Toole ( +11), Mr. Trudeau (+2), Ms Paul (+9). Mr. Blanchet was the only leader who had a net negative reaction (-20).
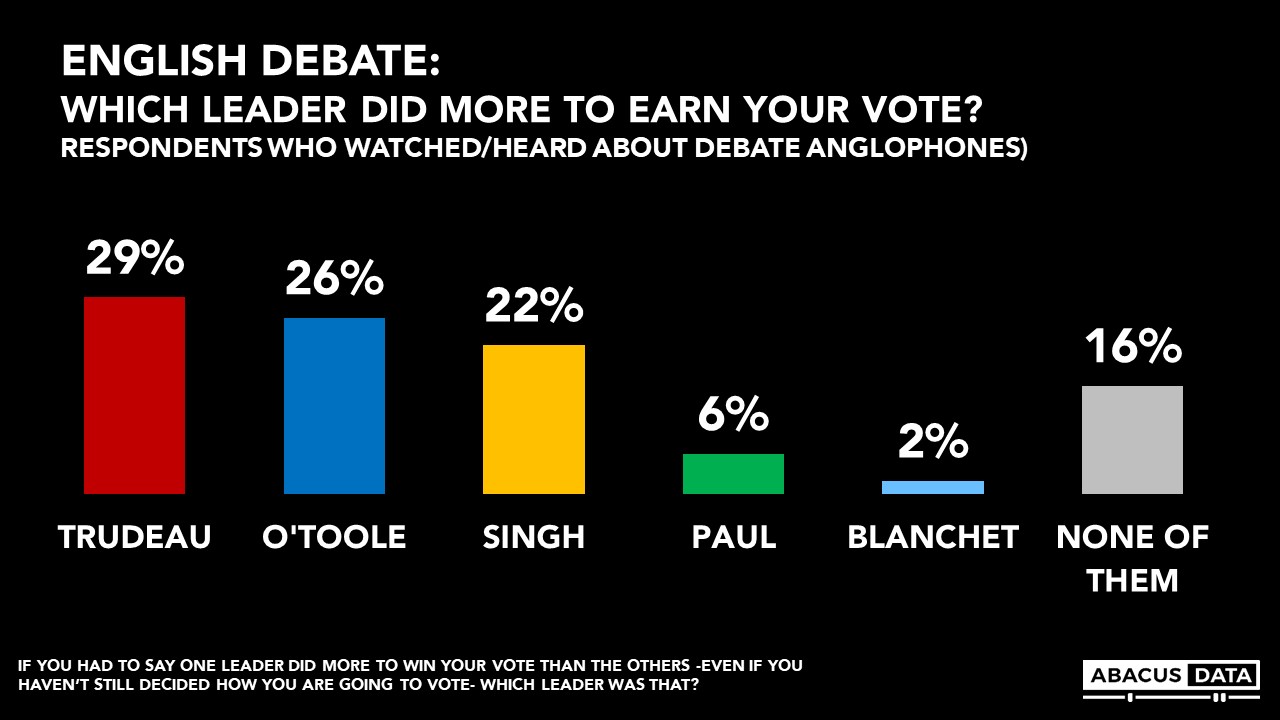
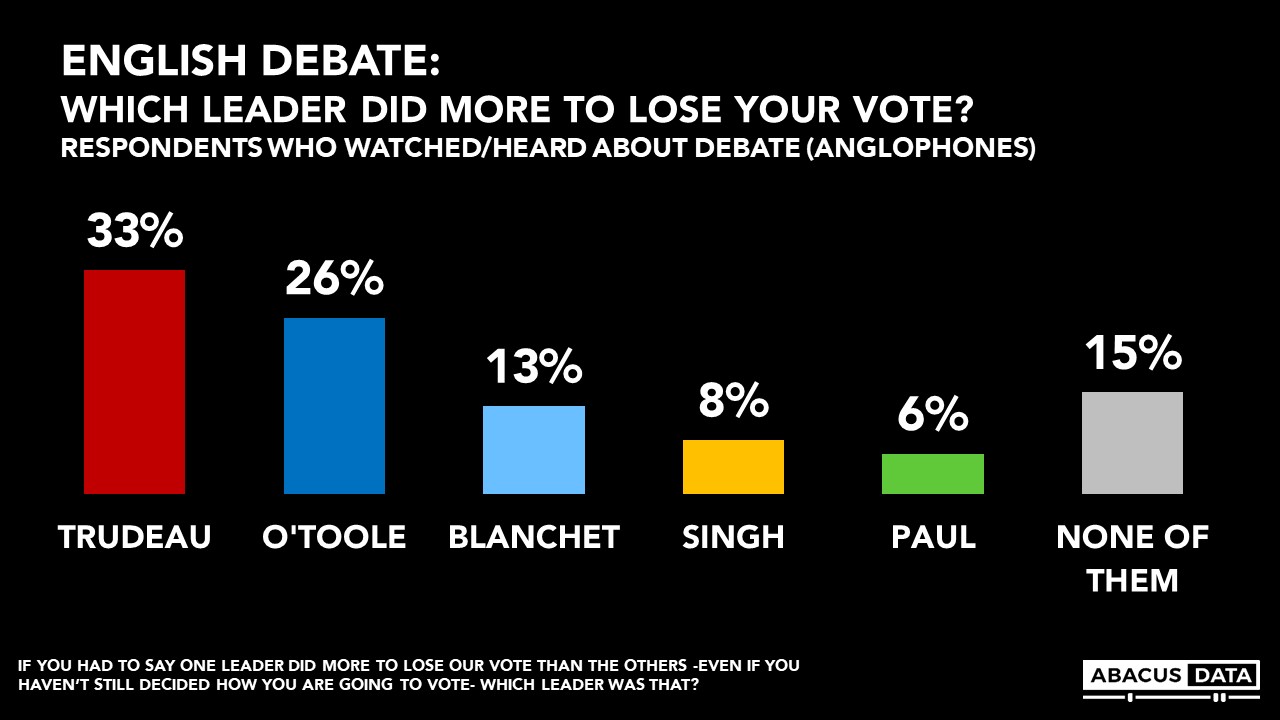
When asked which leader did the most to earn their vote, Justin Trudeau was the choice of 29% slightly ahead of Mr. O’Toole at 26% and Mr. Singh at 22%. When asked which leader did the more to lose their vote, Mr. Trudeau also came out on top with 33% selecting the Liberal leader followed by Mr. O’Toole at 26%, and Mr. Singh at 8%.
Overall, reaction to the debate was largely aligned with one’s vote inclination.
• 69% of LPC supporters felt Mr. Trudeau did the most to earn their vote. • 76% of CPC supporters felt Mr. O’Toole did the most to earn their vote • 69% of NDP supporters thought Mr. Singh did the best.
Among LPC/NDP switchers, 46% thought Mr. Trudeau did the best, 34% picked Mr. Singh.
PREFERRED ELECTION OUTCOME
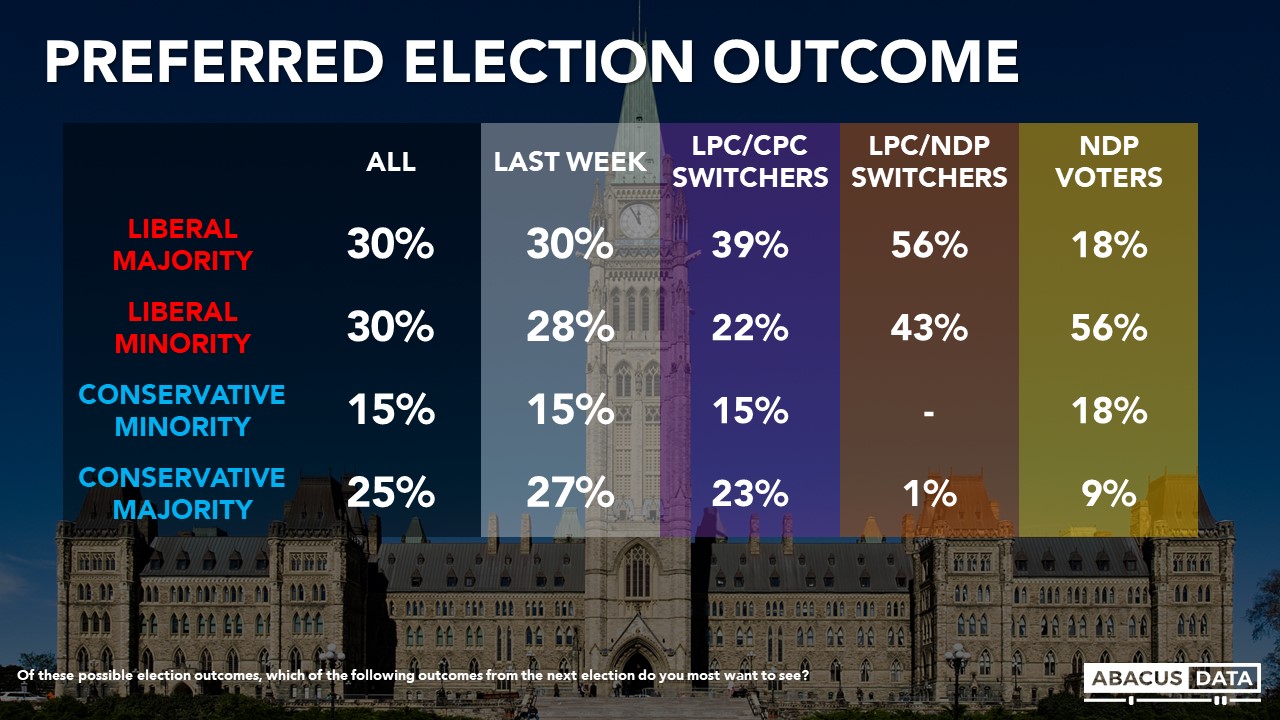
Asked which of four (most likely based on today’s numbers) outcomes they would prefer, 60% would prefer a Liberal victory (30% majority, 30% minority) while 40% would prefer a Conservative win (15% minority, 25% majority). This is mostly unchanged from our last survey.
EXPECTED ELECTION OUTCOME
As of today, 37% expect the Liberals to win (unchanged from our last poll), followed by 28% who expect the Conservatives to win (down 2 since the last wave and +10 since the start of the campaign), and 7% who expect the NDP to come out on top.
When asked whether the election will be close or will one party win by a lot, 75% think it will be close (up 4 points) while 13% think one party will win by a lot. 12% are not sure. Among LPC/NDP switchers 82% think it will be close.
Those who would prefer the LPC to win but think the Conservatives are going to win makes up 5% of the electorate – holding steady from last week.
LEADER IMPRESSIONS
Justin Trudeau enjoys a positive impression among 40% and negative impressions among 43%, for a net score of -3. This is a slight increase in positives for Mr. Trudeau. Regionally, Mr. Trudeau’s net favourables are -2 in BC, -39 in Alberta, -18 in SK/MB, +2 in Ontario, +2 in Quebec, and +30 in Atlantic Canada. Among Liberal/NDP switchers Trudeau is +65. Among Liberal/Conservative switchers he is +53.
Jagmeet Singh enjoys a positive impression among 44% and finds negative impressions among 26% for a net score of +18.
Regionally, Mr. Singh’s net favourables are +29 in BC, +15 in AB, +17 in SK/MB, +26 in Ontario, -2 in Quebec, and +28 in Atlantic Canada. Among Liberal/NDP switchers Singh is +75.
Today 31% have a positive impression of the Conservative leader Erin O’Toole unchanged) while his negatives are at 41% (+2) for a net score of -10.
Regionally, Mr. O’Toole’s net favourables are -13 in BC, +10 in AB, -5 in SK/MB, -6 in Ontario, -21 in Quebec, and -23 in Atlantic Canada. Among Liberal/Conservative switchers O’Toole is +49.
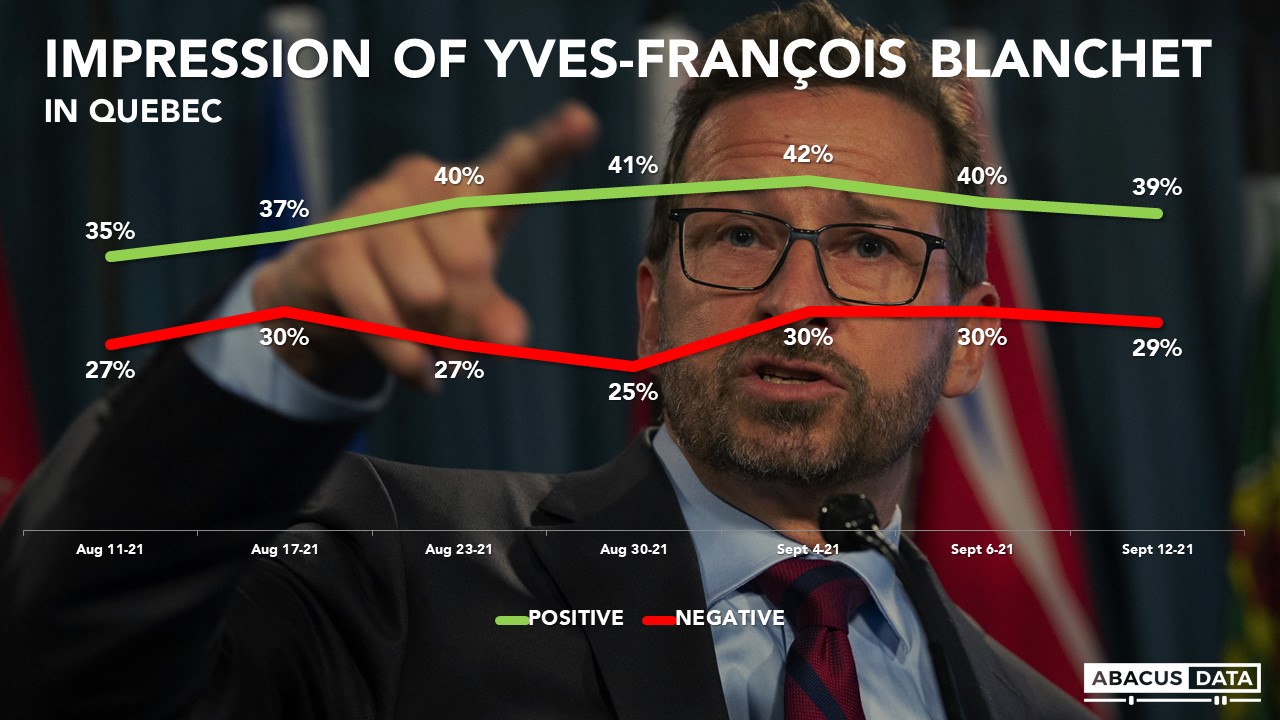
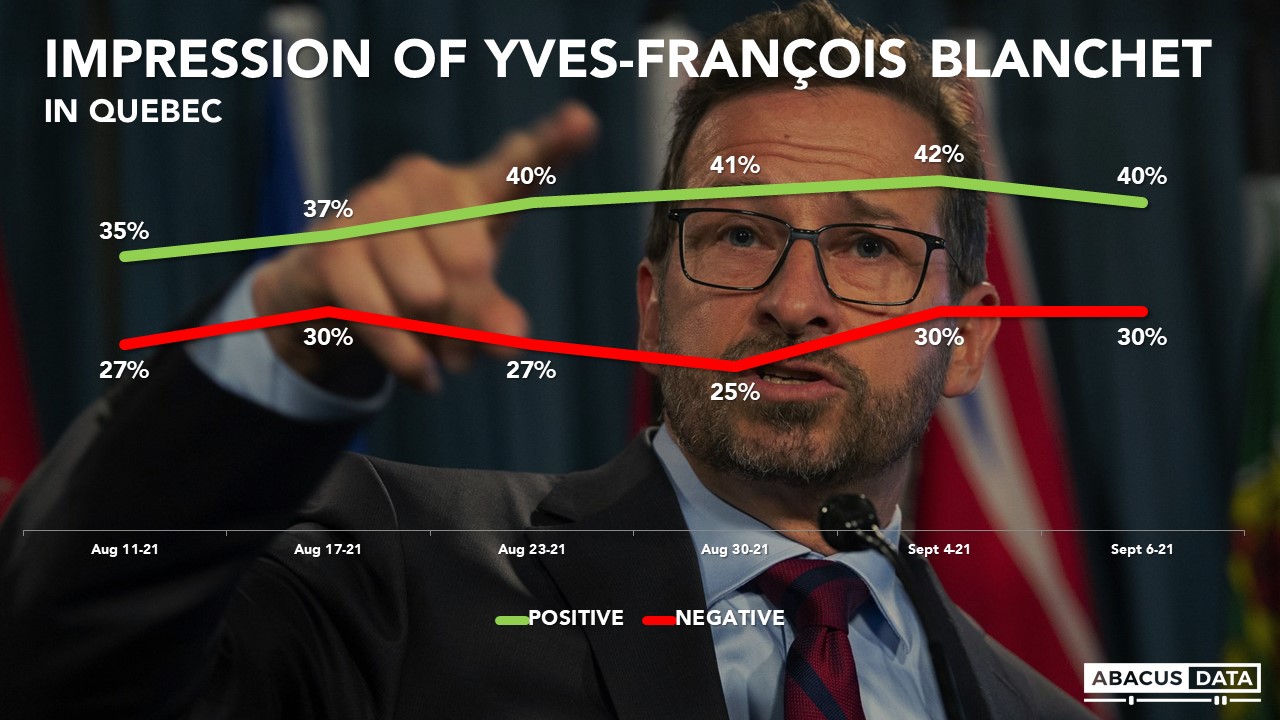
In Quebec, BQ Leader Mr. Blanchet is 39% positive and 29% negative for a net score of +10. Mr. Blanchet’s is largely unchanged from the last wave.
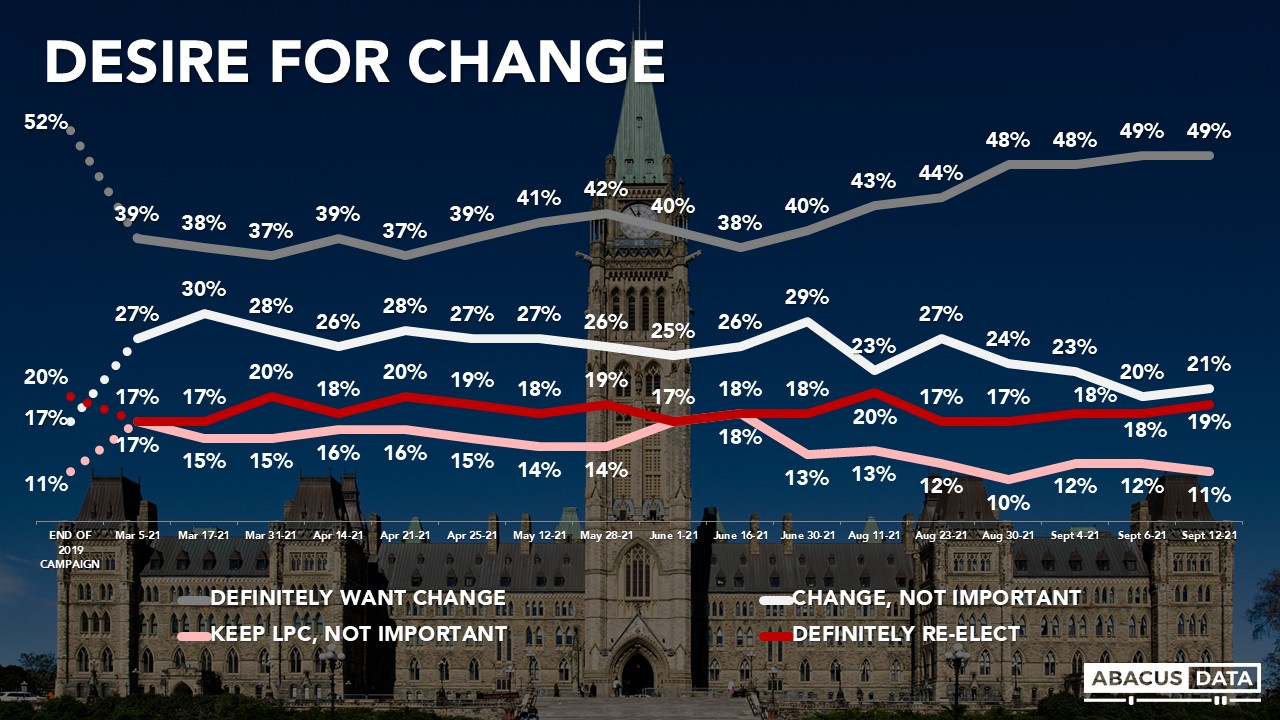
DESIRE FOR CHANGE
Today, 49% definitely want to see a change in government (unchanged from last week) while another 21% say it would be good to have a change, but it is not really that important to them (up 1), for a total of 70% who would prefer a change in government.
The vote preference by change group is important to understanding the election. Among those who prefer change but say it isn’t that important to them (21% of the electorate at the moment), the Liberals have opened up a 13-point lead over the NDP with the Conservatives in third. Liberal re-election hopes continue to ride on how this group ultimately leans and Mr. Trudeau’s party seem to be gaining over timing.
Among those who say they want to keep the Liberals in office but it’s not important to them, 74% would vote Liberal compared with 9% who would vote NDP.
UPSHOT
According to Bruce Anderson: “The debates are over and the campaign enters its final week with more good news for the Liberals than for their competitors, although the outcome is far from clear. Mr. O’Toole’s reputation gains have stalled, and the Liberals have gained some precious margin in Ontario and Quebec. BC looks like a vital and potentially determining race. Perhaps the most important news in this poll for the Liberals is that the desire for change may be softening and among those who were leaning towards a change but not committed to that position, the Liberals find more support this week.
None of the leaders performed badly enough to affect their prospects in this election, and it’s arguable that the PM accomplished more of what he needed to accomplish than his main rivals did in the debates.”
According to David Coletto: “With a week to go the race remains tight nationally but the Liberals have opened up some leads in vote-rich Ontario and Quebec. Right now, the Liberals have the advantage as the debates don’t seem to have made much difference except for reinforcing some pre-existing ideas people had of the leaders.
In my opinion, the most important data point in this release is the question about the desire for change. At 49%, those definitely wanting a change in government remain below the 2019 number and has hasn’t moved in a few weeks now.
Instead of articulating a clear rationale for why the Liberals should be replaced, the Conservative and NDP campaigns have focused on the election call itself. Undoubtedly people are annoyed by the election, but so far, it doesn’t look like either has made much progress in convincing past Liberal voters to switch their support.
Because they have repeatedly claimed this election was “unnecessary” they may have inadvertently helped the Liberals buffer against growth in a desire for change.”
METHODOLOGY
The survey was conducted with 2,000 Canadian adults eligible to vote from September 10 to 12, 2021. A random sample of panelists were invited to complete the survey from a set of partner panels based on the Lucid exchange platform. These partners are typically double opt-in survey panels, blended to manage out potential skews in the data from a single source.
The margin of error for a comparable probability-based random sample of the same size is +/-2.1%, 19 times out of 20.
The data were weighted according to census data to ensure that the sample matched Canada’s population according to age, gender, educational attainment, and region. Totals may not add up to 100 due to rounding.
We are the only research and strategy firm that helps organizations respond to the disruptive risks and opportunities in a world where demographics and technology are changing more quickly than ever.
We are an innovative, fast-growing public opinion and marketing research consultancy. We use the latest technology, sound science, and deep experience to generate top-flight research-based advice to our clients. We offer global research capacity with a strong focus on customer service, attention to detail and exceptional value.
We were one of the most accurate pollsters conducting research during the 2019 Canadian Election.
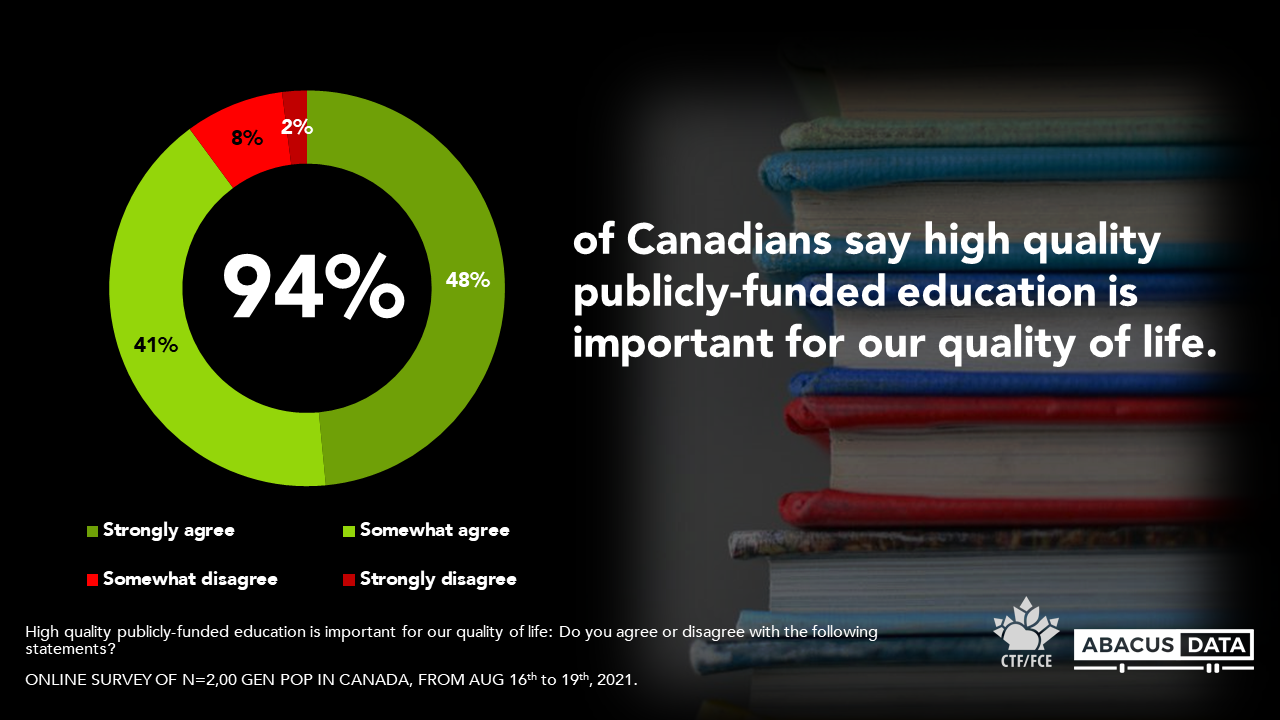
The following survey was conducted by Abacus Data on behalf of the Canadian Teachers’ Federation, from August 16th to 19th 2021. The survey was conducted online with a sample of n=2,000 general population adults in Canada. Additional reporting information can be found here.
As back to school begins for students across Canada now is a good opportunity to reflect on public education in Canada- both the importance of equitable access to public education and how a strong public education system can have a positive impact for all of us.
Last month we conducted a survey on behalf of the Canadian Teachers’ Federation (CTF/FCE) on public support for public education, and how public education can work to build a better Canada. Here’s what we found.
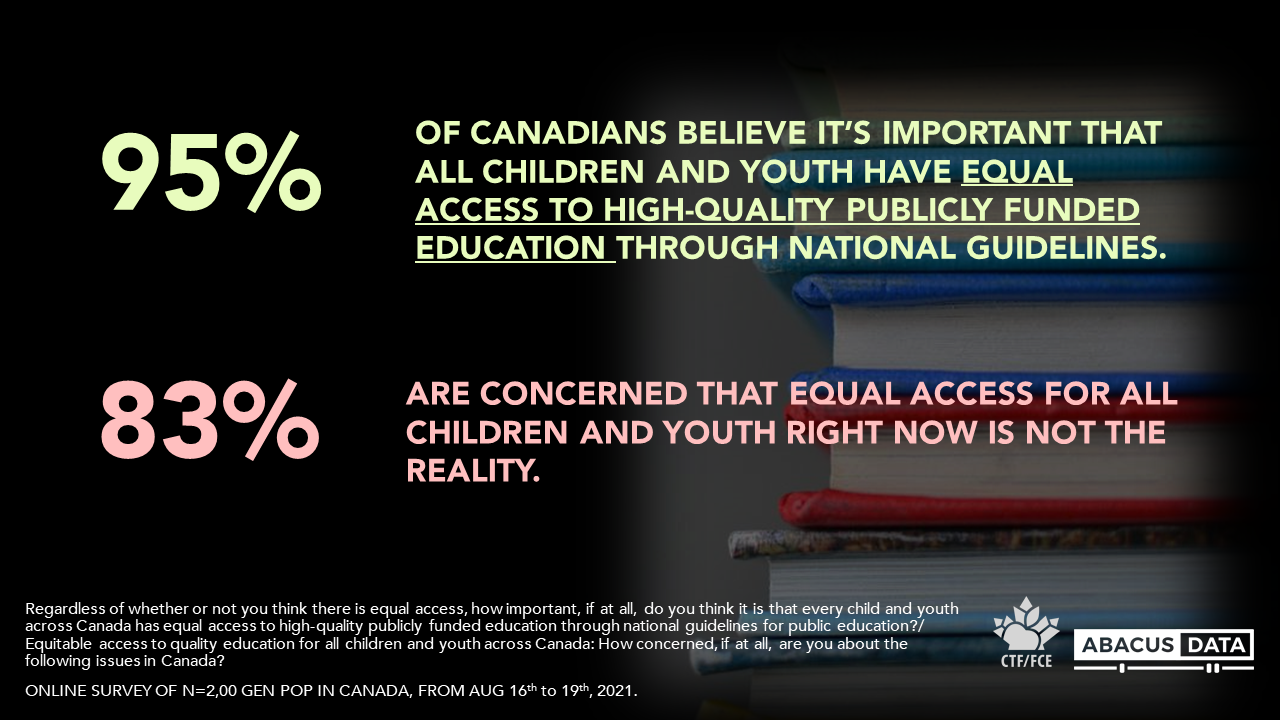
First, ensuring all children have equitable access to quality publicly funded public education is important for nearly all Canadians, but few think this is currently a reality.
Access to public education appears to be one of those issues that unite Canadians. We find that 95% of respondents believe it’s important that all children and youth have access to high-quality publicly funded national guidelines. With a number this high, it’s clear that public education is a priority for almost all of us, making it one of those rare issues that unite Canadians regardless of age, region or vote.
But for an issue that is important to so many Canadians, there is still work to be done. Nearly the same number (83%) are concerned the current state of equitable access to public education across Canada.
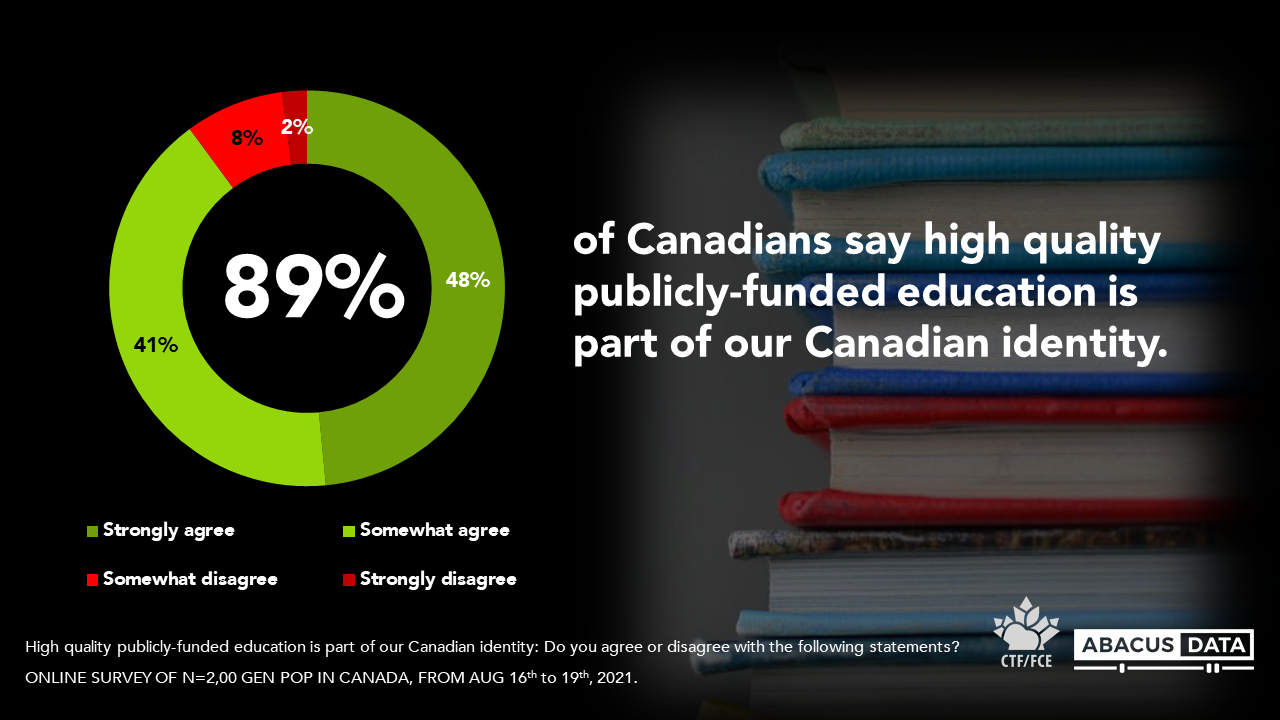
Next, we find that Canadians aren’t just prioritizing public education because of the current realities, but because it’s part of our national identity. When we think of institutions that are quintessentially Canadian health care might be one that comes to mind. But for many of us public education is also at the top of that list.
In the same survey, we found that 89% consider high-quality publicly funded education to be part of our Canadian identity.
Public education is linked to our national identity in many ways. For one, it’s important for our quality of life. Nearly all respondents (94%) agree with the statement ‘high quality publicly funded education is important for our quality of life’.
For many of us, public education is part of who we are as Canadians and has an impact on the quality of lives we lead.
Finally, we find support for public education because of its ability to repair social cracks. During the pandemic, many students across Canada were unable to access in-person learning. But this wasn’t the only thing children and youth were missing out on.
The experience through the pandemic taught us just how many other services and supports our public education system delivers, from the mental health and social development supports provided through in-person interactions, and extra-curricular programs like breakfast programs. It is through the lessons taught by the pandemic perhaps, that Canadians see the value in public education beyond education itself, and as a way to provide social supports.
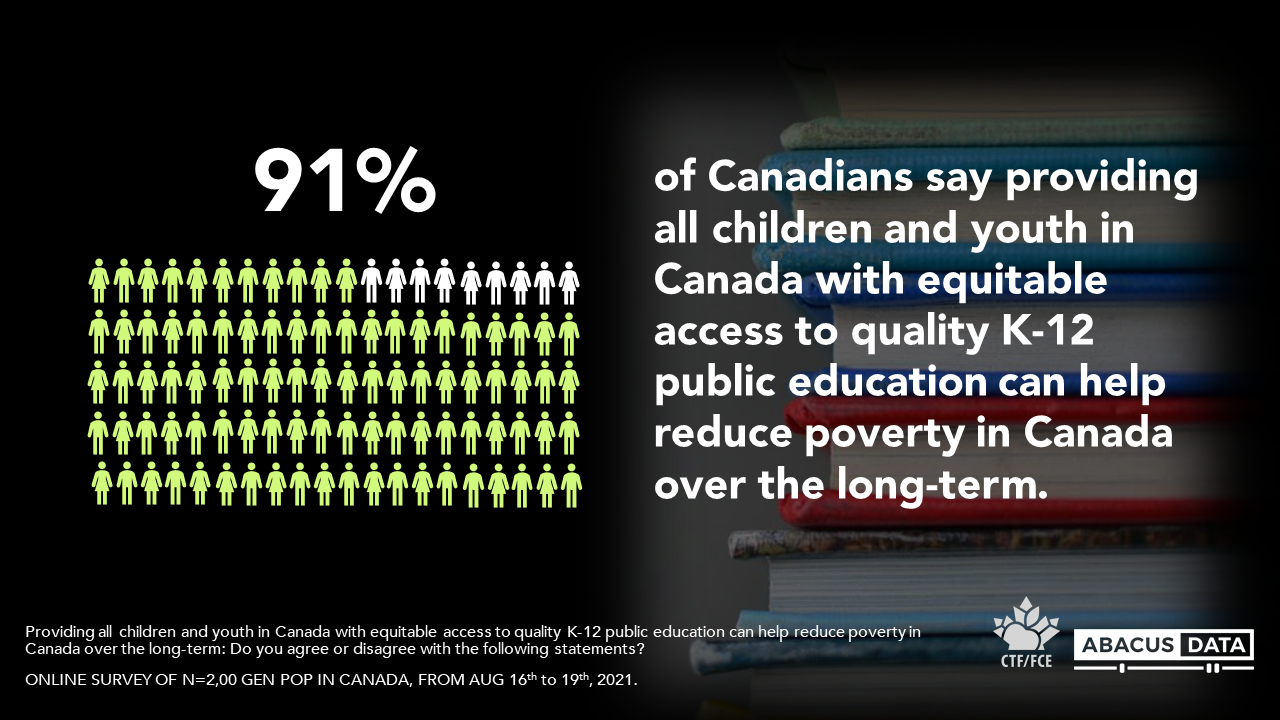
In our survey we found 91% of respondents say providing all children and youth in Canada with equitable access to quality K-12 public education can help reduce poverty in Canada over the long term.
THE UPSHOT
Our research shows a strong majority of Canadians agree that equitable access to public education is so important to our identity, to our quality of life, and to our future. But upon reflecting on this year and beyond, many are concerned that this isn’t the reality for all children and youth in Canada.
At a time when many children and youth are heading back to school for the first time in a while, it’s clear that we want to ensure all children and youth have equal opportunities to access public education.
Nearly all Canadians see public education as something that is important for all of us- it’s an important pillar of our collective identity, crucial support for those living in poverty and an institution to invest in and build a better Canada for us all.
METHODOLOGY
The following survey was conducted by Abacus Data on behalf of the Canadian Teachers’ Federation. The survey was conducted from August 16th to 19th with a sample of n=2,000 general population adults in Canada.
A random sample of n=2,505 panelists were invited to complete the survey from a set of partner panels based on the Lucid exchange platform. These partners are typically double opt-in survey panels, blended to manage out potential skews in the data from a single source.
The margin of error for a comparable probability-based random sample of the same size is +/- 2.17%, 19 times out of 20.
The data were weighted according to census data to ensure that the sample matched Canada’s population according to age, gender, educational attainment, and region. Totals may not add up to 100 due to rounding.
We are the only research and strategy firm that helps organizations respond to the disruptive risks and opportunities in a world where demographics and technology are changing more quickly than ever.
We are an innovative, fast-growing public opinion and marketing research consultancy. We use the latest technology, sound science, and deep experience to generate top-flight research-based advice to our clients. We offer global research capacity with a strong focus on customer service, attention to detail and exceptional value.
We were one of the most accurate pollsters conducting research during the 2019 Canadian Election.
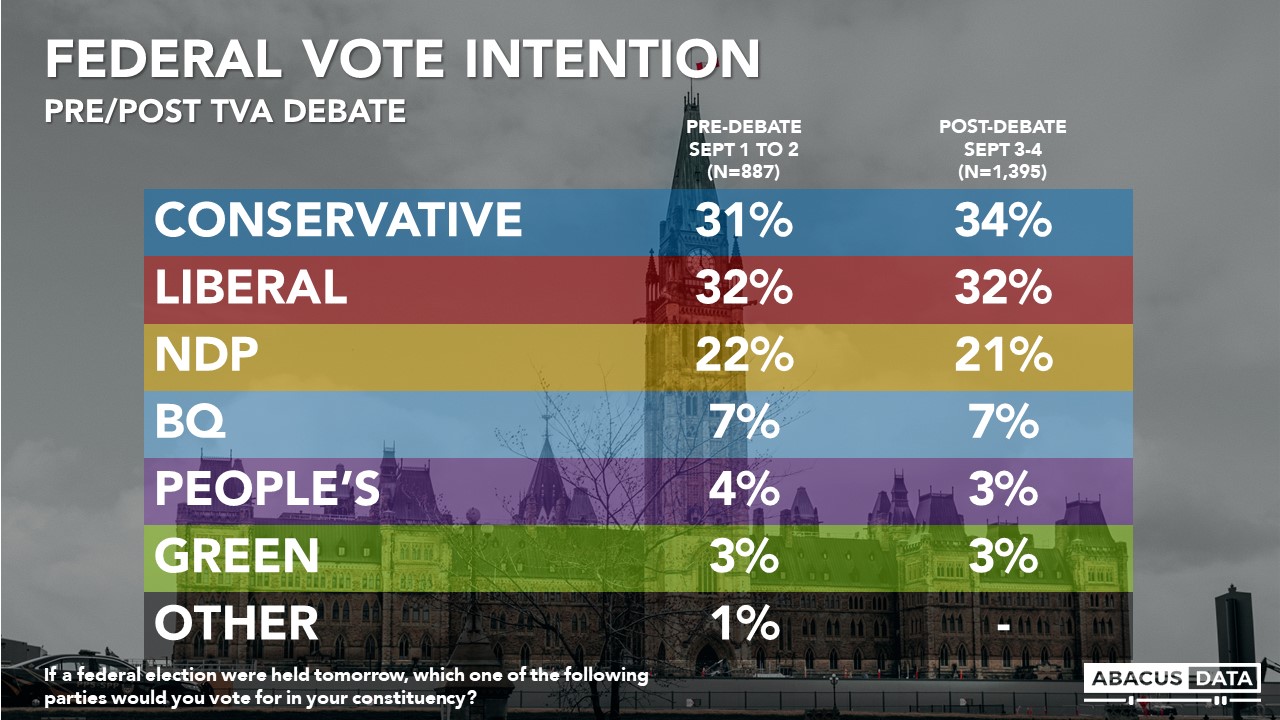
We just completed a national survey of 2,875 Canadians eligible to vote in the current federal election completed entirely after last Thursday’s TVA debate. Fieldwork was carried out from Friday to Monday.
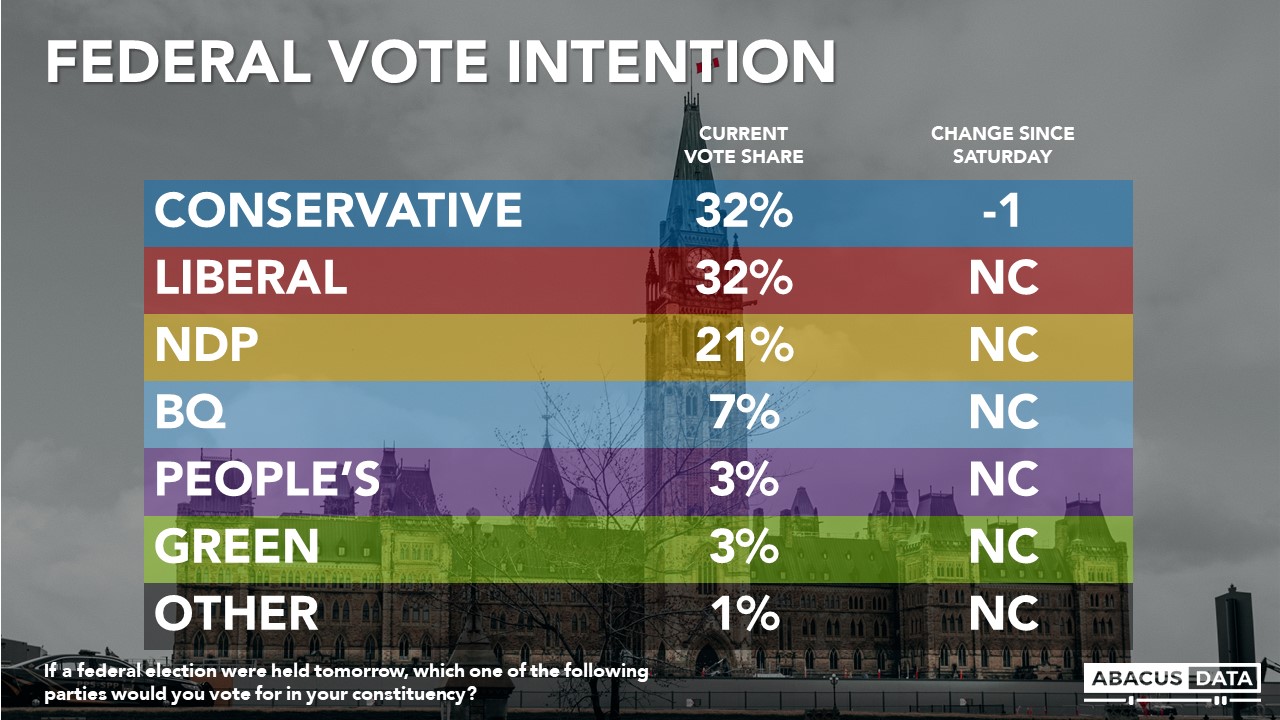
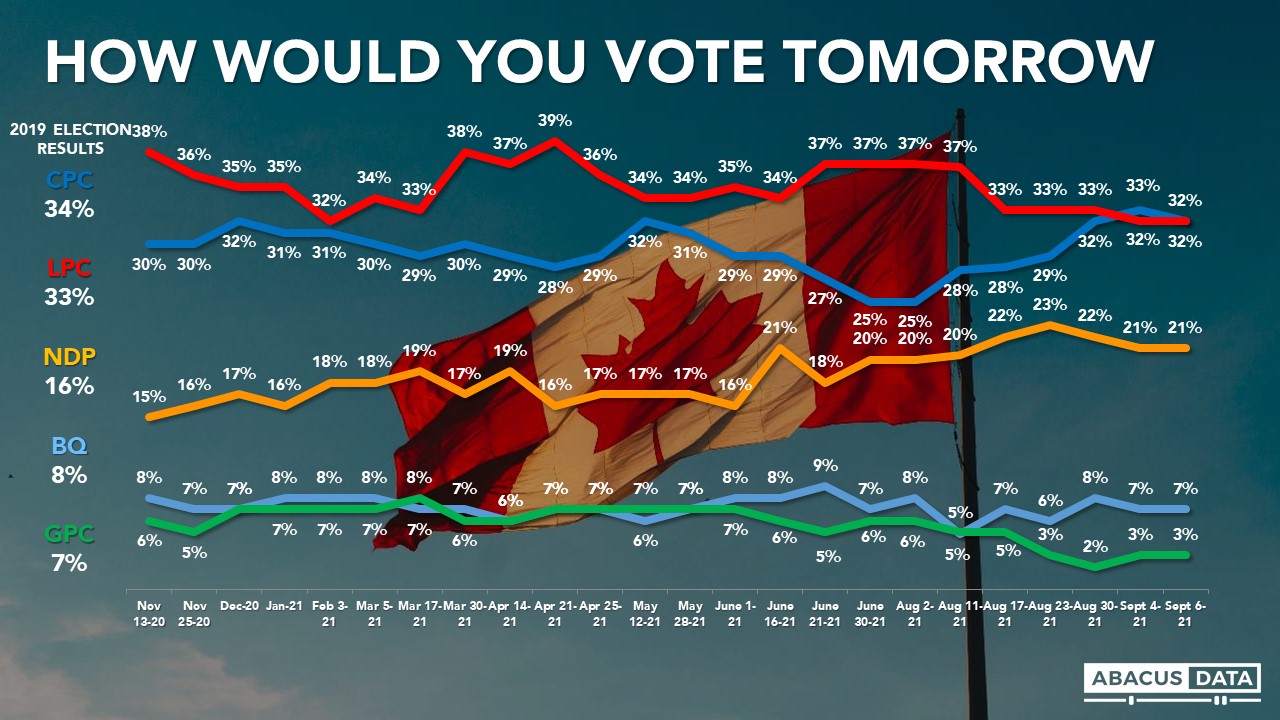
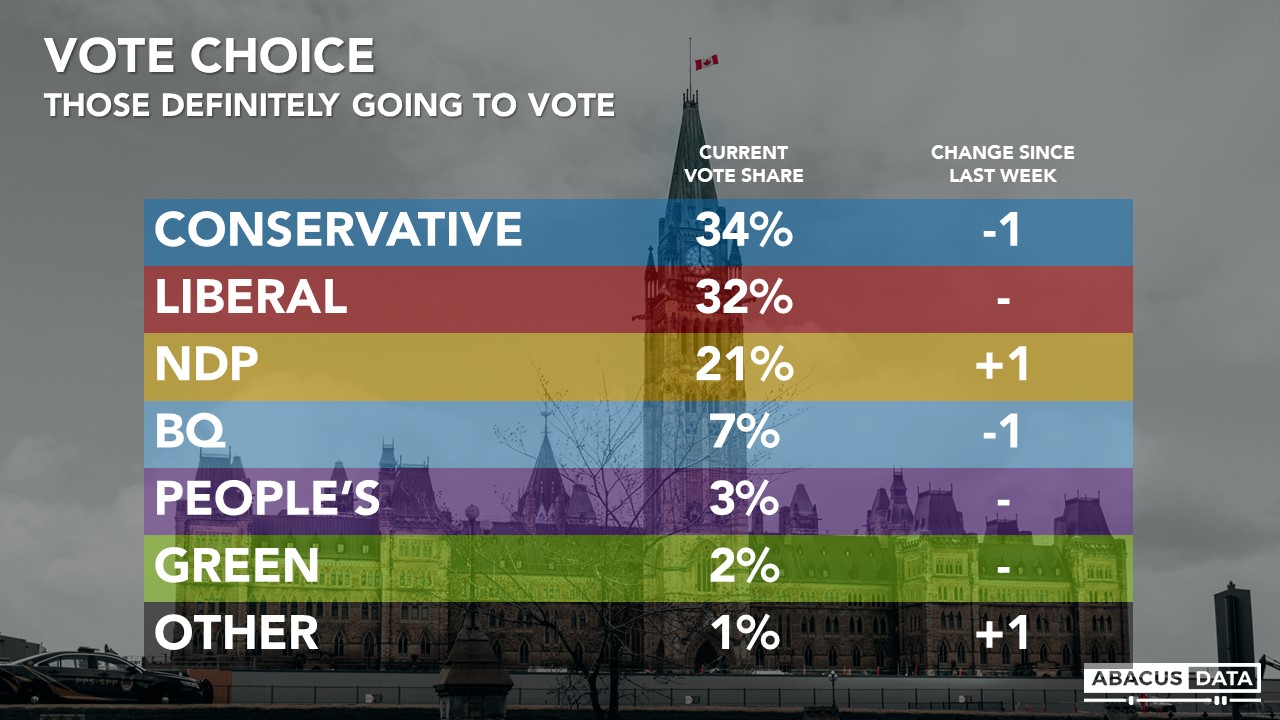
If an election were held now, the Conservatives would win 32% of the vote (-1 from our last poll), the Liberals 32% (unchanged), the NDP 21% (unchanged), the Green Party 3% (unchanged) and the BQ at 31% in Quebec (unchanged)
• In BC, we see a three-way race with the NDP at 35%, the Liberals at 29%, and the Conservatives at 27%.
• In Alberta, 50% would vote Conservative compared with 24% for the Liberals, 20% for the NDP, 3% for the People’s Party and 1% for the Maverick Party.
• In Manitoba and Saskatchewan, the Conservatives lead with 46% followed by the NDP at 24% and the Liberals at 24%.
• In Ontario, the Liberals have a three-point lead over the Conservatives (37% to 34%) with the NDP at 21%.
• Within Ontario, the Liberals have a 19-point lead in the 416 region of Toronto, lead by 5 over the Conservatives in the GTHA (postal codes start with L), the Liberals and Conservatives are statistically tied in Eastern Ontario while the Conservatives have a 9-point lead over the NDP in the Southwest.
• In Quebec, we see the LPC and BQ are neck and neck (32% to 31%) with the Conservatives at 21% and the NDP at 13%. Since our last full sample done before the debate in Quebec at the end of August, the Liberals are up 3 while the BQ is down 3 but this change is all within the margin of error.
• In the Atlantic provinces, the Liberal are ahead by 7 over the Conservatives (39% to 32%) with the NDP at 20%.
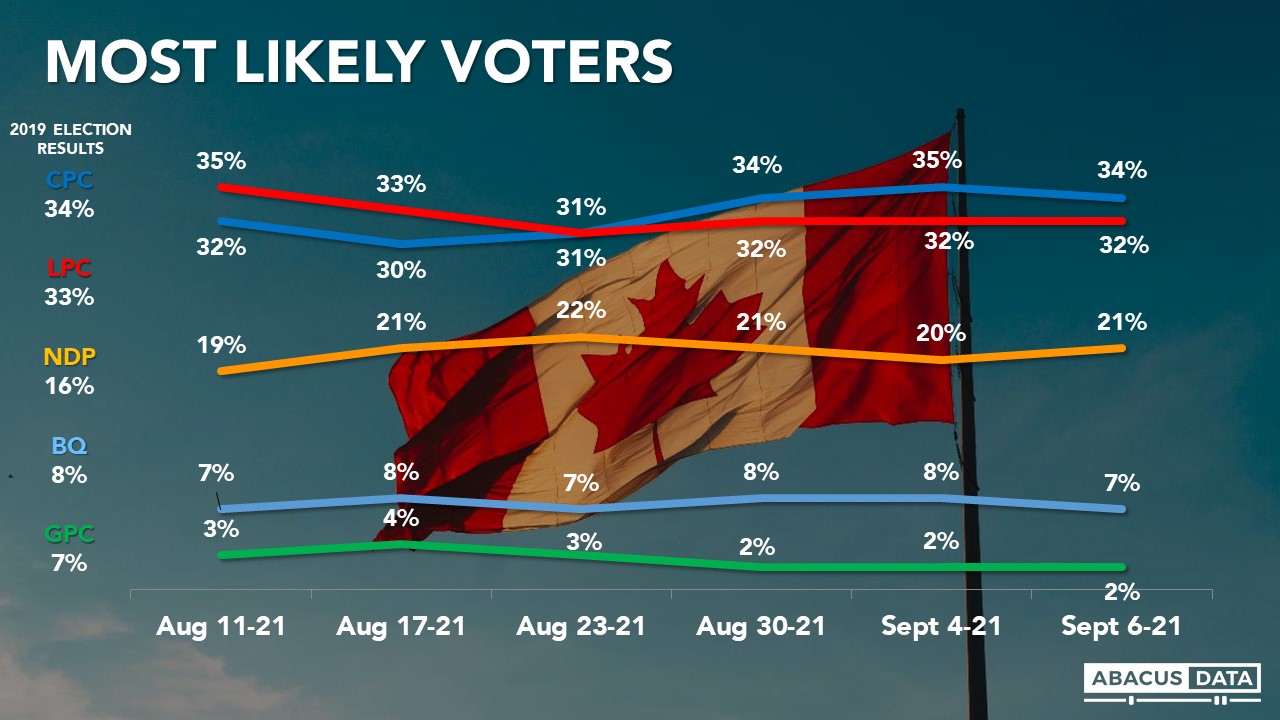
The Conservatives continue to have a marginal 2-point lead among those who are most likely to vote. Among the 69% of respondents who said they would definitely be voting, the Conservatives have 34% compared with 32% for the Liberals and 21% for the NDP. This is largely unchanged from our last poll.
TVA DEBATE REACTIONS
In Quebec, 48% of respondents said they watched all (20%) or some (28%) of the leaders’ debate on TVA Thursday night. Another 27% said they heard about it from others while 25% did not hear anything about the debate.
Outside Quebec, 6% said they watched all of the debate, 15% watched some of it, while 33% heard something about it from others or the news.
It appears the audience for this debate was slightly larger than in 2019. In a survey we did post-debate in 2019, 14% said they watched all of it, 27% watched some, while 37% heard something about it from others.
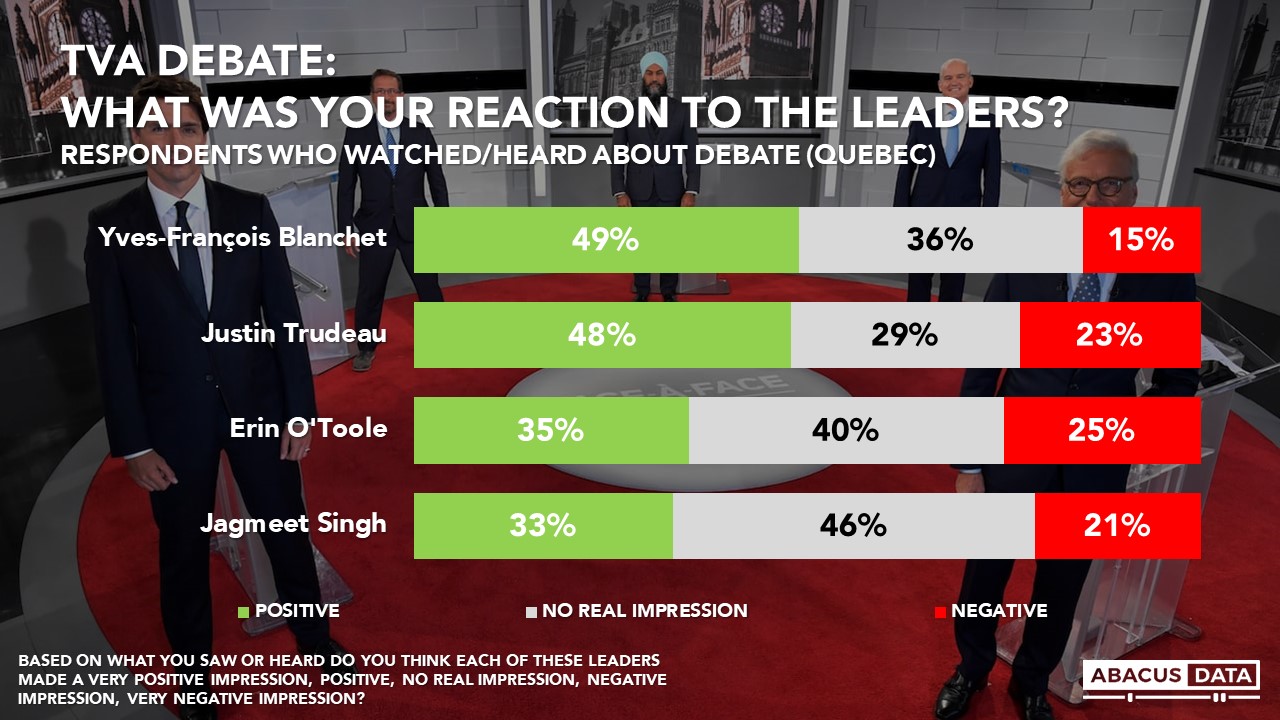
Those who watched or heard something about the debate were asked whether each leader made a positive or negative impression.
All four leaders left more positive than negative impressions, with Trudeau (+25) and Blanchet (+34) notching better net impacts than O’Toole (+10) and Singh (+12).
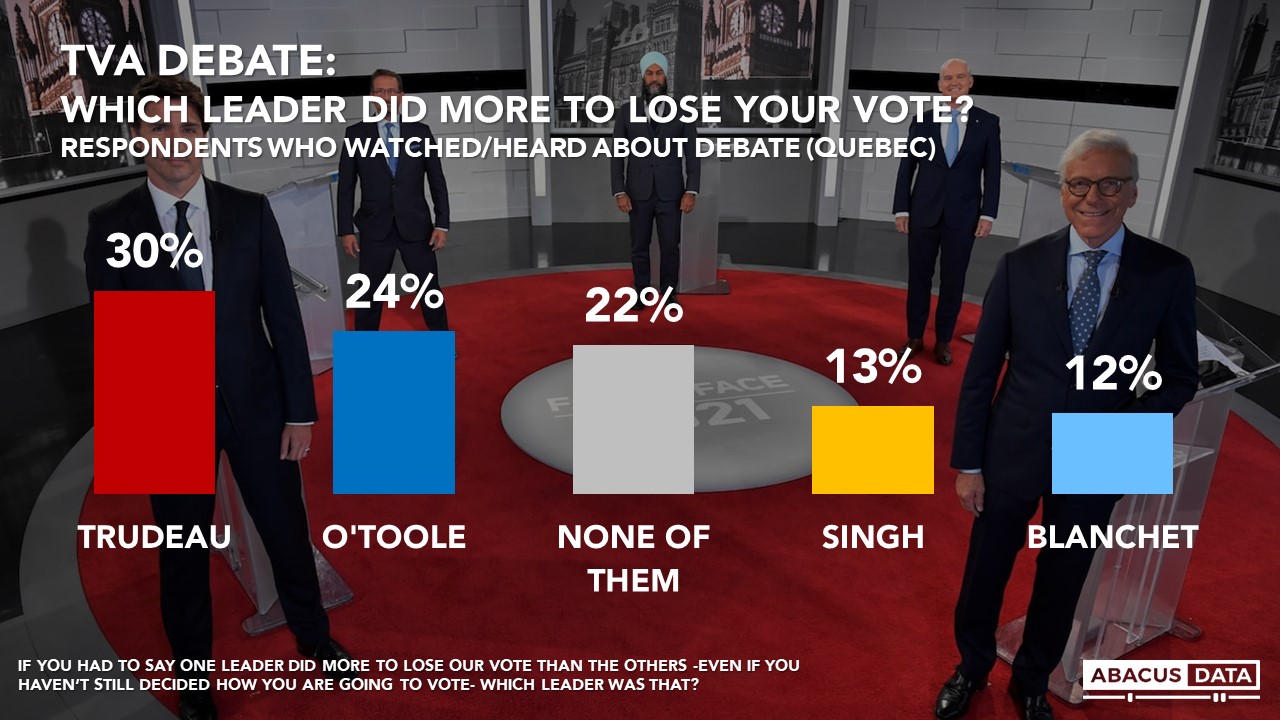
When asked specifically which leader did the most to earn their vote, Justin Trudeau was the choice of 33%, well ahead of Mr. Blanchet (22%), Mr. O’Toole (20%) and Mr. Singh (13%).
When asked which leader did the more to lose their vote, Mr. Trudeau also came out on top with 30% selecting the Liberal leader followed by Mr. O’Toole at 24%, Mr. Singh at 13%, and Mr. Blanchet at 12%. 1 in 5 felt that none of them did more to lose their vote.
Overall, these results suggest that Mr. Trudeau and Mr. Blanchet had better nights than the other two leaders but that no leader performed poorly.
PREFERRED ELECTION OUTCOME
Asked which of four (most likely based on today’s numbers) outcomes they would prefer, 58% would prefer a Liberal victory (30% majority, 28% minority) while 42% would prefer a Conservative win (15% minority, 27% majority). This is unchanged from our previous survey.
A Liberal win is the preference of 65% in BC, 44% in Alberta, 48% in Manitoba/Saskatchewan, 62% in Ontario, 67% in Quebec, and 64% in Atlantic Canada.
Among Liberal/NDP switchers 99% would prefer a Liberal to a Conservative victory. Among NDP voters 72% would prefer a Liberal win.
Among BQ voters 51% would prefer the Liberals win, compared to 49% who would like the Conservatives to come out on top.
Among Liberal/Conservative switchers 72% would prefer to see the Liberals win.
EXPECTED ELECTION OUTCOME
As of today, 37% expect the Liberals to win (unchanged from our last poll but down 6 since last week), followed by 30% who expect the Conservatives to win (up 2 since the last wave and +12 since the start of the campaign), and 7% who expect the NDP to come out on top.
When asked whether the election will be close or will one party win by a lot, 71% think it will be close while 14% think one party will win by a lot. 15% are not sure. Among LPC/NDP switchers 81% think it will be close.
Those who would prefer the LPC to win but think the Conservatives are going to win makes up 5% of the electorate – continuing to rise over the past week.
LEADER IMPRESSIONS
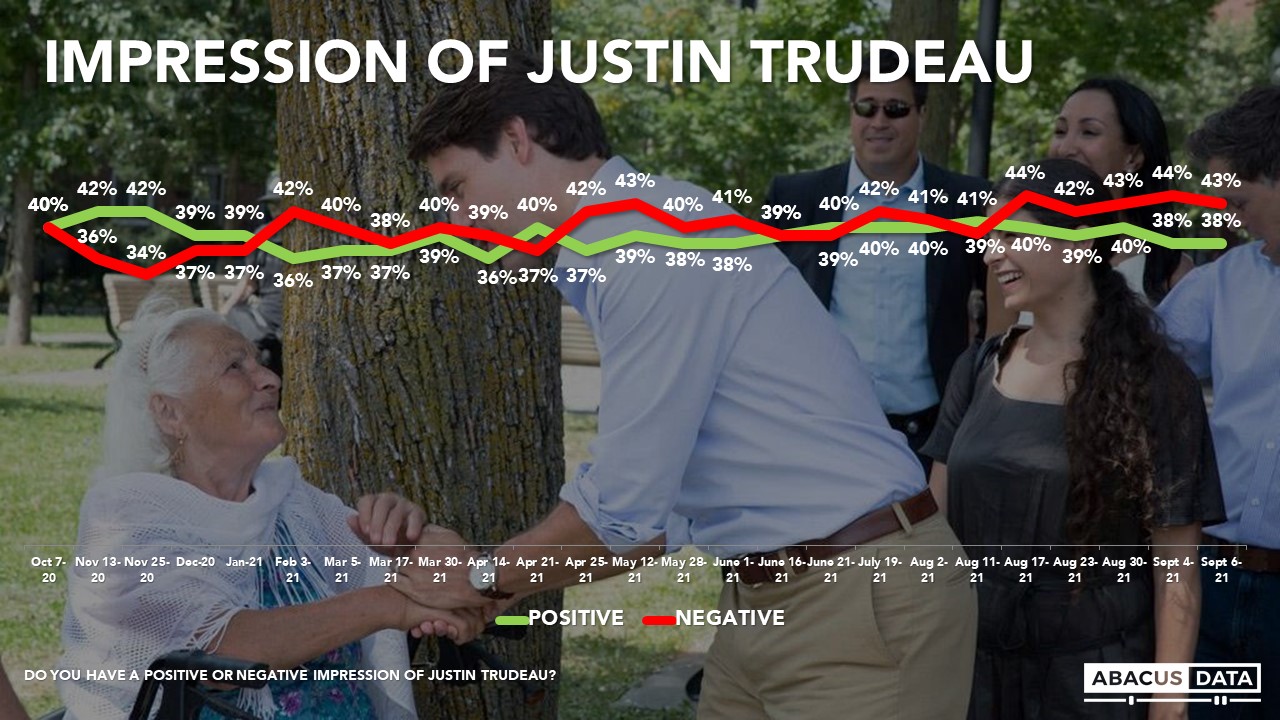
Justin Trudeau enjoys a positive impression among 38% and negative impressions among 43%, for a net score of -5. This is unchanged from last week. Regionally, Mr. Trudeau’s net favourables are -4 in BC, -24 in Alberta, -27 in SK/MB, 0 in Ontario, -2 in Quebec, and +6 in Atlantic Canada. Among Liberal/NDP switchers Trudeau is +71. Among Liberal/Conservative switchers he is +46.
Jagmeet Singh enjoys a positive impression among 44% and finds negative impressions among 25% for a net score of +19.
Regionally, Mr. Singh’s net favourables are +29 in BC, +10 in AB, +20 in SK/MB, +25 in Ontario, +2 in Quebec, and +30 in Atlantic Canada. Among Liberal/NDP switchers Singh is +77.
Today 31% have a positive impression of the Conservative leader Erin O’Toole (+1 from last wave) while his negatives are at 39% (-1) for a net score of -8.
Regionally, Mr. O’Toole’s net favourables are -21 in BC, +7 in AB, +5 in SK/MB, -7 in Ontario, -10 in Quebec, and -10 in Atlantic Canada. Among Liberal/Conservative switchers O’Toole is +47.
In Quebec, BQ Leader Mr. Blanchet is 40% positive and 30% negative for a net score of +10. Mr. Blanchet’s negatives are up 5 since the end of August.
ACCESSIBLE VOTER POOLS
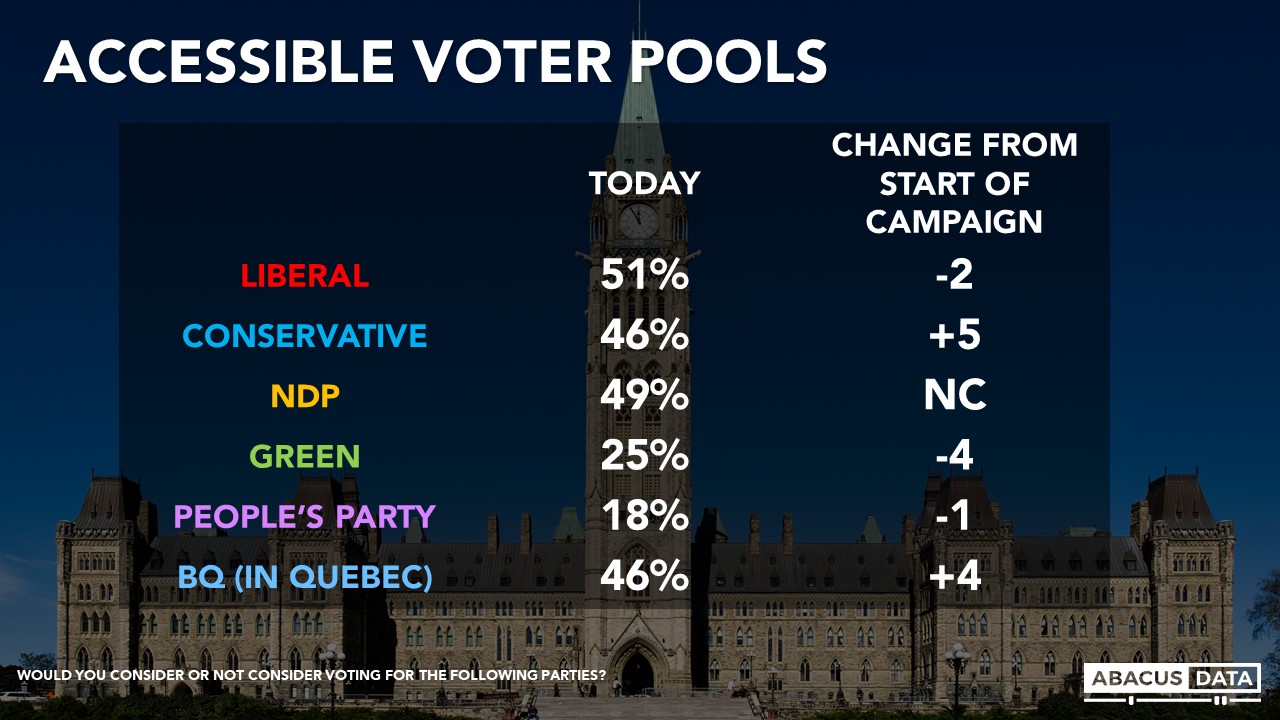
The Liberal Party continues to have the largest pool of accessible voters (those open to voting Liberal) at 51% followed by the NDP at 49% and the Conservatives at 46%. One in four are open to voting Green, 1 in 5 are open to voting for the People’s Party and almost half in Quebec say they are open to voting for the BQ.
Since the campaign started, the Conservative pool has grown by 5, the BQ by 4 while the Greens have seen their accessible voter pool drop by 4 points. The Liberal and NDP voter pools are largely unchanged.
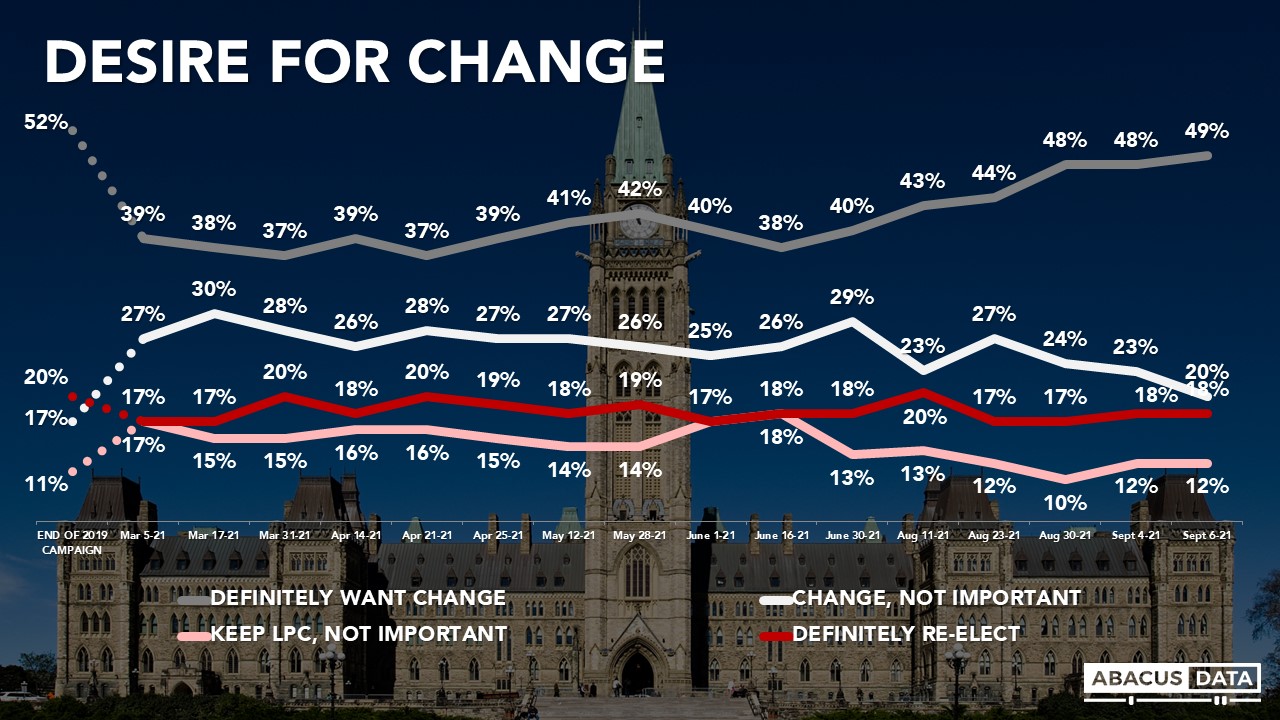
DESIRE FOR CHANGE
Today, 49% definitely want to see a change in government (up 1 since our last survey) while another 20% say it would be good to have a change, but it is not really that important to them (down 3), for a total of 69% who would prefer a change in government.
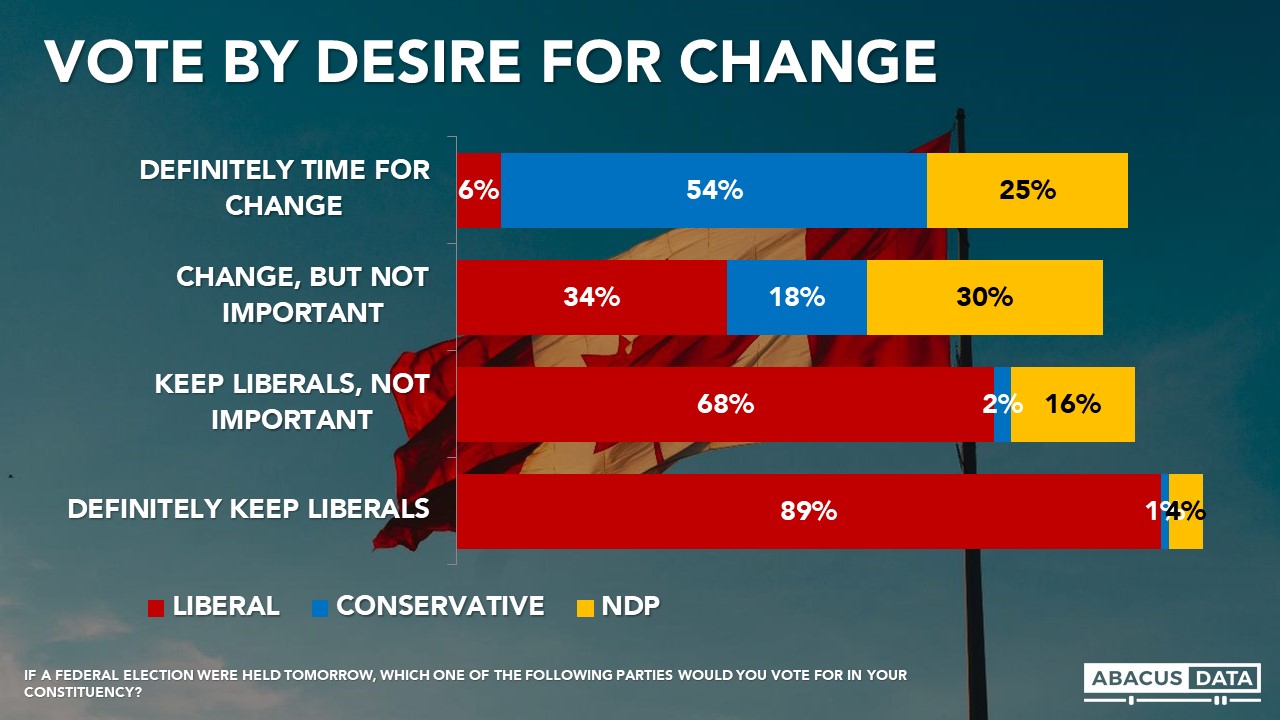
The vote preference by change group is important to understanding the election. Among those who prefer change but say it isn’t that important to them (20% of the electorate at the moment), the Liberals and NDP are statistically tied (LPC 34% vs. NDP 30%) with the Conservatives in third. Liberal re-election hopes likely ride on how this group ultimately leans.
Among those who say they want to keep the Liberals in office but it’s not important to them, 68% would vote Liberal compared with 16% who would vote NDP.
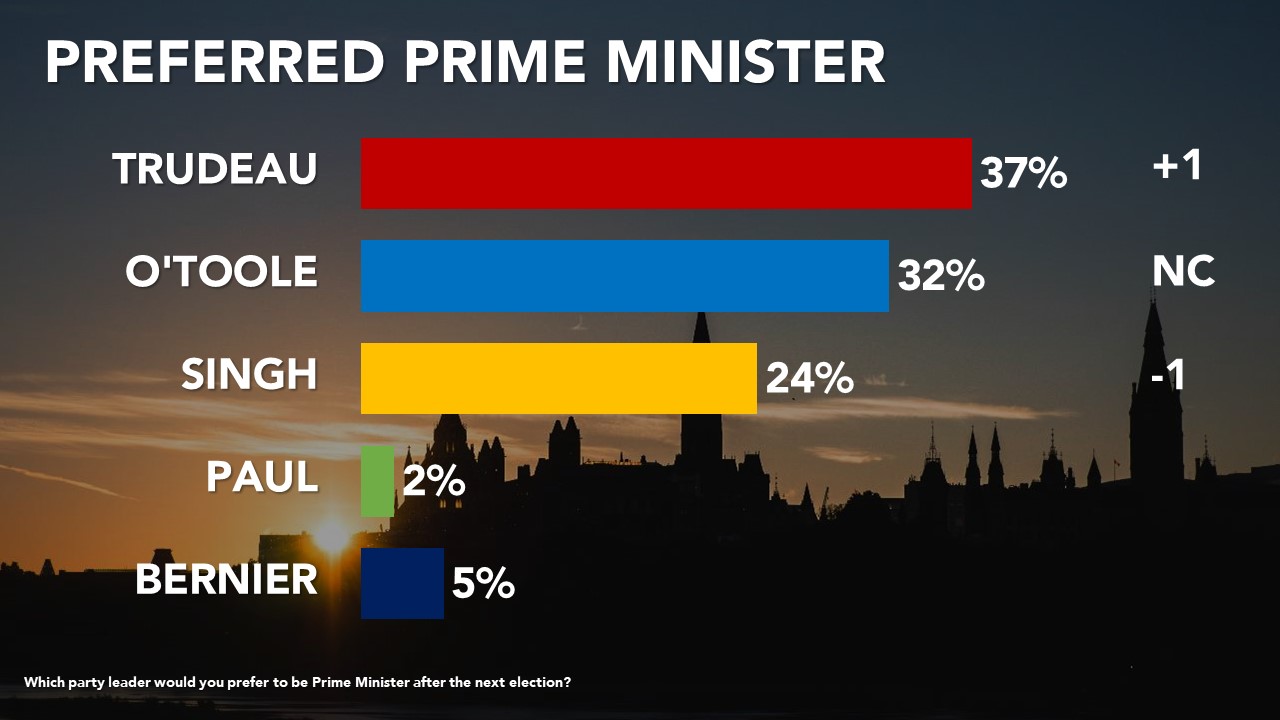
PREFERRED PRIME MINISTER
Today, 37% of voters would prefer Justin Trudeau be PM after the election, 32% would prefer Erin O’Toole, and 24% Jagmeet Singh. This is almost the exact same split as our last poll.
Asked if the choice was only between O’Toole and Trudeau, Trudeau would be the preference of 57% (up 1) and O’Toole 44% (down 1). When asked who they would prefer between Mr. O’Toole and Mr. Singh, the split is almost the same, 56% would prefer Mr. Singh and 44% would prefer Mr. O’Toole.
UPSHOT
According to Bruce Anderson: “Anyone who felt that this election had a locked-in trajectory will want to revisit that point of view as more data is suggesting this race can be won by either one of two parties and that many voters remain uncertain what they will do. The TVA debate was a good outing for Mr. Trudeau but also for his chief rival in Quebec, Mr. Blanchet. Battles in BC, Ontario and Quebec are too close to call and the coming week, with more debates and more advertising, will be of vital importance for all the campaigns.”
According to David Coletto: “The race remains deadlocked nationally with the Liberals ahead in Ontario and tied in Quebec. Even among those most likely to vote, the 2-point Conservative margin is unlikely to win them more seats than the Liberals.
The TVA debate doesn’t appear to have changed the trajectory of the campaign with more saying Mr. Trudeau and Mr. Blanchet left a positive impression and vote intentions and leader impressions largely the same as before the debate.
But the static horse-race numbers obscure some important shifts and underlying perceptions/views that give us a sense of where this campaign could go in the final two weeks:
1. Those thinking the Conservatives will win the election continue to grow. When the campaign started, the gap was 46% Liberal vs. 18% Conservative. Today it is 37% who think the Liberals will win versus 30% who think the Conservatives will win.
2. More voters continue to prefer a Liberal government to a Conservative one and this preference is not shifting much over time.
3. The Conservatives have been able to increase their pool of accessible voters over the campaign and have converted some new supporters. Among its current supporters, 76% voted for the party in 2019 while 23% are new supporters – either saying they voted for a different party in 2019 or did not vote at all. This is similar to what we are seeing for the Liberals (32%) which means it’s stuck tied with the Liberals now because it isn’t converting enough new supporters to build on its 2019 results.
4. So far, the NDP has done the best at growing supporting. Of its current supporters, 49% said they voted NDP in 2019 meaning half of its support is new – with the bulk coming from potentially new voters (24%) who say they didn’t vote in 2019 either cause they weren’t eligible or they chose not to.
5. The desire for change remains at about the level it was when the 2019 campaign ended (49% today vs. 52% in 2019). Keeping this number below 52% is critical for the Liberals. Getting it higher is a must for both the Conservatives and the NDP.
METHODOLOGY
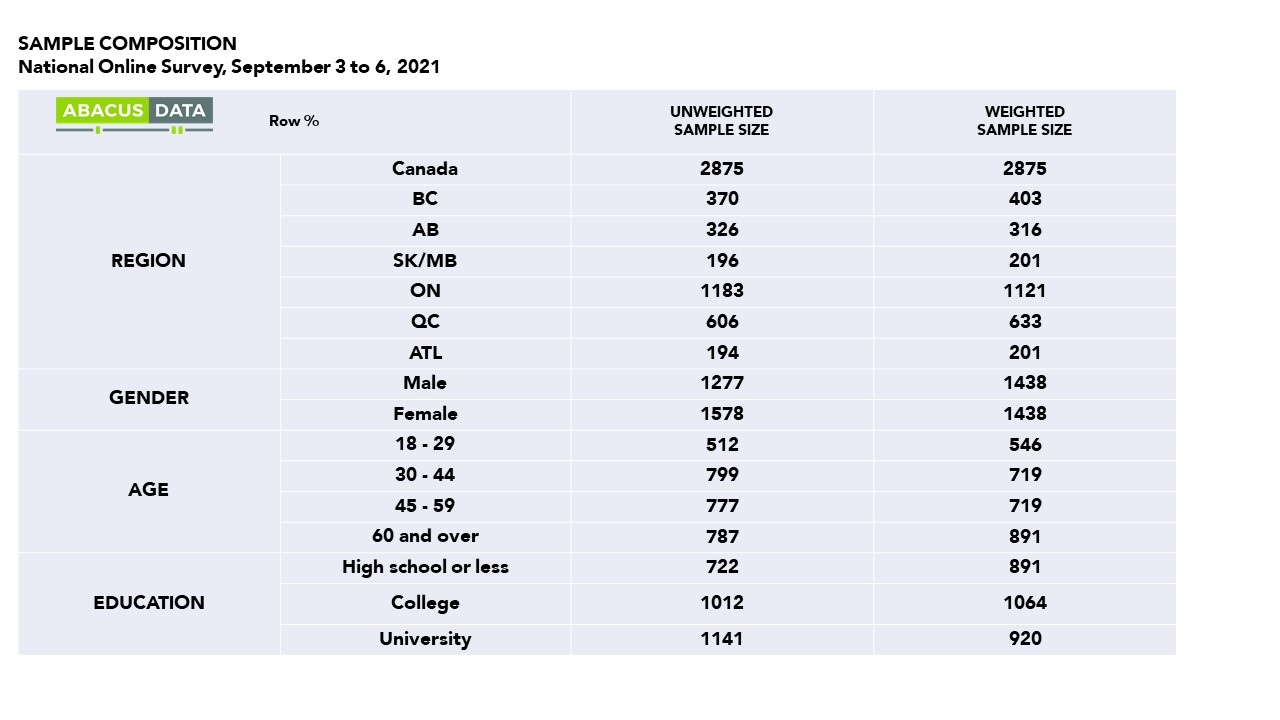
The survey was conducted with 2,875 Canadian adults eligible to vote from September 3 to 6, 2021. A random sample of panelists were invited to complete the survey from a set of partner panels based on the Lucid exchange platform. These partners are typically double opt-in survey panels, blended to manage out potential skews in the data from a single source.
The margin of error for a comparable probability-based random sample of the same size is +/-1.9%, 19 times out of 20.
The data were weighted according to census data to ensure that the sample matched Canada’s population according to age, gender, educational attainment, and region. Totals may not add up to 100 due to rounding.
We are the only research and strategy firm that helps organizations respond to the disruptive risks and opportunities in a world where demographics and technology are changing more quickly than ever.
We are an innovative, fast-growing public opinion and marketing research consultancy. We use the latest technology, sound science, and deep experience to generate top-flight research-based advice to our clients. We offer global research capacity with a strong focus on customer service, attention to detail and exceptional value.
We were one of the most accurate pollsters conducting research during the 2019 Canadian Election.
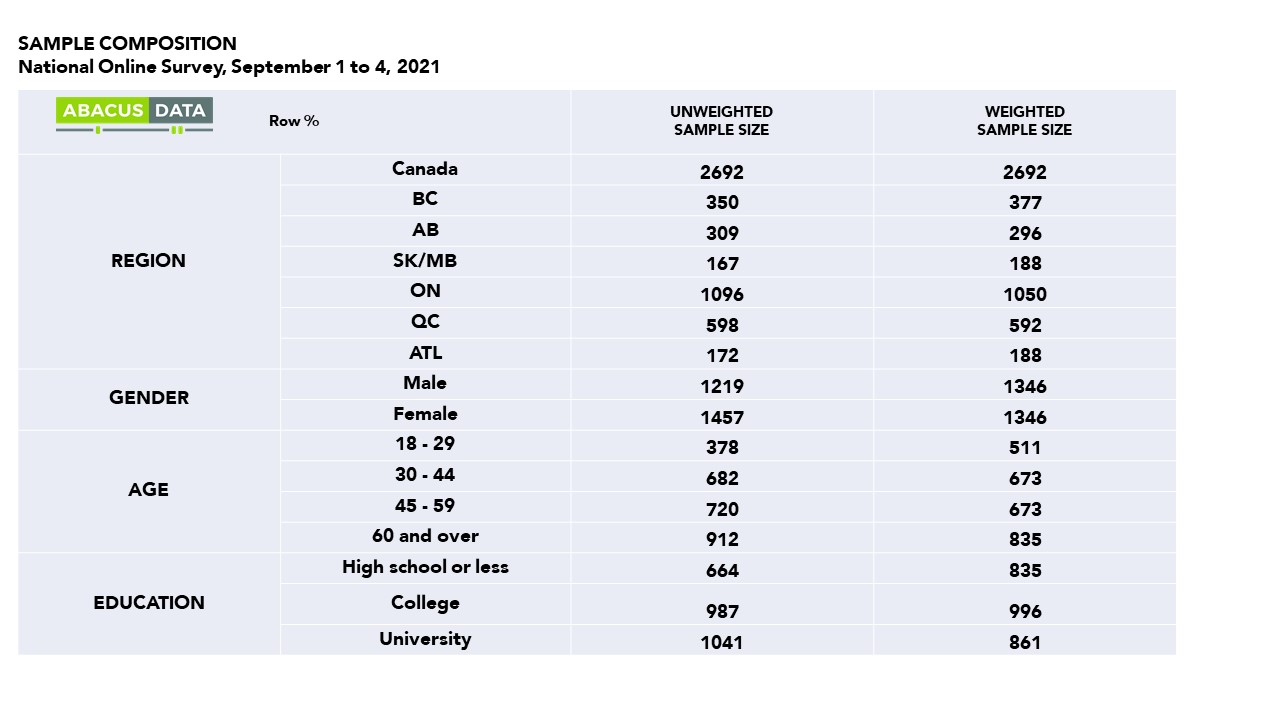
We just completed a national survey of 2,692 Canadians eligible to vote in the current federal election (September 1 to 4, 2021). 62% of the interviews were done after the TVA French-language debate on Thursday evening. We will have a new release out on Tuesday with a large sample to assess the TVA debate.
Here’s what we are seeing in our most recent survey:
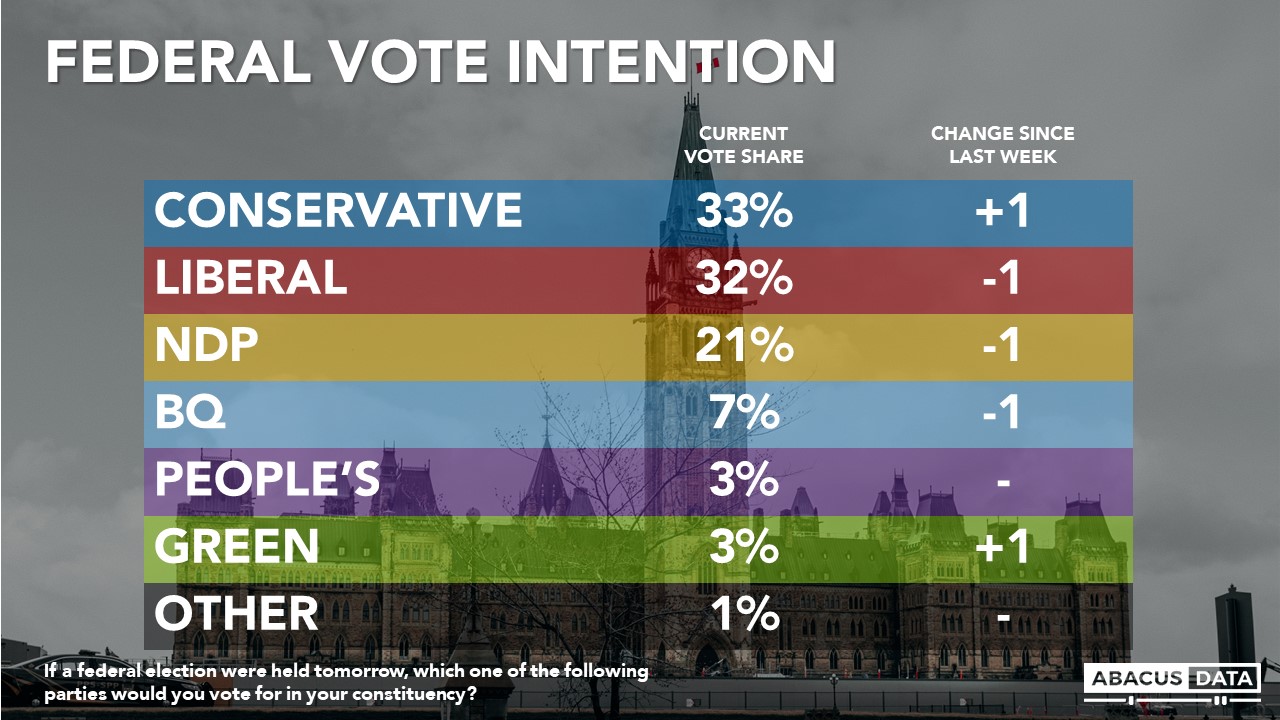
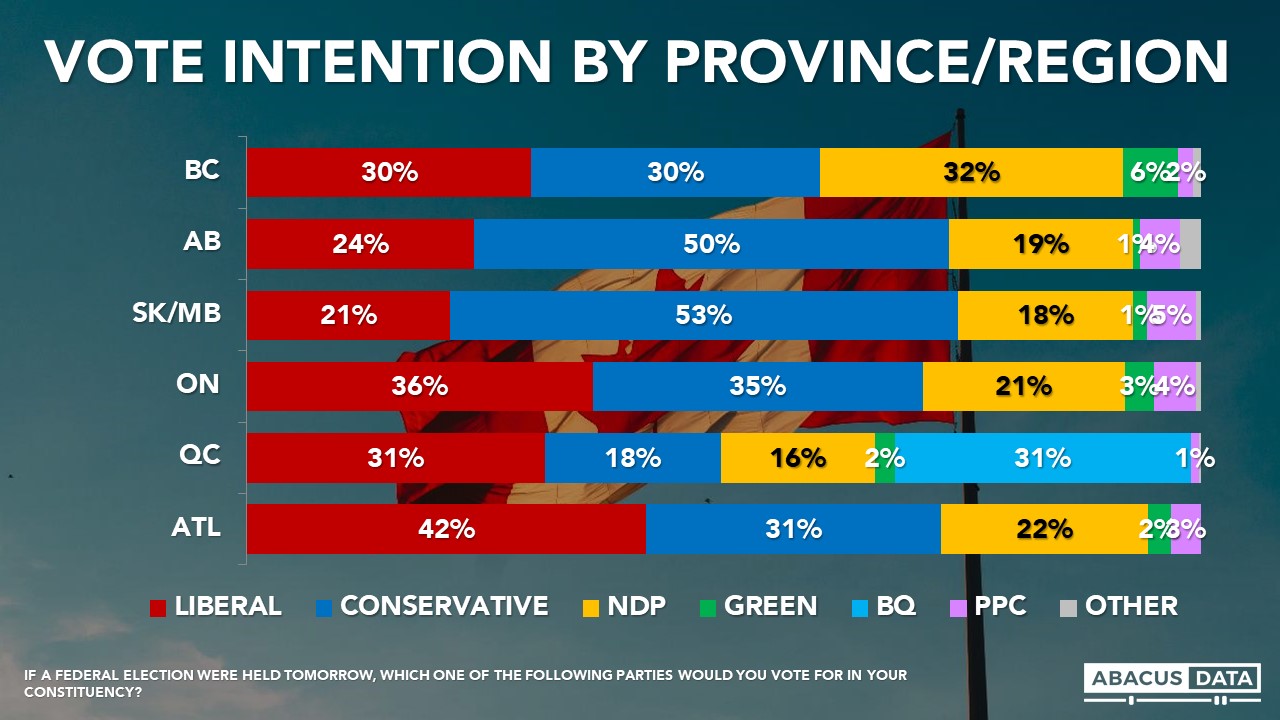
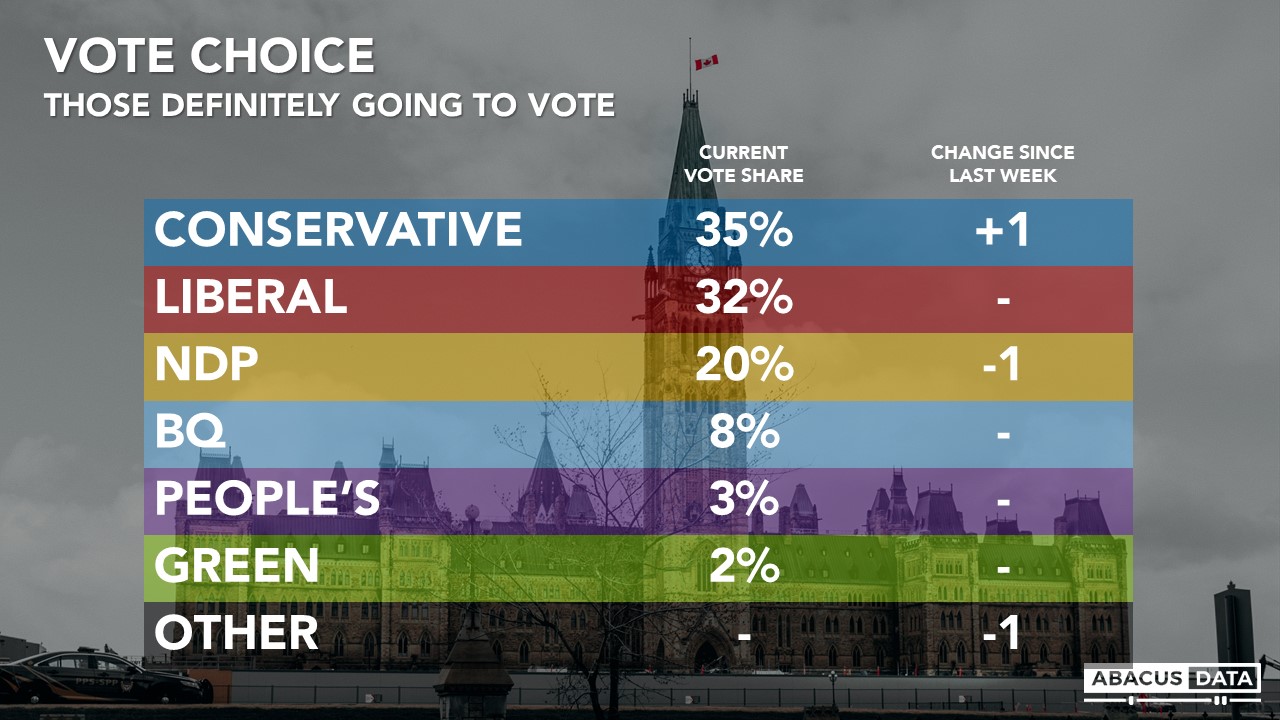
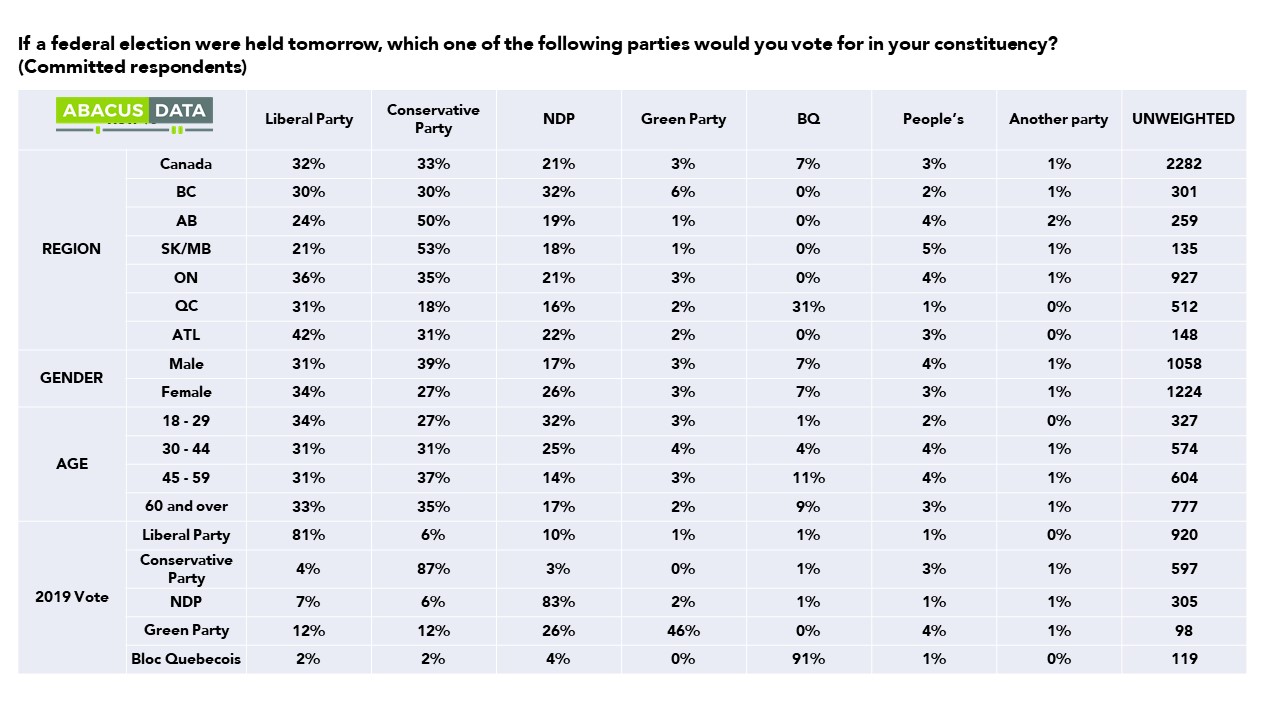
If an election were held now, the Conservatives would win 33% of the vote (+1 from last week), the Liberals 32% (down 1), the NDP 21% (down 1), the Green Party 3% (up 1) and the BQ at 31% in Quebec (down 3)
• In BC, a three-way race with the NDP at 32%, the Liberals at 30%, and the Conservatives at 30% is very tight.
• In Alberta, 50% would vote Conservative compared with 24% for the Liberals, 19% for the NDP, 4% for the People’s Party and 1% for the Maverick Party.
• In Manitoba and Saskatchewan, the Conservatives lead with 53% followed by the Liberals at 21% and the NDP at 18%
• In Ontario, the Liberals and Conservatives are statistically tied (36% LPC vs. 35% CPC) with the NDP at 21%. Last week we had the Liberals ahead by 7 in Ontario.
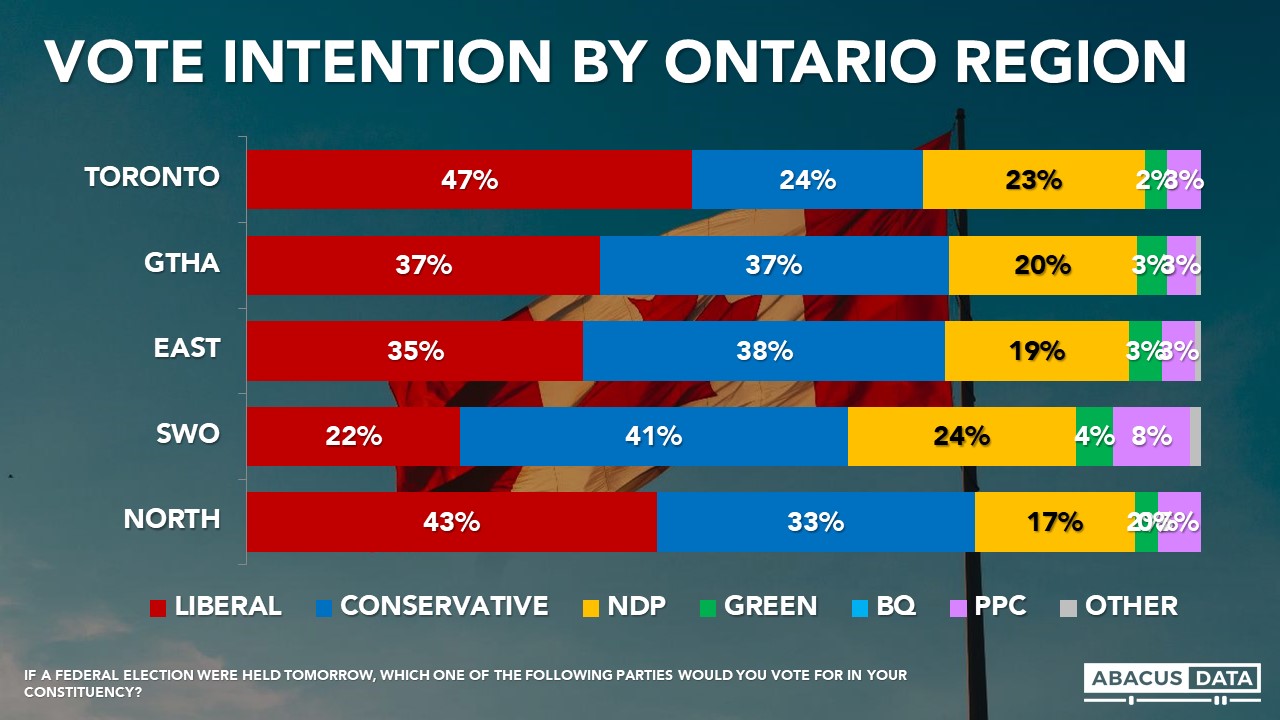
• Within Ontario, the Liberals have a 23-point lead in the 416 region of Toronto, the Liberal and Conservatives are tied at 37% in the GTHA (postal codes start with L), the Liberals and Conservatives tied in Eastern Ontario while the Conservatives have a 17-point lead over the NDP in the Southwest.
• In Quebec, we see the BQ and LPC tied at 31% followed by the Conservatives at 18% and the NDP at 16%. When we compare the sample pre- and post-TVA debate, differences are within the margins of error. In our next release, we will have a larger sample of people who watched the debate and can report a clearer picture of how it might have affected attitudes.
• In the Atlantic provinces, the Liberals are ahead by 11 over the Conservatives (42% to 31%) with the NDP at 22%.
Although the Liberals and CPC are statistically tied among all decided respondents, the Conservatives continue to have a 3-point lead among those who are most likely to vote. Among the 69% of respondents who said they would definitely be voting, the Conservatives have 35% compared with 32% for the Liberals and 20% for the NDP. This is largely unchanged from last week.
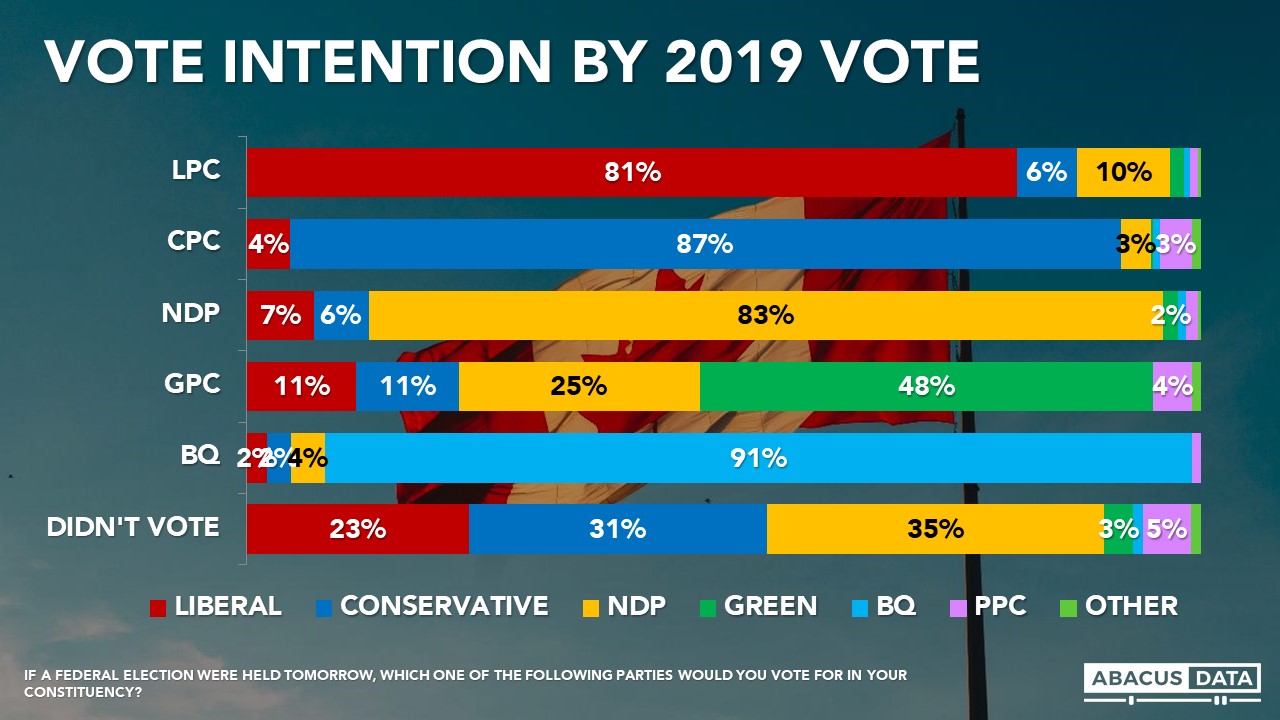
TODAY VS. 2019: HOW WELL ARE PARTIES HOLDING THEIR VOTE.
The Conservatives are holding 87% of their 2019 vote, the rest has been scattered with no more than 4% going to any other party.
The Liberals have held 81% of their 2019 vote, losing 10% of that vote to the NDP and 6% to the Conservatives.
The NDP has held 83% of its 2019 vote, losing a bit more 7% to the Liberals than to the Conservatives (6%).
The Green Party has held on to just 48% of its 2019 vote, losing a quarter of its voters to the NDP, 11% to the Liberals and 11% to the Conservatives.
THE SWITCHERS
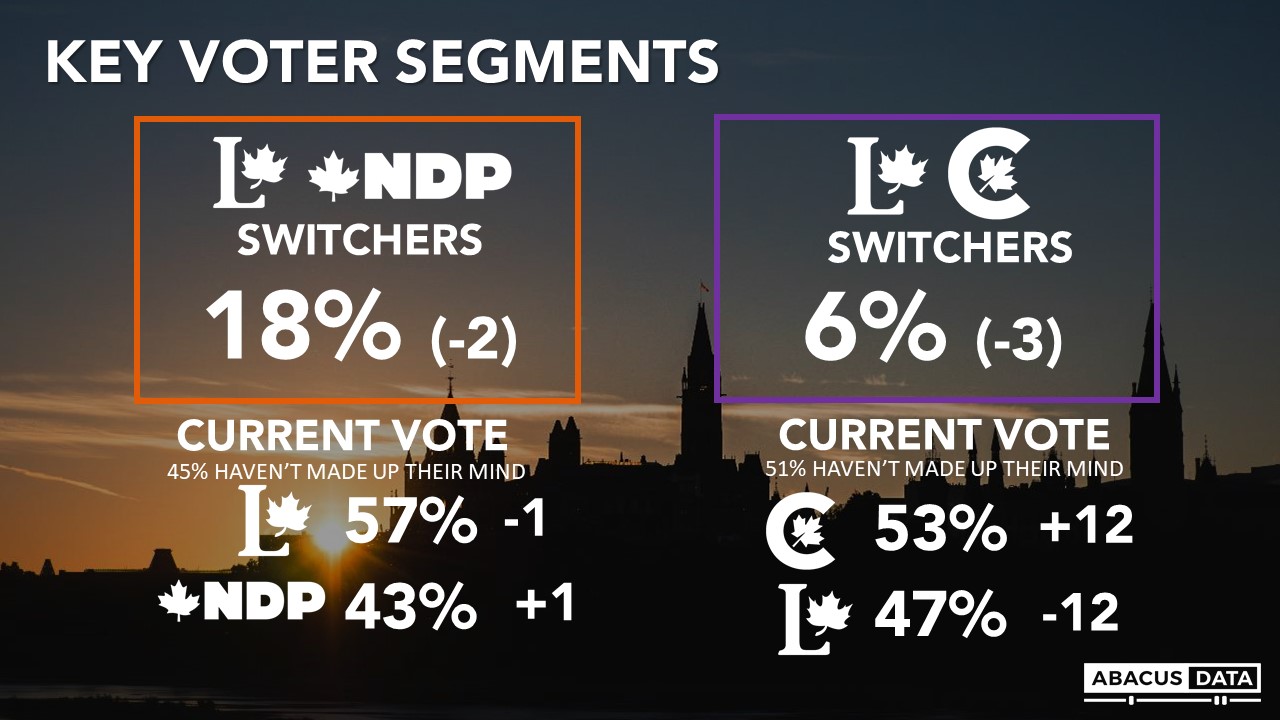
We continue to track two key groups in the electorate: LPC/NDP switchers (18% of the electorate) and LPC/CPC switchers (6% of the electorate). About half in both groups say they could still change their mind about how they will vote.
The Liberals continue to have a sizeable lead over the NDP among the LPC/NDP switchers with little change. However, among LPC/CPC switchers, we have seen a noticeable shift in favour of the Conservatives. This week, 53% of the LPC/CPC switchers would vote Conservative (up 12 points) while 47% would vote Liberal (down 12 points).
VOTE CERTAINTY
Today, 33% of those with a vote preference say their vote could still change (down 5 points in a week, and 7-points in two weeks. NDP and Green supporters are the most likely to be open to switching. Overall, 25% of Conservative supporters might change compared with 32% of Liberal voters, 25% of BQ supporters, and 46% of NDP voters.
PREFERRED OUTCOME
Asked which of four (most likely based on today’s numbers) outcomes they would prefer, 58% would prefer a Liberal victory (31% majority, 27% minority) while 44% would prefer a Conservative win (13% minority, 28% majority). Compared with last week, preference for a Liberal government is down 2-points, and over the past two weeks, it is down 5-points.
A Liberal win is the preference of 63% in BC, 44% in Alberta, 44% in Manitoba/Saskatchewan, 60% in Ontario, 65% in Quebec, and 59% in Atlantic Canada.
Among Liberal/NDP switchers 98% would prefer a Liberal to a Conservative victory. Among NDP voters 76% would prefer a Liberal win.
Among BQ voters 56% would prefer the Liberals win, compared to 44% who would like the Conservatives to come out on top.
Among Liberal/Conservative switchers two thirds (64%) would prefer to see the Liberals win.
EXPECTED ELECTION OUTCOME
As of today, 37% expect the Liberals to win (down 6 since last week), followed by 28% who expect the Conservatives to win (up 5), and 9% who expect the NDP to come out on top.
When asked whether the election will be close or will one party win by a lot, 70% think it will be close while 14% think one party will win by a lot. 16% are not sure.
Those who would prefer the LPC to win but think the Conservatives are going to win makes up 4% of the electorate – doubling from last week. Among this group, 43% would vote NDP, 33% Liberal and 12% Conservative. 9% would vote Green and 3% BQ.
LEADER IMPRESSIONS
Justin Trudeau enjoys a positive impression among 38% and negative impressions among 44%, for a net score of -6. This is unchanged from last week. Regionally, Mr. Trudeau’s net favourables are -5 in BC, -27 in Alberta, -33 in SK/MB, -2 in Ontario, 0 in Quebec, and +6 in Atlantic Canada. Among Liberal/NDP switchers Trudeau is +67. Among Liberal/Conservative switchers he is +43.
Jagmeet Singh enjoys a positive impression among 43% and finds negative impressions among 25% for a net score of +18.
Regionally, Mr. Singh’s net favourables are +31 in BC, +13 in AB, +9 in SK/MB, +33 in Ontario, +3 in Quebec, and +29 in Atlantic Canada. Among Liberal/NDP switchers Singh is +79.
Today 30% have a positive impression of the Conservative leader Erin O’Toole (+1 from last week) while his negatives are at 40% (-2) for a net score of -10, showing another week of gains.
Regionally, Mr. O’Toole’s net favourables are -17 in BC, +8 in AB, +6 in SK/MB, -8 in Ontario, -20 in Quebec, and -14 in Atlantic Canada. Among Liberal/Conservative switchers O’Toole is +48.
In Quebec, BQ Leader Mr. Blanchet is 42% positive and 30% negative (+5) for a net score of +12. In contrast, Mr. Trudeau is 0 and Mr. O’Toole is -20 in Quebec.
In terms of whether people’s views are improving or declining of the three main party leaders, we find Mr. Trudeau has the lowest momentum score while Mr. Singh has the highest.
• Justin Trudeau: 19% (unchanged) say their impressions are improving, 42% (+1) declining, for a momentum score of -23, similar to last week. Among LPC/NDP switchers, his momentum score is +7 and among LPC/CPC switchers it is -19 (a big swing from last week). Among those who voted Liberal in 2019, 22% say their impression of Mr. Trudeau has declined since the start of the campaign.
• Erin O’Toole: 31% say their impressions are improving (unchanged), 25% declining, for a momentum score of +6. Among LPC/CPC switchers, his momentum score is +39 (a marked difference from Mr. Trudeau). Among those who voted CPC in 2019, 6% say their impression of Mr. O’Toole has declined since the start of the campaign. Among 2019 LPC voters, 19% say their impression is improving.
• Jagmeet Singh: 35% (-1) say their impressions are improving, 16% declining (unchanged), and 48% not changing for a momentum score of +19. Among LPC/NDP switchers his momentum score is +55. Among those who voted NDP in 2019, his momentum score is +57.
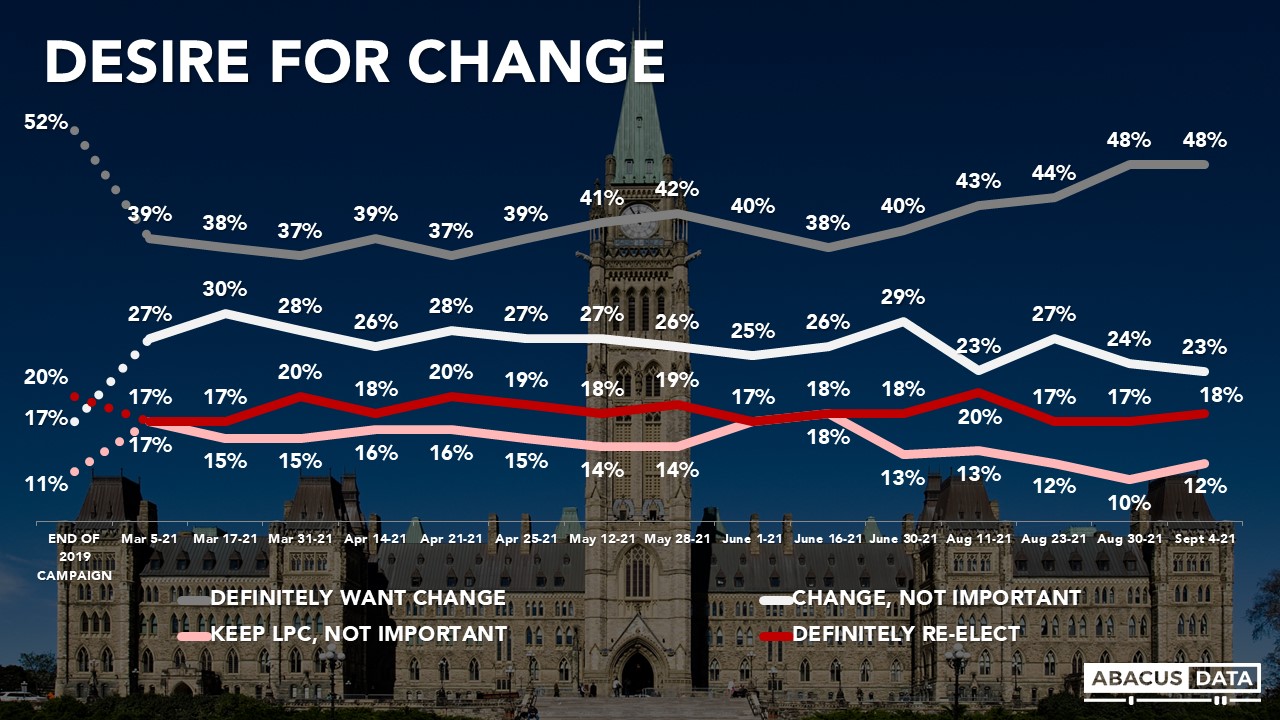
DESIRE FOR CHANGE
The rise in the desire for change we were seeing in previous weeks has halted. Today, 48% definitely want to see a change in government (unchanged from last week) while another 23% say it would be good to have a change, but it is not really that important to them, for a total of 71% who would prefer a change in government. This outlook is almost identical to the feelings we measured in the run up to the 2019 election.
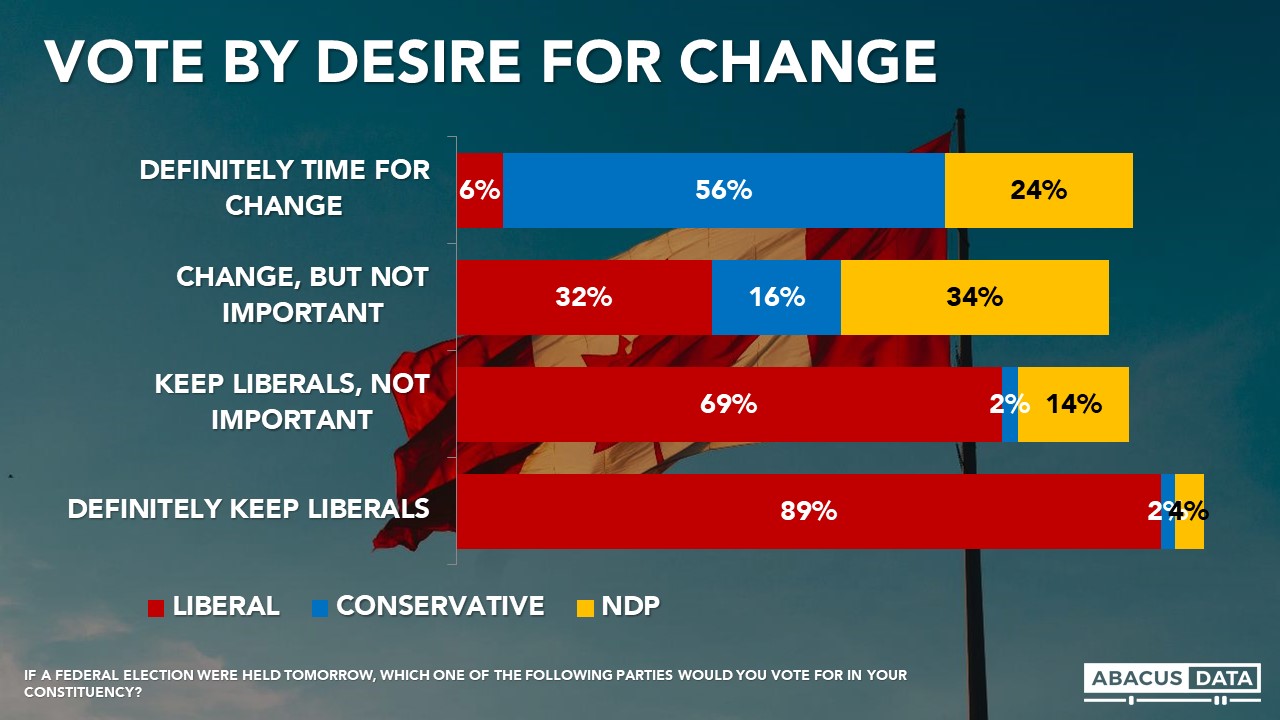
The vote preference by change group is important to understanding the election. Among those who say they want change but it isn’t important (23% of the electorate at the moment), the Liberals and NDP are statistically tied (NDP 34% vs. LPC 32%) with the Conservatives in third. As long as the Liberals can win a large share of this group, they can be re-elected.
But if those in this group migrate up to “definitely want change”, it’s far less likely they will vote Liberal. As perceptions about the competitiveness of the election shift, the split in these groups could also change.
PREFERRED PRIME MINISTER
Today, 36% of voters would prefer Justin Trudeau be PM after the election, 32% would prefer Erin O’Toole, and 25% Jagmeet Singh. This is the exact same split as last week.
In BC, 34% would prefer Singh and 33% Trudeau, followed by O’Toole at 29%. In Ontario, Trudeau is preferred by 37% followed by O’Toole (31%) and Singh (21%). In Quebec, Trudeau is well ahead of O’Toole (42% to 28%) followed by Singh at 21%.
Asked if the choice was only between O’Toole and Trudeau, Trudeau would be the preference of 56% (down 2) and O’Toole 44% (up 2). When asking who they would prefer between Mr. O’Toole and Mr. Singh, the split is almost the same, 55% would prefer Mr. Singh and 45% would prefer Mr. O’Toole.
UPSHOT
According to Bruce Anderson: Today’s results would probably produce a very similar House of Commons to the one which was just dissolved. But it is very unlikely that there will be no movement in the next 16 days as more debates and more advertising kick in. There are two groups to watch in my view.
• The 23% who want change but who don’t feel that strongly about it – if a third of them vote NDP as they currently intend to do, then the Liberals could be defeated by the Conservatives on Election Day.
• The 18% who say they will either vote Liberal or NDP, among whom 45% say they will currently vote NDP, but among whom 98% prefer the Liberals to win over the Conservatives. As three of four NDP voters prefer a Liberal government they likely hold the key to whether the country will elect one on September 20.
The campaign has gone well for Erin O’Toole personally and he has improved his party’s chances. With debates beginning and advertising becoming more plentiful and more pointed, the level of scrutiny about a Conservative victory and what it means will be higher and more persistent, especially as Canadians think it is more possible.
NDP-leaning progressive voters will likely be attentive to what a Conservative government could mean for issues ranging from climate change and pipelines to guns to childcare to health care and vaccinations.
With almost 10 million voters saying their current preference isn’t locked in, the election trajectory is far from certain and the outcome unpredictable.
According to David Coletto: “We continue to see only slight changes in vote intention and impressions on most metrics we track as week three of the campaign comes to a close. The Conservatives and Liberals remain statistically tied although the Conservatives have a slight lead among those most likely to vote. Impressions of the leaders haven’t changed much since last week.
However, we are seeing some important shifts in other perceptions. For example, far more people today believe the Conservatives will win the election. More still think the Liberals will win but the gap has closed substantially over the past three weeks.
The Conservatives are making some gains among Liberal/Conservative switchers, but they haven’t fundamentally altered the electorate. Those open to voting Conservative is stuck at 44%, the same as last week. And so, while the Conservative campaign has been successful in re-engaging its 2019 coalition, I don’t see any evidence yet that it is expanding its audience and building a coalition that can win the election outright.
The Liberal vote share has been stuck in the low 30s now for three straight weeks. Mr. Trudeau’s negatives are rising slowly but importantly for the Liberals, the desire for change has halted its weekly rise in our tracking. Right now, more people still would prefer Mr. Trudeau as prime minister over Mr. O’Toole but that margin has shrunk somewhat from last week.
And finally, while Mr. Singh continues to have the best net impression among the national leaders, the NDP vote is stuck in the low 20s. In fact, it seems to have reversed gains made earlier. There’s still a lot of people who say they are open to voting NDP (48%) but converting them beyond 20-22% seems to be a challenge. The biggest risk for the NDP remains the threat of strategic voting, especially as more and more people come to realize that the Conservatives are able to win the election.
So far, the TVA leaders’ debate doesn’t seem to have fundamentally altered the race in Quebec but we will have more to say on that on Tuesday.”
METHODOLOGY
The survey was conducted with 2,692 Canadian adults eligible to vote from September 1 to 4, 2021. A random sample of panelists were invited to complete the survey from a set of partner panels based on the Lucid exchange platform. These partners are typically double opt-in survey panels, blended to manage out potential skews in the data from a single source.
The margin of error for a comparable probability-based random sample of the same size is +/-1.9%, 19 times out of 20.
The data were weighted according to census data to ensure that the sample matched Canada’s population according to age, gender, educational attainment, and region. Totals may not add up to 100 due to rounding.
We are the only research and strategy firm that helps organizations respond to the disruptive risks and opportunities in a world where demographics and technology are changing more quickly than ever.
We are an innovative, fast-growing public opinion and marketing research consultancy. We use the latest technology, sound science, and deep experience to generate top-flight research-based advice to our clients. We offer global research capacity with a strong focus on customer service, attention to detail and exceptional value.
We were one of the most accurate pollsters conducting research during the 2019 Canadian Election.
Each day during the 2021 Federal Election campaign, researchers at Abacus Data will share insights and analysis from our polling in concise, insights-focused reports. To never miss our polls and analysis, subscribe to our newsletter.
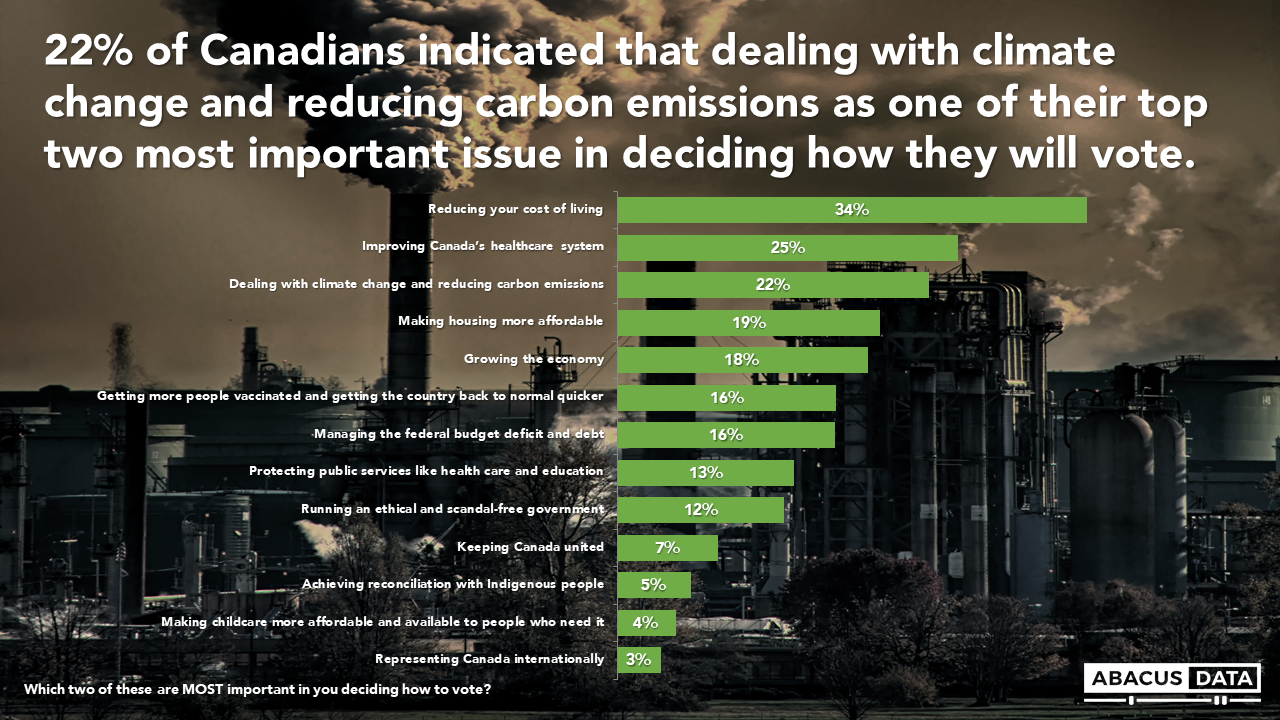
Earlier this week, my colleague Oksana Kishchuck reported on some interesting data about what is driving voters’ decisions. On average, respondents said that more than half of their vote decision would be based on (1) which party was best on the issue they cared most about and (2) whether the party could actually deliver on its plan.
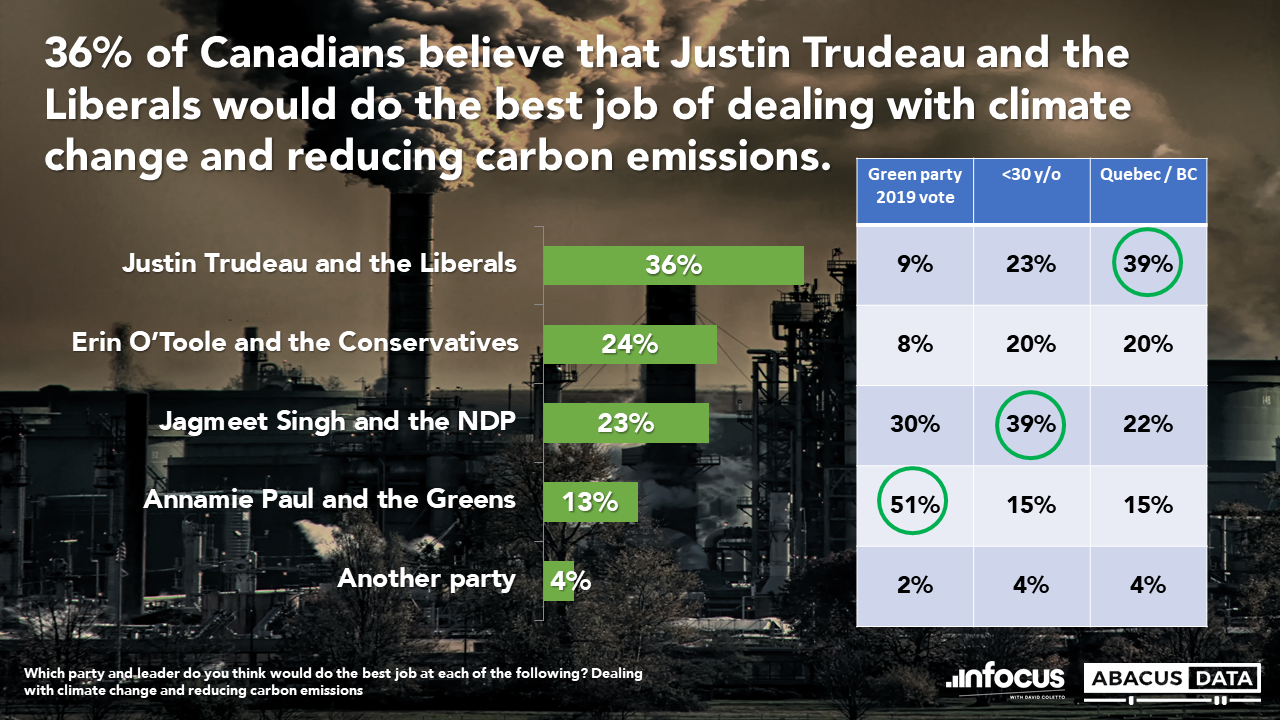
With this in mind, we wanted to explore those who specifically indicated that dealing with climate change and reducing carbon emissions were within their top two issues as they decide on who they will vote for this election. We found that 22% of Canadians are including dealing with climate change and reducing carbon emissions within their top two, just below Improving Canada’s healthcare system (25%) and reducing the cost of living (34%).
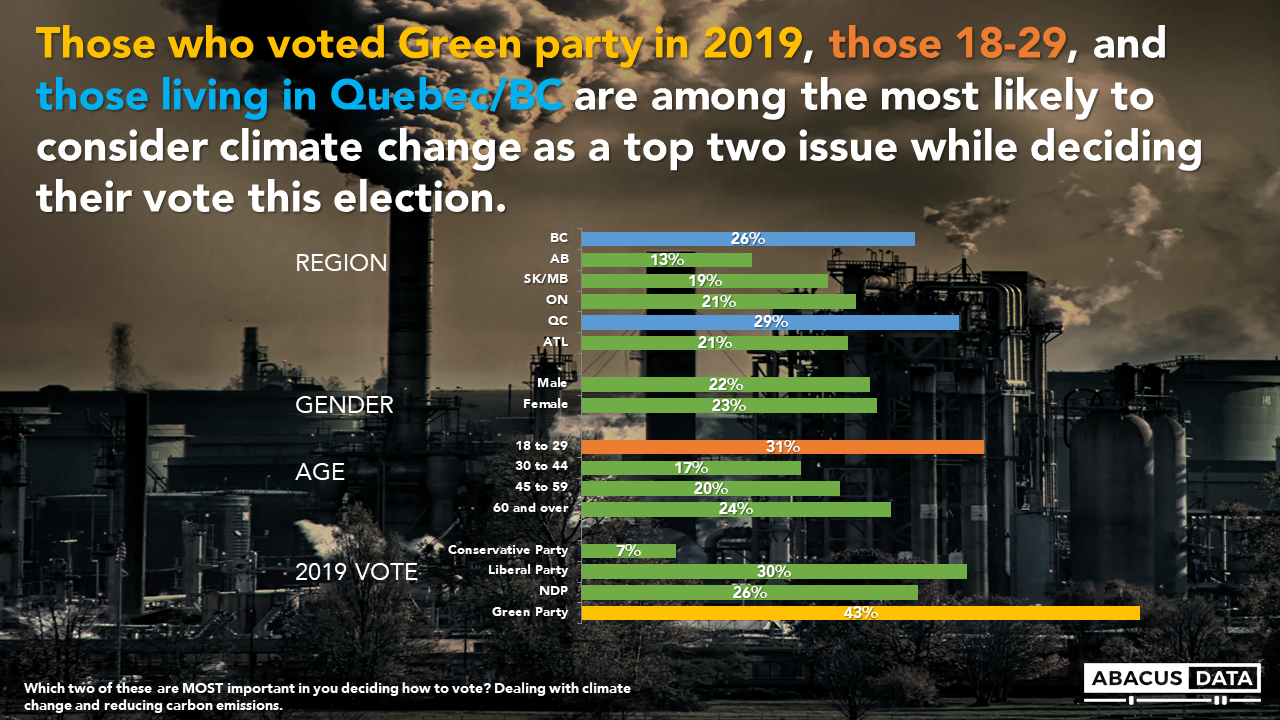
Unsurprisingly, those who voted for the Green Party in the 2019 election are among the most likely to include climate change and carbon emissions in their top two issues this election. Furthermore, those below 30 years of age are far more likely to include this issue in their top two than any other age group. Similarly, BC and Quebec residents are also significantly more likely to hold this issue in their top two than any other region within Canada.
Among the general population, 36% of Canadians believe that the party and leader who would best deal with climate change and reducing carbon emissions is Justin Trudeau and the Liberals. However, there are some stark differences when this is compared among those most likely to include it in their top issues (and therefore also the most likely to vote for a party in line with these issues). Among those younger than 30, Jagmeet Singh and the NDP are seen as the best for the job. However, among Quebec and BC residents, Justin Trudeau and the Liberals remain their top choice. Unsurprisingly, previous Green Party supporters believe Annamie Paul and the Green Party to be the best for the job.
THE UPSHOT
According to Michael Monopoli: Voters are paying attention to how parties are aligning themselves with the many key issues that are driving this election. When it comes to dealing with climate change and reducing carbon emissions, there are a few key demographic groups that value this issue significantly more than others. Those who voted for the green party in 2019, those under 30 years of age, and residents of BC and Quebec are among the most likely to include Climate change and the environment in their top two.
Focusing in on those who are most likely to include it in their top two, there is very little agreement on who would be best suited for the job. Previous Green Party supporters, unsurprisingly, would prefer Annamie Paul and the Green Party, but those under 30 would prefer Jagmeet Singh and the NDP and those in Quebec and BC would prefer Justin Trudeau and the Liberals. This goes to show that no one party or leader is dominating within the topic of climate change and reducing carbon emissions.
METHODOLOGY
Our survey was conducted online with 2000 Canadians aged 18 and over from August 24 to 29, 2021. A random sample of panellists was invited to complete the survey from a set of partner panels based on the Lucid exchange platform. These partners are double opt-in survey panels, blended to manage out potential skews in the data from a single source.
The margin of error for a comparable probability-based random sample of the same size is +/- 2.2%, 19 times out of 20. In Canada the data were weighted according to census data to ensure that the sample matched Canada’s population according to age, gender, educational attainment, and region.
The data were weighted according to census data to ensure that the sample matched Canada’s population according to age, gender, educational attainment, and region. Totals may not add up to 100 due to rounding.
We are the only research and strategy firm that helps organizations respond to the disruptive risks and opportunities in a world where demographics and technology are changing more quickly than ever.
We are an innovative, fast-growing public opinion and marketing research consultancy. We use the latest technology, sound science, and deep experience to generate top-flight research-based advice to our clients. We offer global research capacity with a strong focus on customer service, attention to detail and exceptional value.
We were one of the most accurate pollsters conducting research during the 2019 Canadian Election.
Each day during the 2021 Federal Election campaign, researchers at Abacus Data will share insights and analysis from our polling in concise, insights-focused reports. To never miss our polls and analysis, subscribe to our newsletter.
The Liberal government launch of $10 a day childcare through funding agreements with the provinces is the first new social program in some time. In fact, our polling at the time indicated that the childcare program was the most recalled budget item. The program would presumably benefit current and future young families and ultimately all Canadians by reducing the barriers to full employment among those who want to be engaged in the workforce. So, it is worth exploring how the issue has impacted the campaign.
The first thing that is notable is that the “Making childcare more affordable and available to people who need it” is of relatively low importance. Just 4% choose childcare as a top 2 issue from a list of policy areas.
Young people (under 30 years of age) are only somewhat more likely to say affordable childcare (8%) is a top issue. It is the one of the top issues of importance for 14% of those with children under 5 years of age. But even among those with young children, reducing the cost of living (37%), making housing more affordable (27%), improving the health care system (24%) and growing the economy (18%) are more likely to be selected as a top issue.
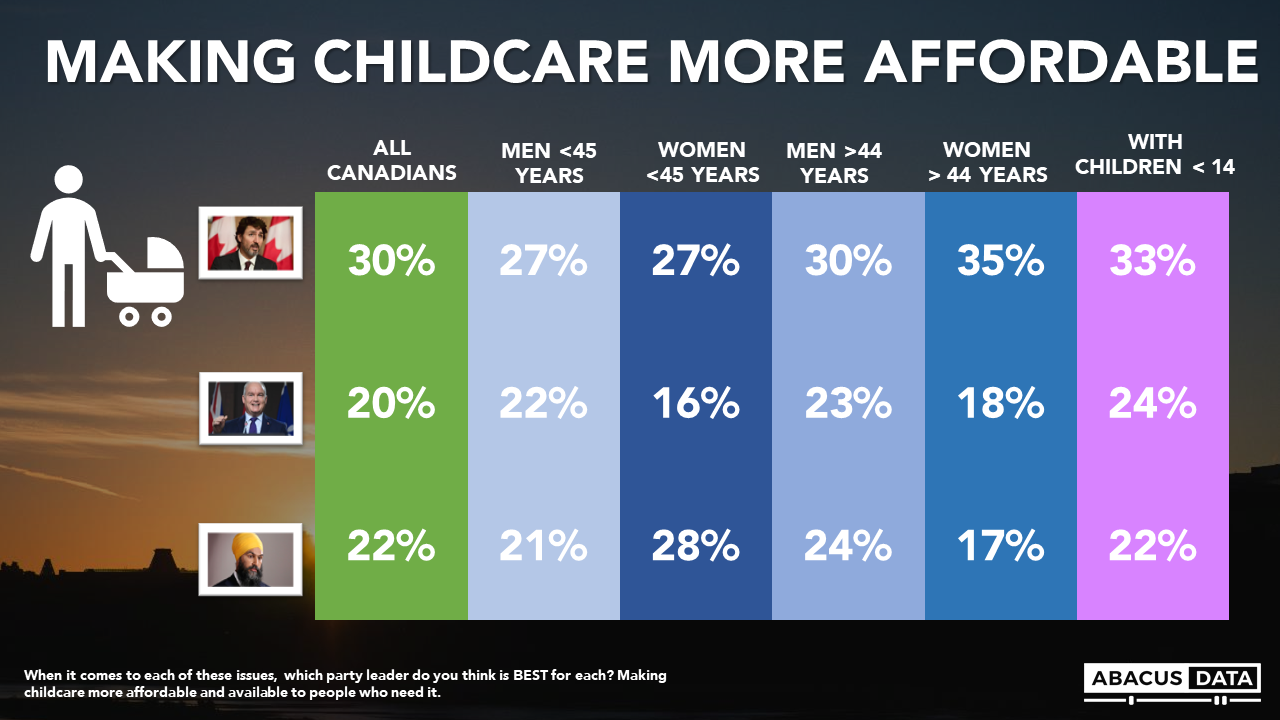
When it comes to the parties and their leaders, Canadians give Trudeau and the Liberal Party the edge on the question of who would be best at making childcare more affordable and available for those who need it. O’Toole and Singh are basically tied.
It is striking though that the Liberal Party does not have a bigger advantage among young people or those with children. In fact, Singh and the NDP are tied with the Trudeau and the LPC among women under 45 years of age and the Liberal edge among men under 45 is smaller than for Canadians as a whole. Younger women differ from their older counterparts in leaning more to Singh and less to Trudeau. The Liberal Party edge over the Conservative Party is also narrow among those with children under 14 right now.
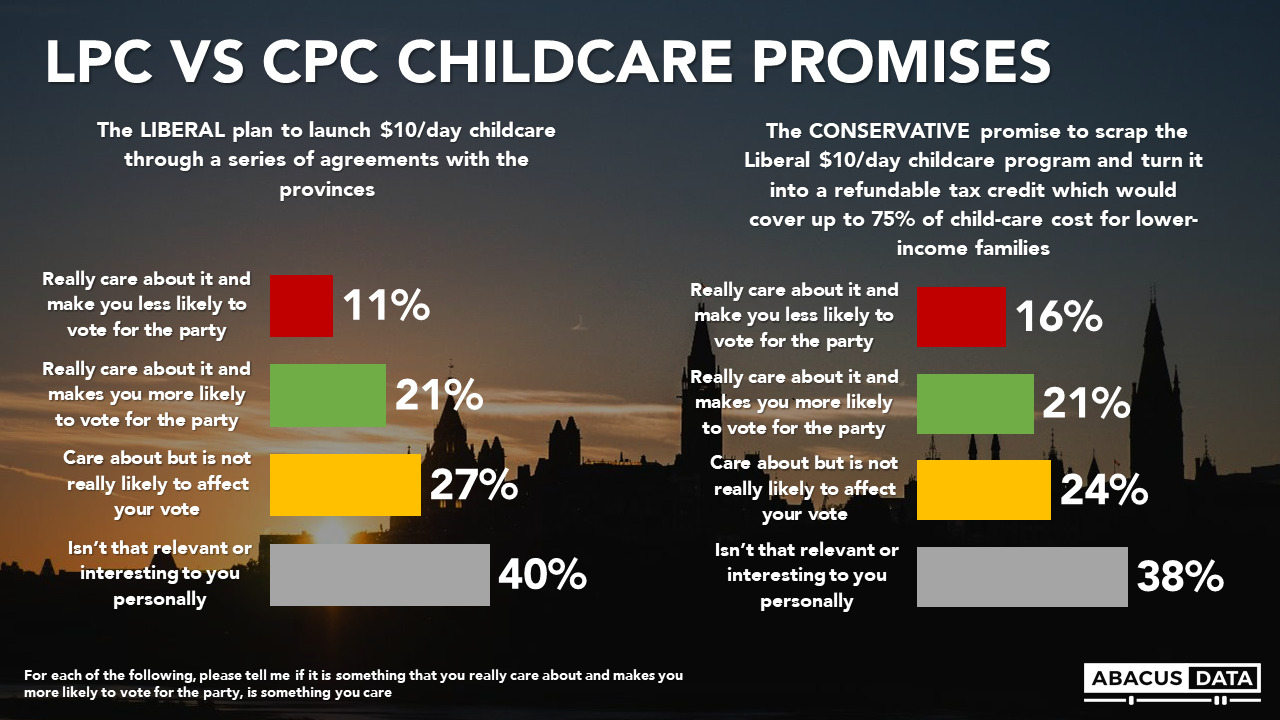
While O’Toole and the Conservative Party trail Trudeau on the question of who would be best on the issue, an analysis of their competing childcare proposal highlights how close the parties are on the issue from a voter perspective. The Liberal and Conservative plans for childcare have the same proportion of voters who think that they care about it and are more likely to vote for the party because of it. The Conservative Plan has more people who would vote against the party because of their proposal but it is a modest difference.
The two plans are also evaluated very similarly by those who have children under 14 years of age. Among those under 45 years of age, gender does not make a large difference in being motivated by either plan. Men under 45 are slightly more likely to be motivated by the Conservative Plan. The gender-age gap is more pronounced among older Canadians as women 45 years and older are much less likely to be motivated to vote Conservative by the tax credit promise.
THE UPSHOT
According to Richard Jenkins: The Liberal childcare proposal accomplishes one important thing for the party in the election, which is to establish its social conscience and progressive orientation. The electorate overall thinks the Liberals would be the best on childcare so staking out a position on the issue is on brand and aligns with voter expectations.
The challenge is that few voters are telling us that this is the issue that will define the election for them. And, perhaps surprisingly, the Conservative proposal on the issue performs quite well even among young Canadians. And it is young voters and young families in particular that the Liberals may need to secure their re-election.
METHODOLOGY
Our survey was conducted online with 2000 Canadians aged 18 and over from August 24 to 29, 2021. A random sample of panellists was invited to complete the survey from a set of partner panels based on the Lucid exchange platform. These partners are double opt-in survey panels, blended to manage out potential skews in the data from a single source.
The margin of error for a comparable probability-based random sample of the same size is +/- 2.2%, 19 times out of 20. In Canada the data were weighted according to census data to ensure that the sample matched Canada’s population according to age, gender, educational attainment, and region.
The data were weighted according to census data to ensure that the sample matched Canada’s population according to age, gender, educational attainment, and region. Totals may not add up to 100 due to rounding.
We are the only research and strategy firm that helps organizations respond to the disruptive risks and opportunities in a world where demographics and technology are changing more quickly than ever.
We are an innovative, fast-growing public opinion and marketing research consultancy. We use the latest technology, sound science, and deep experience to generate top-flight research-based advice to our clients. We offer global research capacity with a strong focus on customer service, attention to detail and exceptional value.
We were one of the most accurate pollsters conducting research during the 2019 Canadian Election.
Each day during the 2021 Federal Election campaign, researchers at Abacus Data will share insights and analysis from our polling in concise, insights-focused reports. To never miss our polls and analysis, subscribe to our newsletter.
Elections can often come down to voters choosing the party or leader best able to handle the issue they care most about it. This is the basis of the Valence Politics model that Canadian political scientist Harold Clarke and his co-researchers have been using for years to explain voting behaviour.
Yesterday, my colleague Oksana Kishchuck reported on some interesting data about what is driving voters’ decisions. On average, respondents said that more than half of their vote decision would be based on (1) which party was best on the issue they cared most about and (2) whether the party could actually deliver on its plan.
In our first two in-depth election surveys, we asked respondents two questions:
1. Which party and leader do you think would do the best job at each of the following issues?
2. Which two of these are most important in you deciding how to vote?
We will continue to track these two questions over the campaign and in our post-election survey, but here’s a quick snapshot of what we are seeing as week 2 of the campaign ended.
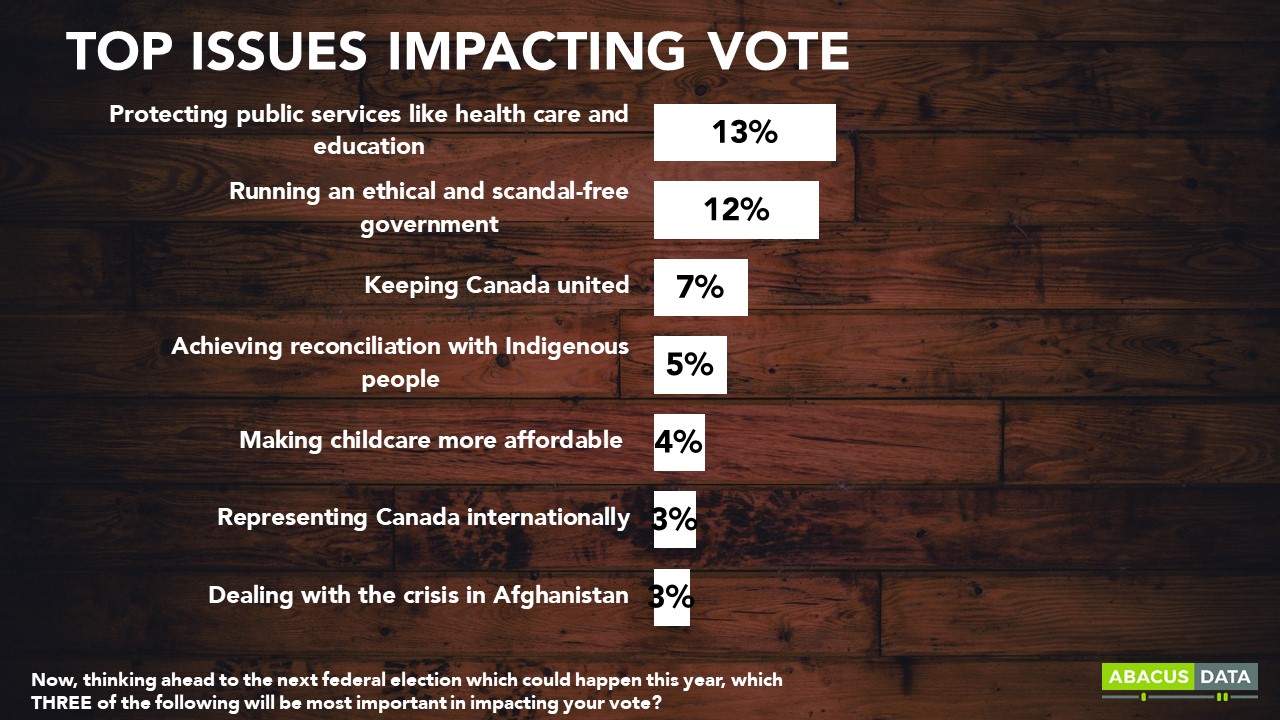
ISSUE SALIENCE
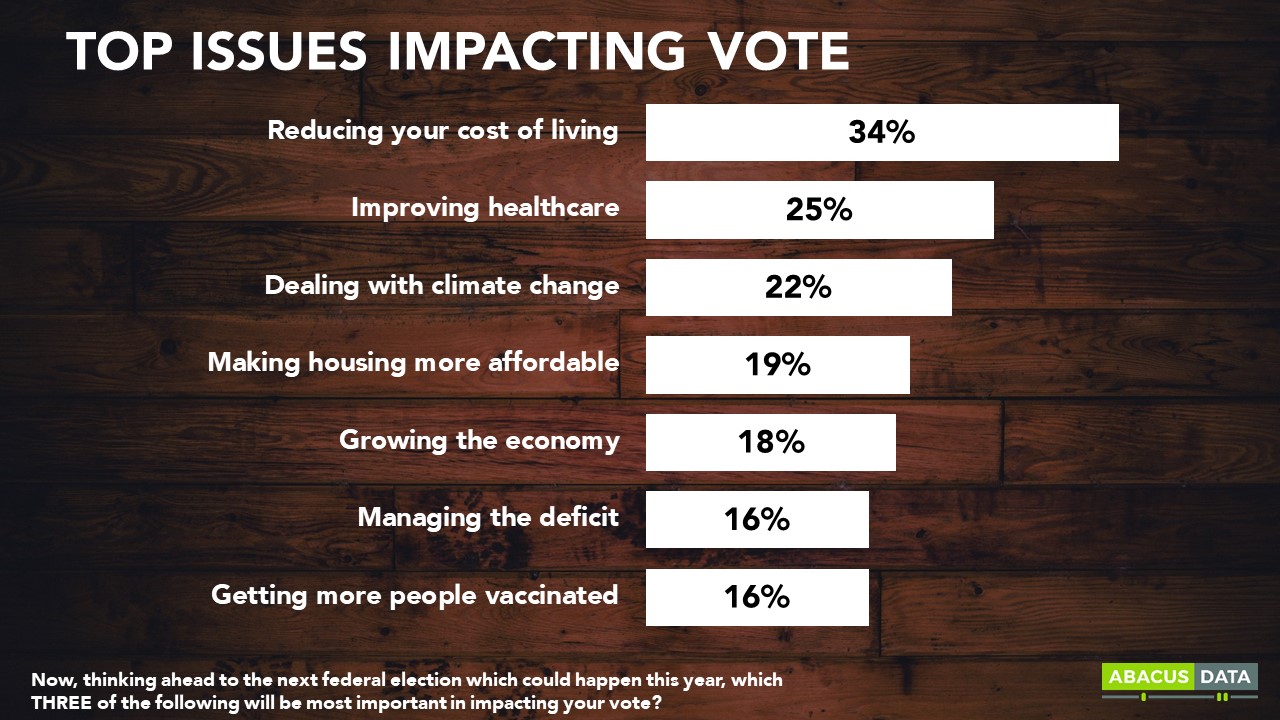
As we have reported in earlier bulletins, the top issues in this campaign for voters are the cost of living, healthcare, climate change, and housing. The economy, the deficit, and getting more people vaccinated round up the top 7.
Reducing the cost of living was more likely to be a top issue for those aged 30 to 59 but crossed the political spectrum with at least 30% of Liberal (30%), Conservative (34%), and NDP (33%) supporters putting it in their top 2 issues.
Climate change was a more important issue for those under 30 (31%) than those older (20%). NDP (30%) and Liberal (28%) supporters were far more likely to rate it as a top issue than Conservative supporters (8%)
Healthcare was a more important issue to those over 60 (30%) than those under 30 (16%) but was about equal across the political spectrum: Liberal 27%, Conservative 23%, NDP 23%.
Housing affordability was more important to those under 30 (28%) than those 60 and over (11%). NDP supporters (28%) and Liberal supporters (20%) were more likely to rate it as a top issue than Conservative supporters (13%).
Further down on the list of issues were protecting public services, running an ethical government, Indigenous reconciliation, and making childcare more affordable. Only 3% said that dealing with the crisis in Afghanistan would be a top 2 issue determining their vote.
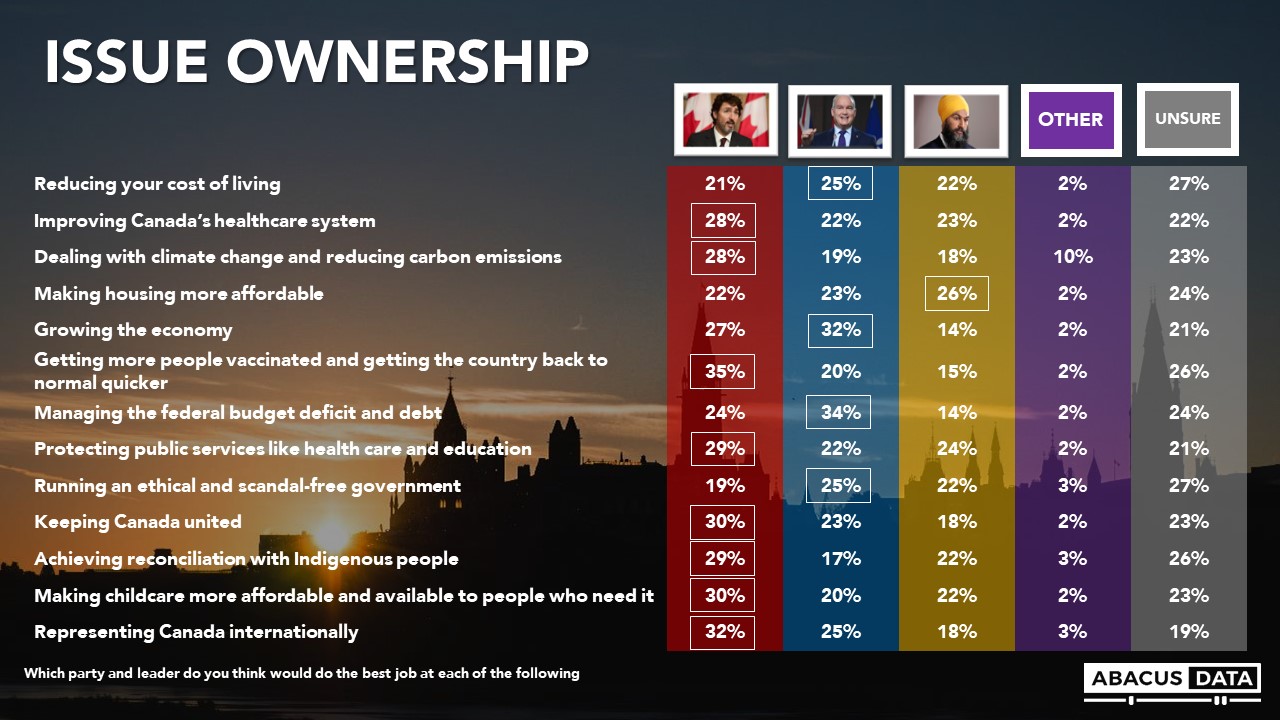
ISSUE OWNERSHIP
So which party and leader are doing best on these same issues?
Mr. Trudeau and the Liberals have a lead on: healthcare, climate change, getting people vaccinated, protecting public services, keeping Canada united, Indigenous reconciliation, childcare, and international representation.
Mr. O’Toole and the Conservatives lead on: reducing the cost of living, growing the economy, managing the deficit, and running an ethical government.
Mr. Singh and the NDP lead on a single item: making housing more affordable.
But a deeper look shows that on the five top issues, the margins between the parties on a few are very close.
For example, on reducing the cost of living, there’s only a 4-point gap separating the three parties and 27% say they are unsure. On improving the healthcare system, Mr. Trudeau is ahead, but only by 5-points over the NDP and 6-points over Mr. O’Toole.
On housing affordability, the NDP leads by the narrowest of 3-points ahead of Mr. O’Toole and Mr. Trudeau.
In contrast, Mr. Trudeau has a pretty big lead on climate change (28% to 19% over Mr. O’Toole) and on getting people vaccinated (35% to 20%).
Since the campaign started, perceptions on issue ownership haven’t changed too much. Mr. O’Toole has made gains almost uniformly across the board, while Mr. Trudeau has seen a small increase in his handling of healthcare and protecting public services. These two issues have been part of the conversation last week in the campaign.
THE UPSHOT
So far, the campaign hasn’t fundamentally changed how voters see the parties handling the main issues or which issues are more salient. The Conservatives and Erin O’Toole have made some progress across the board which is likely a reflection of the improvement in the Conservative vote share and Mr. O’Toole’s personal numbers as well.
The leaders’ debates next week may help clarify some of these questions for voters but given how close the race is right now, gaining even a small advantage on the key issues may be determinative.
This data also shows that the Liberals will want to frame the final two weeks of the campaign as much around climate change, healthcare, and protecting public services. The Conservatives, as they have already done, will want to focus on the economy and reducing the cost of living while the New Democrats should continue to press on housing affordability while also defending against strategic voting tied to worries about healthcare, social issues, and climate change.
METHODOLOGY
Our survey was conducted online with 2000 Canadians eligible to vote from August 24 to 29, 2021. A random sample of panellists was invited to complete the survey from a set of partner panels based on the Lucid exchange platform. These partners are double opt-in survey panels, blended to manage out potential skews in the data from a single source.
The margin of error for a comparable probability-based random sample of the same size is +/- 2.2%, 19 times out of 20. The data were weighted according to census data to ensure that the sample matched Canada’s population according to age, gender, educational attainment, and region.
We are the only research and strategy firm that helps organizations respond to the disruptive risks and opportunities in a world where demographics and technology are changing more quickly than ever.
We are an innovative, fast-growing public opinion and marketing research consultancy. We use the latest technology, sound science, and deep experience to generate top-flight research-based advice to our clients. We offer global research capacity with a strong focus on customer service, attention to detail and exceptional value.
We were one of the most accurate pollsters conducting research during the 2019 Canadian Election.