Abacus Election Bulletin: Which online sources are we using to learn about the federal election?
Each day during the 2021 Federal Election campaign, researchers at Abacus Data will share insights and analysis from our polling in concise, insights-focused reports. To never miss our polls and analysis, subscribe to our newsletter.
In a federal election, the messaging and tone a political party chooses to use is important. It’s a way to curate a brand or image about their platform to voters and tell their story. It also presents current events in their own narrative. But during a federal election campaign messaging from political parties isn’t the only messaging that voters see.
In an age where many of us are staying up to date about the campaign by going online, there are a variety of sources that are talking about the election. These sources create their own narrative, tone and messaging too.
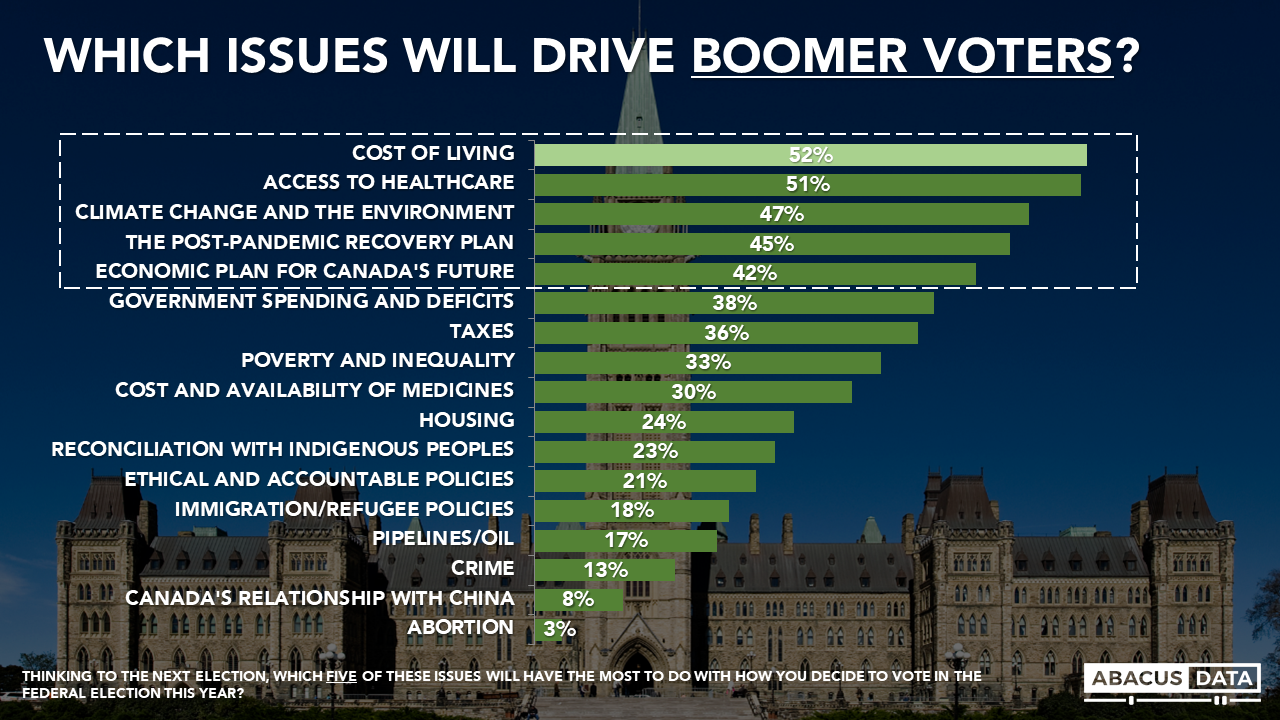
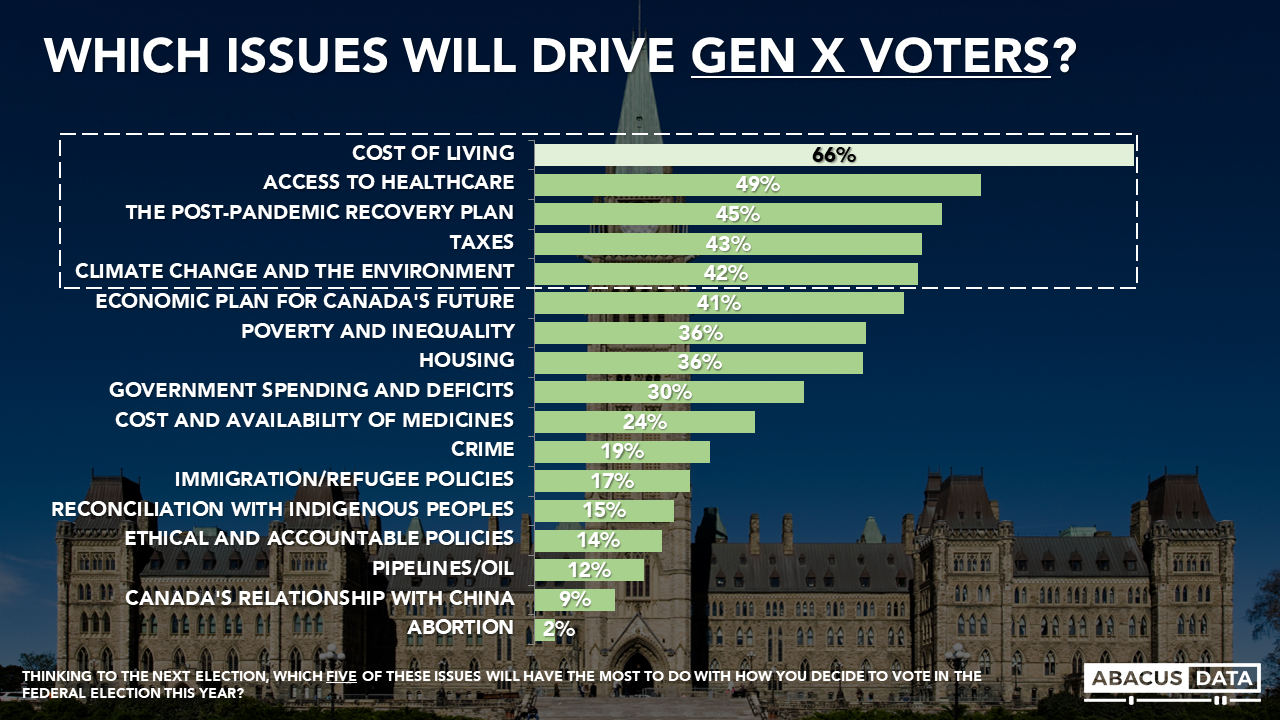
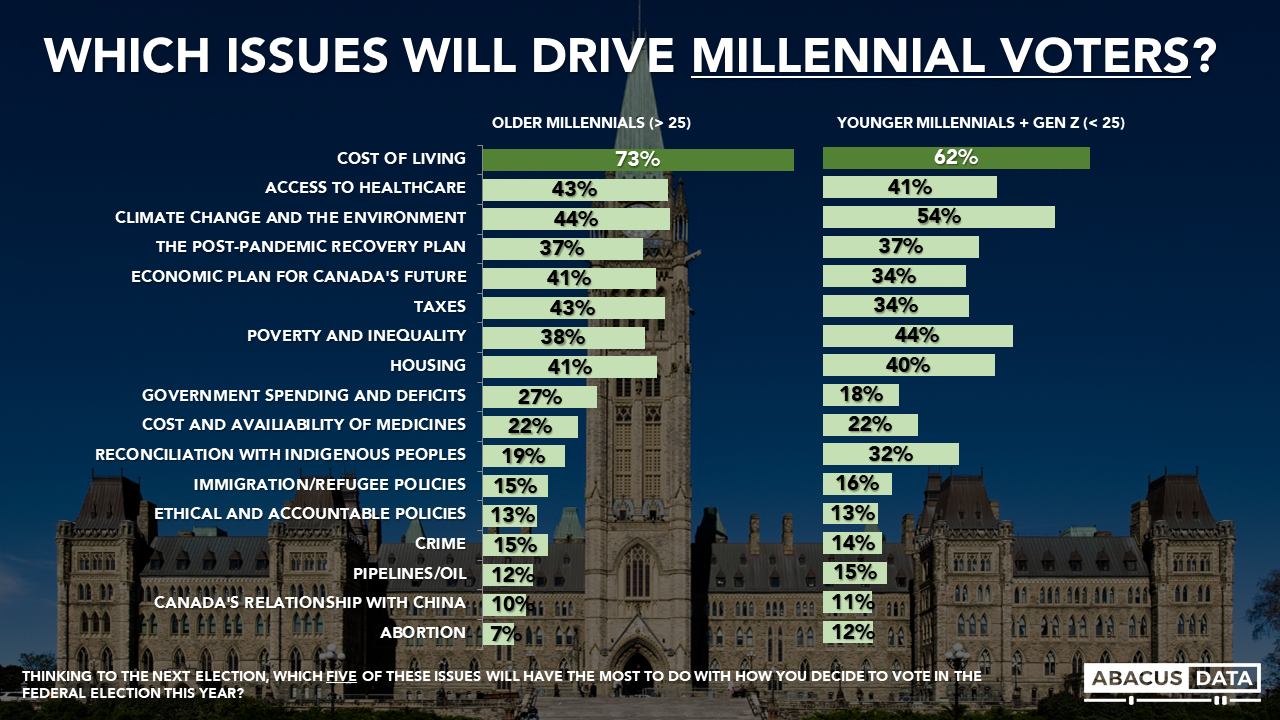
Prior to the election we’ve done extensive research on which online channels people choose to use, including millennials but during this federal election I was also interested in the source. What type of online sources are CPC voters looking at vs NDP? And are younger and older voters looking at content from the same source as well.
To learn what sources voters are getting their online content from we asked the following question: Regardless of the channel (social media, email, website) what % of the online content you’ve consumed about the upcoming federal election so far comes from the following types of sources? Think about the original source of the information, rather than who shared it.
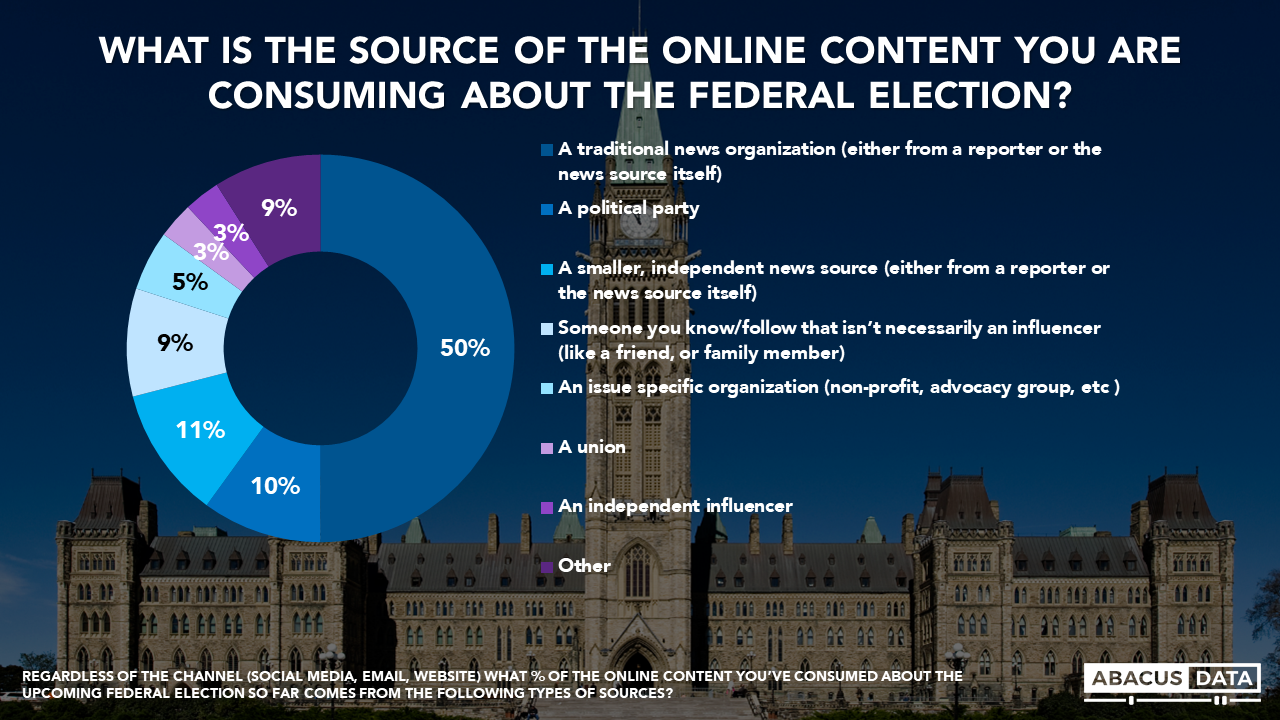
To start, the average voter is consuming half of their online federal election information from a traditional news organization as the original source. This number is high, but perhaps not that surprising as this could include content directly from the organization or seeing an article that a friend shared.
It is a good reminder however about the importance of how political parties and their leaders are performing in the media. If half of the federal election content the average voter reads is coming from traditional news sources, their frame and narrative is likely going to have an impact on voter perceptions.
Another important number to note is that only a tenth (10%) of the content voters see originates from the political party itself. This isn’t to say the party narrative isn’t important- content from this source likely does a great deal to shape the content Canadians are seeing from news organizations, big and small. But what it does show is that the media may be just as an important audience for political party content than the public itself.
And finally, I also think it’s worth noting that original content from someone like a friend or family member also represents just under a tenth (9%) of the content we are seeing online.
What about the content that different voters are seeing? It turns out that there are very little differences between the type of sources that CPC voters are seeing vs. LPC voters vs. NDP voters.
Though now seems like a good time to point out that we didn’t test which friends or which news organizations Canadians see. It’s very likely that the smaller, independent media sources seen by NDP voters, may be quite different that the smaller, independent media sources seen by CPC voters.
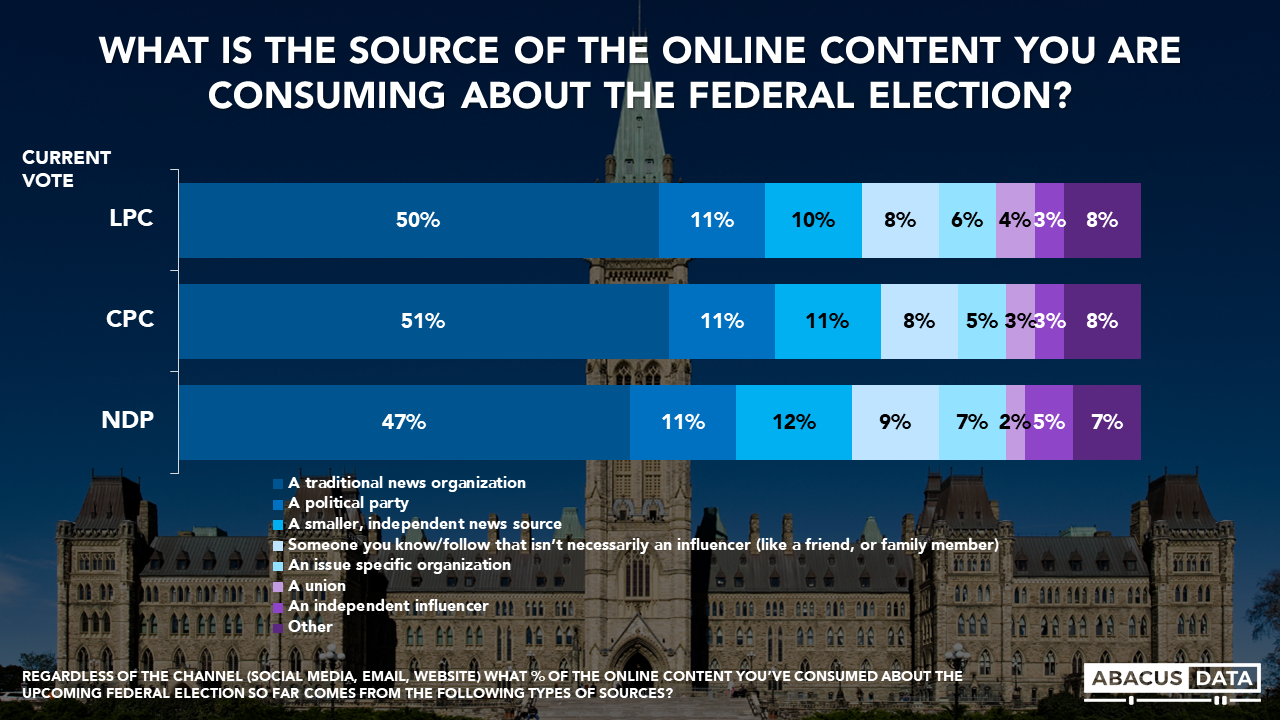
Where things do get more interesting is looking beyond the main ‘big tent’ parties, and at those who would consider voting for another party like the PPC or in Quebec, the Bloc.
Among those that would consider voting PPC, they are relying a lot less on traditional media (38%), and a lot more on content coming from political parties directly (13%) or smaller, independent news sources (16%).
The demographic split that does show a lot of difference in source is generation.
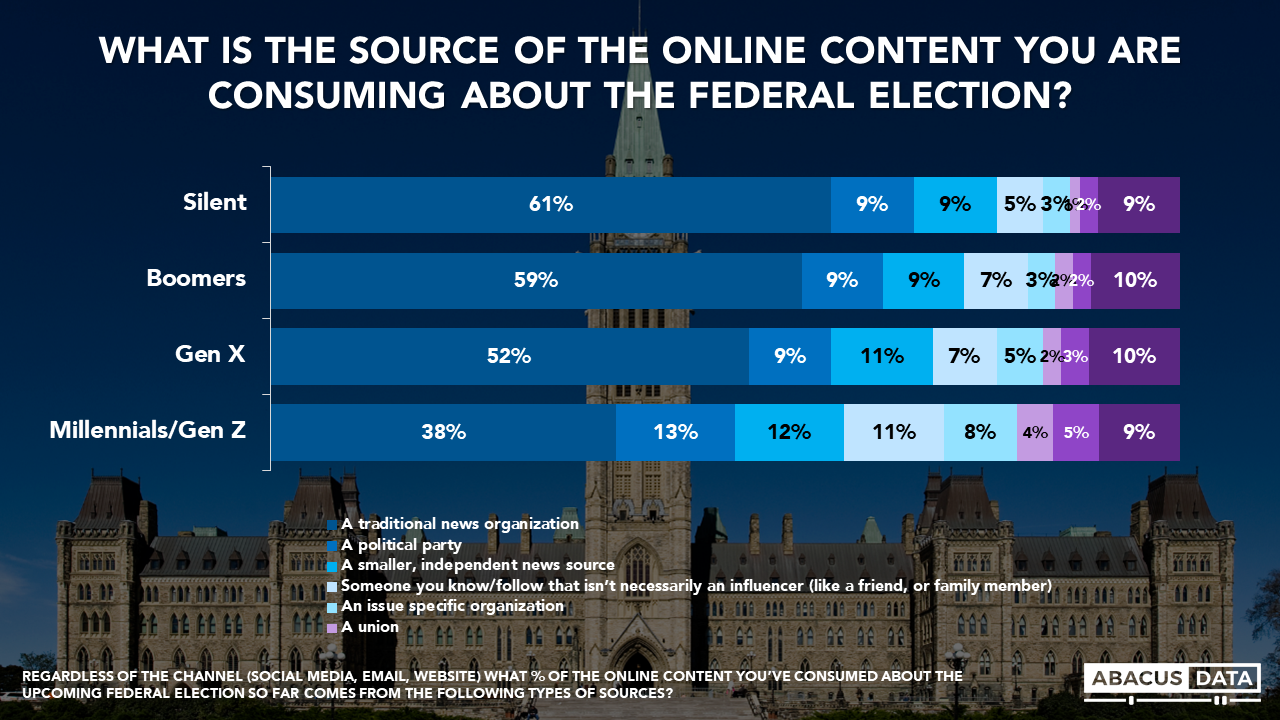
Those in the silent and boomer generations are getting over half of their information from traditional news organization (again, likely not all the same specific source but traditional news organizations generally). And millennials and Gen Z are relying on traditional news organizations a lot less- it represents just over a third of the online content they are consuming.
Instead, this is redistributed fairly evenly to other sources like political parties, someone they know, and issue specific organizations.
The different use of traditional media between millennials/Gen Z and nearly all other generations is important. It means that the narratives about the election and the way millennials think things are going could be very different than the perceptions older generations have. If young people are looking at different critiques and praises of the political parties, it could lead to different perceptions about how leaders are handling issues, or even who they decide to support when it comes time to vote.
THE UPSHOT According to Oksana Kishchuk:
During a campaign, messaging and narrative matter. Political parties can control their own, and do their best to shape others, but their narrative isn’t the only one that Canadians will be hearing this election. Instead, the average Canadian is relying on the narrative provided by traditional news organizations for half the content they are consuming about this election.
The reliance on sources other than traditional media for millennials/Gen Z is important too. Not only are their top issues different than older generations, but the narratives they are hearing are different too.
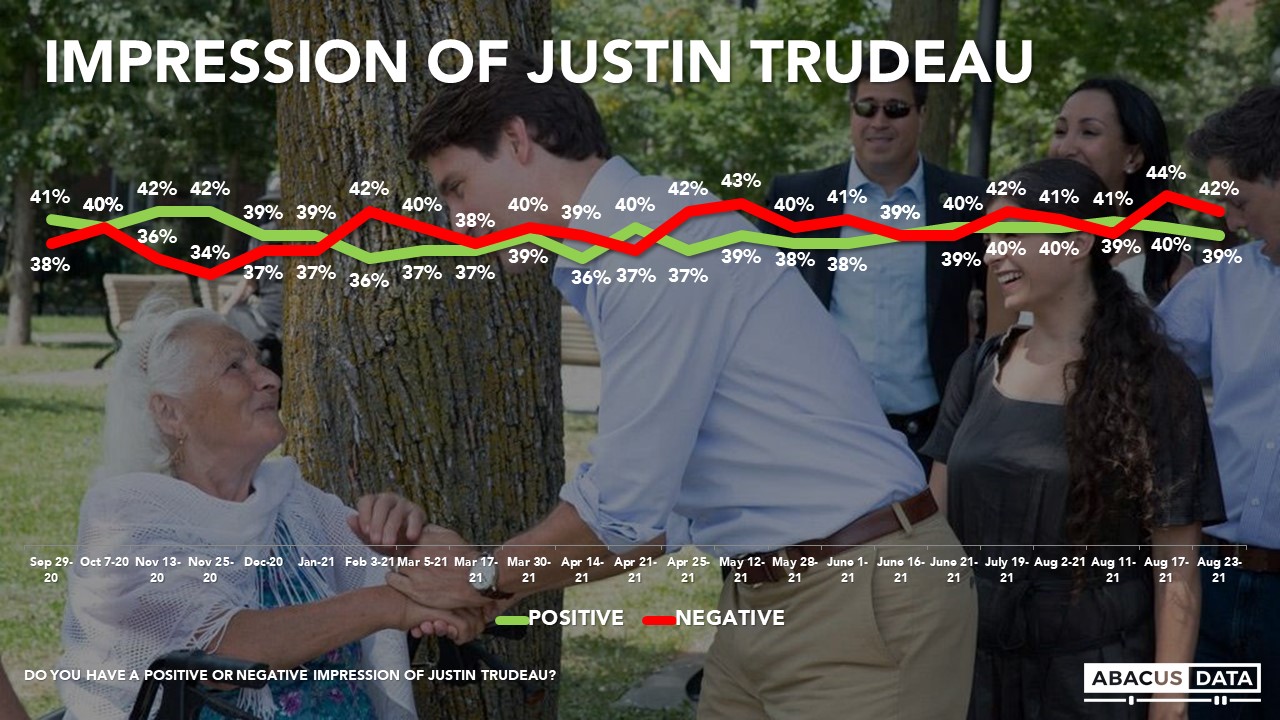
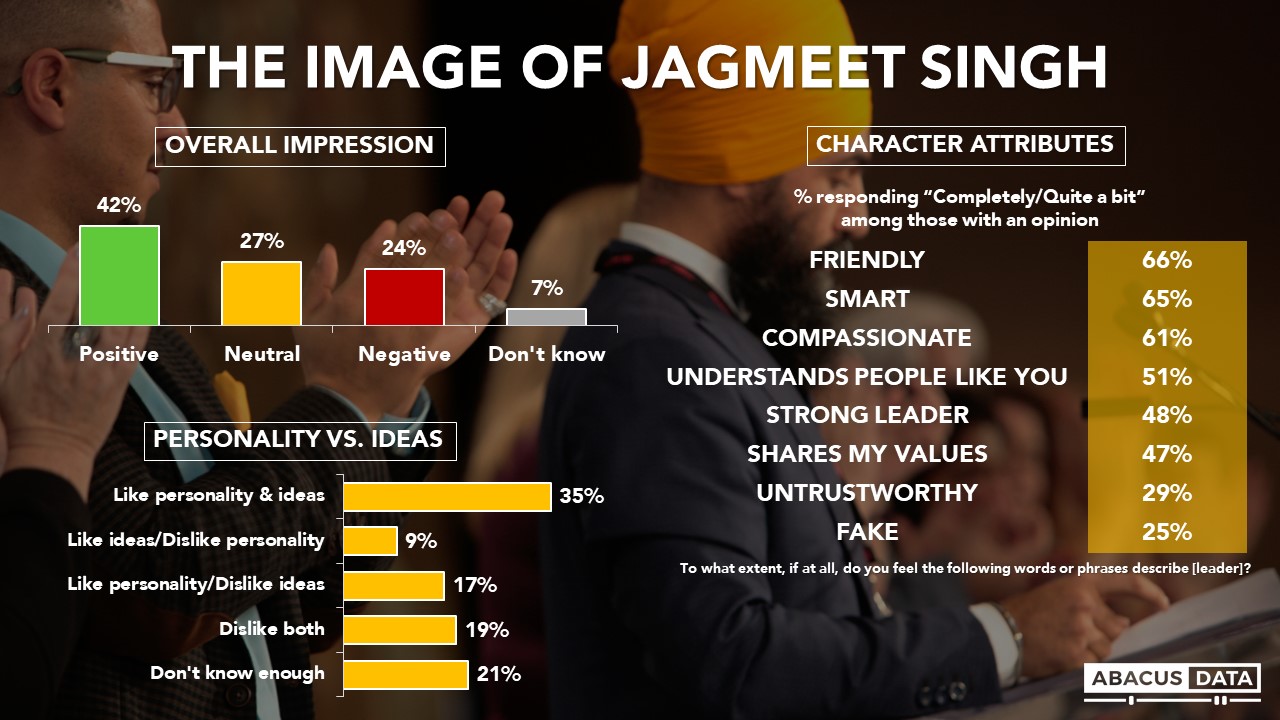
As the election continues on I will be interested in watching whether these different sources begin to show divisions between older and younger voters. Will impressions of Singh surge among young voters based on some engaging content he posts for his younger Instagram audience, but stay consistent among older voters who aren’t as likely to follow party’s or politicians? Or will older and younger voters have different perceptions about the events unfolding in Afghanistan as boomers turn to the reporting by traditional media and millennials/Gen Z read reports from humanitarian organizations instead?
METHODOLOGY
The data in this report come from a national survey of 2,000 Canadian adults eligible to vote from August 17 to 22, 2021. A random sample of panellists was invited to complete the survey from a set of partner panels based on the Lucid exchange platform. These partners are double opt-in survey panels, blended to manage out potential skews in the data from a single source.
The margin of error for a comparable probability-based random sample of the same size is +/- 2.2% 19 times out of 20, respectively. The data were weighted according to census data to ensure that the sample matched Canada’s population according to age, gender, educational attainment, and region.
The survey was paid for by Abacus Data Inc.
Abacus Data follows the CRIC Public Opinion Research Standards and Disclosure Requirements that can be found here: https://

[sc name=”signup”]
ABOUT ABACUS DATA
We are the only research and strategy firm that helps organizations respond to the disruptive risks and opportunities in a world where demographics and technology are changing more quickly than ever.
Find out more about what we are doing to help clients respond to the COVID-19 pandemic.
We are an innovative, fast-growing public opinion and marketing research consultancy. We use the latest technology, sound science, and deep experience to generate top-flight research-based advice to our clients. We offer global research capacity with a strong focus on customer service, attention to detail and exceptional value.
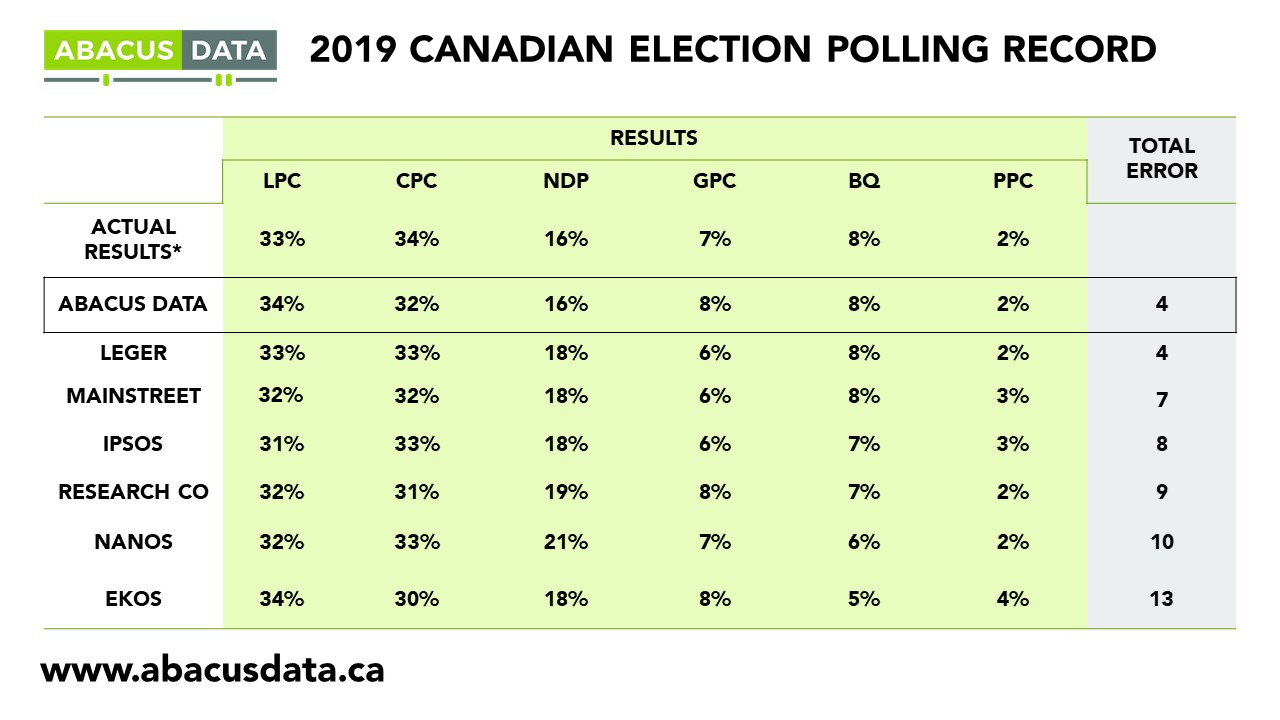
We were one of the most accurate pollsters conducting research during the 2019 Canadian Election.
Contact us with any questions.
Find out more about how we can help your organization by downloading our corporate profile and service offering.
[sc name=”signup”]