Liberals and Conservatives neck and neck again
Don’t miss David’s interview with Canada’s Chief Statistician and head of Statistics Canada on inFocus with David Coletto
We just completed a national survey of 1,500 Canadian adults (from May 7 to 12, 2021). Here’s what the survey found:
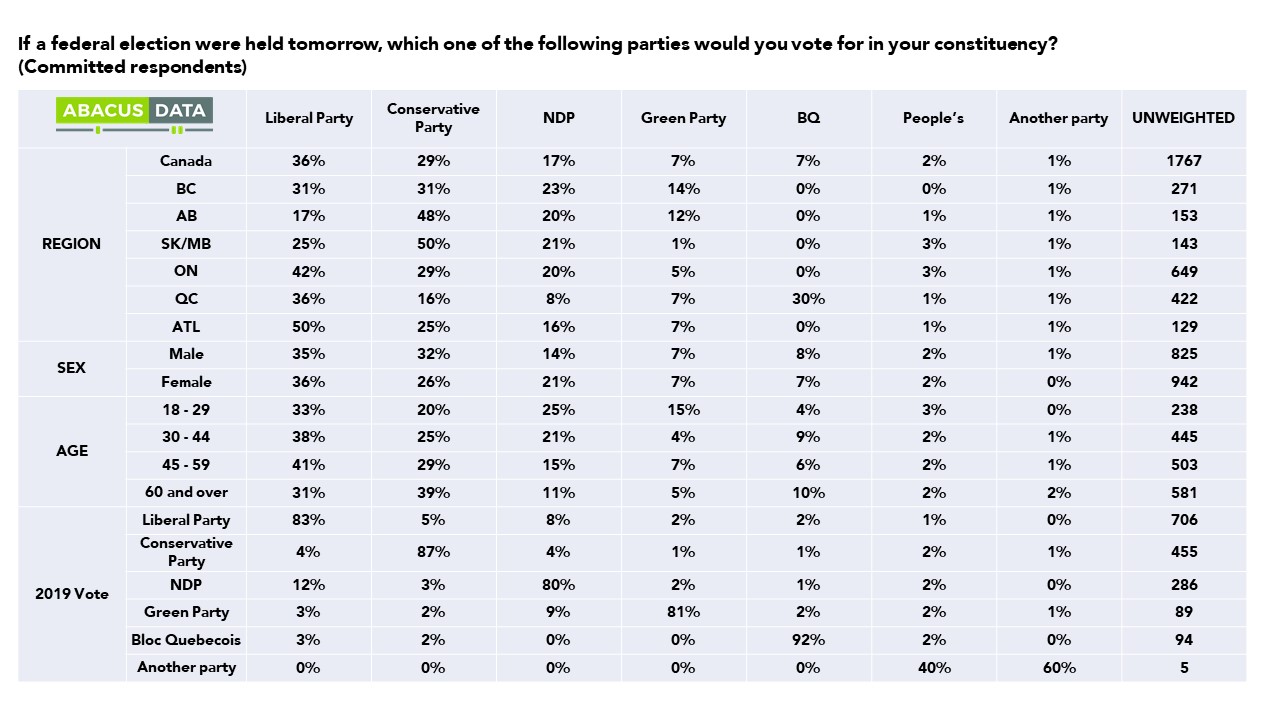
CURRENT VOTING INTENTION
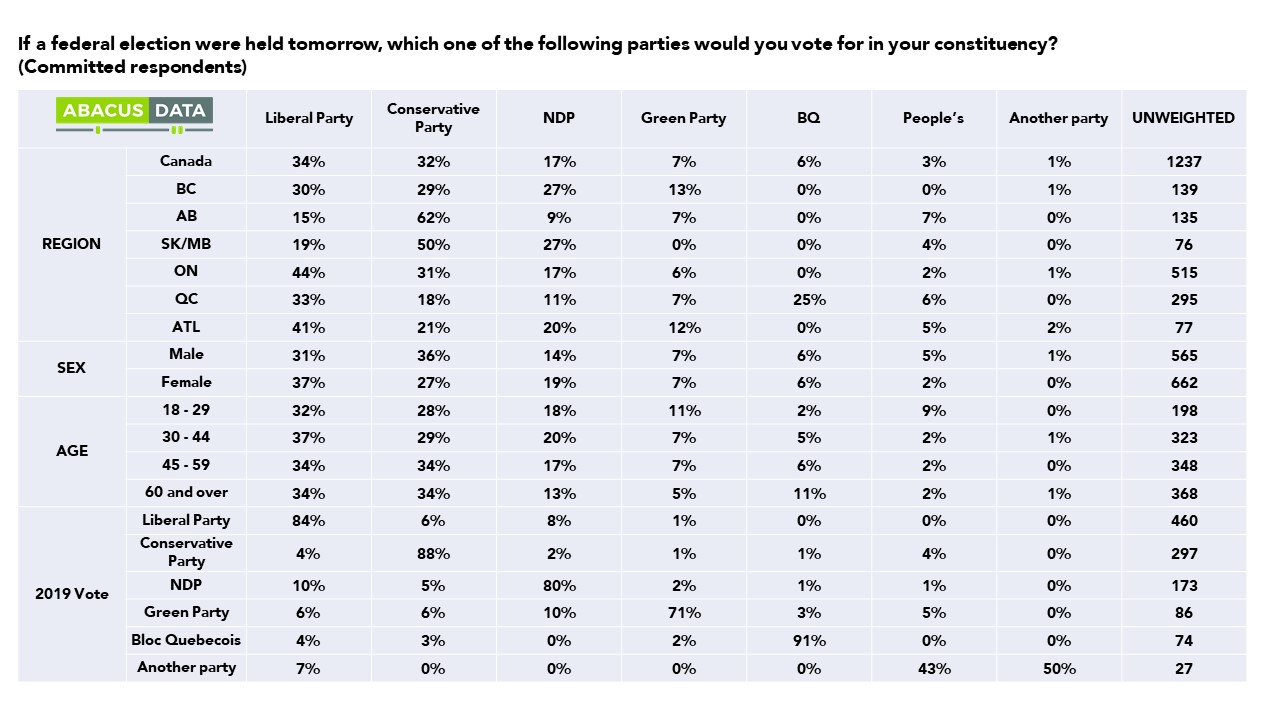
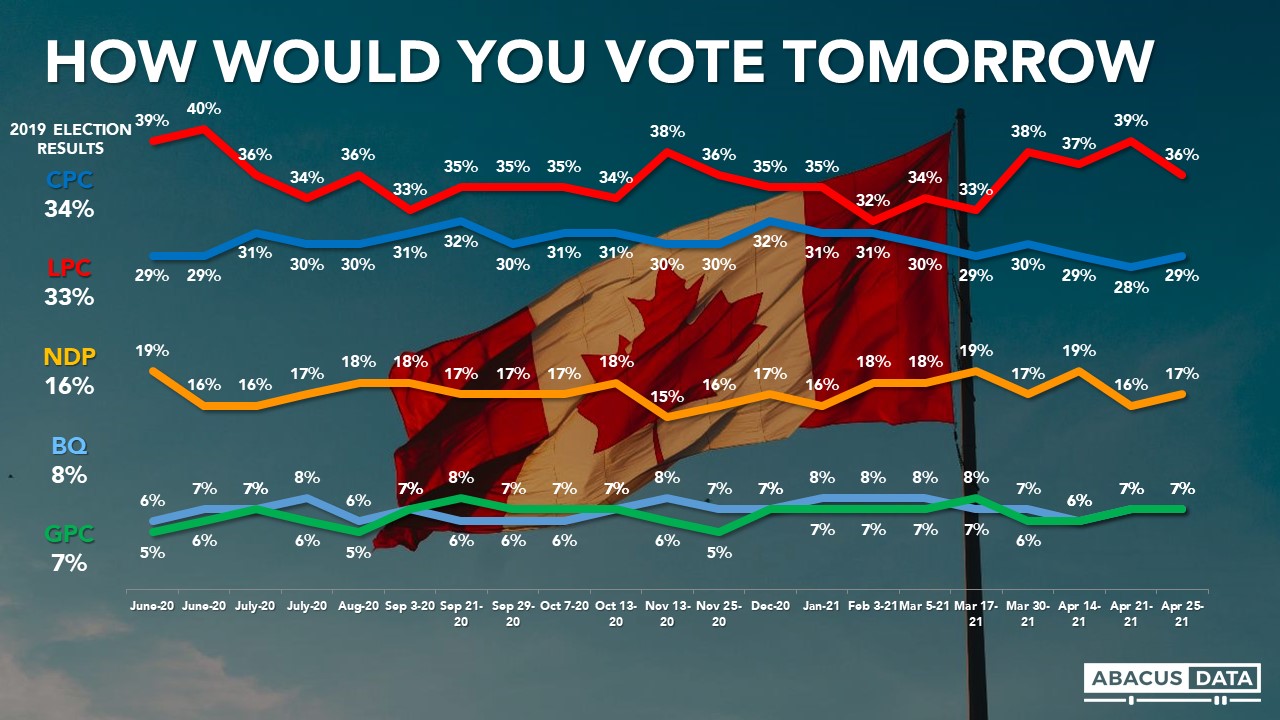
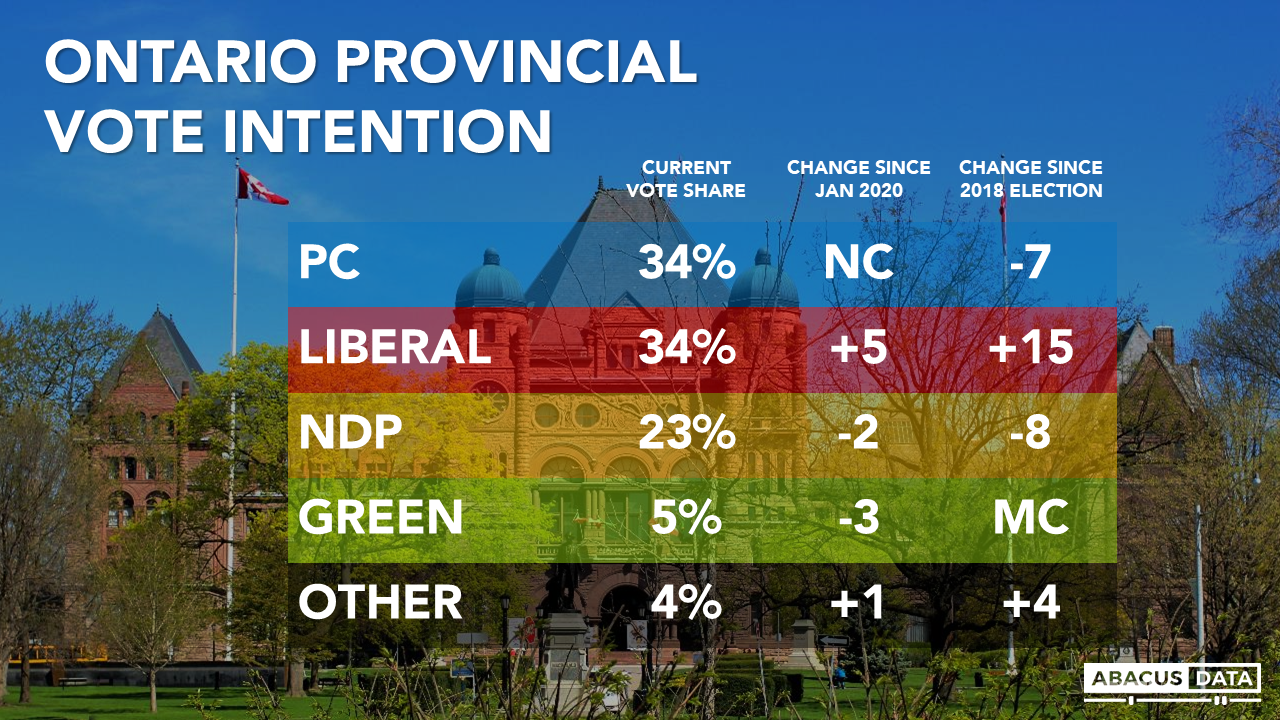
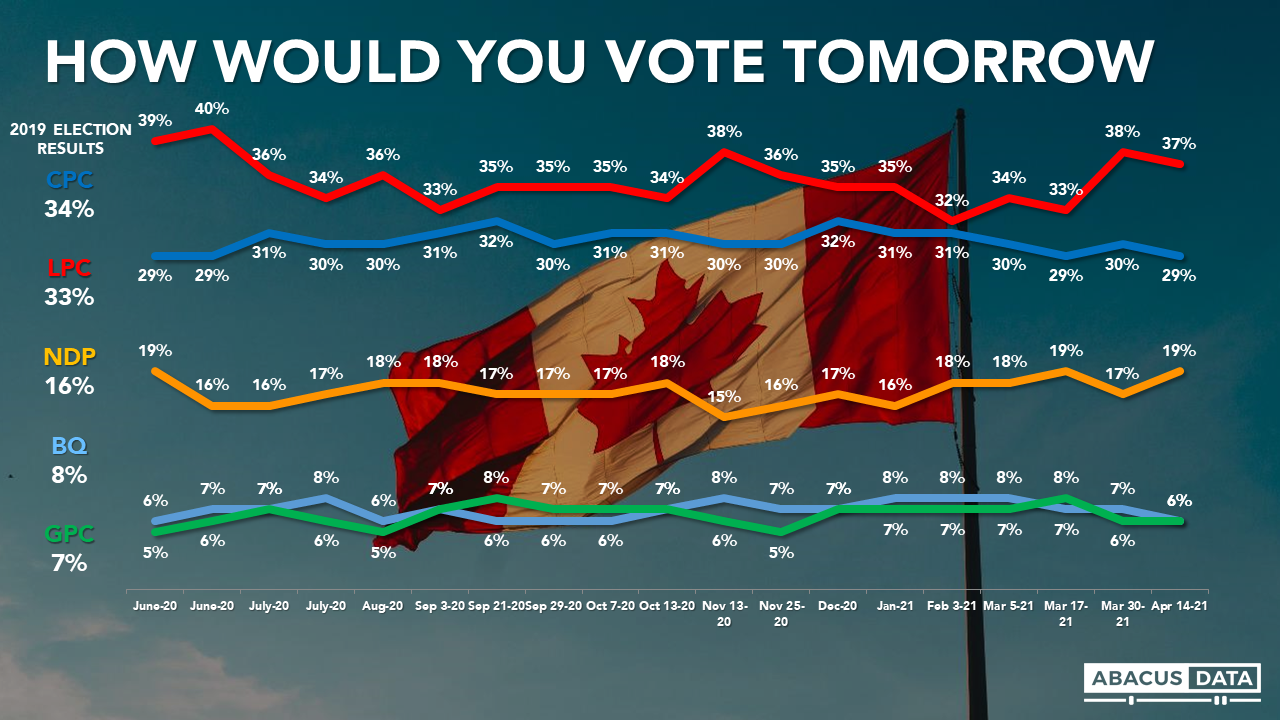
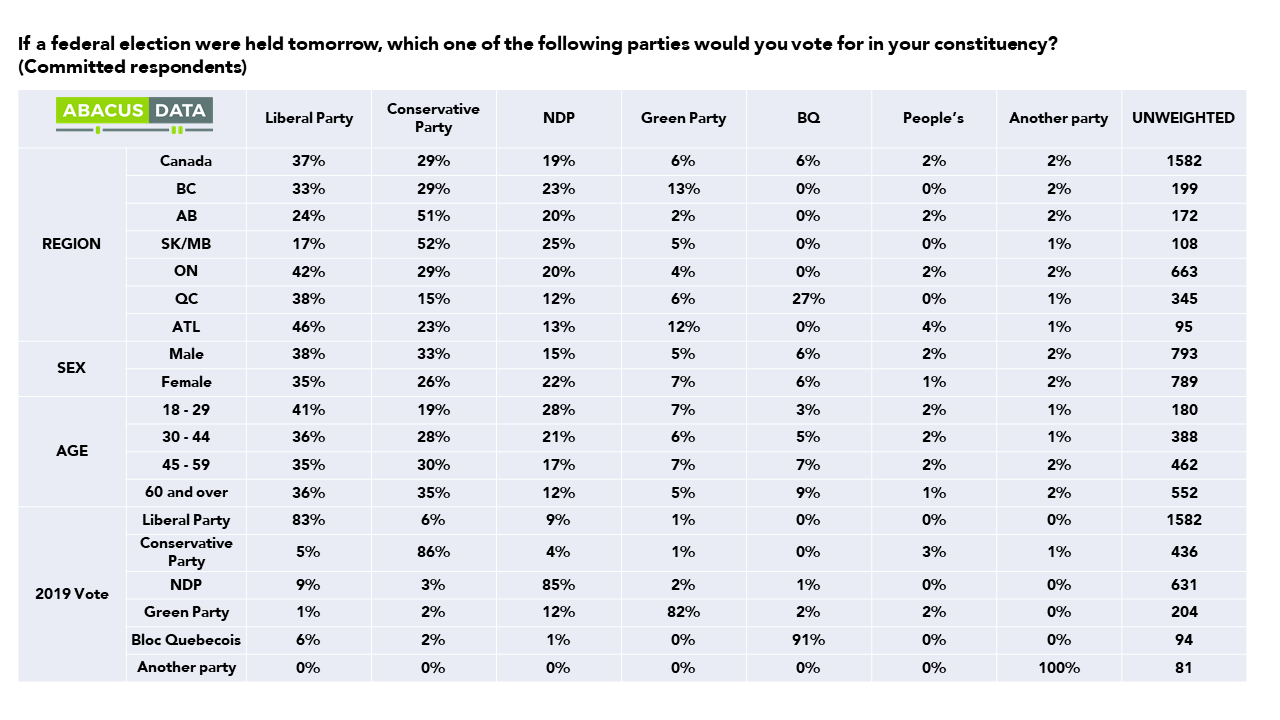
If an election were held now, the Liberals would win 34% of the vote, the Conservatives 32%, the NDP 17%, the Green Party 7% and the BQ at 25% in Quebec.
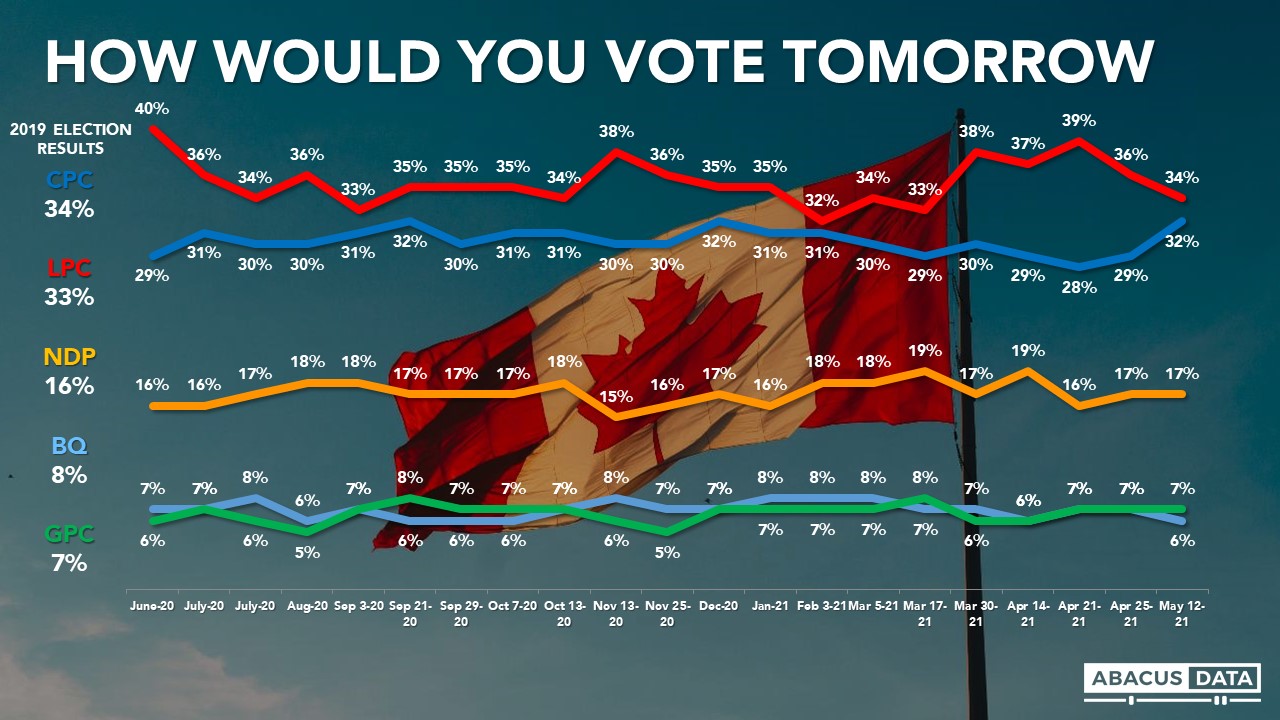
Over the past month, Liberal support is down 5 while Conservative support is up 4. For the Liberals, the shift reflects declines in support in Atlantic Canada and the Prairies. For the Conservatives, there is a notable increase in support in Alberta, but otherwise, shifts are marginal.
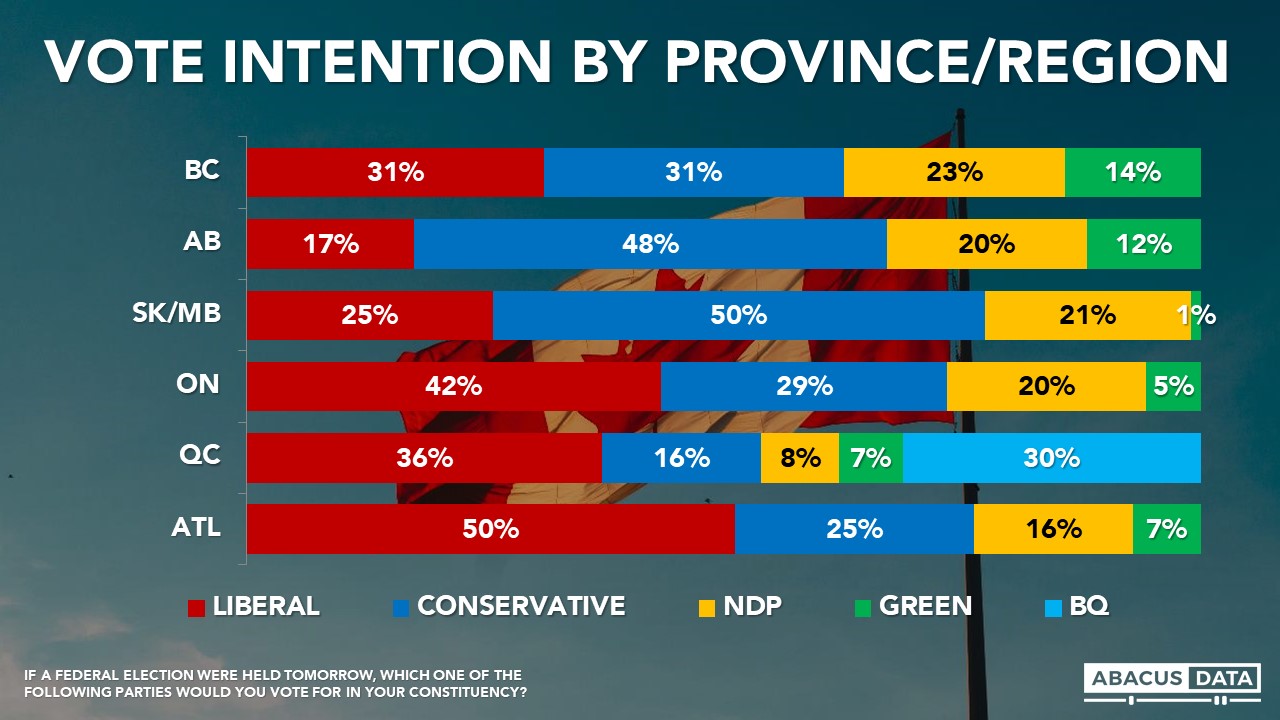
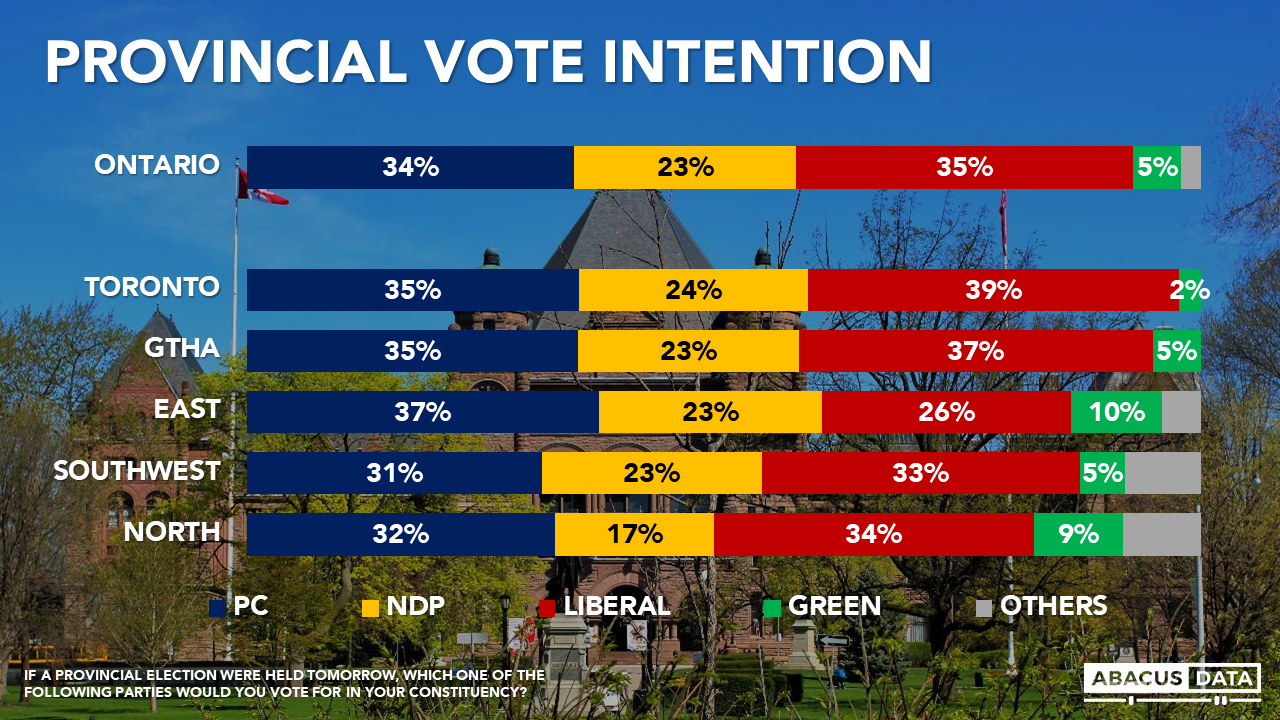
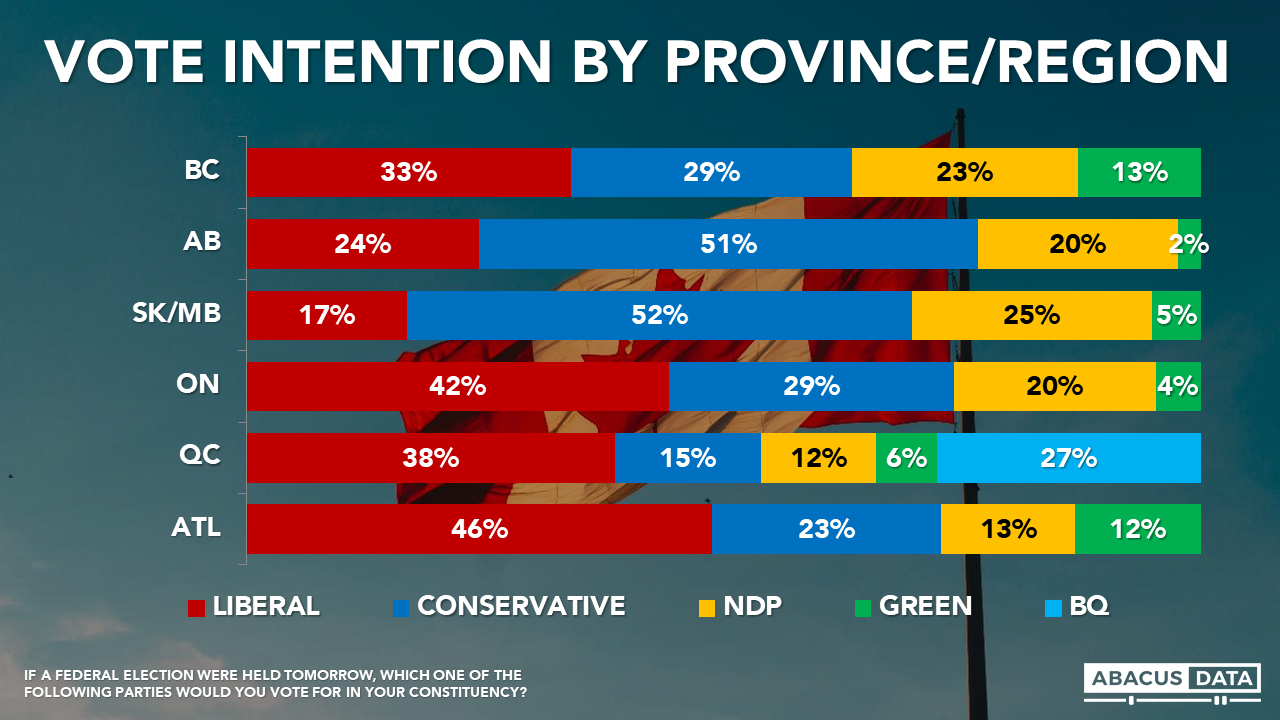
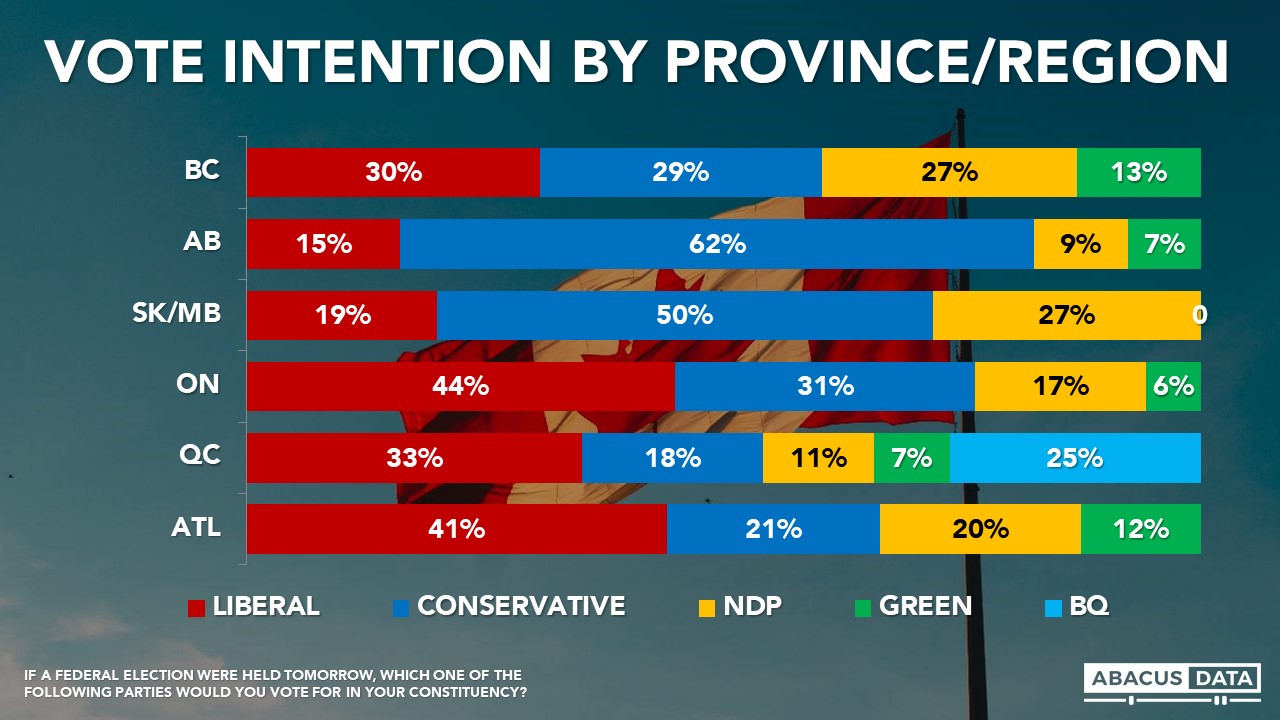
In BC, the Liberals, Conservatives, and NDP are in a three-way tie while the Conservatives continue to dominate in the Prairies. The Liberals continue to hold sizeable leads in Ontario (13-points), Quebec (8-points), and Atlantic Canada (20-points).
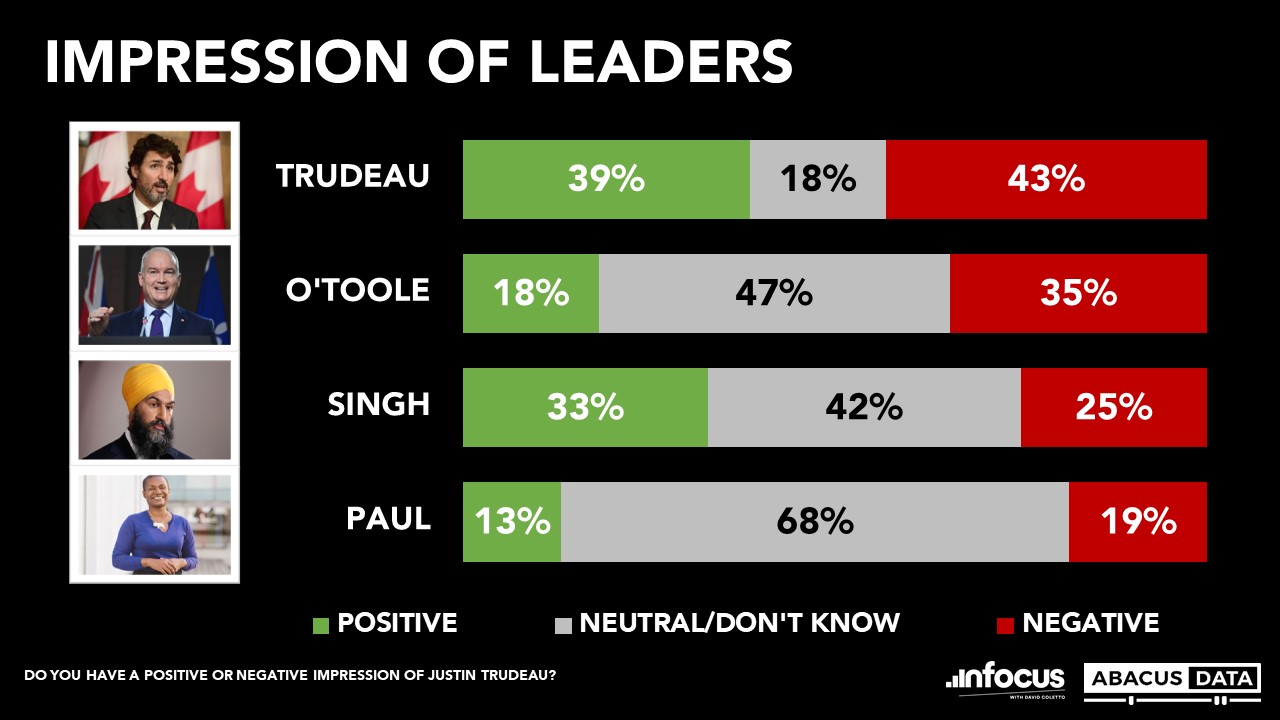
LEADER IMPRESSIONS
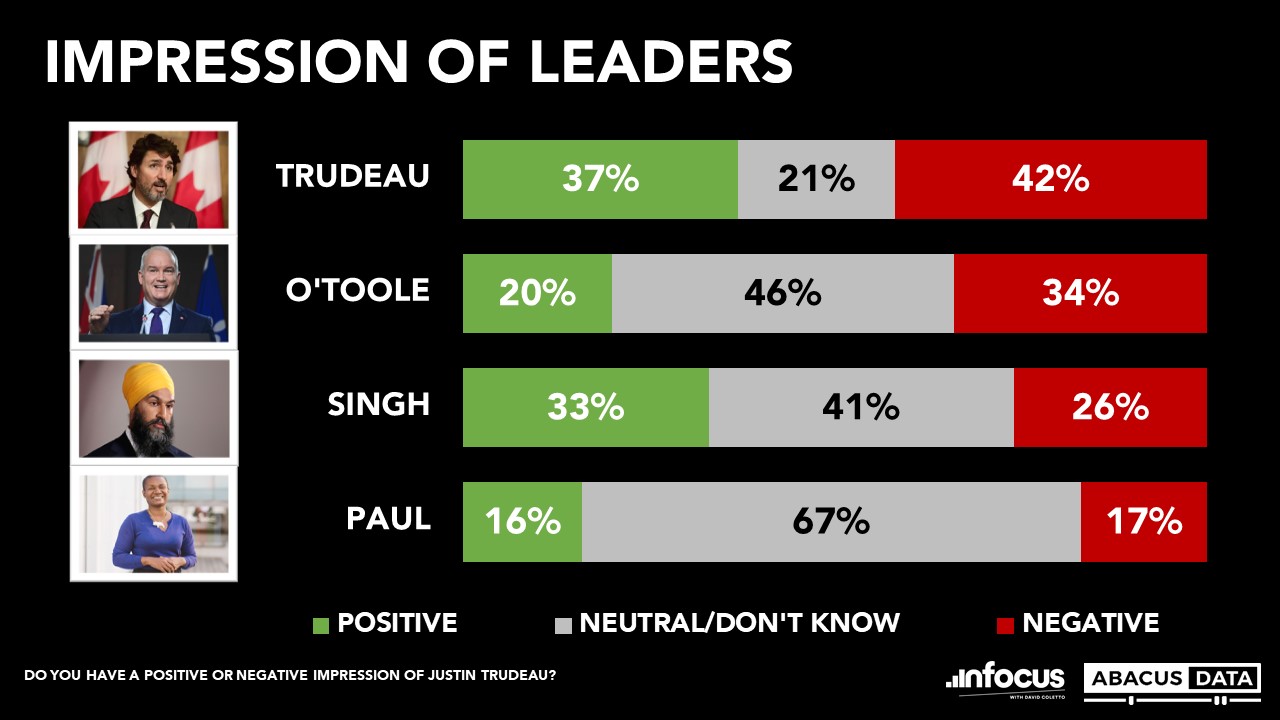
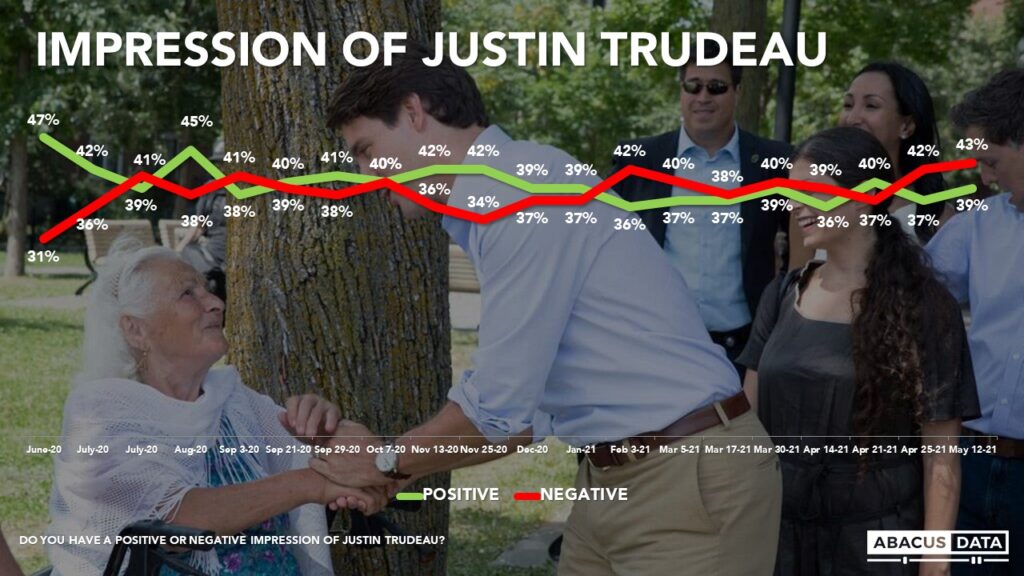
Justin Trudeau enjoys a positive impression among 39% and finds negative impressions among 43%, for a net score of -4.
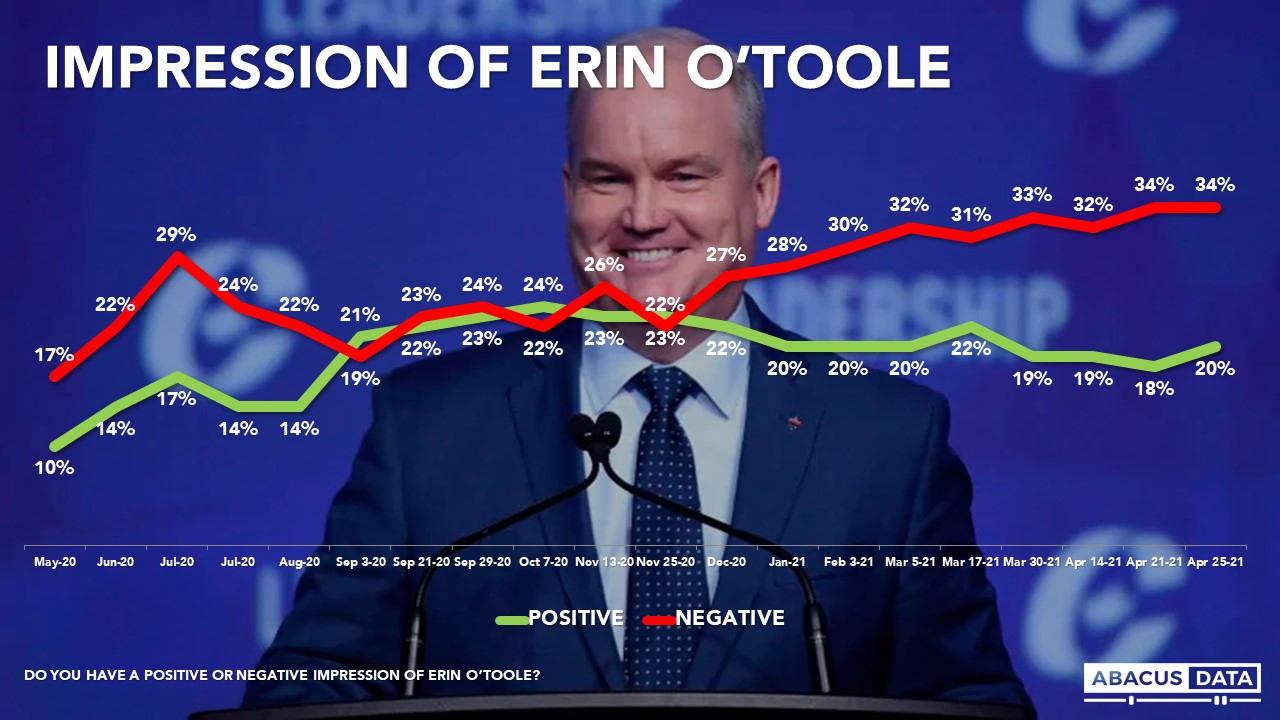
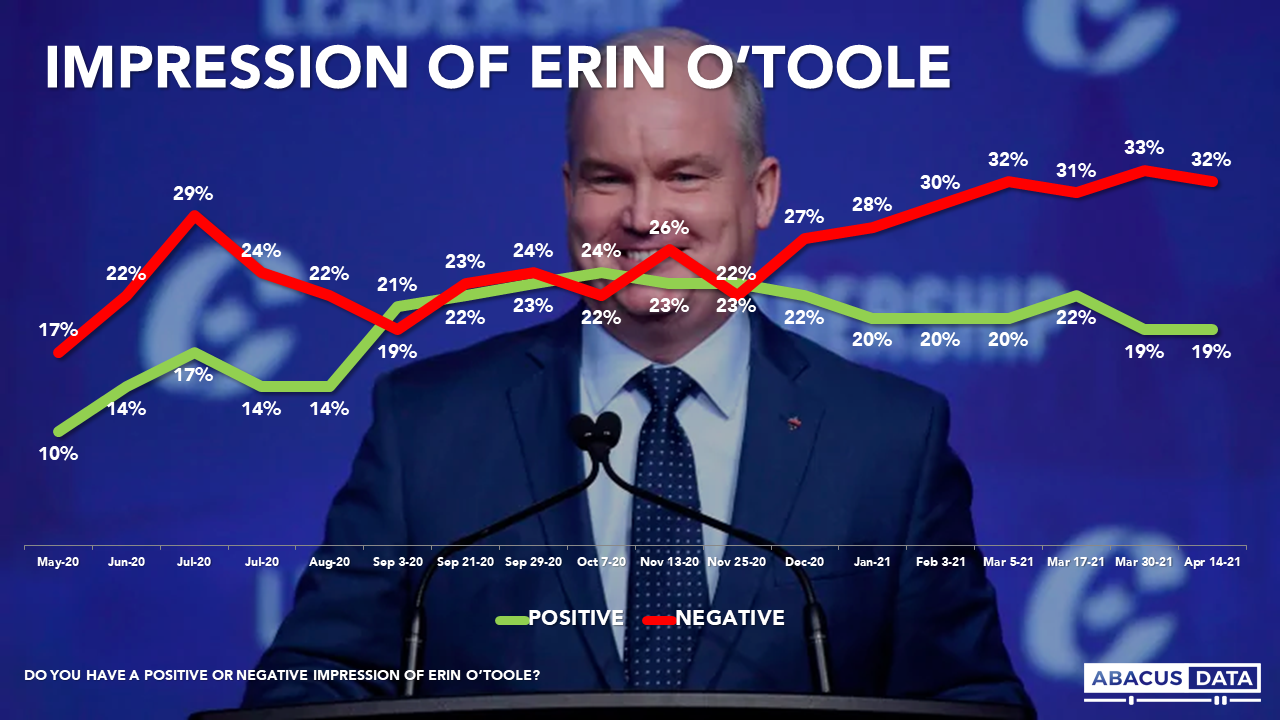
Erin O’Toole enjoys a positive impression among 18% and finds negative impressions among 35%, for a net score of -17.
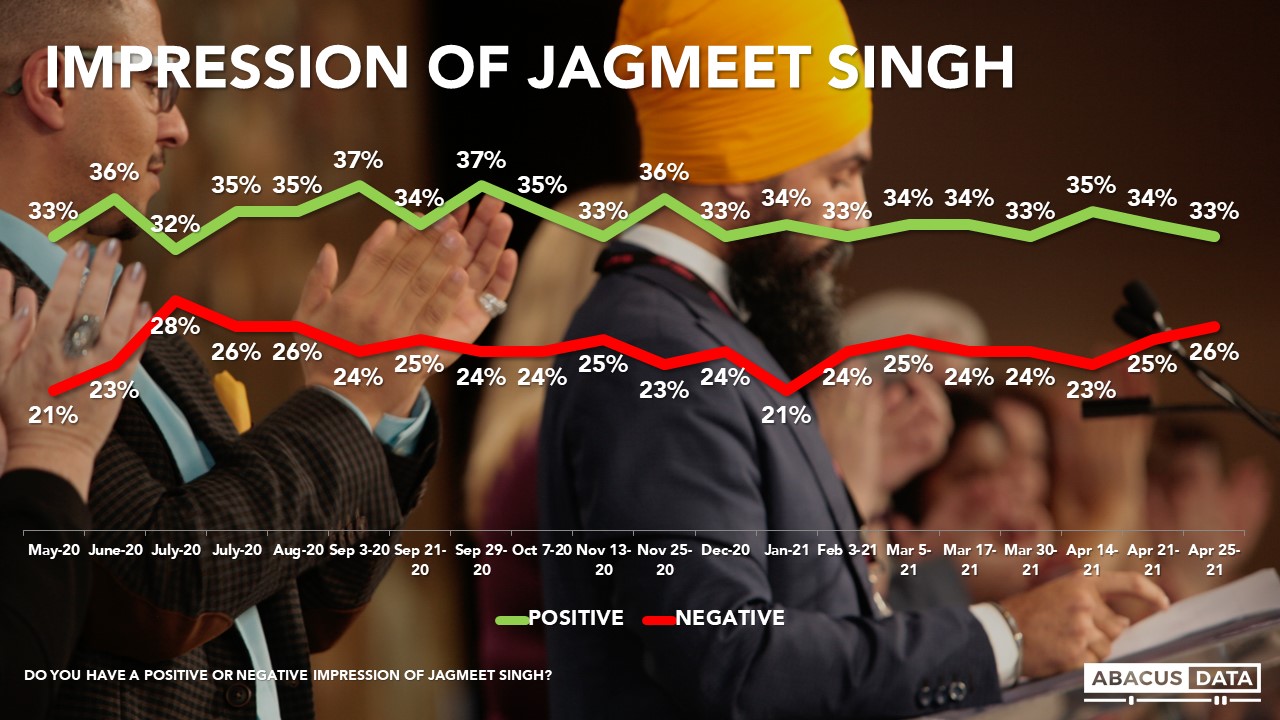
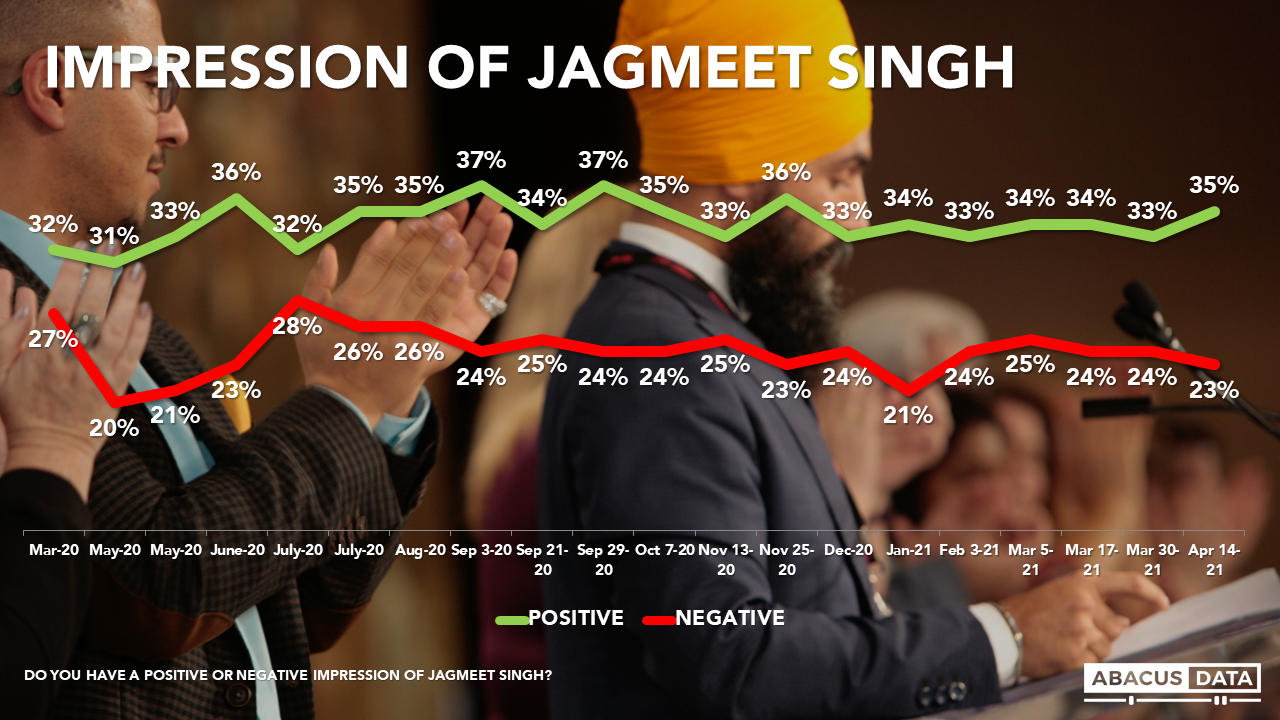
Jagmeet Singh enjoys a positive impression among 33% and finds negative impressions among 25% for a net +8.
Annamie Paul enjoys a positive impression among 13% and finds negative impressions among 19% for a net -6.
Yves Francois Blanchet, enjoys a +5 net rating in Quebec, which compares to a +3 for Justin Trudeau, -15 for Erin O’Toole, and +1 for Jagmeet Singh and -2 Annamie Paul.


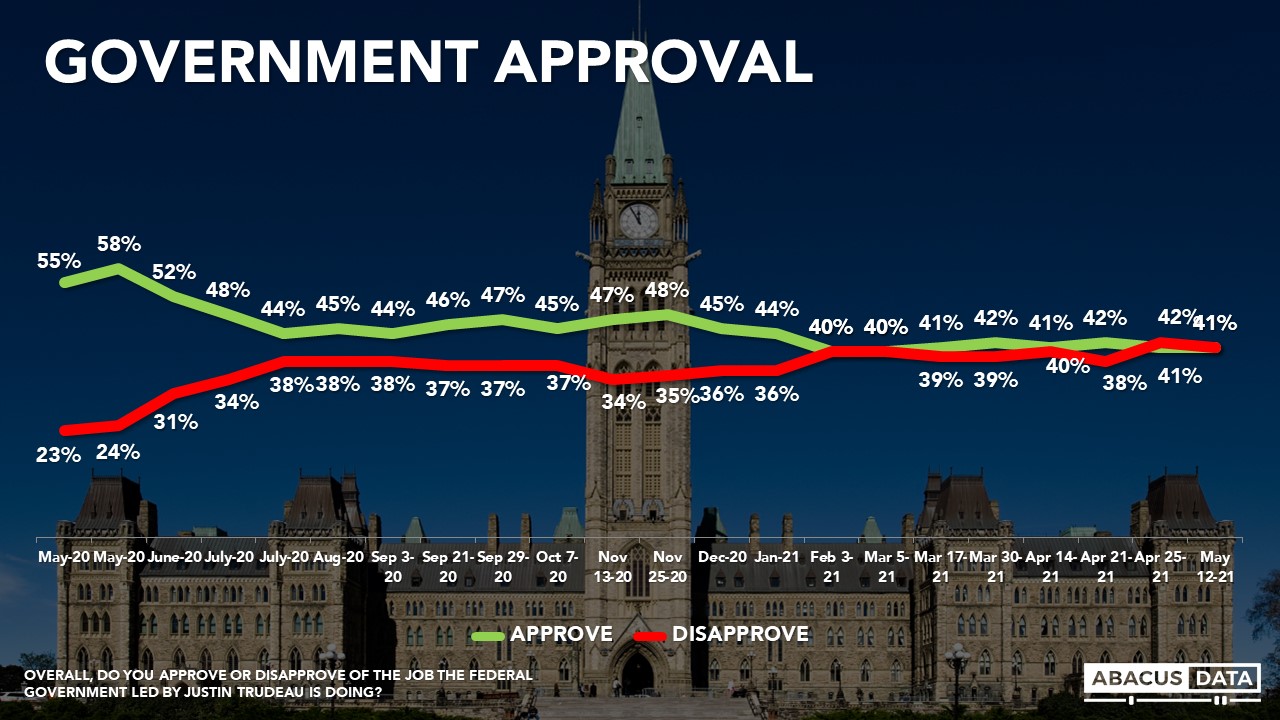
FEDERAL GOVERNMENT APPROVAL
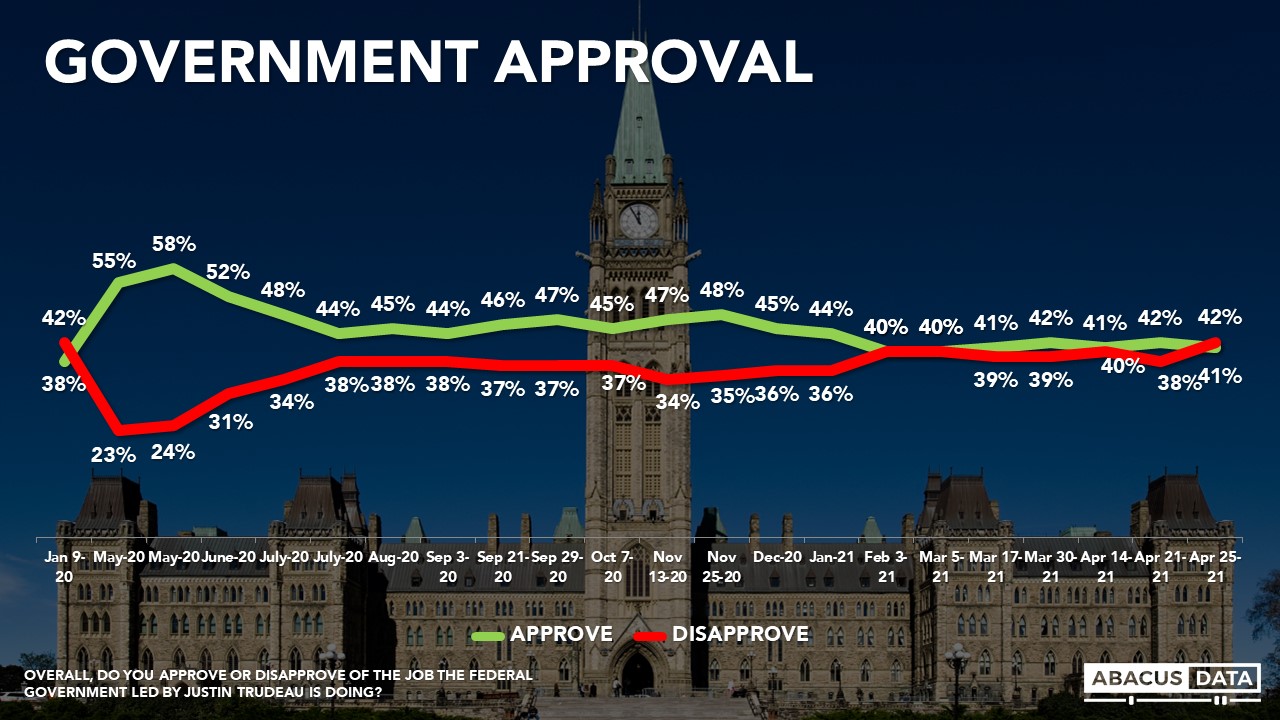
Today, 41% approve of the performance of the federal government, 41% disapprove, and 18% are mixed or undecided on the performance of the government. There has been no clear trend on this indicator for several months.
Approval of the government has a strong relationship with voting intentions. Among those who approve, 65% say they would vote Liberal today. Among those who disapprove of the Trudeau government’s performance, only 3% would vote Liberal, and 60% would vote Conservative.
Worth noting is those who are mixed or undecided in their view of the government’s performance: today the Liberals would claim 29% of that vote, compared to 17% for the NDP and 15% for the Conservatives.
In the three provinces with the most seats, approval of the federal government is 45%/43% (approve/disapprove in BC, 45%/39% in Ontario, and 42%/31% in Quebec.
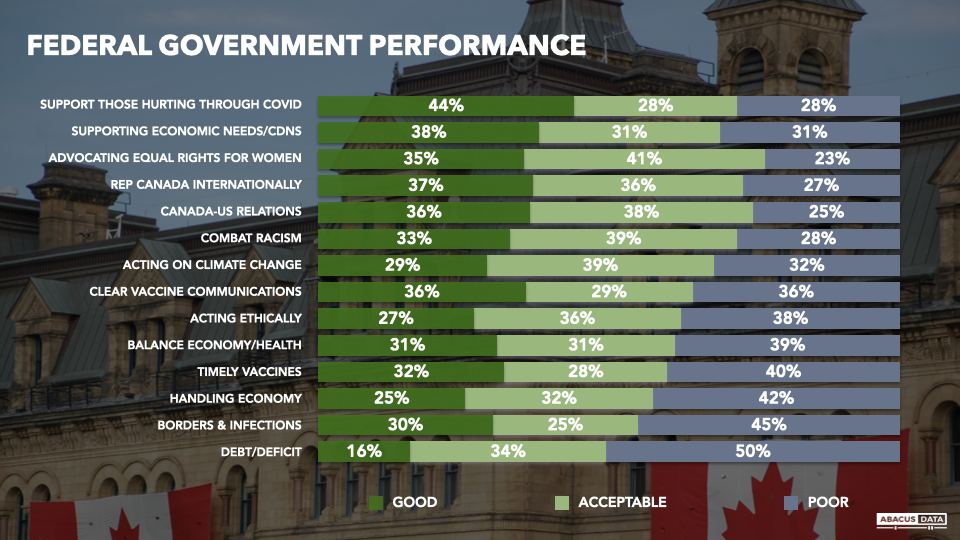
We asked respondents to assess the federal government’s performance on a range of items. Among the more notable findings:
• On 14 items tested 50% or more gave the government acceptable or good ratings. The best-rated item for Ottawa is for helping those who are in trouble because of Covid.
• The four worst items for the government were for handling the economy, ensuring timely vaccines, controlling infections at the borders, and debt and deficit. On vaccine timeliness, today 60% give Ottawa an acceptable or good rating.
• On handling the economy, 57% give an acceptable or good rating. However, on “supporting the economic needs of Canadians, 69% offer a good or acceptable rating.
• The ratings for the government on “acting on climate change” which has been an area of policy announcement lately show 68% giving the government an acceptable or good rating.
• The recent spate of news about conduct in the military and the questions about General Vance was not specifically measured, although it is worth noting that the government continues to get among its’ best ratings for “advocating equal rights for women”. Among women, 76% give the government acceptable or good ratings; among men 75%.
• To better understand the potential impact of the debt/deficit issue it is useful to look at the views of key subgroups. Among voters who self-describe as on the centre of the spectrum, 51% give the government good or acceptable ratings, while 49% are unhappy.
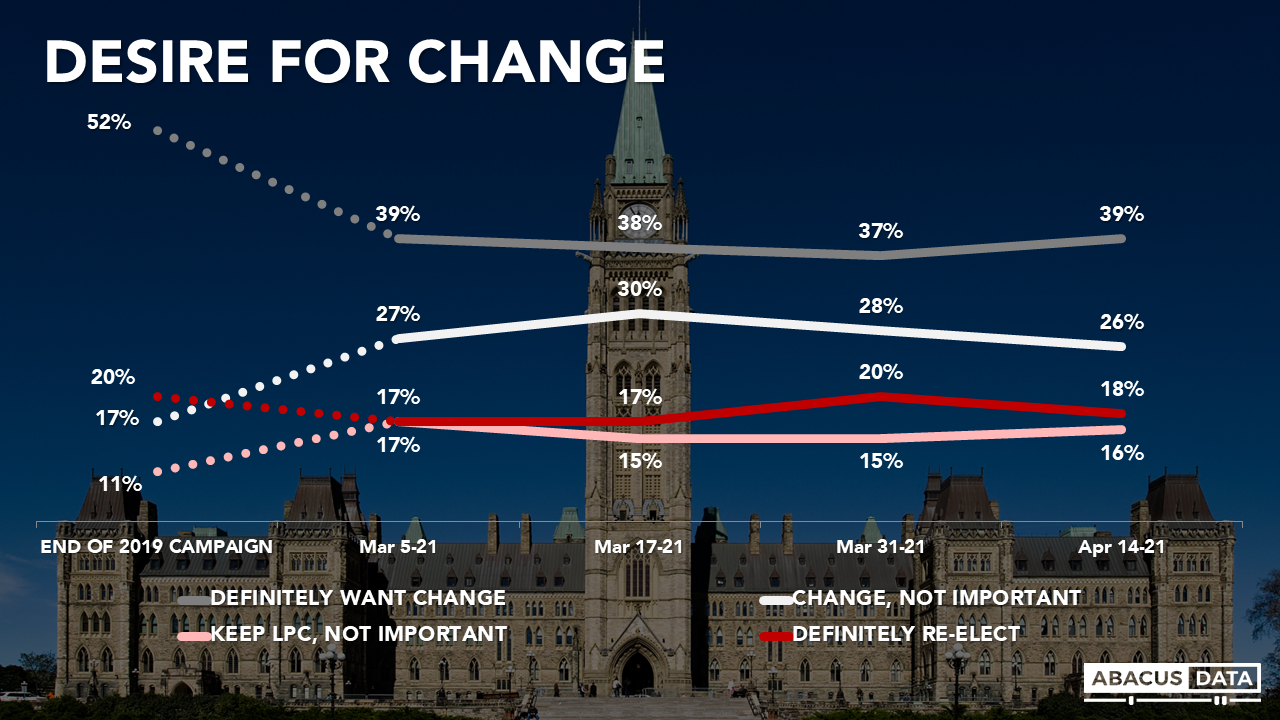
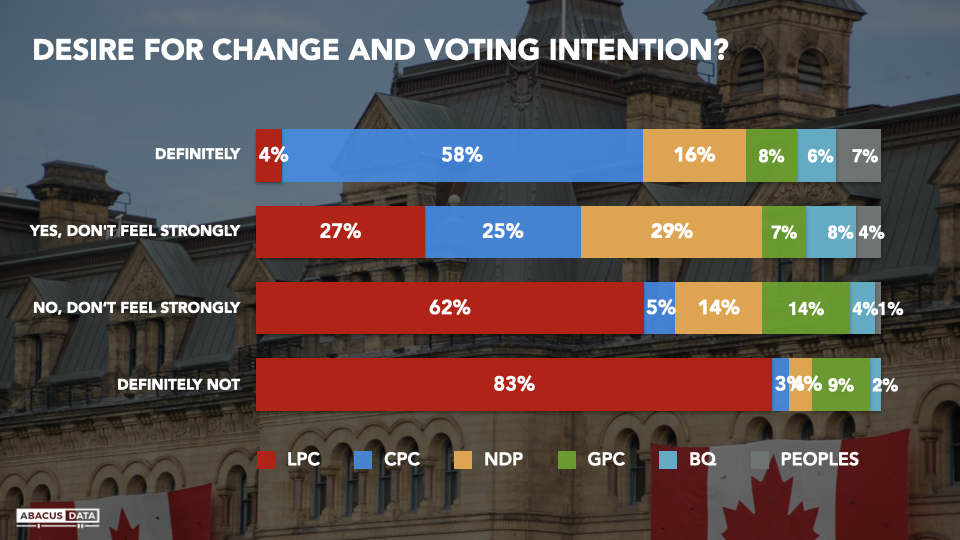
DESIRE FOR CHANGE
Today, 41% of voters say it is definitely time for a change in government. Another 27% say “it would be good to have change but doesn’t matter to me that much”. The intense desire for change is up 4 points in less than a month but still well below what it was at the end of the 2019 campaign.
A total of 68% who would prefer to see a change in government is about equal to what it was at the end of the 2019 campaign. Worth noting as it can relate to motivation and turnout – the number who are adamant about the need for change is 11 points below the 2019 threshold, although it has risen by four points in recent weeks.
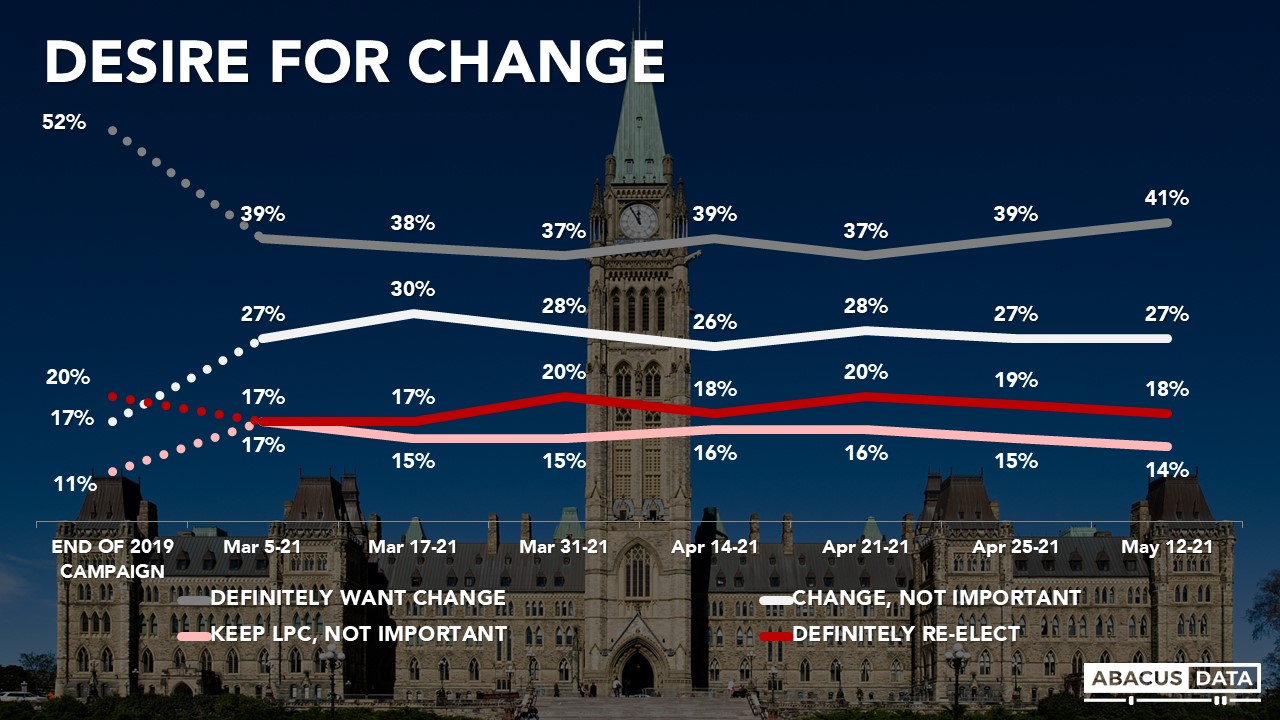
Hard change voters are more commonly men, Prairies residents and Conservatives. The size of the two swing voter battleground segments (people who have a leaning but don’t feel that strongly) is 46% in BC, 42% in Ontario, and 44% in Quebec.
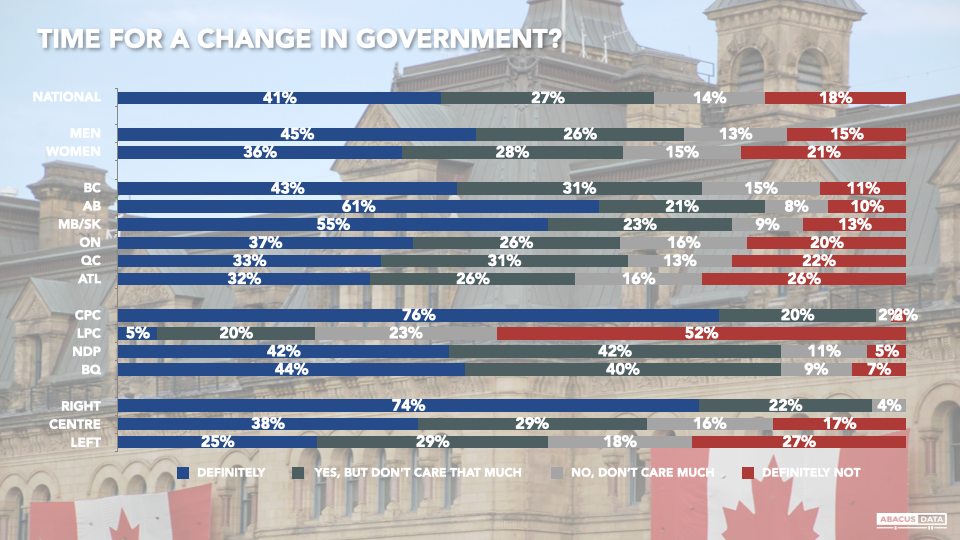
Among the 41% who are “hard change” voters (people who say it is definitely time for a change in government) the Conservatives would win just over half (56%) of this segment with the rest splitting 16% NDP, 8% Green, 7% People’s Party, 6% BQ and 4% Liberal.
Among the 27% “soft change” voters, the Conservatives would win about a quarter of this segment (25%), while 29% would vote NDP, 27% Liberal, 10% for the BQ and 7% Green.
Among the “soft no change” voters, 62% would vote Liberal today, followed by 14% NDP, 14% Green, and only 5% going to the Conservatives. The Liberals would win 90% of the “hard no change” voters.
UPSHOT
According to Bruce Anderson: “We see a topline tightening horserace nationally but after examining key regional battlegrounds it’s not clear to me that one can see a trend developing in terms of competitiveness electorally.
The number of voters looking for change is up marginally, but the intensity of that feeling remains mild, and the increase is more evident in places where the incumbents have little support and weak prospects.
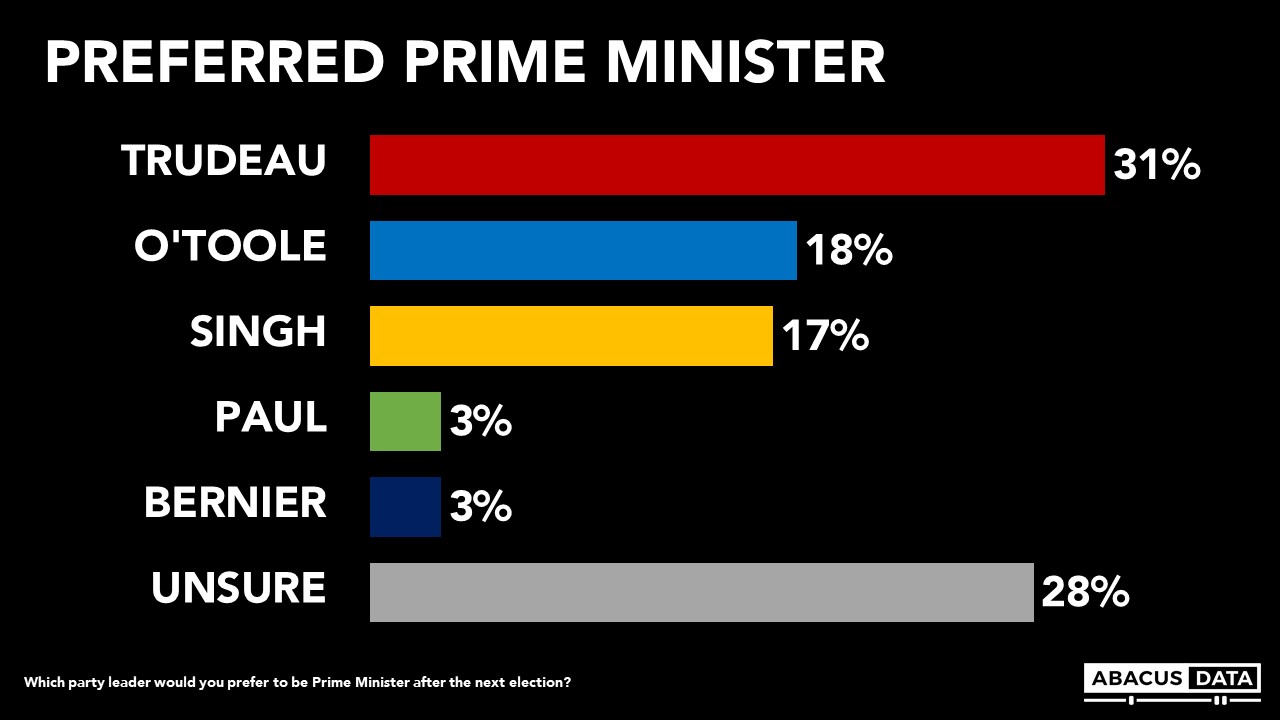
The Liberals can see some encouraging signs in these numbers but also some clear warning signals about debt and border issues during the pandemic. Only 18% are sure they want this government re-elected: to win the Liberals will have to convince indifferent or slightly disappointed voters that they are a better choice for the next few years. The numbers are a warning not to run a campaign that banks heavily on voters rewarding the record.
For the Conservatives, there are two evident challenges: Mr. O’Toole’s personal numbers are 2:1 negative to positive nationally and in Ontario, Quebec, and BC. Among Conservative voters, only 52% say they have a positive image of him. Among Albertans, the number is 29%. Among those who disapprove of the government, only 31% have a positive image of the Conservative leader today.
The second challenge lies in the fact that the Conservative share of the soft vote is relatively small right now. To produce an electoral breakthrough they will need better feelings towards their leader, more people feeling a strong need for change and a bigger share of those who are open to the idea of a change in government.”
According to David Coletto: “The political landscape has become more competitive over the past few weeks. Although the government’s approval rating and the Prime Minister’s image have not changed, a Liberal lead of 11-points four weeks ago is down to 2-points today. It is unclear whether this is a response to the budget, fatigue over the third wave gripping much of the country, or other factors is unclear. But the increase in those definitely wanting a change in government suggests that decisions the Liberal government has made over the past few weeks have angered and animated many of those predisposed to oppose the Liberals which likely explains the tightening horserace.”
And don’t miss any of our research and analysis, plus get our weekly Worth A Look newsletter. Sign up today.
ABOUT ABACUS DATA
We are the only research and strategy firm that helps organizations respond to the disruptive risks and opportunities in a world where demographics and technology are changing more quickly than ever.
Find out more about what we are doing to help clients respond to the COVID-19 pandemic.
We are an innovative, fast-growing public opinion and marketing research consultancy. We use the latest technology, sound science, and deep experience to generate top-flight research-based advice to our clients. We offer global research capacity with a strong focus on customer service, attention to detail and exceptional value.
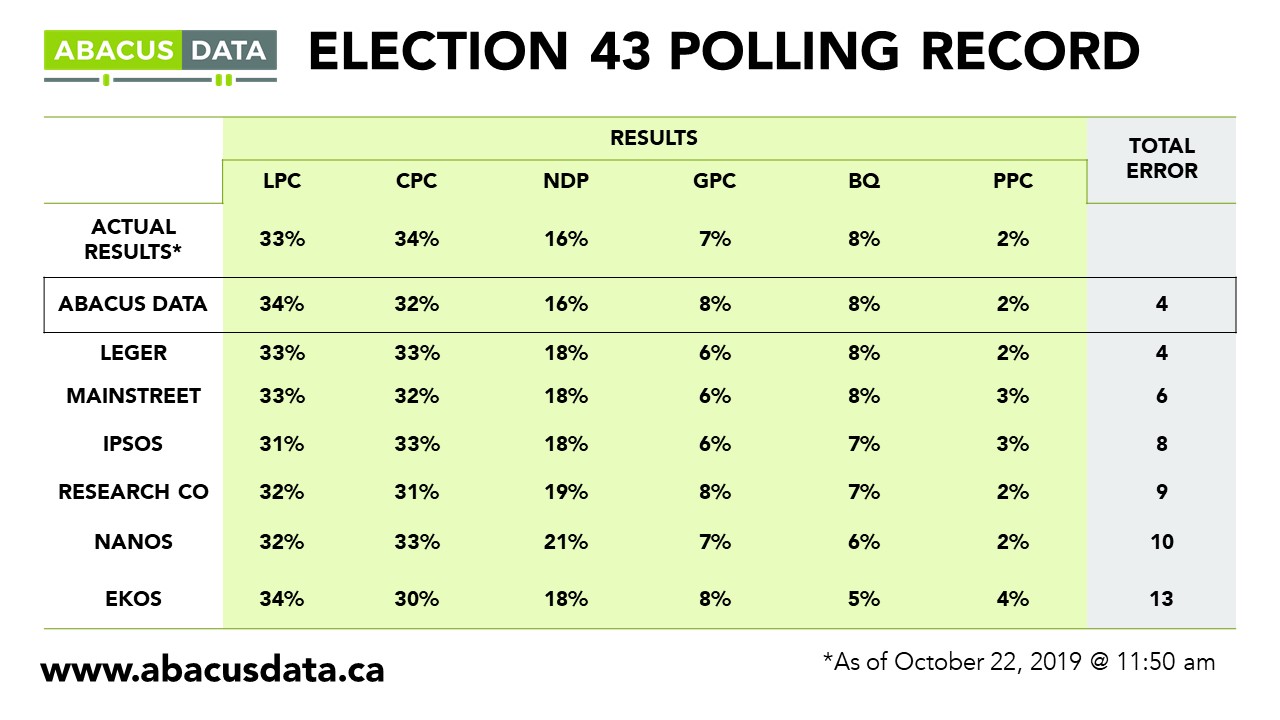
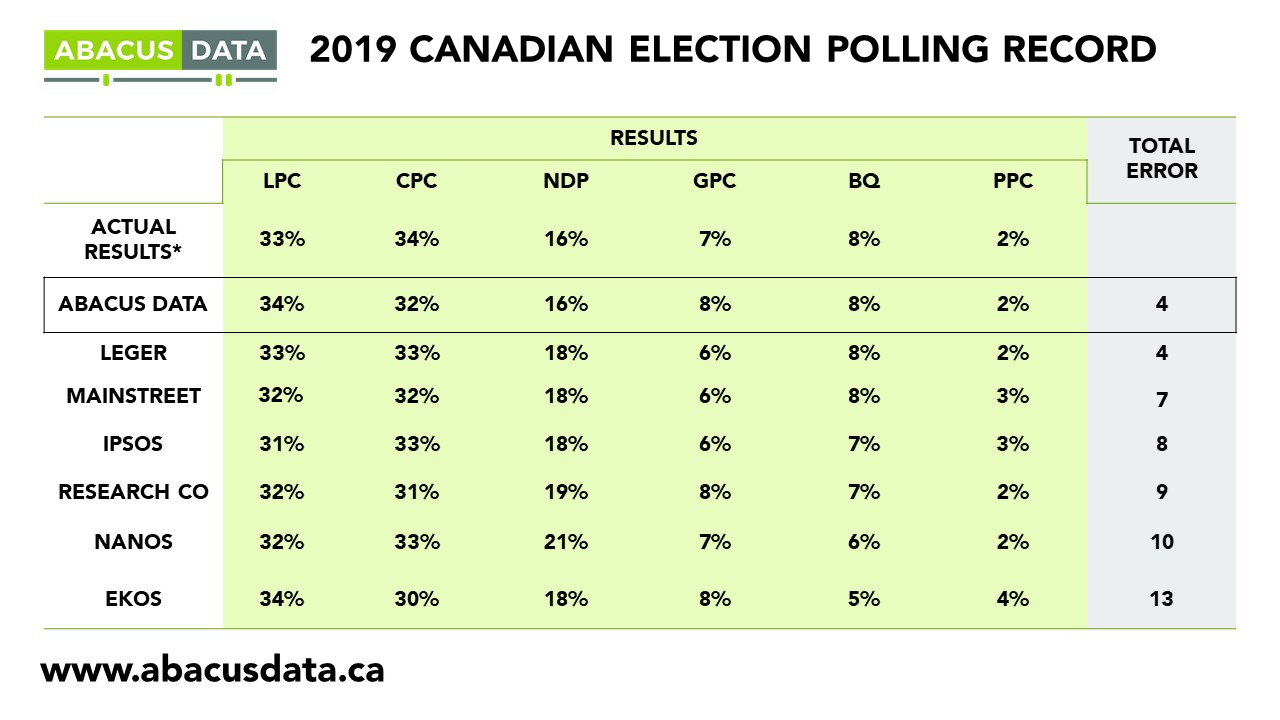
We were one of the most accurate pollsters conducting research during the 2019 Canadian Election.
Contact us with any questions.
Find out more about how we can help your organization by downloading our corporate profile and service offering.
METHODOLOGY
The survey was conducted with 1,500 Canadian adults from May 7 to 12, 2021. A random sample of panelists were invited to complete the survey from a set of partner panels based on the Lucid exchange platform. These partners are typically double opt-in survey panels, blended to manage out potential skews in the data from a single source.
The margin of error for a comparable probability-based random sample of the same size is +/- 2.6%, 19 times out of 20.
The data were weighted according to census data to ensure that the sample matched Canada’s population according to age, gender, educational attainment, and region. Totals may not add up to 100 due to rounding.