Canada’s political mood as 2018 comes to an end
December 21, 2018
As we close out 2018 and look to 2019, we surveyed 2,000 Canadian adults and explored their views on federal politics and how they were feeling about the direction of the country. Here’s the first of a series of releases, detailing what we found:
DIRECTION OF THE COUNTRY
By a seven-point margin, Canadians are more likely to think (42%) the country is headed in the right direction as say it is off on the wrong track (35%).

The results on this question show marked regional differences with a +12 gap in BC, +5 in Ontario, and +23 in Quebec. In Alberta, the net right direction-wrong direction score is -24. Among those on the left of the spectrum, we see a +30, those on the centre +10 and on the right -27.
Millennials feel more optimistic (+26) than Boomers (-7) or Gen Xers (-2).
Compared to the rest of the world, the consensus seems to be things could be worse. Around the world, only 17% see things going in the right direction, while 62% say things are off on the wrong track. “Wrong track” views are up 3 points, just since October.
Canadians are more likely to think things are worse in the US: 72% say the US is off on the wrong track – only 15% think it is heading in the right direction. Interestingly, this perspective among Canadians doesn’t vary all that much across regional or partisan or philosophical lines: 62% of Albertans, 62% of Conservative voters, and 63% of those on the right side of the spectrum think America is heading in the wrong direction. 81% of Liberal supporters feel that way as well.
ACCESSIBLE VOTER POOLS
As the country enters another federal election year, 53% say they would consider voting Liberal, 48% would consider voting Conservative, 43% would consider the NDP, 36% Green, and 18% the People’s Party. In Quebec, 29% would consider voting BQ.

Focusing on the three most populous provinces (which together account for more than a third of the seats in the House of Commons), the Liberals have an accessible pool of 54% in BC, 59% in Ontario and 50% in Quebec. The Conservatives find 48% in BC, 52% in Ontario, and 33% in Quebec. The NDP find 47% in BC, 52% in Ontario, and 37% in Quebec.
In short, the Liberals have a larger accessible voter pool than the Conservatives in BC (gap of 6) in Ontario (gap of 7) and in Quebec (gap of 17).
The decline of NDP consideration in Quebec is all the more striking given that at the start of the 2015 federal election, almost half of Quebecers said they would vote for the NDP, not just consider voting for the party.
Among Millennials, the largest age group in the upcoming election, 59% would consider voting Liberal, 53% NDP, 46% Conservative, 46% Green, 22% People’s Party.
CURRENT VOTING INTENTION
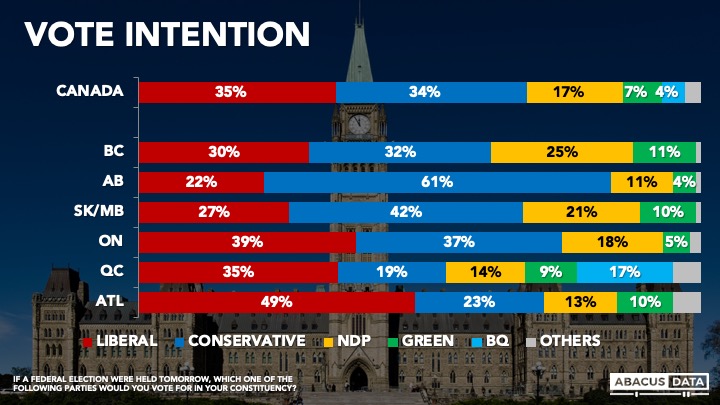
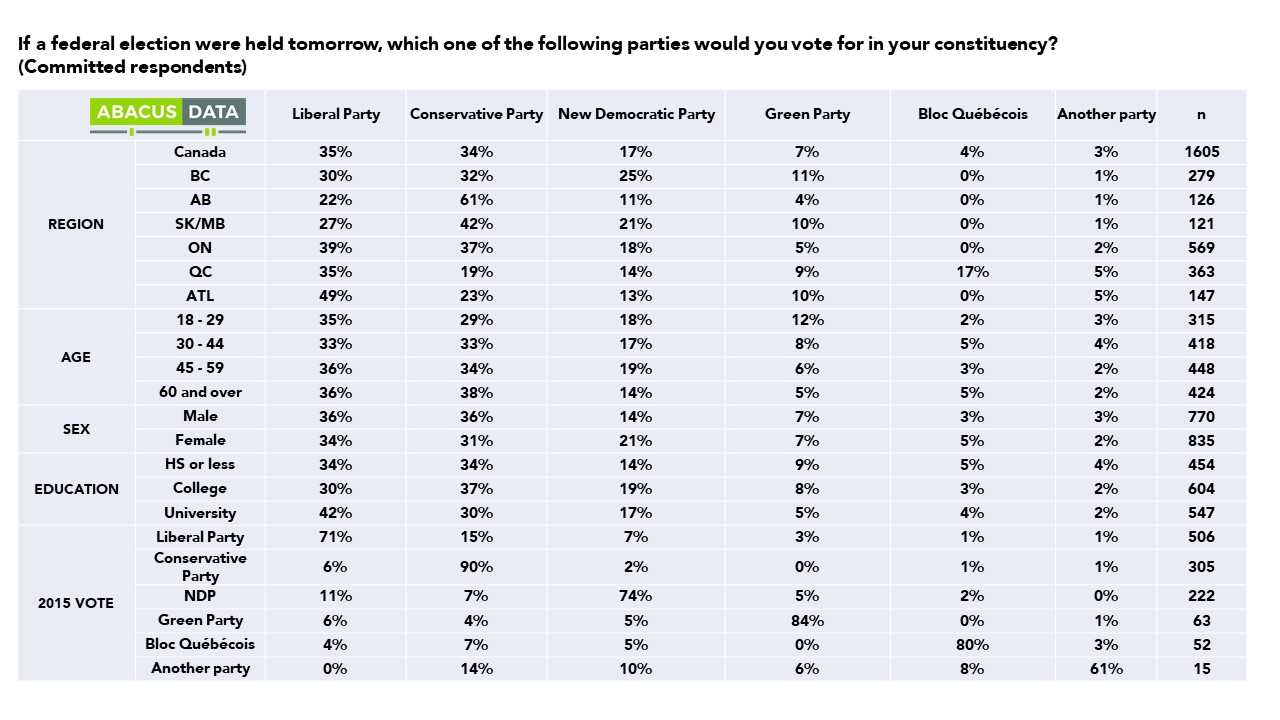
If an election were held tomorrow, 35% say they would vote Liberal, 34% Conservative, 17% NDP, and 7% Green. In Quebec, 17% would vote BQ. At a one-point margin, this is the closest we’ve tracked the Liberals and Conservatives since the last federal election.

Regionally, our latest data shows tight races in BC and Ontario, strong leads Conservative leads in Alberta and Saskatchewan, and significant Liberal leads in Quebec and Atlantic Canada.
Almost half of those we surveyed say it is very (7%) or somewhat likely (36%) that they could be persuaded to support a different party by election day. This includes 44% among current LPC voters, 56% among current NDP voters, 52% among current Green Party voters, and 33% of current CPC voters.

If Liberal voters were to switch, 36% would move to the Conservatives, 35% to the NDP and 23% to the Green Party.
If Conservative voters were to switch, 40% would move to the Liberal Party, 27% to the NDP and 15% to the Green Party.
If NDP voters were to switch, 45% would migrate to the Liberals, 28% to the Conservatives and 17% to the Greens.

At this point, while the Conservatives are competitive in overall voting intention and have the firmest support, they lag in terms of second choice consideration among voters who might rethink their current intentions.
PREFERRED PRIME MINISTER
When asked which of the party leaders they would prefer to see as Prime Minister after the next election, 45% picked Justin Trudeau, 29% Andrew Scheer, 10% Jagmeet Singh, 10% Elizabeth May and 5% Max Bernier. This is largely unchanged from our last survey.
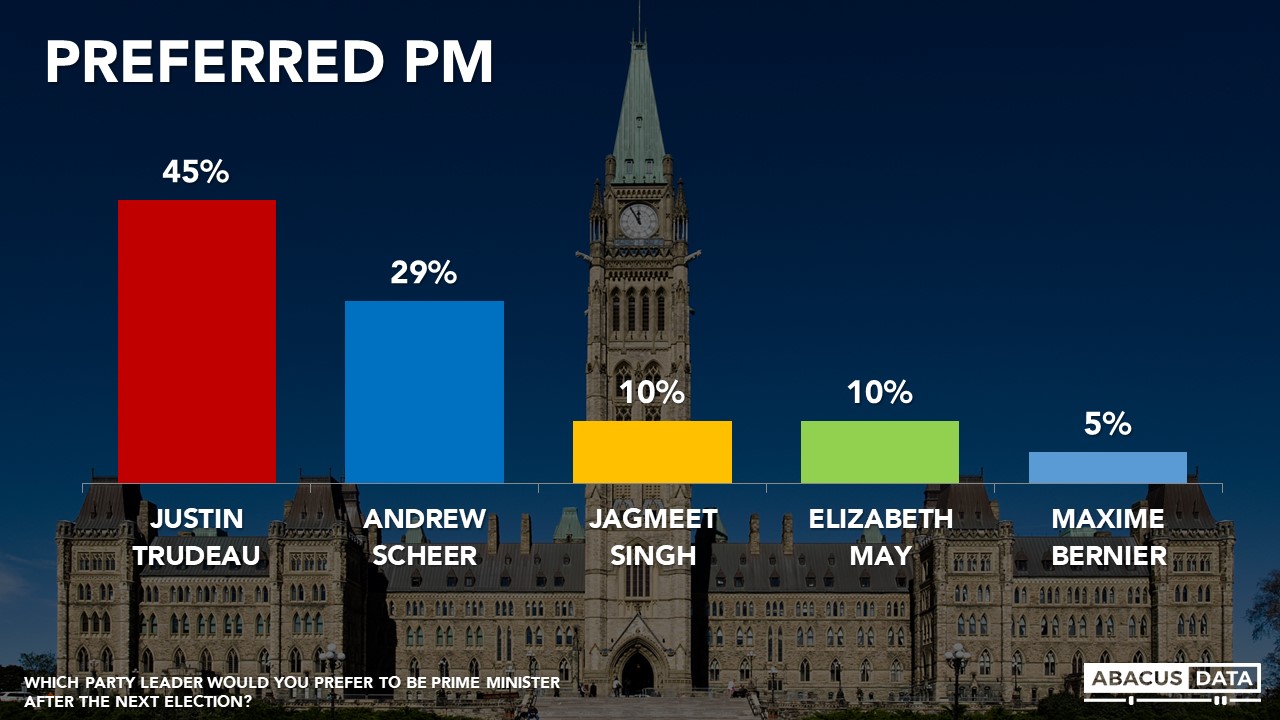
Mr. Trudeau leads on this question everywhere but in Alberta and Saskatchewan where he trails Mr. Scheer by 16 points, and in Saskatchewan where he trails by 11. Mr. Trudeau’s lead in BC is 11 points, In Manitoba 15, in Ontario 19, in Quebec 24, and in Atlantic Canada 38 points.
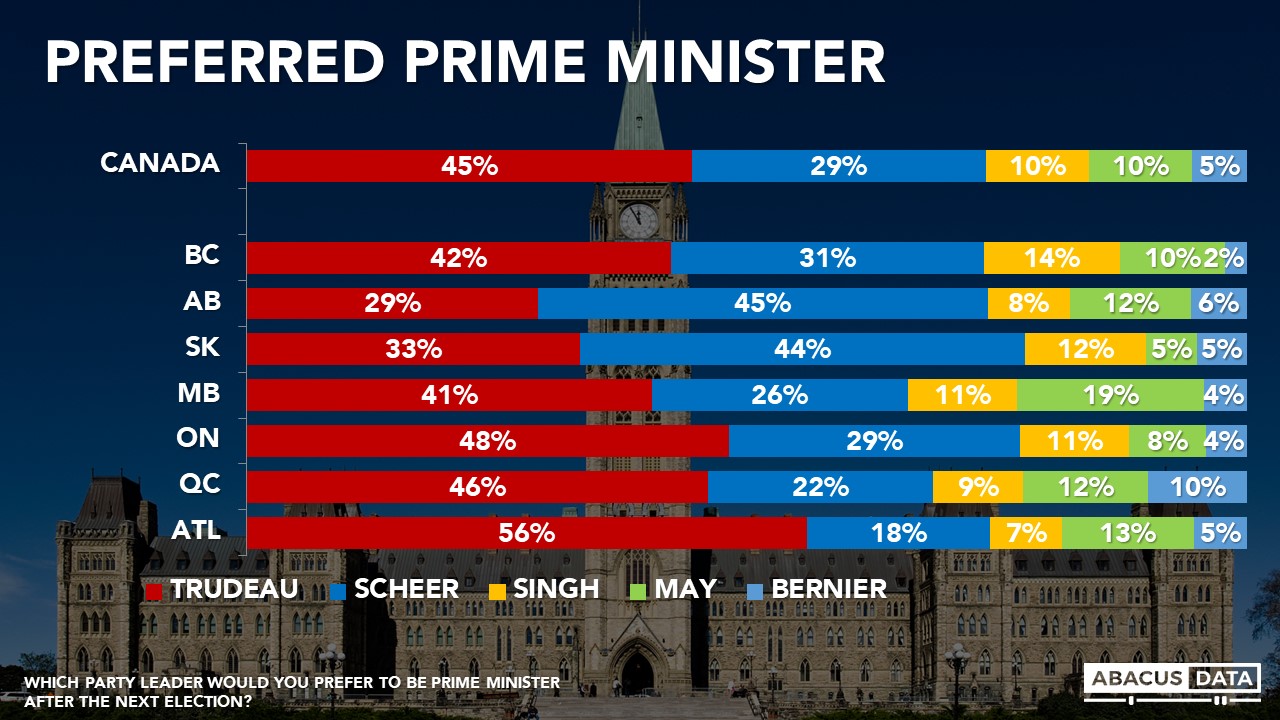
Worth noting is that among NDP voters, Trudeau is three times more likely to be preferred as PM compared to Mr. Scheer. Mr. Trudeau also has a significant advantage over Mr. Scheer among Green Party and BQ voters.
Among those who identify as being on the “left” of the spectrum, 59% would prefer Trudeau as PM compared with 16% for Singh, 13% for May, and 10% for Scheer.
PREFERRED ELECTION OUTCOME
Setting aside how they currently intend to vote, 39% say they would prefer to see a Liberal government after the next election, compared to 33% who would like to see the Conservatives win. Just 15% would like to see an NDP government.

In BC the gap is 36-32 in favour of the Liberals, in Ontario 40-34, in Quebec 45-22 and in Atlantic Canada 52-18. More would prefer a Conservative government after the next election in Alberta (55-25) and Saskatchewan (46-25).
UPSHOT
According to Bruce Anderson: “As was the case in 2015, the country seems to be heading for a competitive race, but so far it looks more like a two-party race than a three-party contest.
The Liberals have considerable regional advantages in Quebec and Atlantic Canada but face a strong challenge from the Conservatives in Ontario and BC.
Under the surface of these voting, intentions lie two potential advantages for the Liberal Party. While party voting intentions show a one-point gap, preferred Prime Minister reveals a 16-point advantage for Mr. Trudeau over Mr. Scheer. In our next release, we will review our latest data on the popularity of the leaders in more detail.
The second potential advantage for the Liberals lies in their lead as a second choice in a market where almost half say they may change their mind before election day. Among NDP, Green, and BQ voters, switching would tend to favour the Liberals over the Tories.
The recent movements are a reminder that no outcome can safely be predicted based on current attitudes – they are but a snapshot of current conditions and tendencies.”
According to David Coletto: “This is the closest federal horserace we’ve measured since the last election.
Thanks to large leads in Quebec and Atlantic Canada and a competitive position in BC and Ontario, the Liberals still have the advantage over the Conservatives. But about a third of former Liberal Party supporters now says they will support another party (26%) or are undecided (11%). Without engaging new voters or converting NDP, Conservative, or Green supporters, the Liberal majority will be difficult to replicate.
Despite a strong end to 2018 for the Conservatives, headwinds remain. The party’s accessible voter pool is smaller and big leads in Alberta and Saskatchewan are wasted when it comes to converting votes into seats. More importantly, fewer Canadians would consider the Conservatives as their second choice, meaning they have to convert far more of their potential supporters than the Liberals do.
Perhaps most challenging for the Conservatives to date is the general mood of the country. While most see danger and discord in the US and around the world, their sense of security at home is stronger. It’s hard to defeat an incumbent government when more feel positive than negative about where the country’s going.”
METHODOLOGY
Our survey was conducted online with 2,000 Canadians aged 18 and over from December 13 to 18, 2018. A random sample of panelists was invited to complete the survey from a set of partner panels based on the Lucid exchange platform. These partners are double opt-in survey panels, blended to manage out potential skews in the data from a single source.
The margin of error for a comparable probability-based random sample of the same size is +/- 2.5%, 19 times out of 20. The data were weighted according to census data to ensure that the sample matched Canada’s population according to age, gender, educational attainment, and region. Totals may not add up to 100 due to rounding.
ABOUT ABACUS DATA
We are the only research and strategy firm that helps organizations respond to the disruptive risks and opportunities in a world where demographics and technology are changing more quickly than ever.
We are an innovative, fast-growing public opinion and marketing research consultancy. We use the latest technology, sound science, and deep experience to generate top-flight research-based advice to our clients. We offer global research capacity with a strong focus on customer service, attention to detail and exceptional value.
Contact us with any questions.
Find out more about how we can help your organization by downloading our corporate profile and service offering.


