Advertising and Message Testing for Advocacy Campaigns: Ensuring Your Message Hits the Mark
In an increasingly complex and crowded information landscape, advocacy organizations, public affairs teams, and campaign strategists need to ensure their advertising and messaging truly resonate with the audiences they aim to influence. Getting it wrong means wasted resources, missed opportunities, and weakened impact. Getting it right can change minds, move hearts, and catalyze meaningful action. At Abacus Data, we offer advertising and message testing that serves as a crucial, independent audit—one that helps you determine if your creative will break through, engage your intended audience, and deliver the outcomes you need.
What We Do: Independent and Objective Message Testing
Our mission is to provide independent, data-driven testing of your ad concepts, messages, and creative strategies before you invest heavily in production or media placement. Unlike in-house research teams that can be unintentionally influenced by internal agendas or creative preferences, we serve as a neutral, third-party assessor. Think of our message testing as an impartial “audit” of your campaign’s creative approach.
We’re not here to pat you on the back. We’re here to help you understand if your idea works—or if it doesn’t—before it goes live.
This means we assess the strength of your messages, identify potential pitfalls, and uncover what truly resonates with your target audience. Whether you are testing television spots, digital ads, social media content, or print campaigns, our methodology ensures that you receive objective feedback grounded in robust public opinion research.
How We Do It: Rigorous Research That Reflects Your Real-World Challenges
At Abacus Data, our process starts by working closely with you to identify key objectives, target audiences, and the specific communication outcomes you hope to achieve. We know every advocacy campaign is unique, and we tailor our approach accordingly.
Discovery and Questionnaire Design:
We begin by understanding your campaign’s goals, the strategic environment you operate within, and the audiences you must engage. Are you looking to motivate grassroots supporters, influence policymakers, or sway undecided voters? With clarity on these points, we design a comprehensive research plan that tests your messages or ads under realistic conditions.
Fielding the Survey and Collecting Data:
We then field the survey to a representative sample of your intended audience. Using advanced sampling techniques and careful weighting, we ensure the data we gather reflects the demographic and attitudinal profiles you need to reach. Each participant sees the ad or reads the message in an environment that simulates how they might actually encounter it, giving you feedback that mirrors real-world reactions.
Analysis and Reporting:
Once data collection is complete, our team dives into the results. We break down which messages stand out, which points fall flat, and what aspects of your advertising leave participants confused or disengaged. Our analysis doesn’t simply tally up “likes” or “favorable impressions.” Instead, we dig deeper to understand why a message resonates, which audience segments respond most positively, and how to refine your approach for maximum impact. The final deliverable isn’t a list of raw data—it’s a tailored report highlighting key insights, strategic implications, and actionable recommendations.
Why We Are the Best: Expertise, Independence, and Proven Results
Abacus Data is Canada’s most sought-after public affairs research team for a reason. We we release a poll “Ottawa listens”.
At Abacus Data, we’ve built our reputation on delivering candid, evidence-based advice that helps our clients succeed. This starts with our team of seasoned researchers, each bringing extensive experience in public opinion research, political science, policy analysis, and communications. Led by Dr. David Coletto, our team is made up of senior researchers who have advanced degrees in political management, public affairs, and quantitative methods. Their diverse backgrounds ensure that you’re receiving the benefit of interdisciplinary thinking rooted in both rigorous academic training and real-world application.

But credentials are only half the story. Our independence sets us apart. We are not a creative agency, nor are we influenced by internal pressures to “make the ad look good.” We have no vested interest in validating your existing ideas—our sole focus is providing the most accurate, unbiased assessment possible. This independence ensures that when we say a message works, it’s because the data supports that conclusion—not because we want to protect anyone’s ego.
What to Do With the Research: Turning Insights into Effective Advocacy
Raw data only matters if it helps you make better decisions. With our advertising and message testing insights in hand, you’ll know exactly what next steps to take:
Refine Your Creative Concepts:
Identify which elements of your ad or message resonate most strongly and which should be revised or removed. Armed with evidence, you can work confidently with your creative team to make adjustments that truly strengthen your advocacy.
Optimize Your Media Strategy:
Our data can guide you on where, when, and how to deliver your messages. If younger audiences respond best to certain framing or a specific call-to-action, you can tailor the ad buy and creative approach to maximize that potential.
Support Internal Decision-Making:
Present clear, data-driven results to your internal stakeholders and leadership teams, demonstrating which messages are backed by concrete evidence. This can help unite your team behind a shared creative vision and alleviate internal debates about subjective preferences.
Elevate Your Campaign’s Credibility and Impact:
Confidently approach government decision-makers, partners, and supporters with messages proven to resonate. By showing them data that confirms your approach, you can bolster credibility, attract allies, and strengthen your advocacy position.
Ready to Get Started?
Don’t leave the effectiveness of your advocacy campaign’s advertising and messaging to chance.
Contact Yvonne Langen to set up a 15-minute initial consultation, and we’ll connect you with one of our senior researchers.
We’ll connect you with one of our senior researchers, who will listen to your needs, outline a custom testing plan, and begin turning your ideas into validated, data-driven messaging strategies.
In a cluttered communications landscape, having unbiased insights into what works and why is invaluable. With Abacus Data’s advertising and message testing services, you gain the confidence, clarity, and strategic direction needed to ensure your messages don’t just reach your audience—they connect, engage, and persuade them to take action.
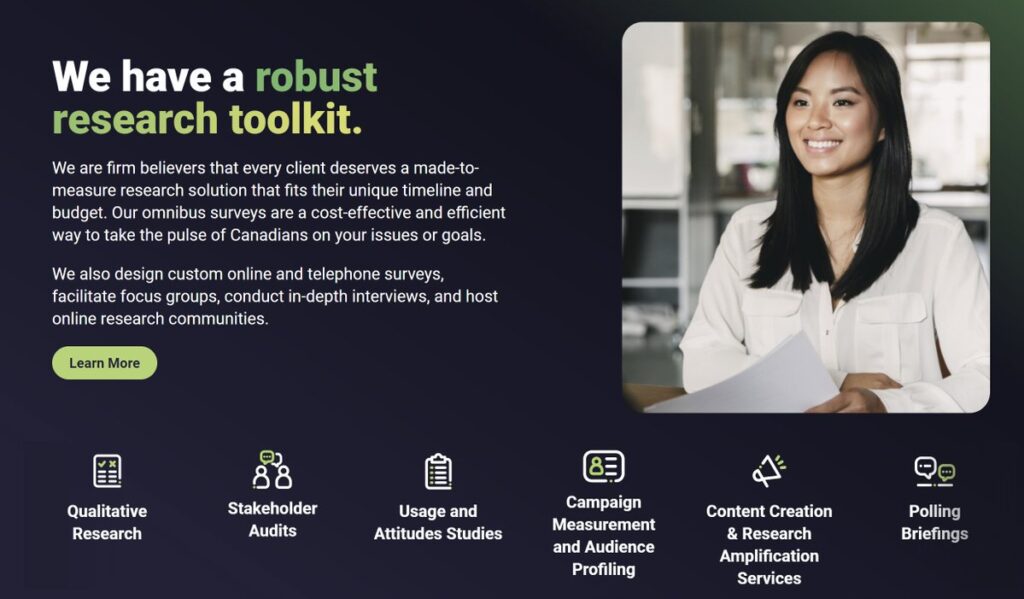
ABOUT ABACUS DATA
We are Canada’s most sought-after, influential, and impactful polling and market research firm. We are hired by many of North America’s most respected and influential brands and organizations.
We use the latest technology, sound science, and deep experience to generate top-flight research-based advice to our clients. We offer global research capacity with a strong focus on customer service, attention to detail, and exceptional value.
And we are growing throughout all parts of Canada and the United States and have capacity for new clients who want high quality research insights with enlightened hospitality.
Our record speaks for itself: we were one of the most accurate pollsters conducting research during the 2021 Canadian election following up on our outstanding record in the 2019, 2015, and 2011 federal elections.
Contact us with any questions.
Find out more about how we can help your organization by downloading our corporate profile and service offering.