Health Insurance and Health Priorities

This is a summary of a major public opinion study conducted by Abacus Data, using an online methodology, for the Canadian Life and Health Insurance Association. The sample size for the survey was 3,800 adult Canadians and the fieldwork was conducted from January 31 to February 14, 2022. The margin of error for a comparable probability sample is 1.6%, 19 times out of 20.

SATISFACTION WITH HEALTH CARE IN CANADA

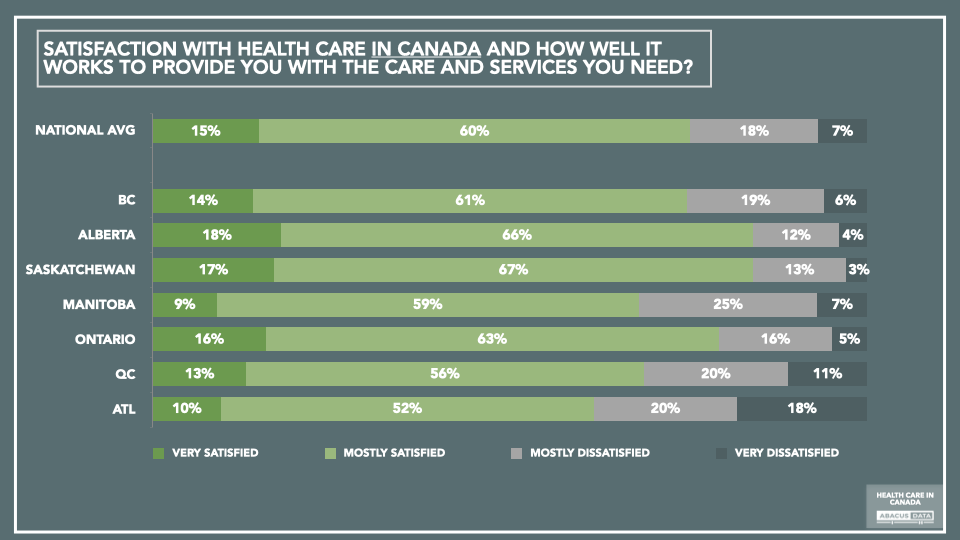
While health care is often discussed as one of the top priorities for most Canadians, this can sometimes obscure the fact that three out of four people say they are generally satisfied with the way the health care system works for them.

Satisfaction levels don’t vary by income level. BC, Saskatchewan, and Ontario residents show higher levels of satisfaction than Alberta, Manitoba, Quebec, and Atlantic Canadians. Dissatisfaction is highest among women under 45.

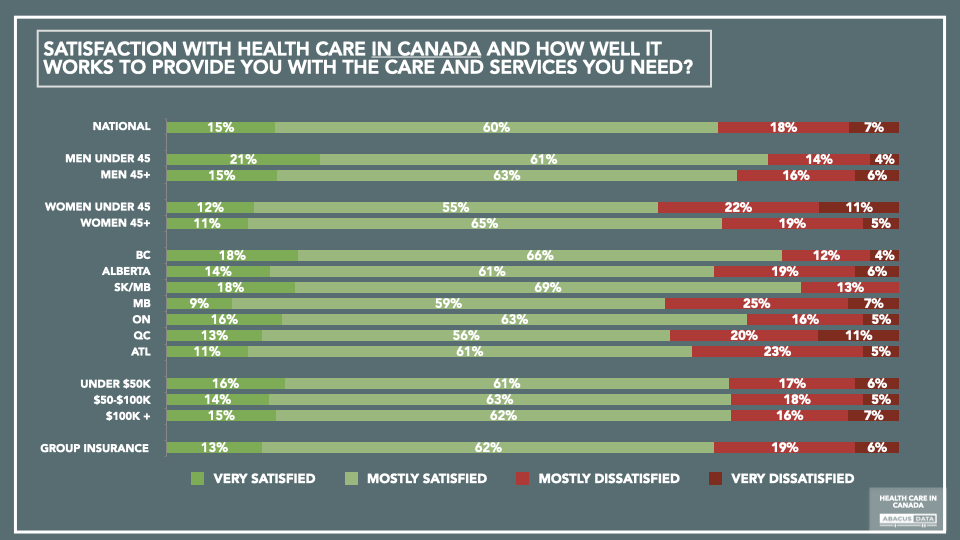
While many areas of public policy show marked differences by partisan affiliation or voting preferences, this is not so clear-cut when it comes to health care. More than 70% of those who voted for the Conservatives, Liberals, NDP, and Green parties all express general satisfaction with how the health care system serves their needs.

DETAILED SATISFACTION PROBING

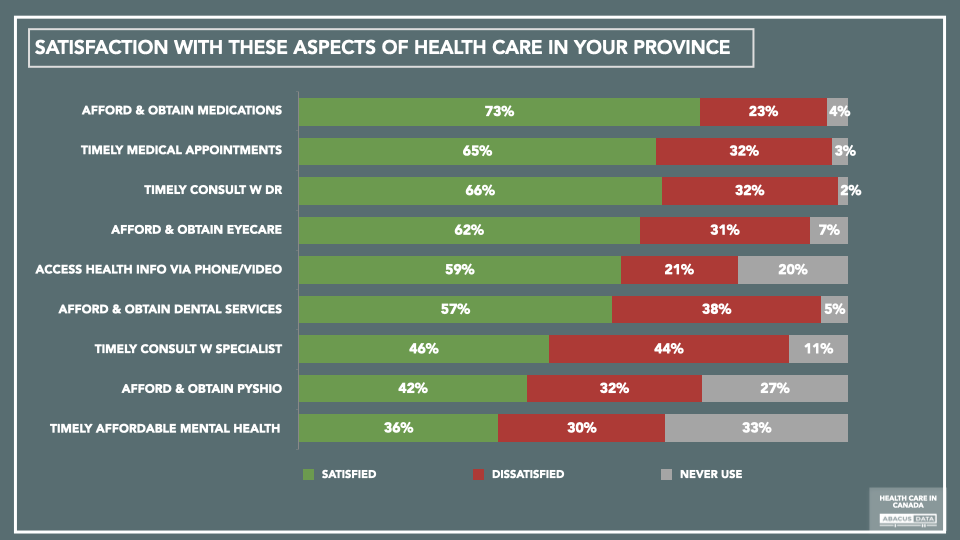
Not all aspects of the health care system generate the same level of satisfaction. At the top of the list of things that people are more likely to be satisfied with is their ability to afford and obtain the medications they need: 73% are satisfied, 23% dissatisfied, and 4% don’t use this form of health service enough to have formed an opinion. Also highly rated is the ability to access health information using phone or video services (virtual health care) with 59% satisfied, 21% dissatisfied, and 20% unable to have formed an opinion yet.

Dissatisfaction is about one in three when it comes to being able to get timely appointments and consultations with a doctor, higher still when it comes to appointments with specialists. About a third are dissatisfied with the ability to afford and obtain eye care, physiotherapy, and dental care.

Among those who have accessed or looked to access mental health services satisfaction (36%) is almost equaled by dissatisfaction (30%).

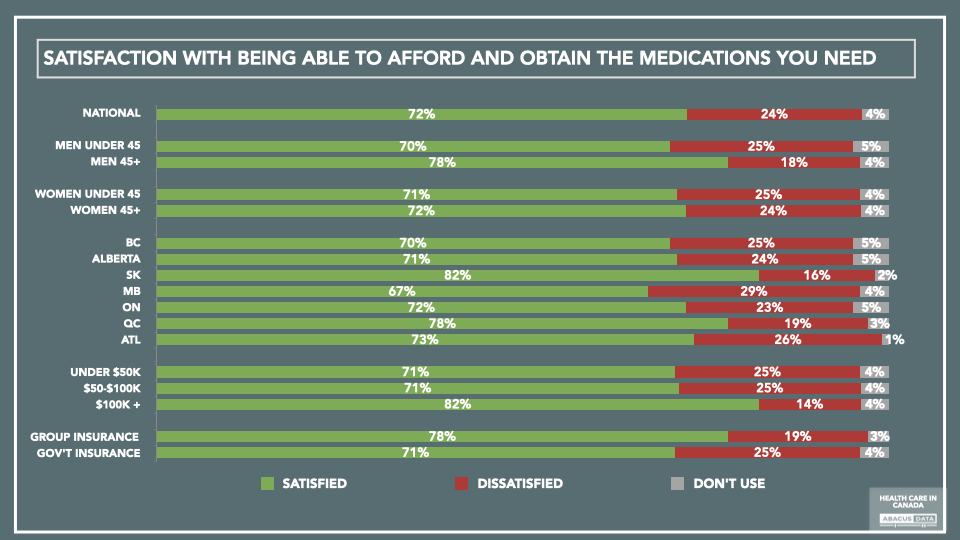
When it comes to satisfaction with affordability and access to medications there are few significant differences. Today, 78% of those who are able to access a group health benefits plan are satisfied with the affordability of their medicines.

IMPACT OF COVID

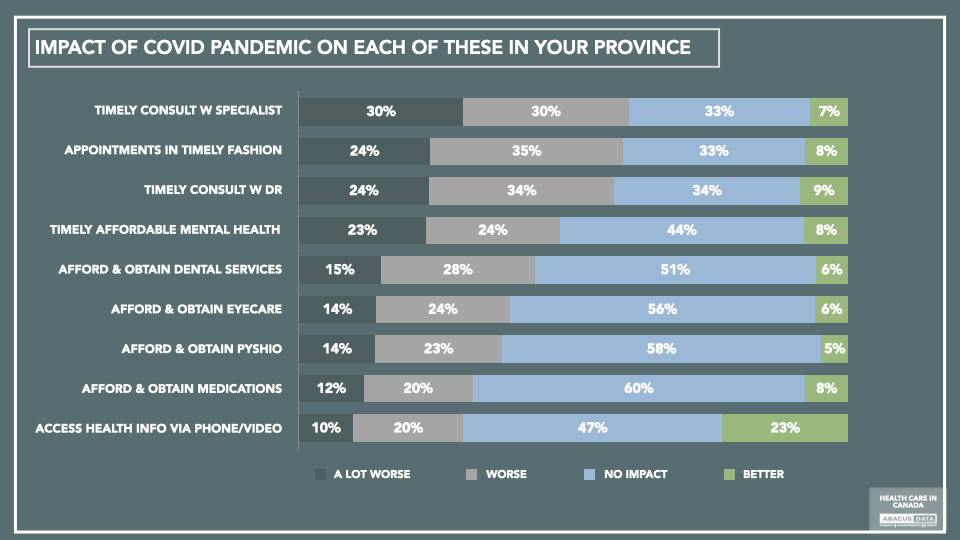
A majority of those surveyed felt that the COVID-19 pandemic made things worse in some aspects of the health system – specifically in terms of allowing for timely appointments with doctors and specialists. However, it is notable that almost as many (47%) said that being able to get timely and affordable mental health support was made more difficult by the pandemic.

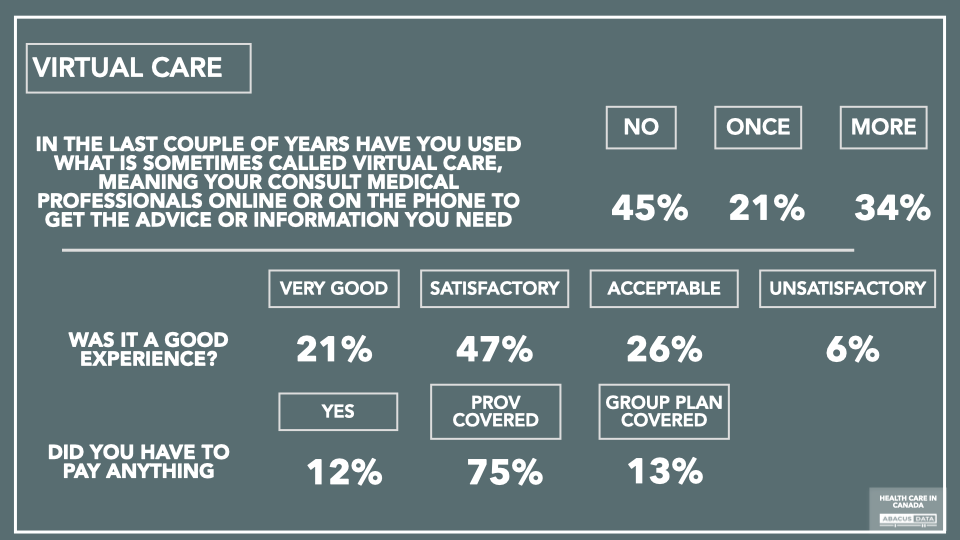
The only area where a significant number (albeit the minority) said that the pandemic had a positive impact was on virtual health – the idea of being able to consult health providers by phone or video. For those who used virtual health services, satisfaction levels are high.

SATISFACTION WITH EXTENDED HEALTH BENEFIT PLANS

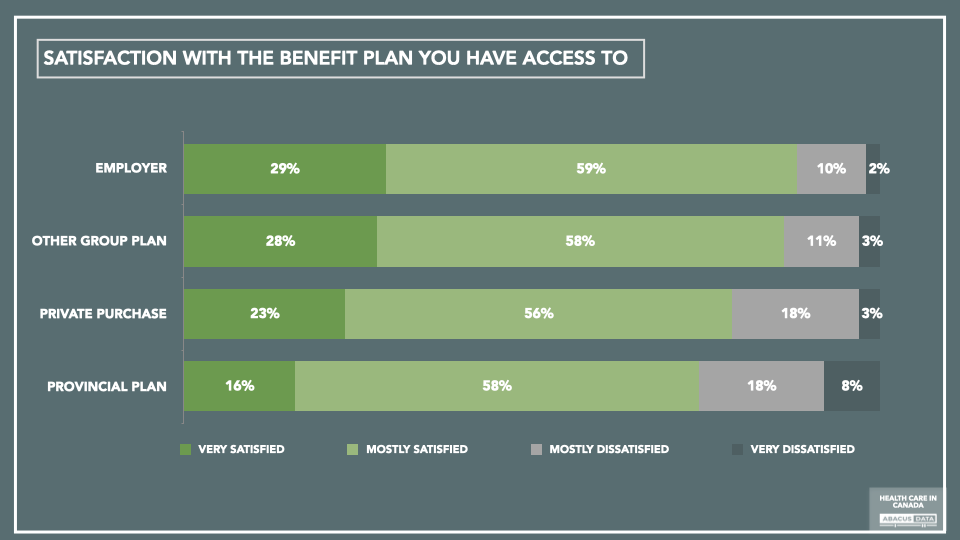
Canadians are generally satisfied with the health benefit plans available to them and see them as helpful in dealing with cost-of-living challenges. Among those who have access to an employer or another similar group plan, 86%-88% say they are very or mostly satisfied with these plans. Those who have privately purchased insurance are 80% satisfied, and those who have access to extended benefits through a provincial plan are 74% satisfied.

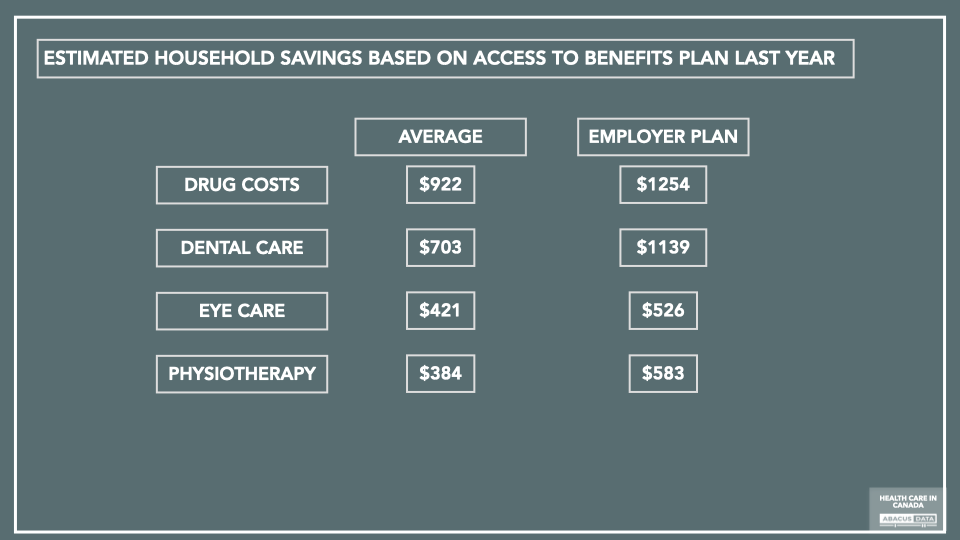
Those who have access to an extended benefits plan were asked to estimate the savings to their household when it came to drug costs, dental care, eye care, and physiotherapy. The estimated savings were extensive with an average of $922 in prescription drugs, $703 for dental care, $421 for eye care, and $384 for physiotherapy. Those with access to an employer benefits plan reported significantly above average savings.

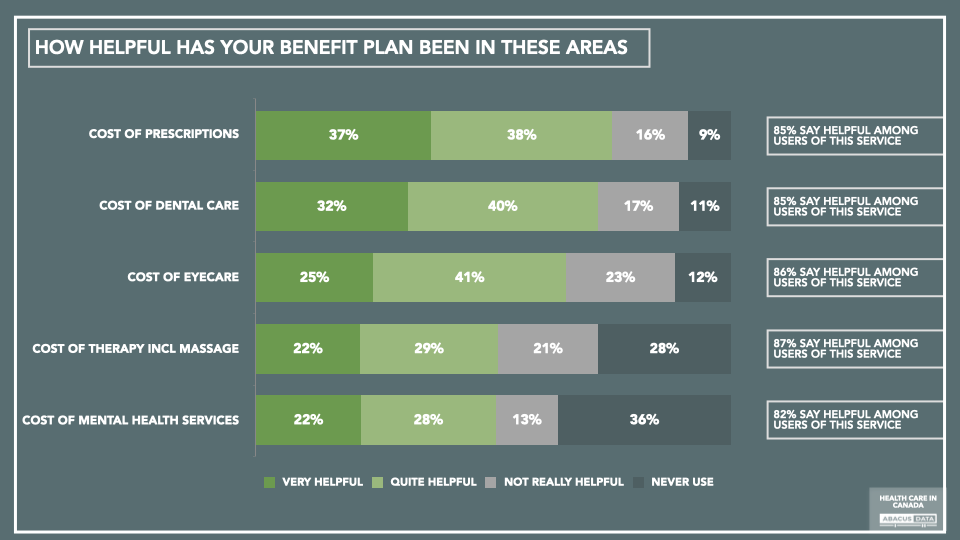
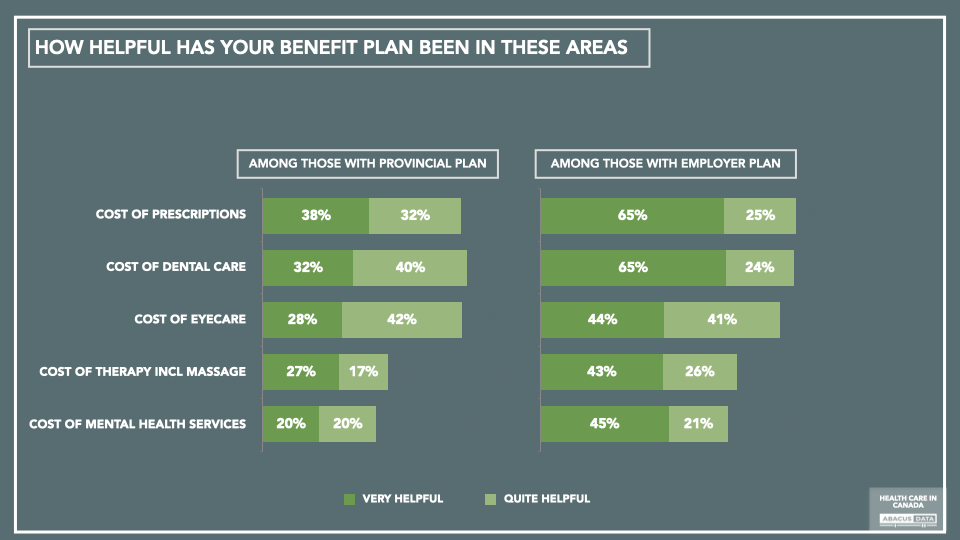
The large majority (85%) of those who have access to an extended benefits plan find it helpful with access and affordability for a variety of health services that they need to access, from prescriptions to mental health. Satisfaction levels are significantly stronger among those who have access to an employer benefit plan compared to those who access a provincial benefits plan.

GROUP INSURANCE AND PUBLIC HEALTH

Canadians are far more likely to see group benefit plans as something which increases the availability and affordability of health services in Canada (78%) rather than something that erodes the idea of universal coverage (28%).

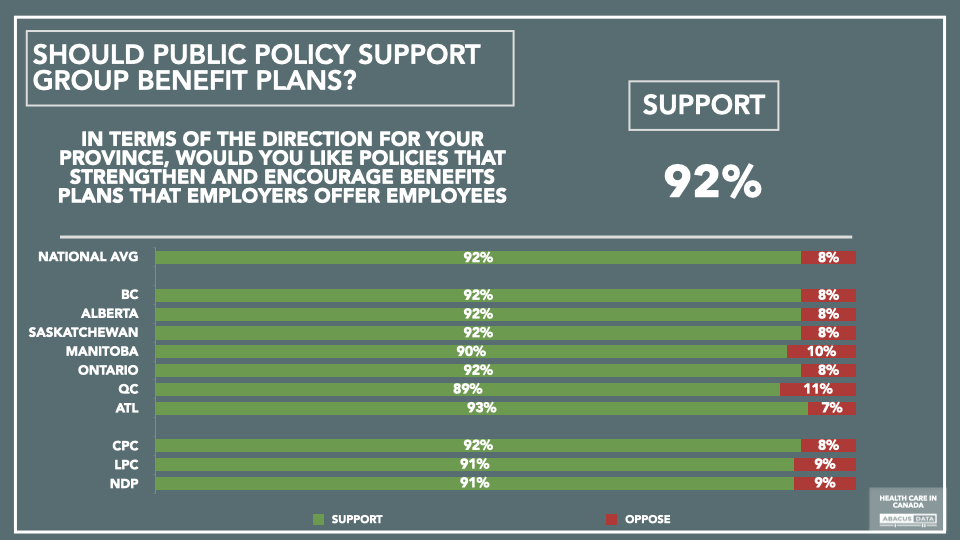
As a consequence of this view that group plans add rather than subtract from public health goals, across the country, and across the political spectrum, there is a virtually unanimous (92%) desire for public policies that strengthen and encourage the use of employer group plans.

PHARMACARE & THE PEI MODEL

For several years, our surveys have shown that Canadians would like to see public policies that ensure prescription drugs are affordable for those who do not currently have access to plans that help them with drug costs.

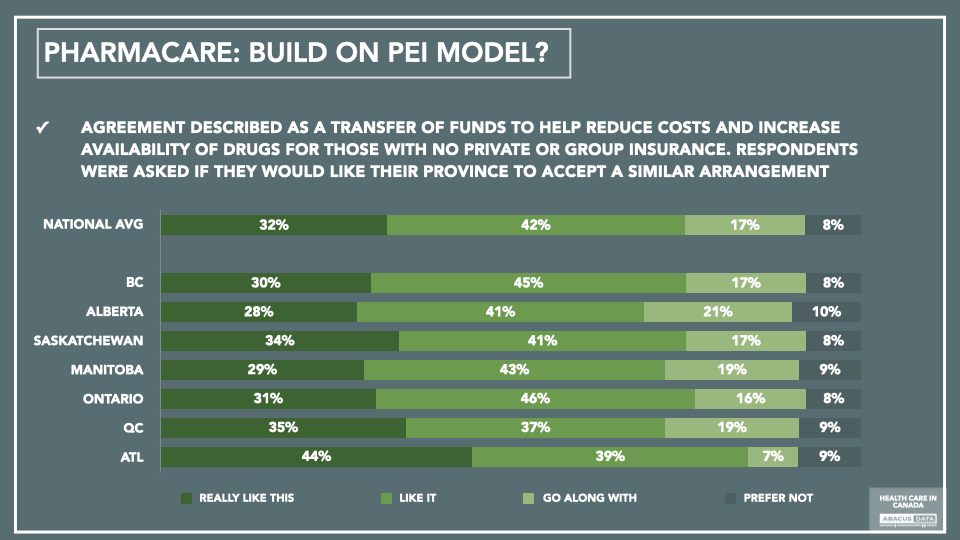
In this survey, we described the approach taken to introduce a version of Pharmacare in the province of PEI and found that by a wide margin Canadians would endorse a similar Pharmacare approach being taken in their own province – providing support for those who have no coverage today (72%) rather than causing everyone who has a plan to switch to a government plan which might cover the most common, but fewer drugs. (28%).

Across the country, an average of 74% would like their province to embrace a similar transfer of funds to provide this type of coverage, while only 8% would prefer not to see this happen.

DENTAL CARE

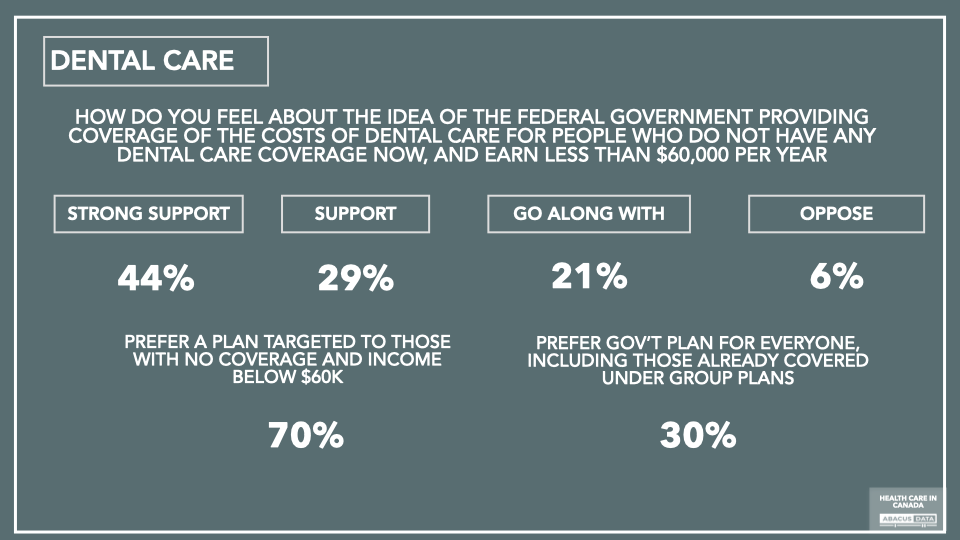
There is broad support for the idea of a federal initiative to ensure dental care coverage for those who do not have access to coverage under a current plan, and whose income falls below a $60,000 threshold. Only 6% oppose this idea and 44% express strong support.

Given a choice between the federal government providing a single program that provides coverage for everyone – including those who already have dental benefits – or an initiative focused on those with lower incomes and no coverage, the substantial majority (70%) prefer a targeted approach.

MENTAL HEALTH

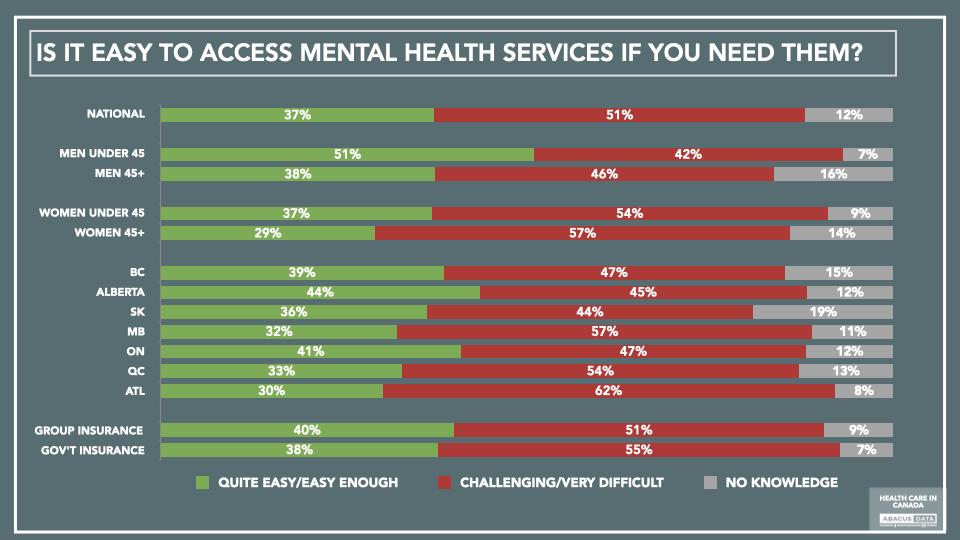
Our recent surveys have indicated a growing demand for mental health services and this survey contributes more evidence that people are finding it a challenge to get the services they need. Just under half say they have accessed mental health services, regularly (12%) or from time to time (30%). More people say it is difficult than say it is easy to get mental health services.

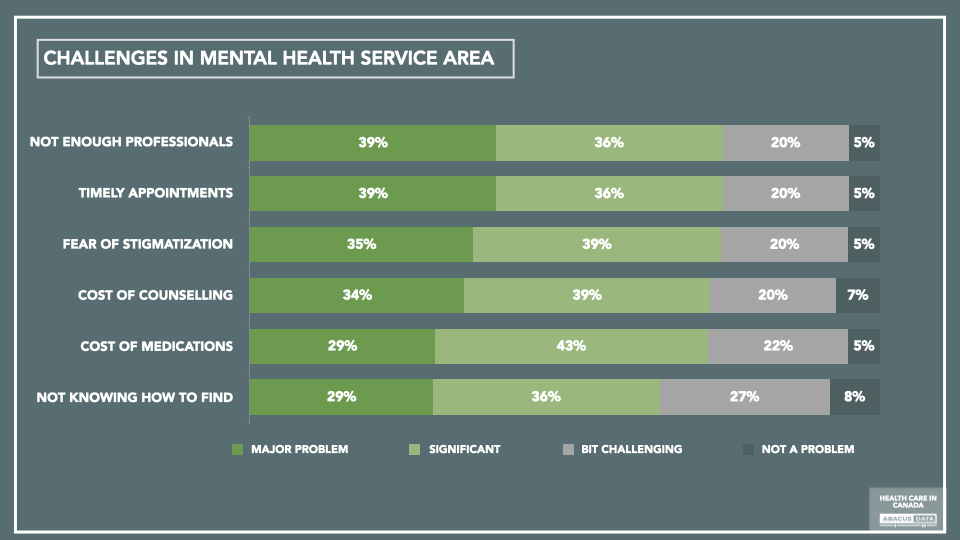
Many people see challenges in terms of the number of professionals available to provide mental health services, the availability of timely appointments, the cost of counselling and medications. A large majority also see the fear of stigmatization as a major or significant problem.

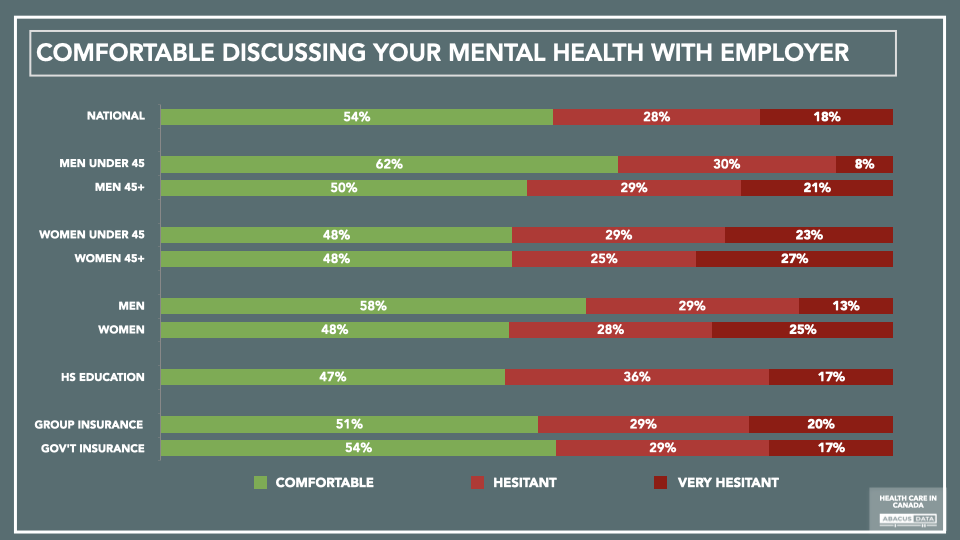
While just over half (54%) say they would feel comfortable discussing their mental health with their employer, almost as many say they would be hesitant (46%). Women indicate 11-point higher levels of hesitancy.

CONCLUSIONS

Most Canadians are satisfied with how Canada’s health care system meets their needs but there are some areas where satisfaction is lower and others where it is higher. People are relatively satisfied with their ability to access affordable medications, but timely access to specialists, the cost of dental care and access to mental health services are more challenging.

Covid has made accessing appointments more challenging, but at the same time there was growth in the use of virtual medicine, and a desire to see more of this functionality in the future.

Canadians consider extended health benefits plans that are in place today highly beneficial in terms of saving them money. This is especially true for those who have access to group insurance plans where the average person indicates that they save significant amounts of money each year when it comes to drugs, eyecare, dental care, and physiotherapy.

Support remains broad for the idea of the government ensuring drug coverage for those who do not have access to such plans today, and there is a clear preference for a targeted plan rather than a single-payer, one program for all approach, which might cause some people to see their current benefits reduced.

There is a growing need for mental health services and a feeling that these are harder to access than is ideal. Looking through the breadth of results in this survey, mental health is probably the topic that reveals the greatest hope for improvement in terms of health system support today.

METHODOLOGY

The survey was conducted with 3,800 adult Canadians from January 31 to February 14, 2022. A random sample of panelists were invited to complete the survey from a set of partner panels based on the Lucid exchange platform. These partners are typically double opt-in survey panels, blended to manage out potential skews in the data from a single source.

The margin of error for a comparable probability-based random sample of the same size is +/- 1.6%, 19 times out of 20.

The data were weighted according to census data to ensure that the sample matched Canada’s population according to age, gender, educational attainment, and region. Totals may not add up to 100 due to rounding.

This survey was paid for by the Canadian Life and Health Insurance Association.

ABOUT ABACUS DATA

We are the only research and strategy firm that helps organizations respond to the disruptive risks and opportunities in a world where demographics and technology are changing more quickly than ever.

We are an innovative, fast-growing public opinion and marketing research consultancy. We use the latest technology, sound science, and deep experience to generate top-flight research-based advice to our clients. We offer global research capacity with a strong focus on customer service, attention to detail, and exceptional value.

We were one of the most accurate pollsters conducting research during the 2021 Canadian election following up on our outstanding record in 2019.

Go Canada Go: How Canadians are reacting to the men’s soccer qualifying for the World Cup

With news that the Canadian men’s soccer team qualified for the 2022 World Cup taking place later this year in Qatar, we wanted to understand how Canadians feel about it and whether they will be cheering on Team Canada.

Now, I admit, I’m not a huge fan of soccer. As an Italian-Canadian, I often get engaged and interested in the World Cup through the excitement of family and friends – many of whom were disappointed that Italy didn’t qualify for the World Cup this year

THE CONTEXT: 2 IN 5 CANADIANS ARE SOCCER FANS

Overall, 2 in 5 Canadians say they are either big or casusal fans of soccer. This is about average for other sports we tested as well. NHL hockey remains the most popular sport (64% are fans) followed by the other three major North American professional sports leagues. About as many people are fans of soccer as they are of CFL football, NBA basketball, and tennis.

Soccer fans tend to be male, younger, and concentrated in Ontario, Alberta, and British Columbia. They are more likely to have a university education and live in urban or suburban communities across the country.

THE CONTEXT: ABOUT A THIRD OF CANADIANS USUALLY FOLLOW THE WORLD CUP CLOSELY OR SOMEWHAT.

When asked how closely they usually follow the World Cup, 12% said they follow it closely while another 23% follow it somewhat. 44% don’t follow it at all.

SIX IN TEN ARE AWARE THAT TEAM CANADA QUALIFIED FOR THE 2022 WORLD CUP

Just over six in ten Canadians said they were aware that the Canadian men’s soccer team qualified for the 2022 World Cup. Those who are fans of the sport, not surprisingly, were far more likely to be aware, although even half of non-fans knew the team qualified.

1 IN 3 CANADIANS SAY THEY WILL FOLLOW THE WORLD CUP MORE CLOSELY THIS YEAR BECAUSE TEAM CANADA QUALIFIED.

Team Canada’s entry into the tournament has increased interest in the World Cup for about 1 in 3 Canadians. Another 15% say they are less interested this year than in the past. Of note, 1 in 5 non-fans of soccer say they will follow the tournament more closely because Team Canada has qualified.

MORE THAN 60% OF CANADIANS WILL BE CHEERING FOR TEAM CANADA AT THE WORLD CUP

When asked who they will be cheering for at this year’s World Cup, 52% said they would only be cheering for Team Canada, 9% said they would be cheering for Team Canada and another team, while 5% said they would be cheering for a team other than Team Canada.

Among big fans of soccer, 67% will be cheering for Team Canada while another 23% have dual loyalties. 10% will be cheering for another team besides Team Canada.

Interestingly, Quebecers were the least likely to say they would be cheering for Team Canada. Moreover, younger Canadians were more likely to cheer for another team than older Canadians.

UPSHOT

According to David Coletto: “For the first time in more than 30 years, Canadians will be able to cheer on their home team at a men’s World Cup. Millions plan to follow the tournament more closely than they typically do, offering the sport a chance to engage an even larger audience and promote interest in the sport. Right now, 4 in 10 Canadians consider themselves fans of soccer. If Team Canada continues to surprise and delight fans, expect that to grow after the World Cup wraps this fall in Qatar.”

METHODOLOGY

The survey was conducted with 2,000 Canadians from April 4th to 9th, 2022. A random sample of panelists were invited to complete the survey from a set of partner panels based on the Lucid exchange platform. These partners are typically double opt-in survey panels, blended to manage out potential skews in the data from a single source.

The margin of error for a comparable probability-based random sample of the same size is +/- 2.19% 19 times out of 20.

The data were weighted according to census data to ensure that the sample matched Canada’s population according to age, gender, educational attainment, and region. Totals may not add up to 100 due to rounding.

This survey was paid for by Abacus Data Inc.

Abacus Data follows the CRIC Public Opinion Research Standards and Disclosure Requirements that can be found here:  https://canadianresearchinsightscouncil.ca/standards/

ABOUT ABACUS DATA

We are the only research and strategy firm that helps organizations respond to the disruptive risks and opportunities in a world where demographics and technology are changing more quickly than ever.

We are an innovative, fast-growing public opinion and marketing research consultancy. We use the latest technology, sound science, and deep experience to generate top-flight research-based advice to our clients. We offer global research capacity with a strong focus on customer service, attention to detail, and exceptional value.

We were one of the most accurate pollsters conducting research during the 2021 Canadian election following up on our outstanding record in 2019.

Contact us with any questions.

Find out more about how we can help your organization by downloading our corporate profile and service offering.

Ontario PCs lead by 4 as Doug Ford’s image and performance rating improves

As we head towards the 2022 Ontario provincial election, our team at Abacus Data will be conducting regular surveys to gauge public opinion and reaction to the campaign. Clients interested in purchasing questions on our Ontario survey should reach out to Yvonne Langen.

In our first survey of the Ontario election season, we interviewed 1,500 eligible voters in the province from April 14 to 19, 2022.

Here’s what we found:

THE VOTER MINDSET IN ONTARIO

About an equal number of Ontarians feel the province is headed in the right direction than feel it is off on the wrong track. At the same time, 25% describe the current Ontario economy as excellent or good, 37% feel it is acceptable, and 38% describe it as terrible or poor.

As inflation hits a 31-year high in Canada, 62% of Ontarians say their household income is falling behind their cost of living. 26% say it is about even while 11% report their income is rising faster than the cost of living.

COST OF LIVING, HOUSING, HEALTHCARE & TAXES ARE THE TOP ISSUES DRIVING VOTES

When asked to select the three issues that are most likely to impact their votes, half of Ontarians rate reducing the cost of living as their top issue, followed by housing affordability and accessibility, improving the healthcare system, and keeping taxes from going up or reducing them.

Another 1 in 4 rated growing the economy and creating good jobs as a top issue while 22% selected responding to the COVID-19 pandemic. Furthermore, 20% rated fighting climate change and protecting the environment as a top issue.

Looking at generational differences on top issues, both millennials and older generations are just as likely to select reducing the cost of living while millennials were 10-points more likely to pick housing affordability than older generations.

Older generations were 15-points more likely to pick improving the healthcare system, 4-points more likely to pick tax improvements, and 5-points more likely to pick growing the economy. Not surprisingly, older Ontarians were much more likely to pick long-term care and seniors care as a top issue (25% vs. 11%) when compared with millennials.

When we compare those who would currently vote PC to others in the province, PC voters were more likely to select reducing the cost of living (55% vs. 46%), keeping taxes from going up (39% vs. 23%) and growing the economy and creating good jobs (35% vs. 20%) as their top issues.

PC supporters were 12-points less likely to pick climate change and the environment as a top issue than other respondents (13% vs. 25%).

61% RATE DOUG FORD’S PERFORMANCE AS PREMIER AS EXCELLENT, GOOD, OR ACCEPTABLE

When asked to rate Doug Ford’s performance as premier, 36% give Ford a positive score while 25% describe his performance as acceptable. 35% rate his performance as either poor or terrible.

Not surprisingly, there is a strong relationship between one’s performance evaluation of the premier and vote intention.

More than half of those who think the premier has done an excellent or good job say they would vote PC. Among those who think he has done an acceptable job, 38% would vote PC, 34% OLP, and 18% NDP.

Less than 10% of those who think he has done a poor or terrible job say they would vote PC.

When asked to rate the premier’s performance in specific areas, a majority think he has done a good or acceptable job leading the province through the pandemic (62%), making good decisions (56%), managing the healthcare system (52%) and managing the provincial economy (57%). Ford’s performance is less positive when it comes to education, reducing the cost of living, or making housing more affordable and accessible.

THE LEADERS

Overall, impressions of Doug Ford have improved since January. Today, 41% have a positive impression of the premier (up 9 points) while 38% have a negative impression (down 8) for a net score of +3. This is the best net impression score for the premier since early 2021 and far better than before the pandemic started.

In contrast, all three main opposition leaders have net negative impression scores. Andrea Horwath is about even (31% positive and 30% negative, net score +1), Steven Del Duca (22% positive, 27% negative, net score -5), and Mike Schreiner (16% positive, 19% negative, net score -3) net negatively.

When tracking how well Ontarians know each of the major provincial party leaders, three of four have seen an increase in those saying they know the leader very or pretty well. However, a sizeable portion of the electorate still doesn’t know the three opposition party leaders that well.

BEST PREMIER: FORD LEADS BY 18

When asked who they thought would make the best premier, 35% selected Doug Ford, followed by NDP leader Andrea Horwath at 17% and Steven Del Duca at 12%. This is a sharp contrast to vote intention which finds the PCs ahead only by 4 over the Liberals (more on this below).

When we compare perceptions about the best premier with vote intention, 81% of those who would vote PC say Doug Ford would make the best premier. In contrast, supporters of other parties are less convinced that the leader of the party they would vote for would be the best premier. For example, among NDP supporters, 58% think Andrea Horwath would make the best premier. Among OLP supporters, only 37% think Steven Del Duca would make the best premier. This shows that vote intention, at least at this point, is strongly correlated to who people think will make the best premier. We will watch this closely as the campaign begins and people become more familiar with the opposition leaders.


THE DESIRE FOR CHANGE

Right now, about half of Ontarians (49%) say they definitely want to see a change in government. That’s pretty consistent with our last survey in January which found 50% definitely wanted a change in government. Another 20% say it would be good to have a change, but it isn’t that important to them.

18% definitely want to see the PCs and Doug Ford re-elected while 13% say it would be good to continue with the same party in power, but it’s not that important to them.

When we compare these results with the desire for change on the final weekend of the federal election or the week before the 2018 Ontario election, we find that the desire for change mimics what we saw federally in 2021 and is very different from the environment near the end of the 2018 Ontario election.

Among those who want to see a change in government, we asked what kind of change they want: big change from the PC government or some change that doesn’t move too quickly.

Overall, 57% of change voters want to see a big shift in direction while 43% want a more subtle change. Not surprisingly, those who definitely want a change in government are more likely to want to see big change than those who want change but say it’s not that important to them.

WHICH PARTY IS GOING TO WIN? MORE PICK THE PCs

A plurality of Ontarians believes the PC Party will win the upcoming election (37%) with 26% picking the Liberals. Only 12% feel the NDP will win. Overall, 24% are unsure who will win the election.

VOTE INTENTION: PCs LEAD BY 4 OVER THE OLP WITH THE NDP WELL BACK IN THIRD

When asked how they would vote if an election was held today, 36% of committed respondents would vote PC followed by the Ontario Liberals at 32% and the NDP at 23%. The Greens are at 6% while 4% would vote for another party.

Compared with our last survey in January, the PCs are down 1, the OLP is up 4 while the NDP is down 2.

Regionally, the PCs lead in the GTHA, eastern Ontario, southwestern Ontario, and in the north while the Liberals have an 11-point lead in Metro Toronto.

Age continues to play a key role in vote intention. Older Ontarians are far more likely to say they will vote PC than younger Ontarians.

Vaccination status is also related to voting intention. Among those with 1 or fewer COVID shots, the PCs lead the NDP by 22-points while among those with 3 or more doses, the PCs lead by 5. Among those who have only 2 doses, the OLP has a 7-point lead over the PCs.

When we compare federal vote with current provincial vote intention, 78% of federal Conservative voters would vote PC today while 76% of federal NDP voters would vote for the Ontario NDP. Among federal Liberal voters, 67% would vote OLP while 17% would vote NDP and 14% would vote PC. Among those who voted for the People’s Party federally, 34% would vote PC while 20% would vote for another party.

UPSHOT

According to David Coletto: “With only a few weeks until the 2022 Ontario election kicks off, the opinion environment favours the PCs and Doug Ford. However, too many variables remain in play to make any prediction about how the election might unfold. In the lead-up to the campaign, Doug Ford’s personal image has improved markedly since earlier this year. He is now net positive and he’s less polarizing than he has been over the past year.

The cost of living is top of mind for more voters as housing, healthcare, and taxes round out the list of top issues. The PCs and Doug Ford have a natural advantage on that matter but are not immune to criticism about how their government has handled the issue.

While about half of Ontarians definitely want a change in government, the desire for change isn’t at a level where a PC re-election is in peril. The federal Liberals faced a similar environment in the lead-up to that vote.

Although the Ontario Liberals are within striking distance in the hypothetical ballot, other results in this survey suggest they still have a lot of work to do if they are going to win the election. Steven Del Duca remains unknown to a large portion of the electorate and those that do have an impression of him are more likely to view him negatively than positively. He is well back in third when respondents are asked who will make the best premier. What is unknown at this point is whether vote intention will align more closely with the perceived best premier or whether the Liberals can hold onto their support despite how people feel about Mr. Del Duca.

The Ontario NDP and leader Andrea Horwath have a more challenging path to replicate gains made in 2018 or even contest for power. Despite being the leader for over 13 years, many Ontarians still don’t know much about her and her net favourable rating is even. Worse, only 12% of Ontarians think the NDP will win the election, half as many who think the Ontario Liberals will win. If the NDP falls too far behind the Liberals, there is a real risk that change voters will consolidate around the Liberals.”

[sc name=”signup”]

METHODOLOGY

The survey was conducted with 1,500 eligible voters in Ontario from April 14 to 19, 2022. A random sample of panelists were invited to complete the survey from a set of partner panels based on the Lucid exchange platform. These partners are typically double opt-in survey panels, blended to manage out potential skews in the data from a single source.

The margin of error for a comparable probability-based random sample of the same size is +/- 2.1% 19 times out of 20.

The data were weighted according to census data to ensure that the sample matched Canada’s population according to age, gender, educational attainment, and region. Totals may not add up to 100 due to rounding.

This survey was paid for by Abacus Data Inc.

Abacus Data follows the CRIC Public Opinion Research Standards and Disclosure Requirements that can be found here:  https://canadianresearchinsightscouncil.ca/standards/

ABOUT ABACUS DATA

We are the only research and strategy firm that helps organizations respond to the disruptive risks and opportunities in a world where demographics and technology are changing more quickly than ever.

We are an innovative, fast-growing public opinion and marketing research consultancy. We use the latest technology, sound science, and deep experience to generate top-flight research-based advice to our clients. We offer global research capacity with a strong focus on customer service, attention to detail, and exceptional value.

We were one of the most accurate pollsters conducting research during the 2021 Canadian election following up on our outstanding record in 2019.

Contact us with any questions.

Find out more about how we can help your organization by downloading our corporate profile and service offering.

COVID anxiety moderate to low: 6th wave hasn’t caused a spike in fear

We recently completed a national survey with a sample of 2,000 Canadians from April 4 to 9, 2022.

WORRIED ABOUT COVID TODAY

Just under 1 in 5 people in Canada indicate they are extremely or very worried about Covid 19 today, while 59% say they are not very concerned or only a little bit concerned. Concern levels are modestly higher among older than younger people. Those who are vaccinated are more concerned than those who aren’t, by a wide margin.

IS YOUR ANXIETY RISING OR FALLING?

Roughly equal numbers of people say they have been more worried (29%) in recent days as say they have become less worried (27%). The number of people who say they have become more worried is up slightly from February but is one of the lower levels we’ve seen over the two years we’ve been tracking this indicator.

IS THE WORST BEHIND US?

The number of people who feel the worst of Covid is yet to come is 16%, which is actually down from the 25% we measured in January. Forty (40%) percent say the worst is behind us now, close to the highest number we’ve measured in two years.

THE UPSHOT

According to Bruce Anderson:

“The 6th wave of the Covid pandemic has had a far weaker impact on public anxiety than the waves that preceded it. This is undoubtedly because so many people are vaccinated but also because as the number of cases rose dramatically, more and more people either experienced firsthand, or heard from those they know, that their symptoms were manageable and that the strains on the health system were limited.“

METHODOLOGY

The survey was conducted with 2,000 Canadian adults from August 4 to 9, 2022. A random sample of panelists were invited to complete the survey from a set of partner panels based on the Lucid exchange platform. These partners are typically double opt-in survey panels, blended to manage out potential skews in the data from a single source.

The margin of error for a comparable probability-based random sample of the same size is +/- 2.1% 19 times out of 20.

The data were weighted according to census data to ensure that the sample matched Canada’s population according to age, gender, educational attainment, and region. Totals may not add up to 100 due to rounding.

This survey was paid for by Abacus Data Inc.

Abacus Data follows the CRIC Public Opinion Research Standards and Disclosure Requirements that can be found here:  https://canadianresearchinsightscouncil.ca/standards/

ABOUT ABACUS DATA

We are the only research and strategy firm that helps organizations respond to the disruptive risks and opportunities in a world where demographics and technology are changing more quickly than ever.

We are an innovative, fast-growing public opinion and marketing research consultancy. We use the latest technology, sound science, and deep experience to generate top-flight research-based advice to our clients. We offer global research capacity with a strong focus on customer service, attention to detail and exceptional value.

We were one of the most accurate pollsters conducting research during the 2021 Canadian election following up on our outstanding record in 2019.

Contact us with any questions.

Find out more about how we can help your organization by downloading our corporate profile and service offering.

Liberals and Conservatives statistically tied as the opinion environment holds steady amid global and domestic shocks.

We recently completed a national survey with a sample of 2,000 Canadian adults from April 4 to 9, 2022. Most of the interviews were completed prior to the federal budget released on April 7.

Yesterday, we shared some data on how Canadians might react to Pierre Poilievre’s campaign narrative. Today, we look at the broader political opinion environment.

MOOD OF THE COUNTRY & GOVERNMENT APPROVAL

The mood of the country is little changed from last month, with 39% thinking the country is headed in the right direction, and 46% think it’s off on the wrong track. Canadians continue to see the situation in the US and around the world as worse than Canada’s context: just 26% feel the US and the world are heading in the right direction.

Approval of the federal government is also steady with 41% approving (+1) and 44% disapproving (+2). Approval is up 3-points since early February and in line with levels observed throughout much of last year.

Net approval (approve – disapprove) is – 3 nationally +2 in BC, -28 in Alberta, -6 in Saskatchewan and Manitoba, -2 in Ontario, -2 in Quebec, and +16 in Atlantic Canada.

Among those who voted NDP in 2021, 38% approve of the federal government’s job performance compared with just 14% among those who voted Conservative.

LEADER IMPRESSIONS

Since last month, Justin Trudeau’s personal image has slid a bit to levels we saw in February. With 36% positive impressions and 45% negative Mr. Trudeau’s net score is –9. Among Liberal voters, 76% have a positive impression of Mr. Trudeau while 31% of NDP and 22% of Green Party voters feel positive about him. 79% of Conservative Party voters have a negative view of the PM.

Positive impressions of NDP Leader Jagmeet Singh exactly the same as last month. Today, he enjoys a positive impression among 41% and finds negative impressions among 28% for a net score of +13.

79% of NDP voters have a positive impression of Mr. Singh as do half of Liberal voters (54%). 1 in 5 Conservative voters have a positive view of him while 57% view him negatively.

Today, 23% have a positive impression of interim Conservative leader Candice Bergen (+1 since last month) while her negatives are at 30% (unchanged) for a net score of -7. Mr. O’Toole finished his time as leader with a net favourability of -25.

VOTING INTENTION

If an election were held now, the Liberals would be marginally ahead of the Conservatives in the popular vote – 33% to 31%. The NDP is at 18% nationally while the BQ is at 8%, the People’s Party is at 5%, and the Greens at 4%.

Compared to our results at the end of March, Liberal vote is up 2, Conservatives down 2, NDP up 1. Compared to the election result last November, Liberals have gained a point and Conservatives have lost three points.

BC: Conservatives are at 32%, and the Liberals at 31% and the NDP at 27%.

Alberta: 51% would vote Conservative compared with 23% for the NDP, 15% for the Liberal Party, and 5% for the People’s Party.

Manitoba and Saskatchewan: The Conservatives lead with 38% followed by the Liberals at 28%, NDP at 23%, and the People’s Party at 7%.

Ontario: The Liberals lead by 4 over the Conservatives (38% to 34%) with the NDP in third at 17%. The People’s Party is polling at 7% in Ontario. In Toronto and the GTHA (where 58% of the population lives), the Liberals are at 43%, the Conservatives at 33% and the NDP at 16%.

Quebec: We see the BQ and Liberals basically tied (37% to 34%) with the Conservatives at 15%, the NDP at 9%.

Atlantic: The Liberals are well ahead of the Conservatives (45% to 26%) with the NDP in third at 15%.

UPSHOT

According to Bruce Anderson: “With a war in Ukraine, rising inflation, a Liberal-NDP alliance, and a sixth wave of the pandemic, there is no shortage of factors that could cause the political mood of the country to shift – but so far opinions continue to trade in a fairly narrow range. While voting intention numbers don’t reveal it, Liberals will note that the disapproval numbers for the government and negative opinions of Mr. Trudeau have been notching a little bit higher in the first quarter of 2022 than through most of 2021. This could be a signal that fatigue with the incumbents has been creeping upward a bit, but it could also be a reaction to inflation and the stubbornness of the pandemic and the steps people are required to take to adapt to it”

According to David Coletto: “The political opinion environment has remained fairly stable despite many events competing for the public’s attention and concern including the invasion of Ukraine, the Liberal-NDP agreement, another COVID wave, interest rate increases, strong macro-economic indicators (unemployment rate), and rising inflation. If an election was held today, we would likely see a similar result to the last election. So far, little has happened that has fundamentally shifted the public’s preferences or impressions. We will continue to monitor the opinion environment as the Conservative leadership race unfolds and as Ontarians gear up to vote in the upcoming provincial election.”

[sc name=”signup”]

METHODOLOGY

The survey was conducted with 2,000 Canadian adults from April 4 to 9, 2022. A random sample of panelists were invited to complete the survey from a set of partner panels based on the Lucid exchange platform. These partners are typically double opt-in survey panels, blended to manage out potential skews in the data from a single source.

The margin of error for a comparable probability-based random sample of the same size is +/- 2.1% 19 times out of 20.

The data were weighted according to census data to ensure that the sample matched Canada’s population according to age, gender, educational attainment, and region. Totals may not add up to 100 due to rounding.

This survey was paid for by Abacus Data Inc.

Abacus Data follows the CRIC Public Opinion Research Standards and Disclosure Requirements that can be found here:  https://canadianresearchinsightscouncil.ca/standards/

ABOUT ABACUS DATA

We are the only research and strategy firm that helps organizations respond to the disruptive risks and opportunities in a world where demographics and technology are changing more quickly than ever.

We are an innovative, fast-growing public opinion and marketing research consultancy. We use the latest technology, sound science, and deep experience to generate top-flight research-based advice to our clients. We offer global research capacity with a strong focus on customer service, attention to detail, and exceptional value.

We were one of the most accurate pollsters conducting research during the 2021 Canadian election following up on our outstanding record in 2019.

Contact us with any questions.

Find out more about how we can help your organization by downloading our corporate profile and service offering.

How do Canadians react to Pierre Poilievre’s campaign narrative?

Abacus Data recently completed a national survey with a sample of 2,000 Canadian adults from April 4 to 9, 2022. In that survey, we showed respondents who completed the survey in English the campaign launch video of Conservative Party leadership candidate Pierre Poilievre as a way to test reaction to his campaign’s central argument and message.

This is the video that was shown to respondents:

DO CANADIANS AGREE OR DISAGREE WITH WHAT HE SAID IN THE VIDEO?

Overall, half of English-speaking Canadians said they either strongly agree (23%) or agree (29%) with “what was shared in the video”. 24% disagreed (13% strongly) while 24% neither agreed nor disagreed.

Mr. Poilievre’s video was far more appealing to those who currently support the Conservative Party or the People’s Party with 79% of Conservatives and 83% of People’s Party supporters saying they agreed with what they say.

But there was also a sizeable minority of Liberal Party (36%), NDP (40%) , and Green Party (37%) supporters who also agreed with what was shared in the video.

Only about 1 in 5 Liberal and NDP supporters said they strongly disagreed with that Mr. Poilievre said in the video.

Most striking was the reaction to the video by age. Those aged 30 to 44 were the most likely to agree (59%) while those aged 60 and over were the least likely to agree (45%).

Unlike in other political behaviours or attitudes, education isn’t strongly related to reaction to the video largely because age is a greater predictor of reaction and younger Canadians, who are also more likely to have higher education levels, reacted more positively to the video.

There was also a relationship between vaccination status and agreement with the video. Those who did not receive a COVID-19 vaccine or those with one shot were the most likely to agree while those with three or more shots were the least likely to agree (and most likely to strongly disagree).

Earlier in the survey, we asked people for their overall impression of Mr. Poilievre. Among those who had an initially positive impression of him, 91% agreed with the video. Among those with a neutral view, 60% agreed, while only 20% of those who had a negative view of Mr. Poilievre agreed with the video.

DOES THE POILIEVRE CAMPAIGN MESSAGE PUSH OR PULL VOTERS?

Respondents were then asked whether they would consider or not consider voting for Mr. Poilievre if he was the leader of the Conservative Party of Canada.

Overall, 49% said they would definitely or probably consider voting Conservative while 39% said they wouldn’t. Given that the accessible voter pool for the Conservative Party is currently at 41%, this suggests Mr. Poilievre’s message and a campaign could increase the appeal of the party.

The video did little to repel current Conservative voters (5% say they would probably not or definitely not consider voting Conservative) and could actually attract a small portion of current Liberal, NDP, and Green supporters. Most striking, 78% of those who currently support the People’s Party say they would definitely consider or probably would consider voting Conservative if Mr. Poilievre was the leader after watching the video.

The potential of Mr. Poilievre’s message to increase Conservative support among younger voters is clear from the survey. 51% of 18 to 29-year-olds and 57% of those aged 30 to 44 say they would definitely or probably consider voting Conservative.

In this same survey, the accessible Conservative vote share among those age groups is 37% and 43% respectively. This means that if successful, Poilievre could substantially increase the accessible Conservative voter pool among two demographics that have been a weakness for the Conservatives in the past three federal elections.

UPSHOT

According to David Coletto: “Earlier this month, we shared polling data that found Pierre Poilievre has a clear advantage when it comes to both his image and support among Conservative Party supporters, a potential indicator of his support within the Conservative Party.

This test, while imperfect and limited, demonstrates that Mr. Poilievre’s broader message and argument may not be as offensive or unappealing to the general public as some may have assumed. In fact, his arguments about the housing market and taking back control of one’s life resonates the most with younger Canadians – a demographic that the Conservatives have struggled to connect with in the past.

However, one flag in the research is the more negative reaction older Canadians have to his message.  So on the one hand Mr. Poilievre may grow the Conservative universe among younger Canadians, but he could also risk support among more reliable older voters. His message is likely unlike anything Canadians have heard before and his leadership of the Conservative Party has the potential to realign Canadian politics. For those who say Mr. Polievre can’t win a general election, these results, at least, for now, suggest otherwise.”

And check out this recent piece I wrote about some core audiences in Canada that I think you’ll find interesting. To better understand Mr. Poilievre’s appeal, I think this should be required reading.”

METHODOLOGY

The survey was conducted with 2,000 Canadian adults from April 4 to 9, 2022. A random sample of panelists were invited to complete the survey from a set of partner panels based on the Lucid exchange platform. These partners are typically double opt-in survey panels, blended to manage out potential skews in the data from a single source.

The margin of error for a comparable probability-based random sample of the same size is +/- 2.1% 19 times out of 20.

The data were weighted according to census data to ensure that the sample matched Canada’s population according to age, gender, educational attainment, and region. Totals may not add up to 100 due to rounding.

This survey was paid for by Abacus Data Inc.

Abacus Data follows the CRIC Public Opinion Research Standards and Disclosure Requirements that can be found here:  https://canadianresearchinsightscouncil.ca/standards/

ABOUT ABACUS DATA

We are the only research and strategy firm that helps organizations respond to the disruptive risks and opportunities in a world where demographics and technology are changing more quickly than ever.

We are an innovative, fast-growing public opinion and marketing research consultancy. We use the latest technology, sound science, and deep experience to generate top-flight research-based advice to our clients. We offer global research capacity with a strong focus on customer service, attention to detail and exceptional value.

We were one of the most accurate pollsters conducting research during the 2021 Canadian election following up on our outstanding record in 2019.

Contact us with any questions.

Find out more about how we can help your organization by downloading our corporate profile and service offering.

What are Canadians thinking about Canada’s response to the Ukrainian invasion?

We recently completed a national survey with a sample of 1,500 Canadian adults from March 22 to 25, 2022.

UKRAINE AND FEDERAL GOVERNMENT RESPONSE

Most Canadians continue to believe that the federal government is doing a good job or doing as well as can be expected in terms of providing support for Ukraine. Over the last several weeks, these numbers have slipped marginally, however it remains the case that less than 20% of Canadians are critical of the Government of Canada’s effort in all areas explored.

There has been an increase in the number of people who believe that Russia’s effort to take over Ukraine will be stopped, from 43% to 46%. Most Canadians think that Russia’s effort will fail either in the nearer term or over the longer term. Only 23% believe Russia will prevail and pressure from the rest of the world will abate.

Most people (53%) continue to believe that Putin will be gone from office in two years.

One in four people has made a financial contribution in some form, to support Ukraine.

UPSHOT

According to Bruce Anderson: “Canadians have been paying a great deal of attention to this conflict and have been solidly on the side of Ukraine. There is widespread support for helping Ukraine through a number of government measures and an understanding that some of what we can accomplish can only be of value if it is coordinated with our allies. This is a rare area of public opinion where there is little partisan division. Only People’s Party supporters seem noticeably different from the norm, more likely to think Russia and Putin will prevail and more critical of government efforts to support Ukraine.“

METHODOLOGY

The survey was conducted with 1,500 Canadian adults from March 22 to 25, 2022. A random sample of panelists were invited to complete the survey from a set of partner panels based on the Lucid exchange platform. These partners are typically double opt-in survey panels, blended to manage out potential skews in the data from a single source.

The margin of error for a comparable probability-based random sample of the same size is +/- 2.6% 19 times out of 20.

The data were weighted according to census data to ensure that the sample matched Canada’s population according to age, gender, educational attainment, and region. Totals may not add up to 100 due to rounding.

This survey was paid for by Abacus Data Inc.

ABOUT ABACUS DATA

We are the only research and strategy firm that helps organizations respond to the disruptive risks and opportunities in a world where demographics and technology are changing more quickly than ever.

We are an innovative, fast-growing public opinion and marketing research consultancy. We use the latest technology, sound science, and deep experience to generate top-flight research-based advice to our clients. We offer global research capacity with a strong focus on customer service, attention to detail and exceptional value.

We were one of the most accurate pollsters conducting research during the 2021 Canadian election following up on our outstanding record in 2019.

Contact us with any questions.

Find out more about how we can help your organization by downloading our corporate profile and service offering.

Abacus Data is hiring a summer student. Come work with us for the summer!

Summer Student or Summer Internship

Abacus Data is looking for a Summer Student or Intern.

Location: Downtown Toronto, ON

Description: Full-time, 4-month contract (May 2022 thru August 2022)

Compensation: $25.00/hour – 37.5 hours per week

 Role:

Abacus Data is looking for an energetic, self-starting university student who is looking for a summer placement in Toronto to support the research team.  As a member of our growing and evolving team, you will report directly to the Director, Field, and Analysis and work closely on a range of client projects.

Based in Toronto, you will be responsible for contributing to all aspects of qualitative and quantitative research projects. We are looking for someone with an entrepreneurial spirit who enjoys to write, communicate, and learn about new topics.  A passion for research, politics, and public affairs is definitely an asset.

  • Experience in a customer service job
  • Prior research experience is an asset, but not a requirement.
  • An analytical mind, comfortable with numbers and data.
    • Advanced math or data software skills are not required but would be an asset.
  • Clear evidence of being detail-oriented, with a focus on delivery and error-free work.
  • Able to create stunning presentations that tell the story in our data to our clients and potential clients.
  • Strong interpersonal, writing, organizational, problem solving, and communication skills.
  • Ability to work with minimal supervision.
  • University or college degree/diploma in a related field.
  • Bilingualism (English and French) is not a requirement, but an asset.

Desired Skills and Experience:

  • Driven to succeed – self-starter, with a record of getting things done.
  • Detail-oriented – you are someone who is picky, relentless, and focused on delivering error-free, high quality work.
  • Innovative – you think of interesting and alternative ways to improve the quality of the work we output.
  • Collaborative – you can work closely with the team to leverage expertise to improve the quality of the work we do.
  • Persistent – doing whatever it takes to get things done with integrity and without excuses.
  • Independent – you work well without constant supervision and cherish your freedom to achieve business and personal objectives.

About Abacus Data Inc.

We are the only firm that helps organizations respond to the unprecedented threats of generational change and technological disruption.

Founded in 2010, Abacus Data is an innovative, fast-growing public opinion and marketing research consultancy. We use the latest technology, sound science, and deep experience to generate top-flight research-based advice to our clients. We offer global research capacity with a strong focus on customer service, attention to detail, and exceptional value.

We work with brands and organizations such as Shaw Communications, the Canadian Bankers Association, the Mining Association of Canada, Food & Consumer Products of Canada, NAV Canada, the Canadian Real Estate Association, Teck, Imperial Oil, Nestle Waters, Google, the Air Canada Pilots Association, NUPGE, HealthPartners, the Paramedic Association of Canada, the Canadian Pharmacists Association, and the Canadian Health Food Association.

We also work closely with Summa Strategies Canada and spark*advocacy to deliver the highest quality, data-driven strategic advice in Canada and North America.

Our vision is to be Canada’s premier data-based strategy firm with a reputation for outstanding customer service, creative thinking, and innovative methods.  We will do that by working harder, being more creative, and delivering more value to our clients, while doing it all with a smile.

For more information about Abacus Data, visit our website at www.abacusdata.ca

To apply for this position, please complete the application form here.

Timeline

Initial applications are due April 15, 2022
Shortlisted candidates will be contacted on April 18 and 19
Interviews will be conducted after April 19
Start date – Early May 2022

Advantage Poilievre but Charest could be competitive: new Abacus poll.

We recently completed a national survey with a sample of 1,500 Canadian adults from March 22 to 25, 2022.

IMPRESSIONS OF CONSERVATIVE LEADERSHIP CANDIDATES

Across the country, one in five voters says they have a positive impression of Pierre Poilievre and Jean Charest. Neither has particularly high negatives, with Poilievre at 21% and Charest a few points higher, at 24%.

Patrick Brown and Leslyn Lewis are less well known, and both have an equal mix of positive and negative impressions.

Among current Conservative voters, all four of the candidates tested have more positive than negative impressions, with Pierre Poilievre showing the strongest net favourables, with 45% positive and 7% negative. Charest follows next with 30% positive and 21% negative.  All four candidates have seen their positives grow among Conservative supporters since our last survey in early March.

Looking at the two candidates with the highest levels of positive impressions and name recognition – Pierre Poilievre and Jean Charest – finds Poilievre has more positives and lower negatives than Charest among current CPC supporters and those who say they would consider voting Conservative, while Charest has better numbers among those who are current Liberal voters.

When asked which candidate best reflects “your values and ideas about what the country needs”, Charest (32%) is top pick among Canadians overall, followed by Poilievre (26%) Brown (19%) Lewis (15%), and Aitchison (8%).

Among current Conservative supporters, Poilievre leads (46%) followed by Charest (24%), Brown (13%), Lewis (11%), and Aitchison (6%). Poilievre also leads among CPC accessible voters, but the margin is more narrow.

Regionally, Charest is favoured among all voters in BC and Quebec, while Poilievre leads in Alberta. Ontario is a close three-way race with Brown, Charest, and Poilievre all finding similar levels of support.

When asked which candidate they feel is most likely to win, across the country 22% pick Poilievre (22%) followed by Charest (16%). Almost half (44%) say they don’t know. Among current Conservative voters, 42% believe Poilievre will win, well ahead of Charest at 16%. Among accessible Conservatives, Poilievre is seen as the favourite, albeit by a smaller margin.

UPSHOT

According to Bruce Anderson: “If Conservative voters were choosing today, it seems clear that Pierre Poilievre would win – and might not need to count on a lot of second ballot support to cross the finish line. Jean Charest looks to have significant potential to attract supporters from outside the current Conservative voter pool, and his challenge will be about bringing new members to the party, in a way that creates concentrated support where he has the potential to be most competitive, which includes Quebec, Ontario, and BC. Among the accessible voter pool for the Conservative Party, preferences are somewhat more inconclusive, suggesting an interesting race could develop over the coming weeks and months if the party succeeds in expanding the tent. With the prospect of another half dozen less well-known candidates, this could either turn out to be a boon for the party by making the race more interesting and dynamic or result in a muddy crowded field without the excitement and drawing power of a close race among a handful of front runners.

According to David Coletto: “Pierre Poilievre is undoubtedly the frontrunner in this race. If current Conservative supporters mirror the views of the membership that will vote, then he’s significantly ahead of Jean Charest.

The real challenge for Mr. Charest is that while his positives have increased over the past few weeks among Conservative supporters, many of those who like Mr. Poilievre dislike him. In contrast, few of those who like Mr. Charest dislike Mr. Poilievre. Mr. Poilievre is not as polarizing a figure in the Conservative universe as Mr. Charest. At this point, it seems to me that Mr. Poilievre may have more room to grow if he can’t win on the first ballot given the low disapproval he has among Conservative supporters. If this matches how party members feels, this only reinforces his advantage.

The fact that current Liberal supporters like Mr. Charest more than current Conservative supporters confirm both the challenge of winning the Conservative leadership and the opportunity to win a general election.”

METHODOLOGY

The survey was conducted with 1,500 Canadian adults from March 22 to 25, 2022. A random sample of panelists were invited to complete the survey from a set of partner panels based on the Lucid exchange platform. These partners are typically double opt-in survey panels, blended to manage out potential skews in the data from a single source.

The margin of error for a comparable probability-based random sample of the same size is +/- 2.6% 19 times out of 20.

The data were weighted according to census data to ensure that the sample matched Canada’s population according to age, gender, educational attainment, and region. Totals may not add up to 100 due to rounding.

This survey was paid for by Abacus Data Inc.

Abacus Data follows the CRIC Public Opinion Research Standards and Disclosure Requirements that can be found here:  https://canadianresearchinsightscouncil.ca/standards/

ABOUT ABACUS DATA

We are the only research and strategy firm that helps organizations respond to the disruptive risks and opportunities in a world where demographics and technology are changing more quickly than ever.

We are an innovative, fast-growing public opinion and marketing research consultancy. We use the latest technology, sound science, and deep experience to generate top-flight research-based advice to our clients. We offer global research capacity with a strong focus on customer service, attention to detail and exceptional value.

We were one of the most accurate pollsters conducting research during the 2021 Canadian election following up on our outstanding record in 2019.

Contact us with any questions.

Find out more about how we can help your organization by downloading our corporate profile and service offering.

Is Co-ownership a Solution to the Housing Accessibility Crisis in Canada? Here’s What Canadians Think.

By David Coletto

For video interviews by Skype or Zoom or audio interviews, please contact David at 613-884-4730 or david@stagesite.abacusdata.ca

To say that housing accessibility and affordability are a problem in Canada has become a massive understatement. According to the Canadian Real Estate Association, the average home price in Canada hit $816,720 in February – a 20% increase from the previous year. Since February 2020, the average home price has increased by 50% from $542,286.

Given the rapid increase in prices, more and more Canadians are feeling “locked out” of the dream of ever owning a home. The gap between those who can buy and those who can’t is growing wider by the month.

When there is near consensus that a serious problem exists and the desire to achieve an outcome (owning a home) persists, the appeal of innovative solutions – like co-ownership – grows.

Earlier this year, Abacus Data was commissioned by the Key, a Canadian real estate tech company, to conduct a national public opinion survey to understand how Canadians are feeling about the housing market and to test their reaction to a new co-ownership model offered by Key that help people get on the property ladder.

The survey finds that 80% of Canadians believe every Canadian should have the opportunity to own a home, yet almost all Canadians believe homeownership accessibility is a problem in Canada, including 9 in 10 aspiring homeowners who feel “locked out” of owning a home someday. When informed about Key’s co-ownership model, 90% feel it would make homeownership more accessible.

Here are some details from the survey:

NEARLY ALL CANADIANS FEEL HOMEOWNERSHIP ACCESSIBILITY IS A PROBLEM IN CANADA.

An overwhelmingly majority of Canadians believe that home ownership accessibility – the ability to own a home – is a problem in Canada. In fact, almost half describe the issue as a major problem.

This view is shared by Canadian in all parts of the country, across all age groups, and across the political spectrum. But we do find that those living in BC and Ontario are somewhat more likely to feel housing inaccessibility is a major problem than those in other parts of the country.

Politically, differences across the political spectrum are not significant with Liberal, Conservative, NDP, and Bloc Quebecois supporters all agreeing that housing accessibility is a problem in Canada.

CANADIANS BELIEVE THAT EVERY CANADIAN SHOULD HAVE THE OPPORTUNITY TO OWN A HOME.

The concern about homeownership accessibility is so widespread and deeply held because most Canadians (78%) believe that every Canadian should have the opportunity to own a home.

Again, this view is shared by Canadians in all regions of the country, across demographic groups, and across the political spectrum.

9 IN 10 ASPIRING HOMEOWNERS FEEL “LOCKED OUT” OF OWNING A HOME SOMEDAY.

Among those who don’t currently own a home, 88% agree with the statement “given the housing market in Canada, I feel locked out from my dream of owning a home.”

The feeling of being “locked out” is shared by aspiring homeowners across the country but is more strongly felt by those in BC and especially Ontario where 63% strongly agree with the statement.

Politically, 86% of Liberal voters, 79% of Conservative voters, and 93% of NDP voters agree with the statement.

HOW DO CANADIANS FEEL ABOUT KEY’S CO-OWNERSHIP MODEL?

Not surprisingly, few Canadians are familiar with the co-ownership model. Right now, about 1 in 5 say they are familiar with it with almost half (44%) saying they had not heard about it before.

Familiarity with co-ownership is higher in Quebec (80%) than in any other part of the country – largely because the model is more widely used than in other parts of the country.

But despite the low familiarity with it today, when respondents are informed about different aspects of co-ownership, reaction is generally positive.

Respondents were shown the following details:

After informing them about the co-ownership model offered by Key, 90% agreed that “this co-ownership model would help make homeownership more accessible to more people and allow them to take advantage of the benefits of homeownership.”

This view was consistent across the country, across demographic groups, and across the political spectrum. In fact, Liberal and NDP voters were more likely to strongly agree with the statement than supporters of any other party – although at least 89% agreed across all party supporters.

When asked whether co-ownership should be included as one of the ways to make units in new housing projects more affordable, 68% agreed while 8% said it shouldn’t. 24% were unsure.

Among renters, 93% said they found the co-ownership program at appealing, including half who said it was very appealing.

WHAT USING RRSPs FOR A DOWNPAYMENT FOR A CO-OWNED UNIT?

Right now, a first-time homebuyer who buys a co-owned home cannot access their RRSPs to help finance the down payment. But 84% of Canadians think this should be an option. This view is widely shared by Canadians from all regions, demographics, and political orientations.

CO-OWNERSHIP vs. RENT-TO-OWN

In the last federal election, the Liberal Party campaigned on a promise to bring in a rent-to-own program. Few Canadians were aware of this promise (19%) including only 22% of those who voted Liberal.

And when we provide information about rent-to-own models and ask whether people think rent-to-own or co-ownership is the better approach to making housing more accessible, 70% chose co-ownership compared with 30% who prefer rent-to-own.

Co-ownership was the preferred option in every region of the country, across all age groups, and across the political spectrum. Even 2 in 3 Liberal voters felt co-ownership would be a better approach to making housing more accessible and affordable than rent-to-own.

UPSHOT

As Canadians watch housing prices rise, there is a growing fear that many will be locked out from ever owning a home. This is especially true for young Canadians, those new to Canada, and those who may not be eligible for a traditional mortgage because of their religion or employment situation. They are looking for innovative solutions to a problem they don’t believe is getting solved by traditional tools.

This survey clearly shows that co-ownership is a model Canadians can support and think would help make homeownership more accessible to many who are otherwise “locked out” from the dream of owning a home. Awareness of the co-ownership model is low, but when people are informed about it, the reaction is overwhelmingly positive.

The data indicates there is little political risk in exploring this model as an option for those looking to get on the homeownership ladder but cannot because either their circumstances make traditional lending/ownership options unavailable or because home price increases continue to outpace their ability to save enough for a down payment.

METHODOLOGY

Our survey was conducted online with 2,000 Canadians aged 18 and over from February 17 to 23, 2022. A random sample of panelists was invited to complete the survey from a set of partner panels based on the Lucid exchange platform. These partners are double opt-in survey panels, blended to manage out potential skews in the data from a single source.

The margin of error for a comparable probability-based random sample of the same size is +/- 2.%, 19 times out of 20.  The data were weighted according to census data to ensure that the sample matched Canada’s population according to age, gender, educational attainment, and region. Totals may not add up to 100 due to rounding.

The survey was paid for by Key.

ABOUT ABACUS DATA

We are the only research and strategy firm that helps organizations respond to the disruptive risks and opportunities in a world where demographics and technology are changing more quickly than ever.

We are an innovative, fast-growing public opinion and marketing research consultancy. We use the latest technology, sound science, and deep experience to generate top-flight research-based advice to our clients. We offer global research capacity with a strong focus on customer service, attention to detail and exceptional value.

We were one of the most accurate pollsters conducting research during the 2021 Canadian election following up on our outstanding record in 2019.

Contact us with any questions.

Find out more about how we can help your organization by downloading our corporate profile and service offering.