2 in 3 Toronto residents think Ford Government should postpone council size cut until after the election or scrap plan entirely
Last week we conducted a survey of over 900 adult residents of Toronto for the Broadbent Institute and Progress Toronto to gauge the reaction of how the Ontario government approached its decision to reduce the size of Toronto’s city council from 47 to 25 seats.
Here’s what we found:
FINDING #1
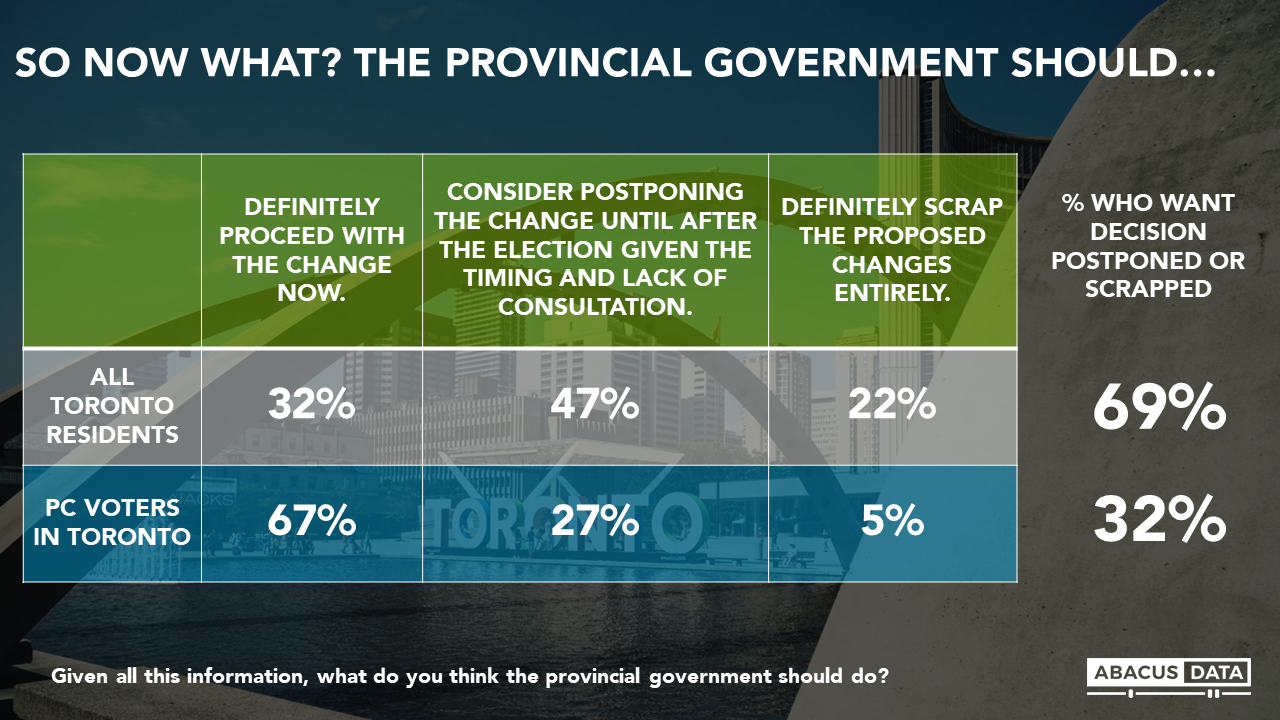
By a 3 to 1 margin, Torontonians think that the provincial government should either consider postponing the change in council size until after the election or scrap the proposal entirely.
When asked what the provincial government should do, 47% believe that the provincial government should consider postponing the change until after the election given the timing and lack of consultation. 32% feel that the government should proceed with the change now while 22% want the entire proposal scraped.
Even one in three of those who voted PC in the recent election think the government should either scrap the proposal entirely or consider postponing it until after the election.
FINDING #2
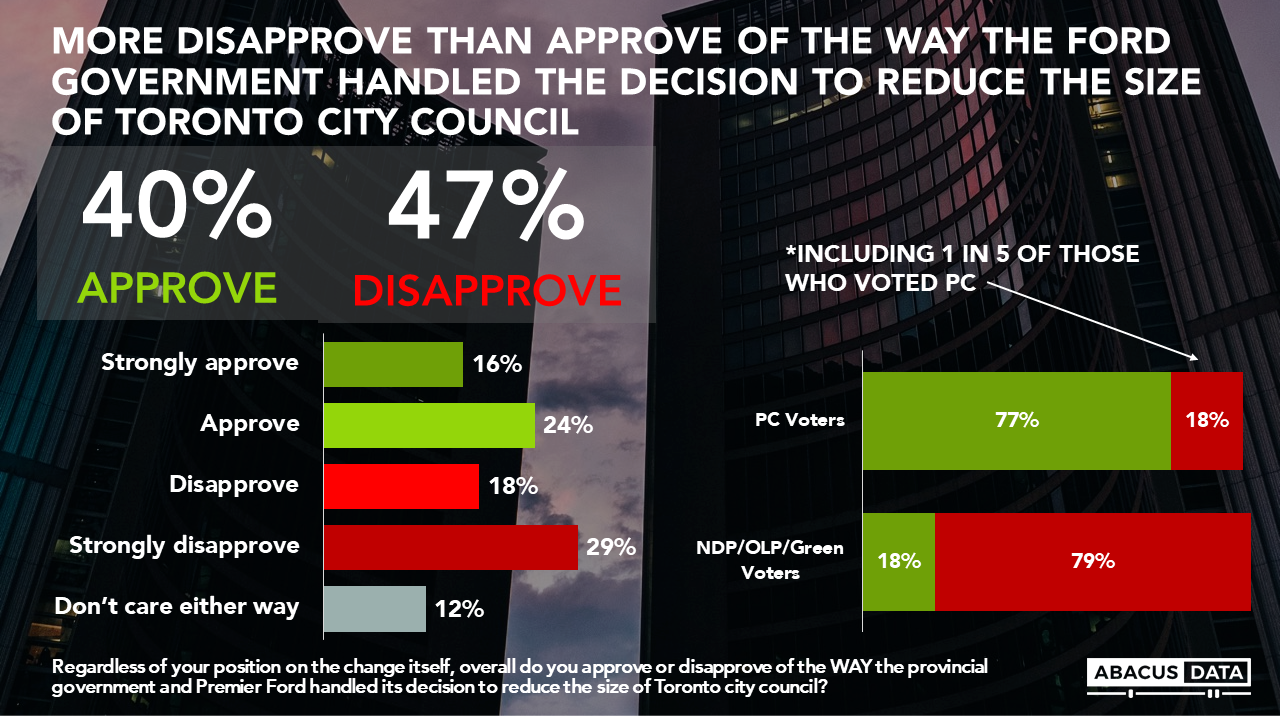
More people disapprove of the way Premier Ford and the provincial handled its decision to reduce the size of Toronto city council, including one in five of those who voted PC in the last election.
In total, 47% disapprove of the way Premier Ford and his government handled the issue while 40% approve of the approach the government took. Another 12% didn’t care either way. Negative reaction to the decision was more intense than positive reaction given the number of folks who strongly disapproved was almost double the number who strongly approved. Almost one in five PC voters disapproved of the way the issue was handled.
FINDING #3
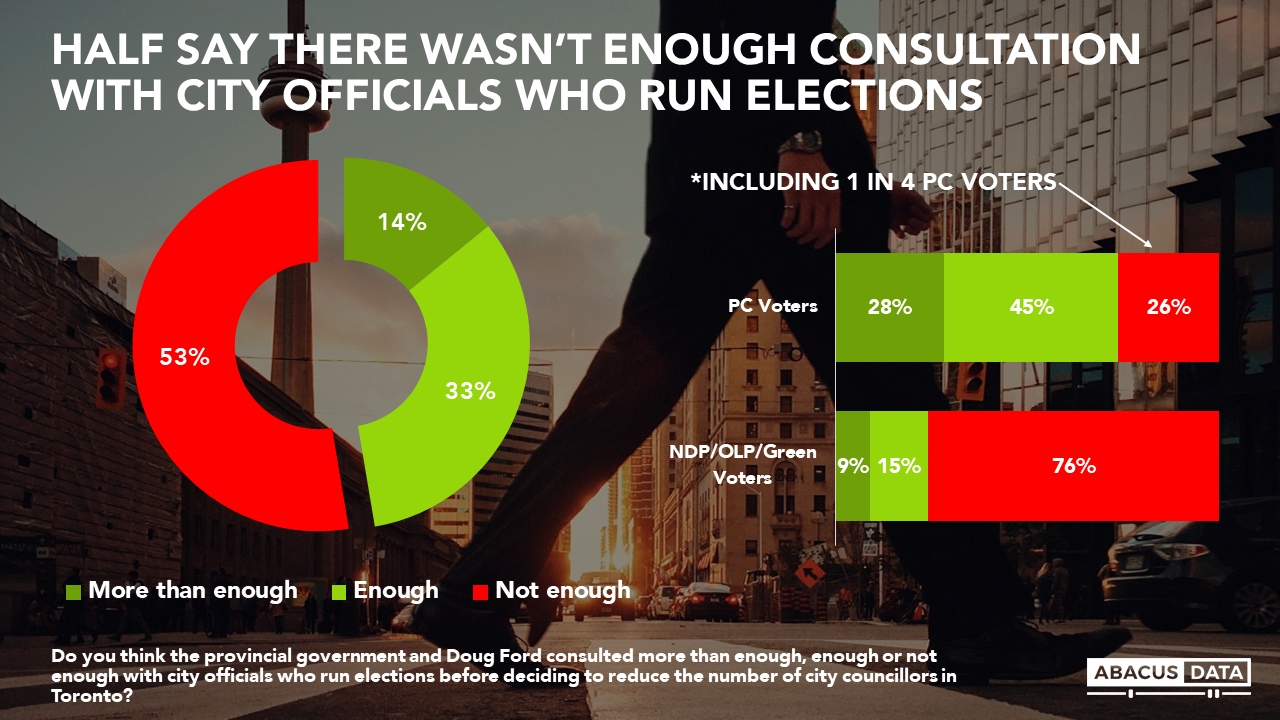
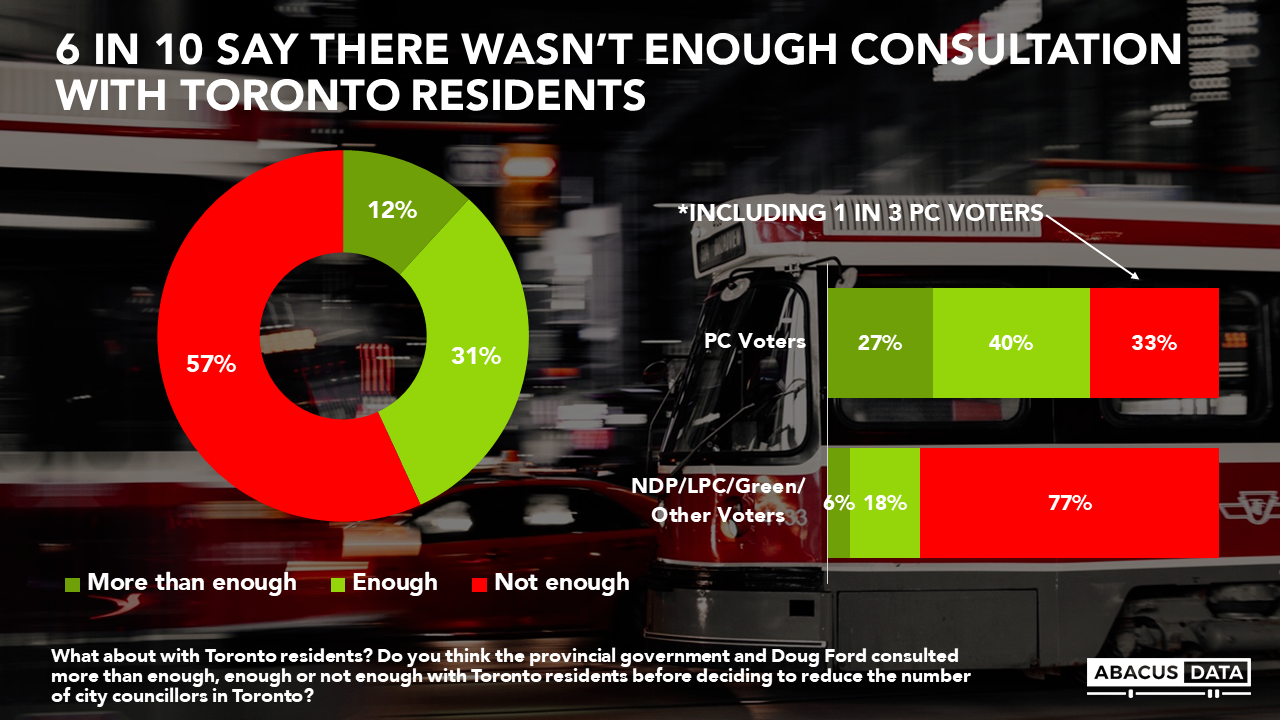
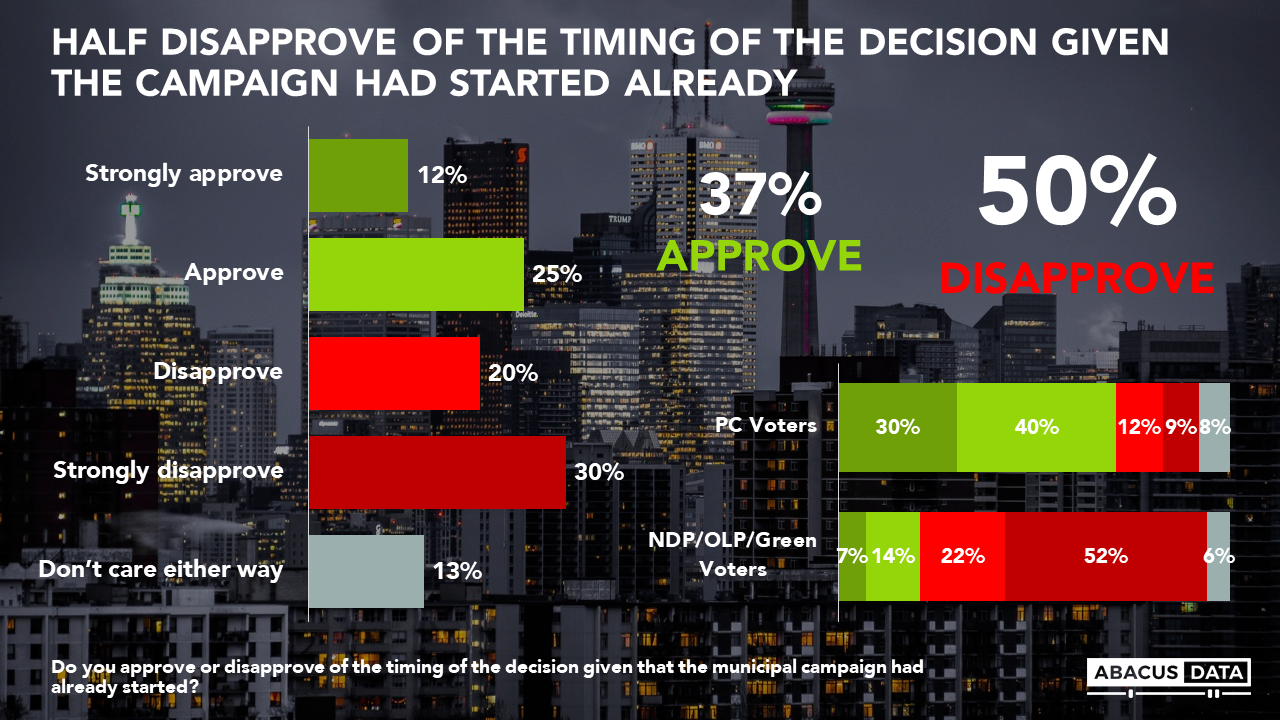
Most Toronto residents believe that the provincial government and Doug Ford did not consult Toronto residents or city officials who run elections enough before making the decision to reduce the size of city council. Another 50% disapprove the timing of the decision given that the municipal campaign had already started.
Most Toronto residents feel that there wasn’t enough consultation with city election officials nor with Torontonians before the decision to reduce the size of Toronto city council was made. 53% think the provincial government didn’t consult with city election officials enough while 14% feel they did more than enough and another 33% think they consulted enough.
More feel that not enough was done to consult with Toronto residents (57%) while 12% feel more than enough was done and 31% said enough was done to consult with Toronto residents. 33% of PC voters felt that the government did not consult enough with city residents.
Half of Toronto residents disapproved (including 30% who strongly disapproved) with the timing of the decision compared with 37% who did approve. 21% of PC voters disapproved with the timing of the decision.
FINDING #4
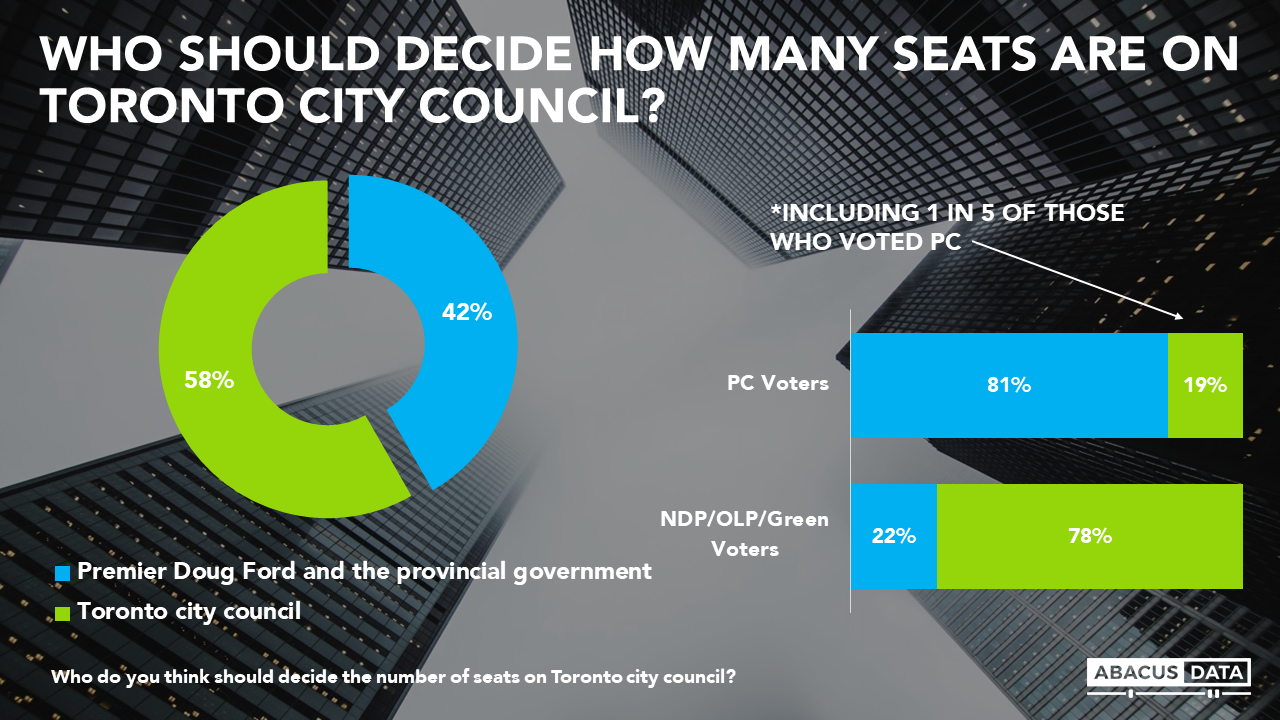
58% to 42%: Torontonians think that Toronto city council should decide the number of seats on Toronto city council versus Premier Doug Ford and the provincial government.
When asked who should make the decision about the number of seats on Toronto city council. 58% felt Toronto city council should decide while 42% felt the decision should be left to the Premier and the provincial government. One in five (19%) of PC voters felt that Toronto city council should decide the issue.
THE UPSHOT
David Coletto: “While some people may support reducing the size of city council, our survey finds that a clear majority think the way the Premier and his government approached the issue was inappropriate. Most think he should have consulted more and only 37% approve of the timing of the decision given that the municipal election had already begun.
Doug Ford promised to listen to, and govern for, the people. But in this decision, a clear majority of Toronto residents and a sizeable portion of his own supporters think the way he went about making the decision was wrong. They want him to listen and consult more and most think the timing is inappropriate.
In the end, most, including one in three Tory voters, want the government to either postpone the change until after the upcoming municipal election or scrap the idea entirely.”
Methodology
This survey, commissioned by the Broadbent Institute and Progress Toronto, was conducted online with 907 Torontonians aged 18 and over July 30 to August 1, 2018. A random sample of panelists was invited to complete the survey from randomly selected Canadian adults who are members of Research Now’s online panel.
The Marketing Research and Intelligence Association policy limits statements about margins of sampling error for most online surveys. The margin of error for a comparable probability-based random sample of the same size is +/- 3.3%, 19 times out of 20. The data were weighted according to census data to ensure that the sample matched Toronto’s population according to age, gender, educational attainment, and region of the city. Totals may not add up to 100 due to rounding