Canadians mad at Trump tariffs; support retaliation. Millions want to do their own part.
The decision by US President Donald Trump to impose tariffs on Canadian steel and aluminum has caught public attention in Canada in a way that few trade issues ever have – and Canadians are mad.
58% strongly oppose Mr. Trump’s action against Canada and another 21% oppose the US tariffs. What’s more, Mr. Trump has managed to unite Canadians to an extent that few issues do: opposition to the US tariffs is roughly 80% in every part of the country. Conservative voters are 82% against Mr. Trump on this issue, NDP voters 80% and Liberals 87%.

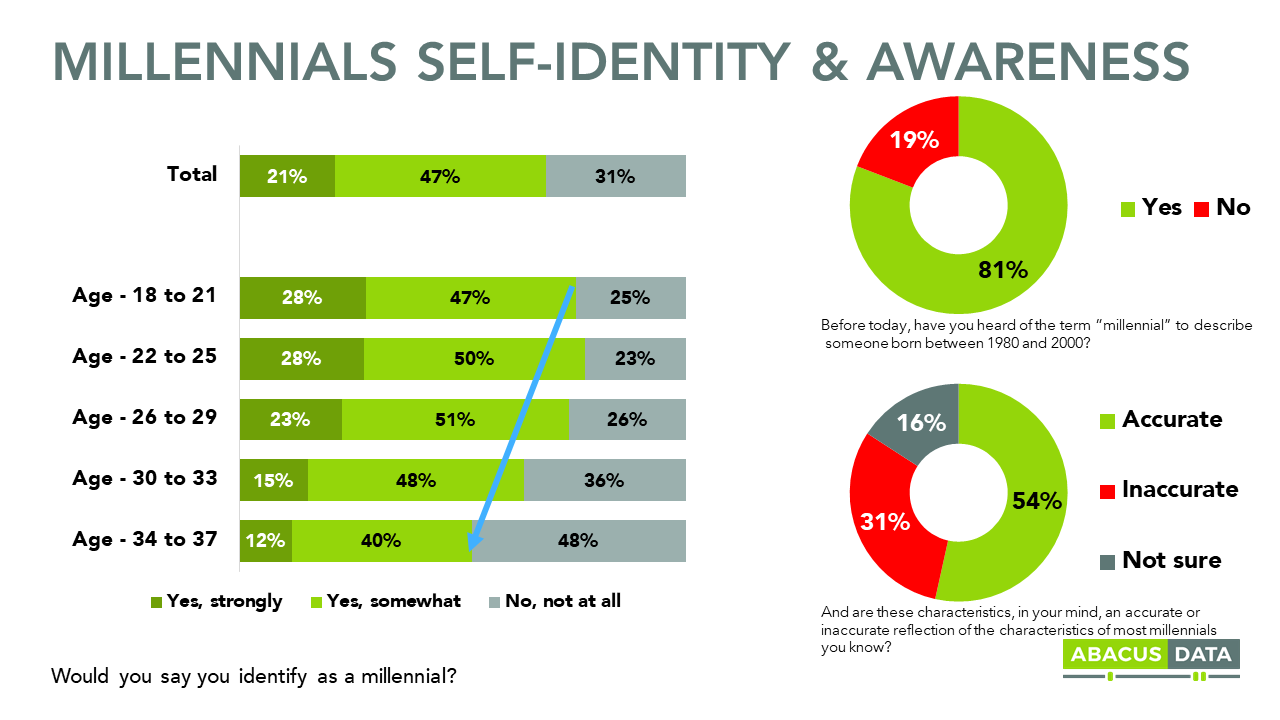
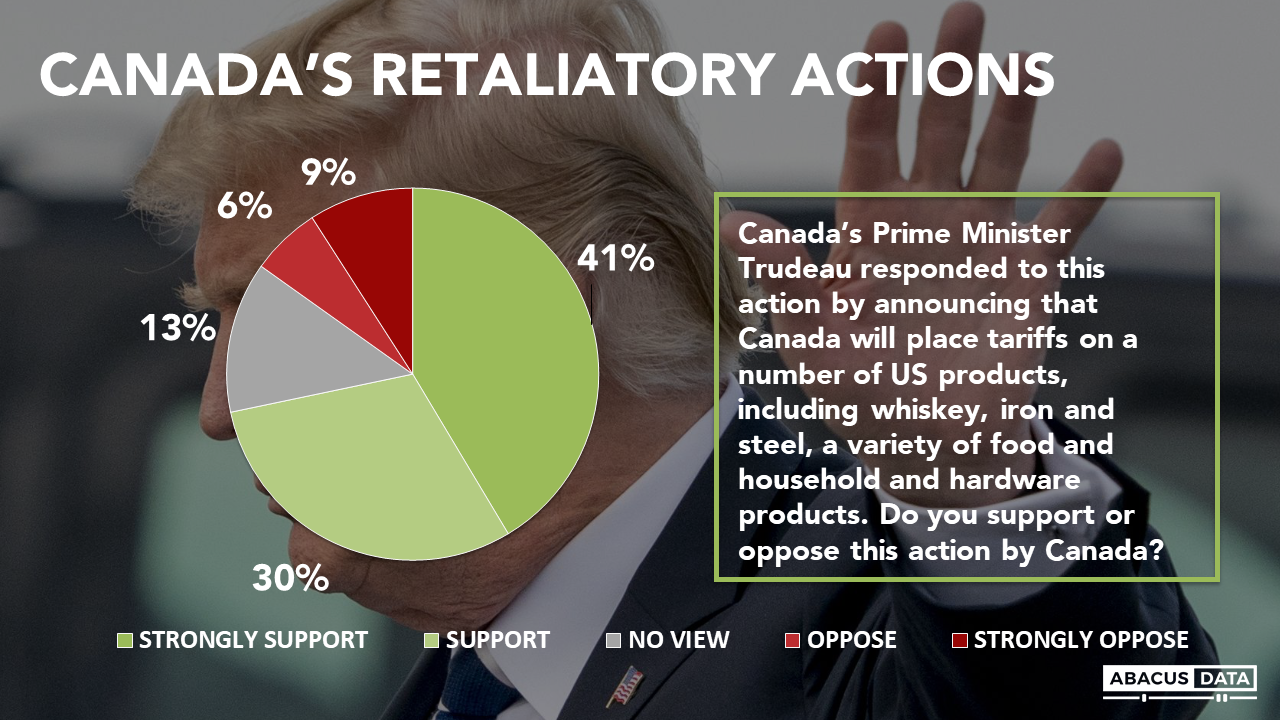
Reaction to the counter-measures announced by the Canadian government has garnered a lot of support across the country. 41% strongly support the steps taken by the Prime Minister and another 30% support those actions. Only 19% are opposed.
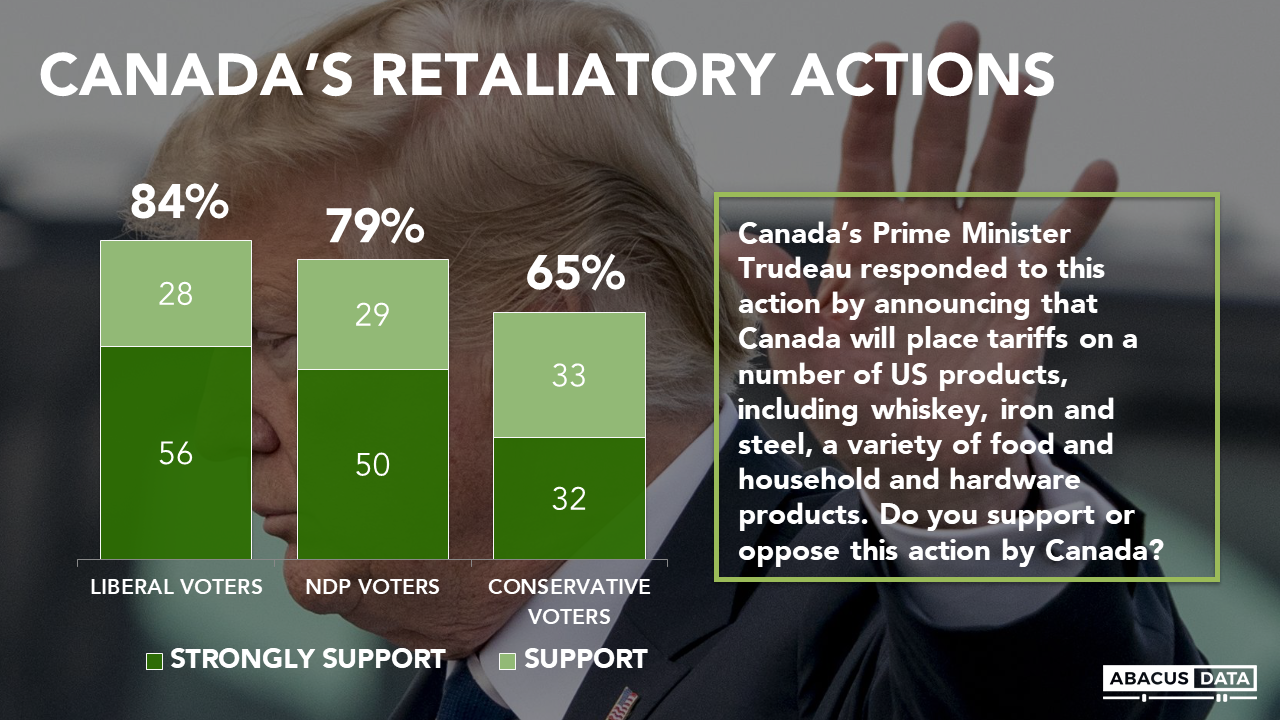
Support for the retaliatory measures is 69% in Alberta and higher everywhere else. Among Conservative voters, 65% support the retaliation and 27% oppose it. Among NDP and Liberal voters support is 79% and 84%.
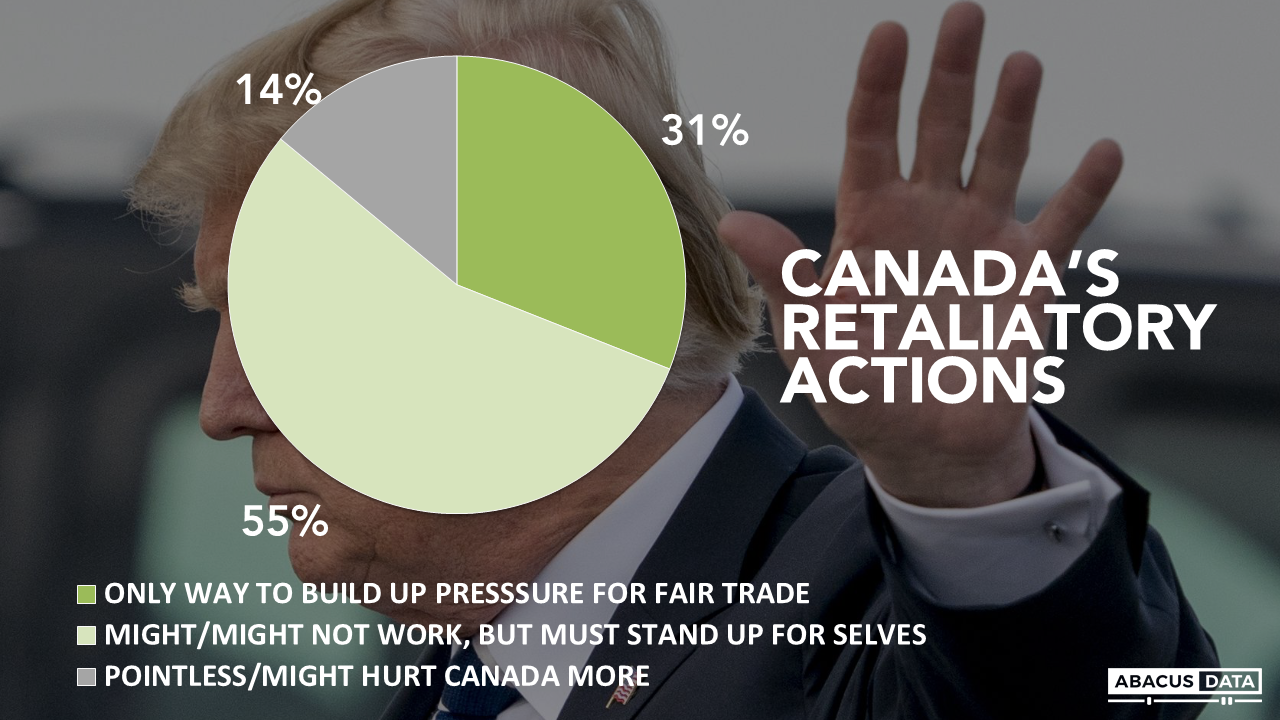
When probed a bit more on the retaliation, 14% feel Canada’s actions are pointless and may bring more harm to Canada. Three times as many (31%) feel this is the only way to build up pressure within the US for fair trade with Canada. The majority (55%) admit to feeling these actions by Canada might or might not work, but “we must stand up for ourselves” no matter what.
The level of Canadian frustration with the US President is so high, that many Canadians are inclined to want to do what they can to send a pocketbook message to America.
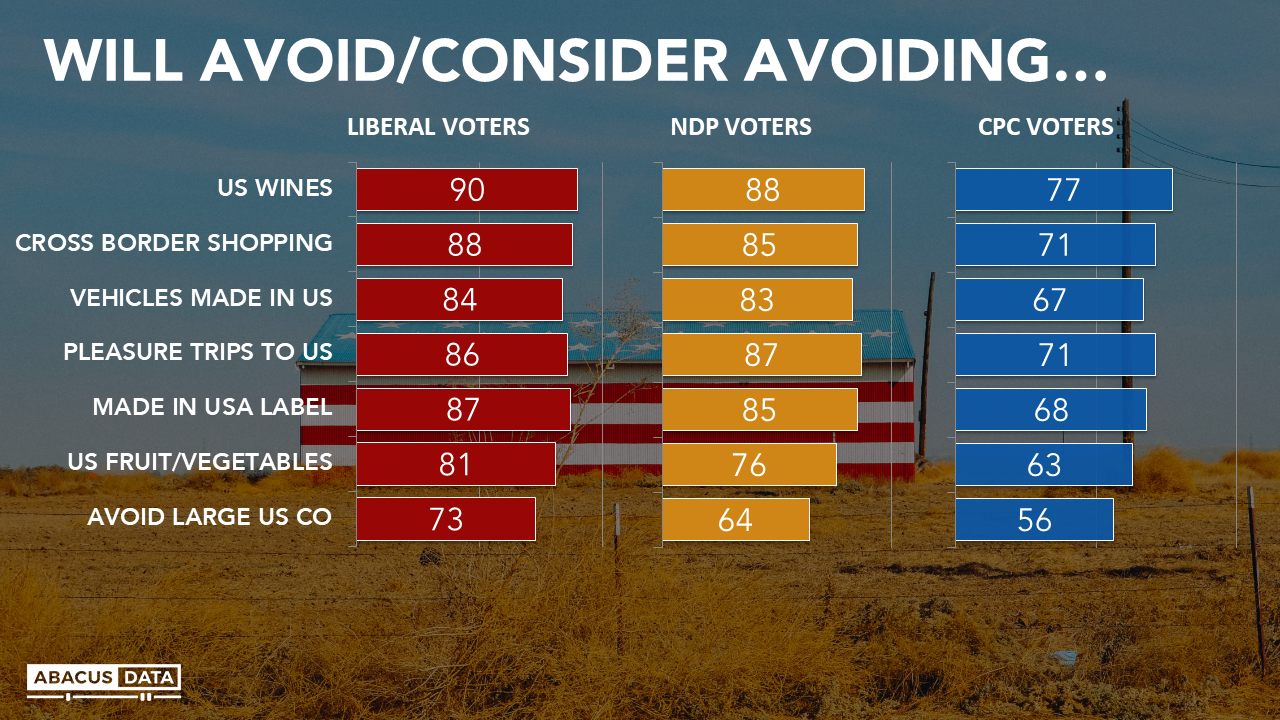
About 15 million Canadians or more say they wlll avoid US wines, cross border shopping and pleasure trips to the US. Millions say they will avoid products with Made in the USA labels, avoid US produce, and avoid buying from large US companies such as Wal-Mart, Starbucks and McDonalds.
Whether people do or don’t follow through on these feelings remains to be seen – at a minimum these results illustrate that many people feel personally offended by the US actions.

Differences in the willingness to consider personal retaliation by region or partisan affiliation are mild. Most Conservative voters are inclined to consider taking some actions to send a message to the US, and even more Liberal and NDP voters feel this way.
UPSHOT
According to Bruce Anderson: “Donald Trump is deeply unpopular in Canada, but Canadians have been mostly content to see the federal government work diplomatically to have a constructive relationship with his administration.
His comments about and actions towards Canada have changed the way people feel about what should be done now – people sense that being agreeable and constructive might not work and that Canada must push back when aggressive and unfair statements are made about their country.
People often overstate the actions they will personally take in response to an issue of concern, so care should be taken in forecasting a northern customer backlash – but that having been said, the potential for consumers to look for simple ways to tell Americans how upset they are is there – and for some segments of the US economy, the impacts could easily be meaningful, depending on how things unfold.”
According to David Coletto: “When Canada is targeted, Canadians unite. That’s clear from our data. In the past year, we have rarely seen an action taken by the federal government that unites Canadians across regional or partisan divides, but this is one of them.
More striking is how the anger over Trump’s decision could impact consumer behaviour in Canada. As Bruce said, people may be overreporting their actual intention to buy less American, but if a campaign builds, there’s a large audience who could be compelled to show displeasure with Trump’s trade agenda with their wallets.”
METHODOLOGY
The survey was conducted online with 2,200 Canadians aged 18 and over, from June 1 to June 6, 2018. A random sample of panelists were invited to complete the survey from a set of partner panels based on the Lucid exchange platform. These partners are typically double opt-in survey panels, blended to manage out potential skews in the data from a single source.
The Marketing Research and Intelligence Association policy limits statements about margins of sampling error for most online surveys. The margin of error for a comparable probability-based random sample of the same size is +/- 2.1%, 19 times out of 20.
The data were weighted according to census data to ensure that the sample matched Canada’s population according to age, gender, educational attainment, and region. Totals may not add up to 100 due to rounding.
ABACUS DATA INC.
Abacus Data is the only firm in Canada that helps organizations deal with the unprecedented threat of generational change and technological disruption.
We offer global research capacity with a strong focus on customer service, attention to detail and value-added insight. Our team combines the experience of our Chairman Bruce Anderson, one of Canada’s leading research executives for two decades, with the energy, creativity and research expertise of CEO David Coletto, Ph.D.