Final #elxn42 poll: What do Canadians think about the leaders?
October 18, 2015
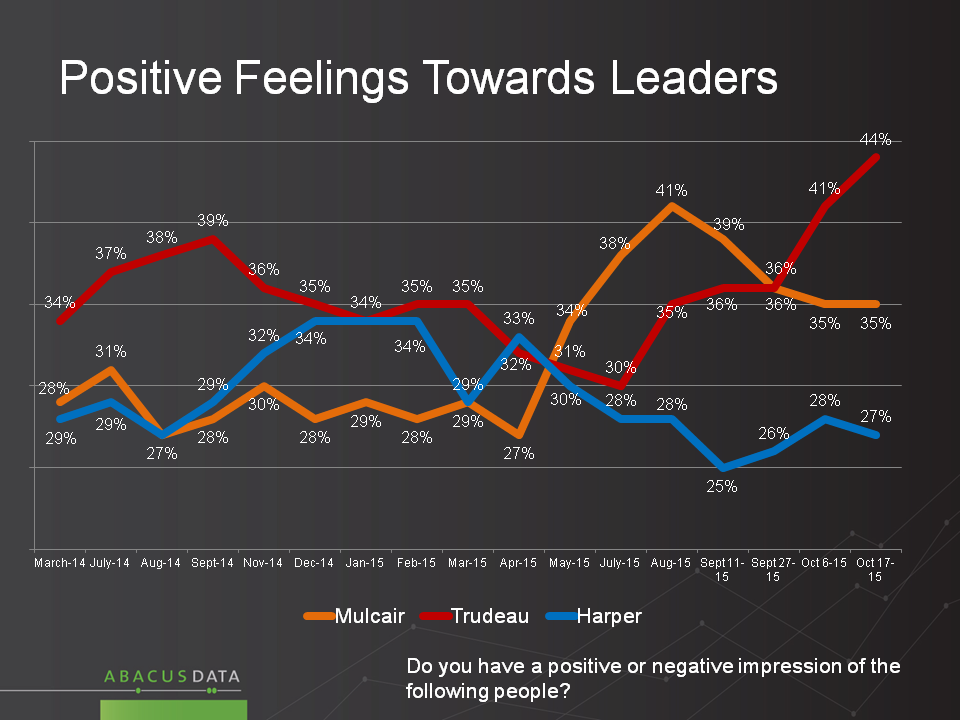
The three main party leaders have been a huge part of the story of how this election has played out. And the views of all three have shifted over the 11 week campaign.
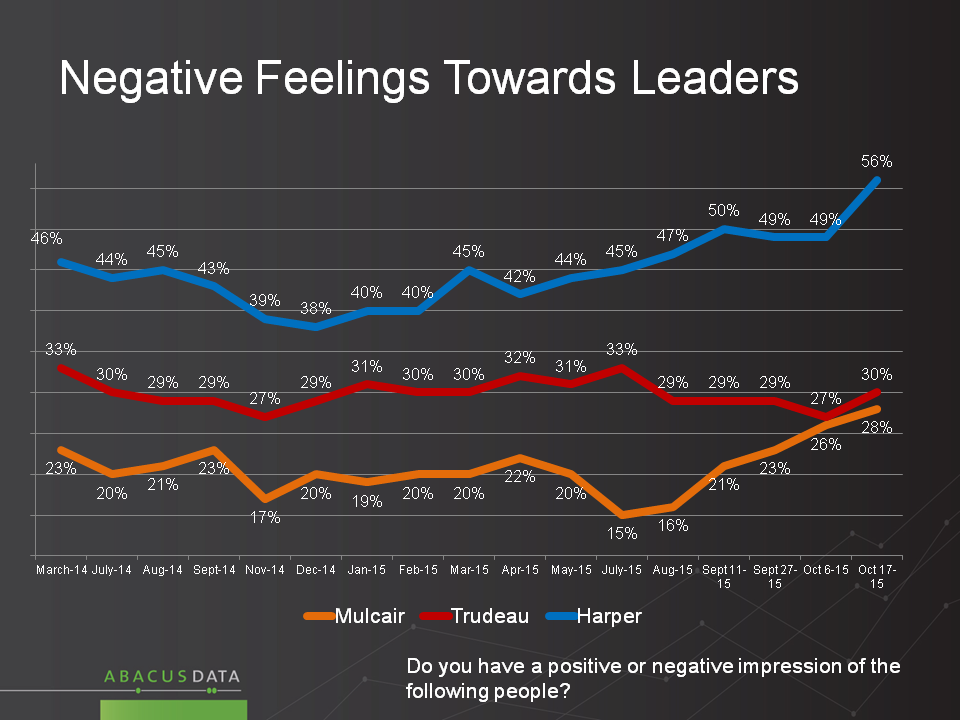
The biggest shift has been rapid improvement in positive feeling about Mr. Trudeau. Only 30% said they had a good feeling about him in July, today that number is 44%, 9 points better than Mr. Mulcair and 17 points better than Mr. Harper.
Negative feelings about the Liberal leader have been largely stable for 16 months, around 30%. This implies that all of the negative advertising about Mr. Trudeau since that time, failed to increase resistance to the Liberal leader.
Tom Mulcair’s positives jumped sharply after the election of Rachel Notley, from third place at 27% to first at 41%, and have sagged 6 points since the campaign began. The NDP leader’s negatives have almost doubled since July.
For Mr. Harper, positive feeling has been in a 25%-34% range over 16 months, however negative opinion has grown by 18 points in 2016, including a sharp rise in the last two weeks of this campaign.
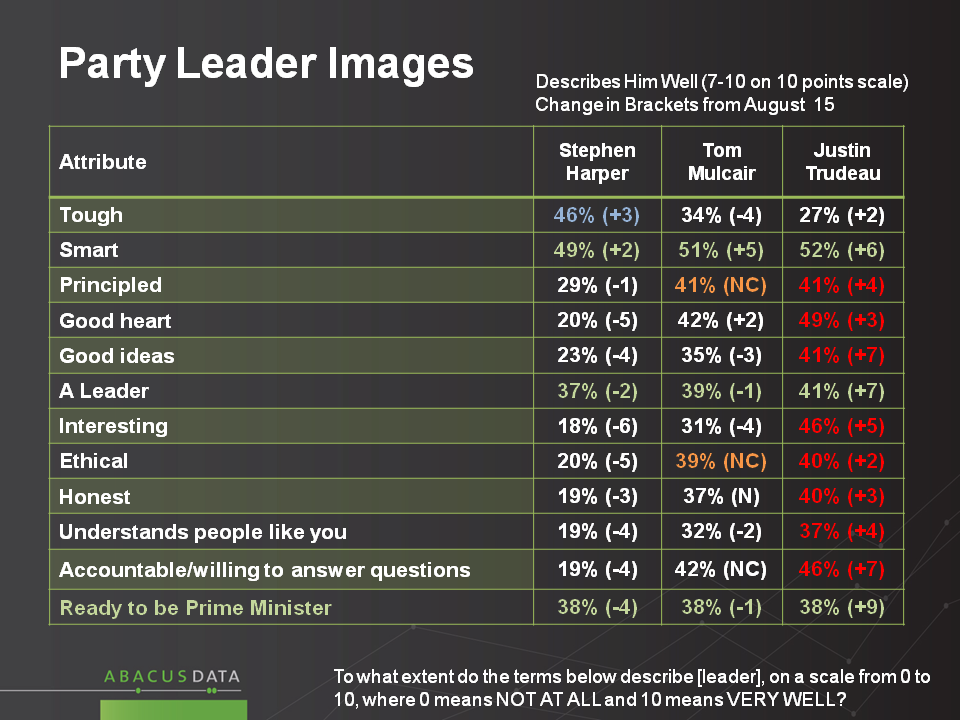
At the start of the campaign, we probed images of the leaders in considerable detail, and have updated the same questions in this campaign concluding poll. The results again show evidence that perceptions about Mr. Trudeau have improved considerably since the start of the campaign.
On 12 items tested, Mr. Trudeau leads or is tied for the lead on 11. Mr. Harper leads on only one, and is tied on 3 others. Mr. Mulcair leads on 2 and is tied on 3 others.
Among the other revealing findings in this probing:
- Trudeau has gained 9 points on “ready to be PM” (and is now tied with the others), 7 points on “a leader” and 6 points on “Smart. On all three of these, he is now tied with the other two leaders.
- In addition to improving his ratings on the above measures of competency, Trudeau is judged to be more empathetic, accountable and interesting than his rivals. We also measured “inspiring” for the first time. Mr. Trudeau scored 40%, 13 points better than Mr. Mulcair and 25 points ahead of Mr. Harper.
- Stephen Harper lost ground on 8 of the items we tracked over time. Most notable were slippages on “good heart”, “interesting” and “ethical”. His strongest images are as tough and smart; his weakest are on inspiring and interesting.
- Mulcair’s scores did not move all that much. He gained a few points for “smart” while losing ground on “tough” and “interesting”.
In the final wave of research, we also asked some new measures. Most noteworthy is that Mr. Trudeau’s strongest attributes are hardworking (51% for Mr. Trudeau) and tries to improve (50% for Mr. Trudeau) along with smart (52%) from above.
- Hardworking – Trudeau 51%, Mulcair 51%, Harper 42%
- Tries to improve – Trudeau 50%, Mulcair 39%, Harper 21%
- Inspiring – Trudeau 40%, Mulcair 20%, Harper 15%
- Boring – Harper 39%, Mulcair 20%, Trudeau 14%
- Tired – Harper 32%, Mulcair 15%, Trudeau 10%
- Mean – Harper 31%, Mulcair 11%, Trudeau 7%
Upshot
However this campaign turns out for the Liberals, Mr. Trudeau will deserve a large measure of credit for a performance that has changed many voters’ impression of him. It is also a reminder that conventional wisdom is sometimes proven wrong, that voter skepticism can be reversed, and that negative advertising doesn’t always work. Mr. Trudeau has positioned his party for significant gains, by convincing hesitant voters that he merits their consideration.
Methodology
Our survey was conducted online with 3,103 Canadians aged 18 and over from October 15, 2015 to October 17, 2015 survey from a large representative panel of over 500,000 Canadians, recruited and managed by Research Now, one of the world’s leading provider of online research samples.
The Marketing Research and Intelligence Association policy limits statements about margins of sampling error for most online surveys. The margin of error for a comparable probability-based random sample of the same size is +/- 1.8%, 19 times out of 20. The data were weighted according to census data to ensure that the sample matched Canada’s population according to age, gender, educational attainment, and region. Totals may not add up to 100 due to rounding.