Election 2015: Blue vs. Red; Orange flagging.
October 7, 2015
Liberals continue to edge upward, NDP downward

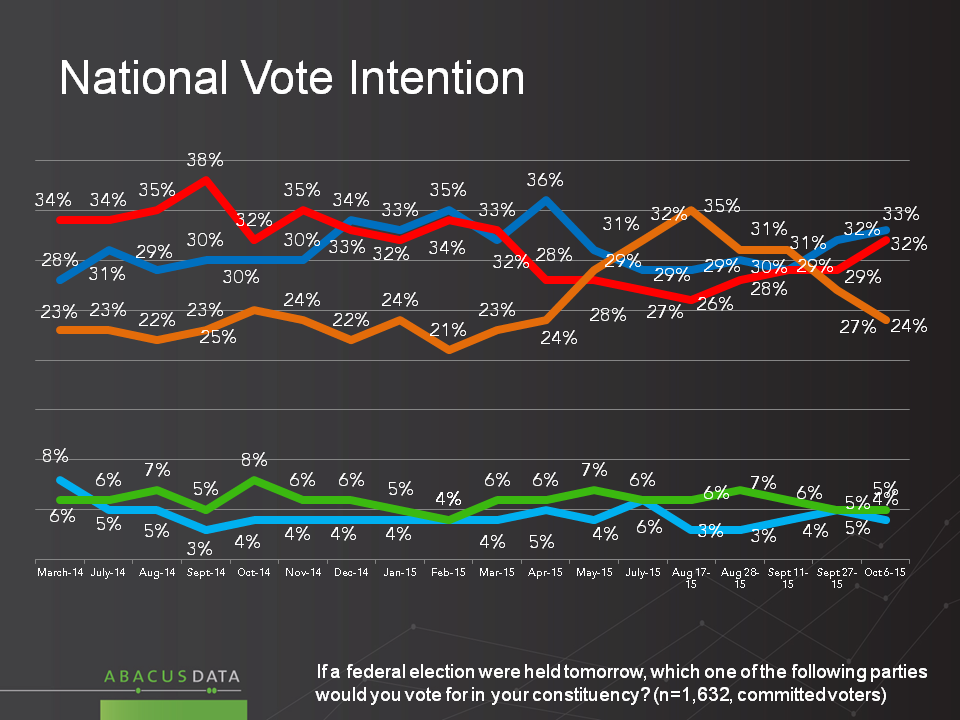
In our latest horserace numbers, the Conservatives have 33% across the country, the Liberals 32%, and the NDP 24%. For both the Conservatives and Liberals these are the best levels of support we’ve seen since the election started; for the NDP, it is the lowest number we’ve seen.
In Ontario, we see the Liberals up 6 points from our last wave, and now with a 7-point lead over the Conservatives. The NDP have fallen back to 23%, down 9 points from the start of the election.
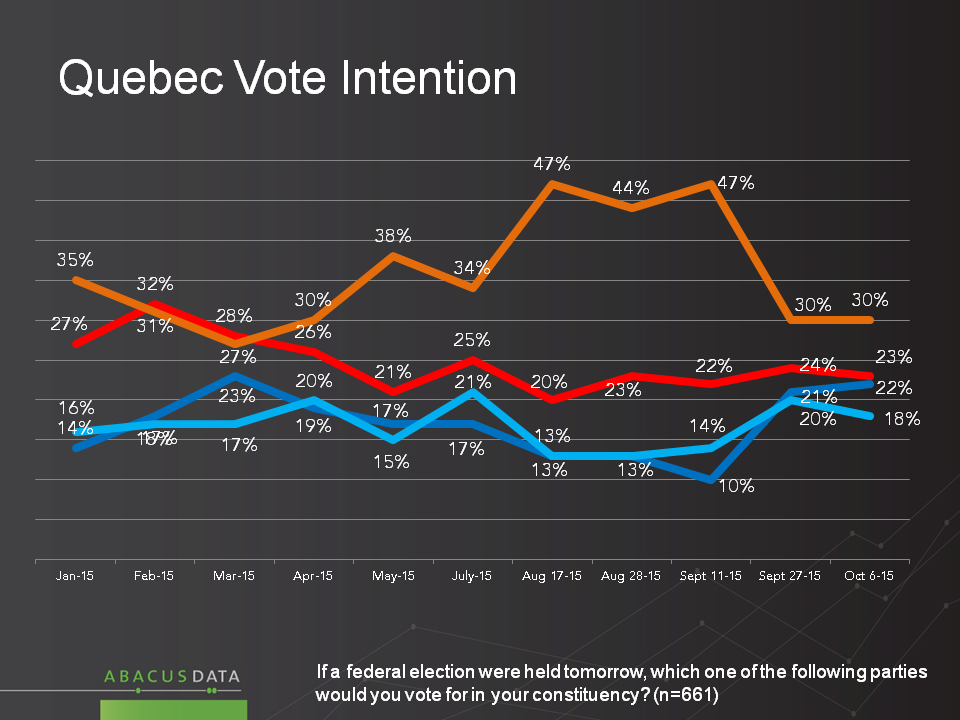
In Quebec, we see no significant change from our last wave: four parties are within 12 points of each other. The NDP started the election with a 27-point lead over the Liberals. Today, that lead is 7 points.

Accessible Voter Pools
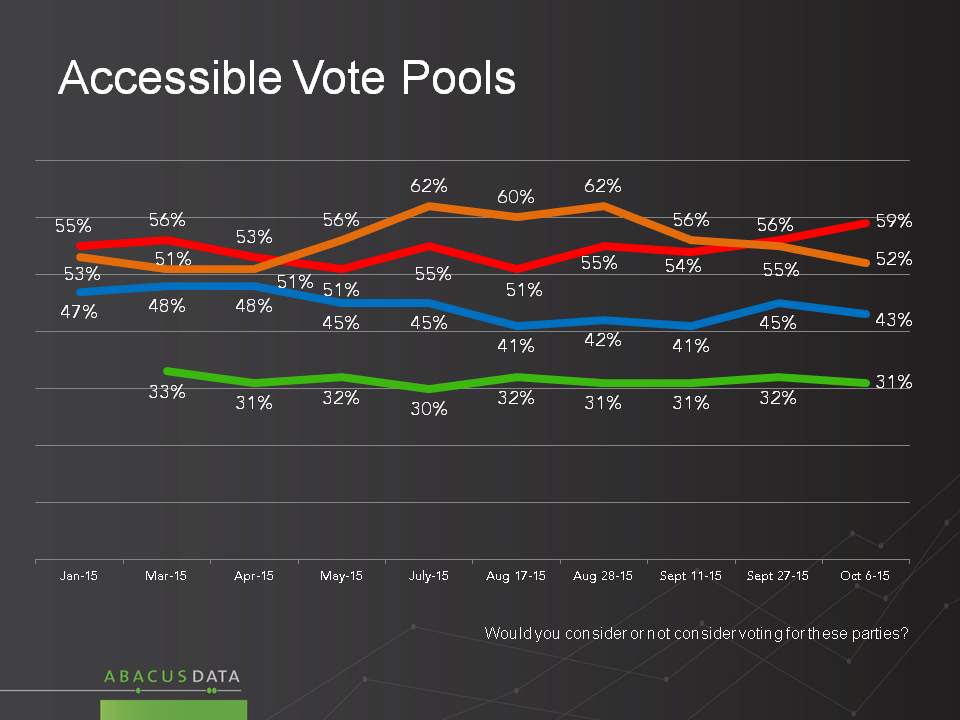
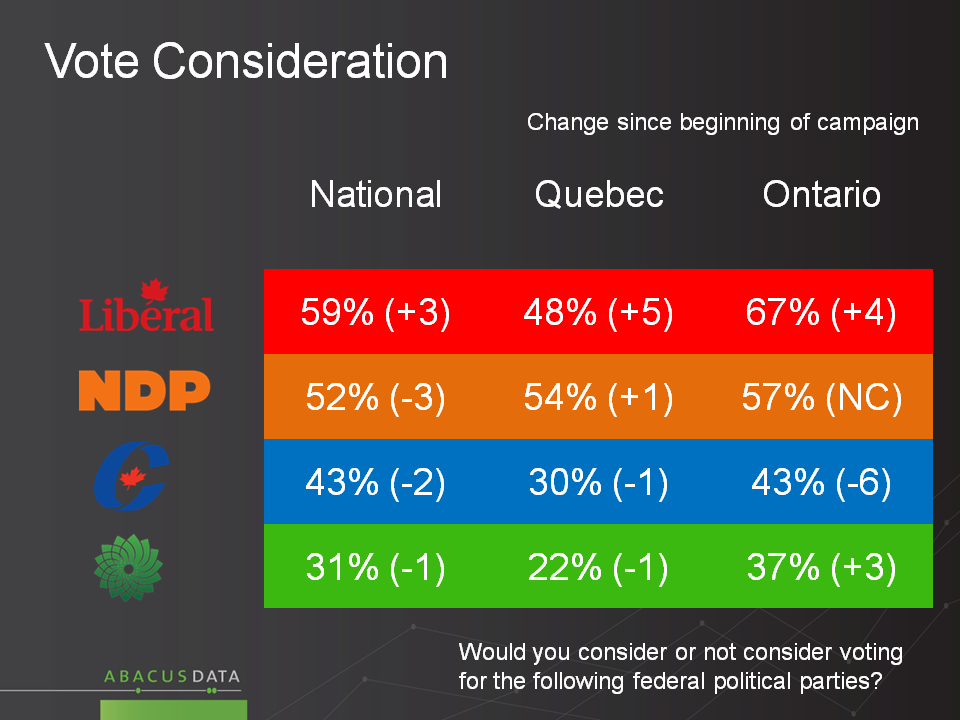
The Liberals now enjoy the largest number (59%) of accessible voters (people who say they would consider voting for a party), followed by the NDP (52%) and the Conservatives at 43%. Since the start of the campaign, the NDP pool has shrunk by 8 points, the Liberal pool has grown 8 points, and the Conservative pool has been pretty stable.
Worth noting is that the number of Quebec voters who would consider the Liberals is now 48%, and the number who would consider the Conservatives is 30%, unchanged from the last wave. In Ontario, the accessible pool for the Liberals is 67%, up 4 points from our last wave, and 10 points higher than the NDP pool, and 24 points higher than the Conservatives.
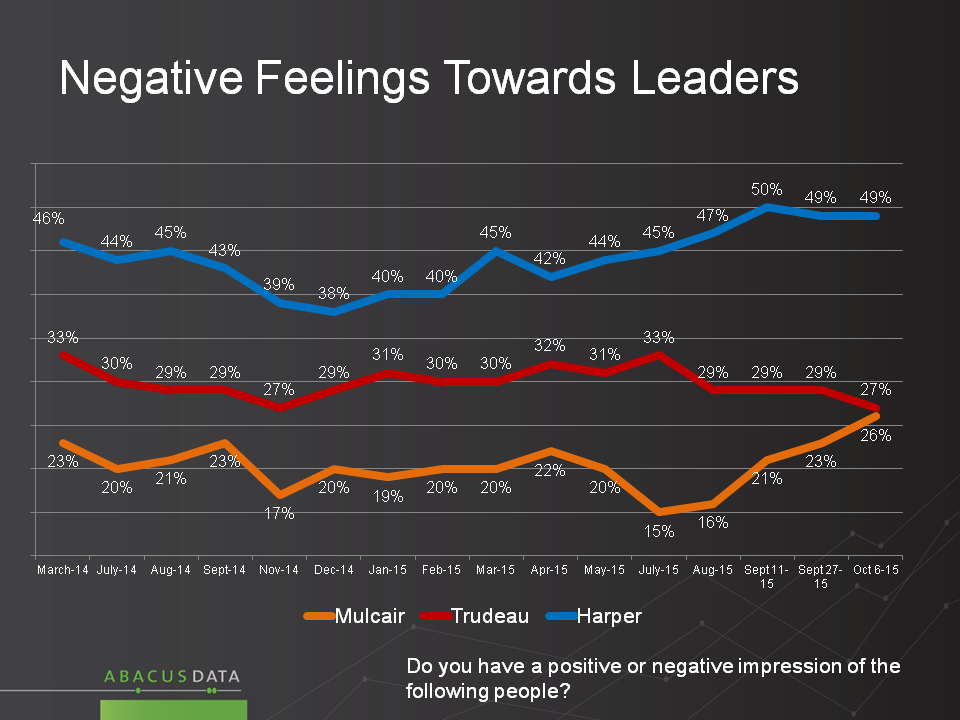
The Leaders: Trudeau now most popular
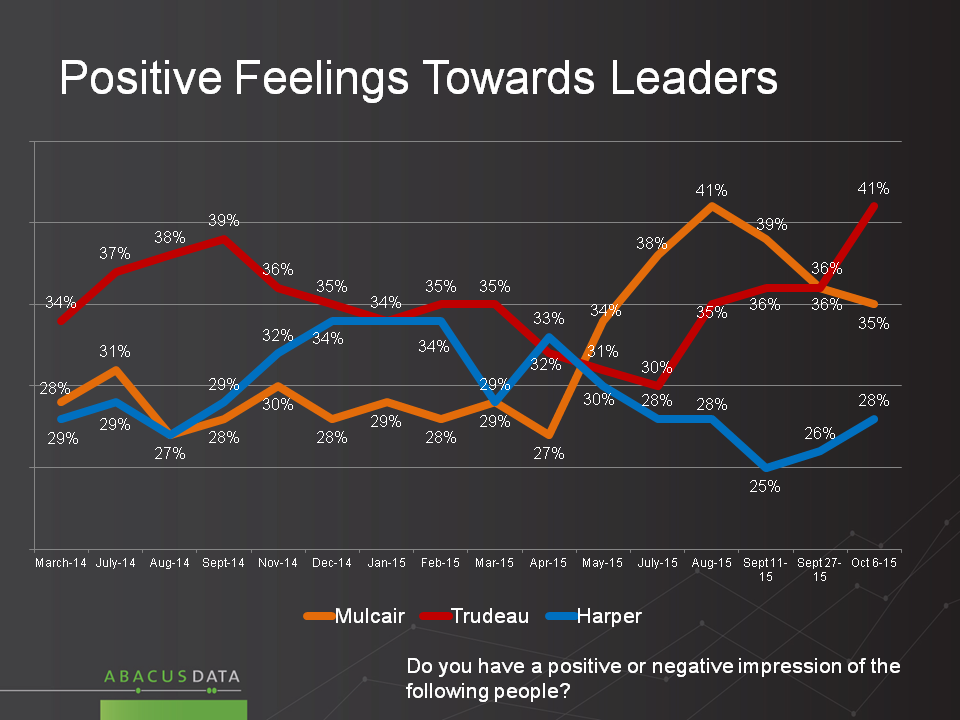
Positive feelings toward Justin Trudeau have been rising quickly in this campaign. In mid-July only 30% had a positive feeling about the Liberal leader, only 2 points better than Stephen Harper. At one point he trailed Thomas Mulcair by 8 points in positive regard. Today, Trudeau is up 11 points from his trough, and is 6 points better than Mr. Mulcair, and 13 points better than Mr. Harper.
Feelings about Mr. Harper have stayed in a fairly narrow range this election, while ratings of the NDP leader have seen significant losses. Negative feelings about the NDP leader are up from 15% to 26% in the last few months.
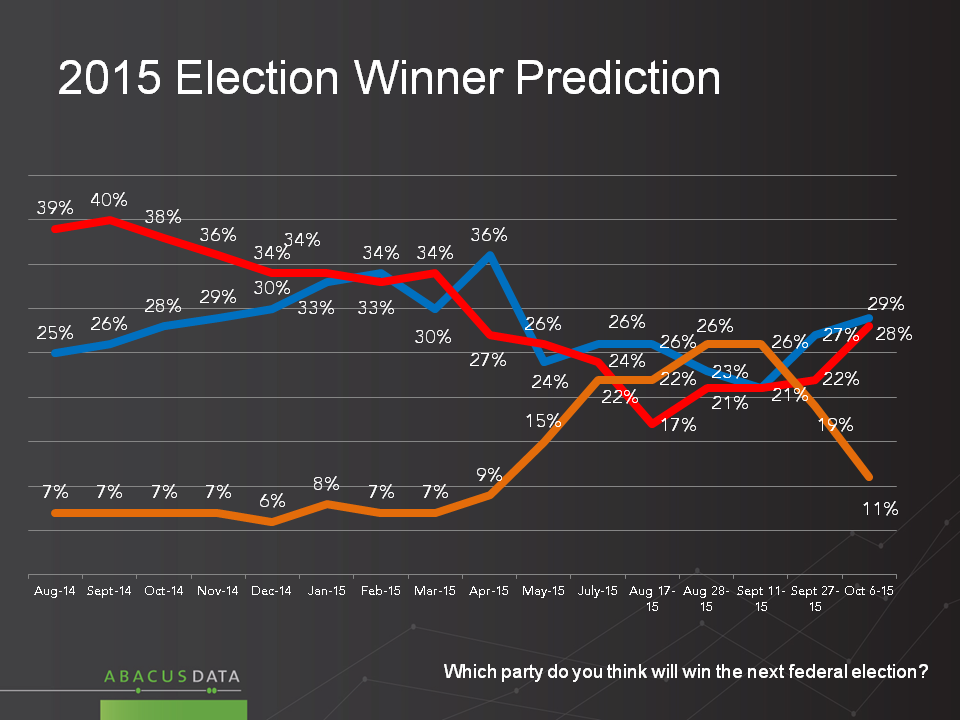
Who Voters Think Will Win
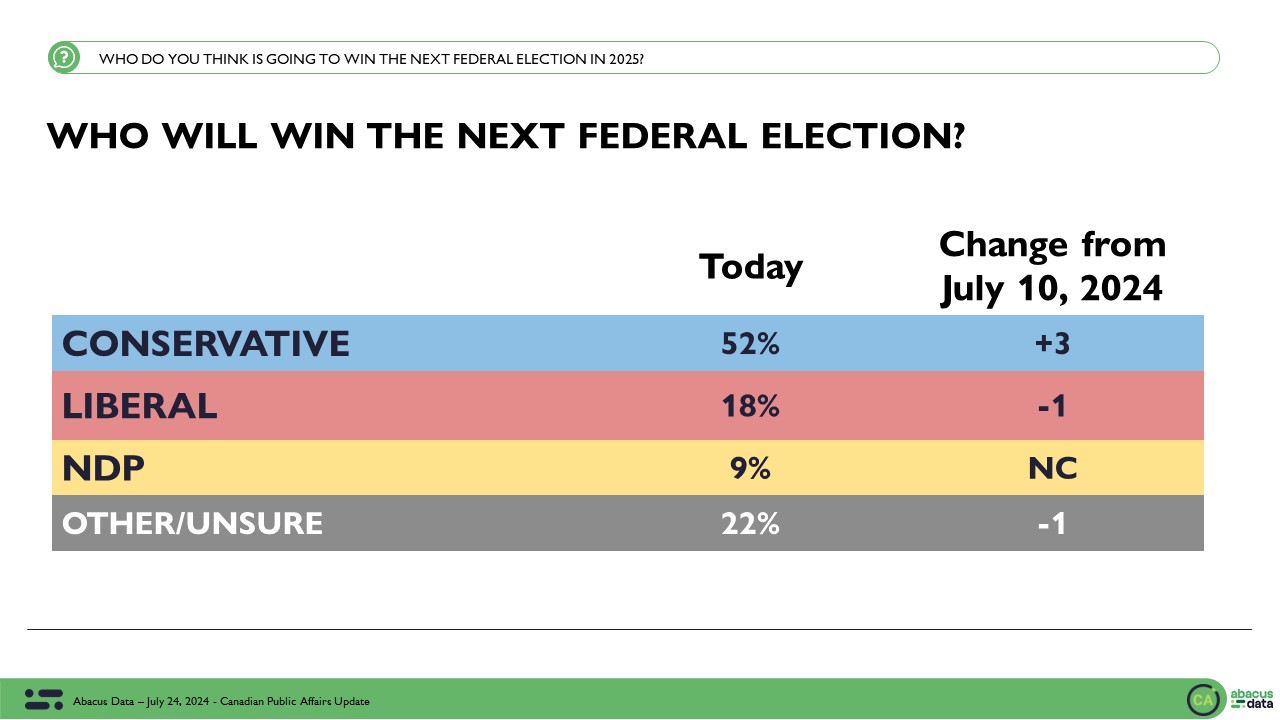
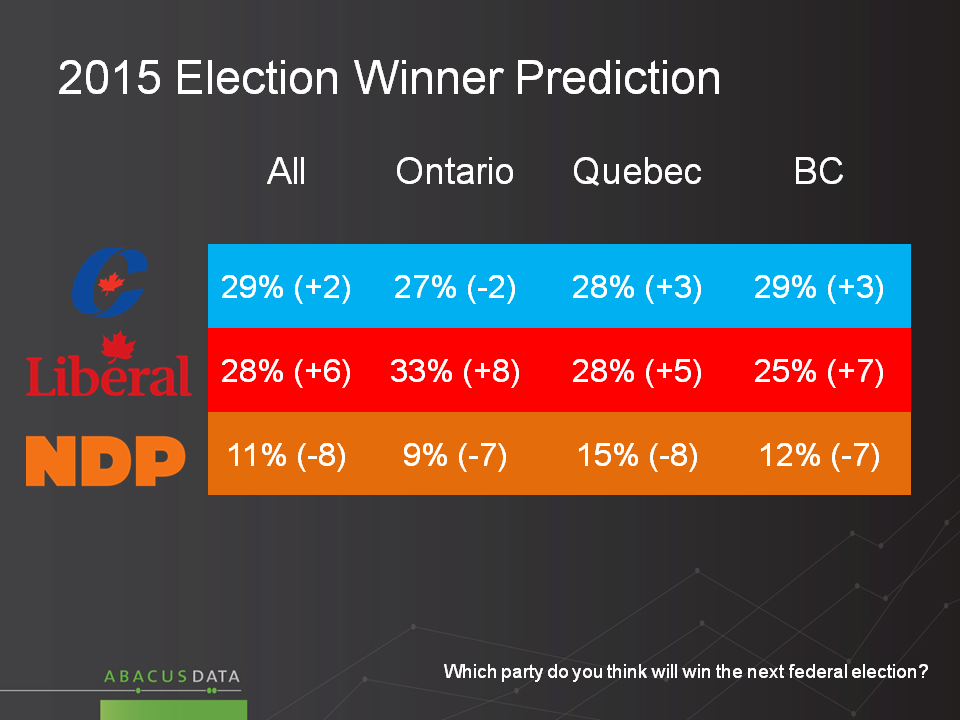
Two weeks ago, the NDP was picked as the likely winner of the election by a plurality (26%) of those surveyed. Today, only 11% believe the NDP will win, compared to 29% who think the Conservatives will win and 28% who think the Liberals will finish on top.
In Ontario, 33% think the Liberals will win, followed by the Conservatives at 27% and the NDP at 9%. In Quebec, the CPC and LPC are deadlocked at 28%, followed by the NDP at 15%. In Ontario and BC, the NDP have dropped 7 points on this question in just over a week, in Quebec they are down 8. As the race enters its final stages, and some voters consider strategic voting, it is clear that far fewer believe that the NDP is the party most likely to defeat the Conservatives.
The Upshot
The story so far of this election campaign has been one of relative steadiness in the prospects of the Conservatives, rising Liberal support, and declining enthusiasm for the NDP. The outcome at this point remains impossible to predict, especially since support levels continue to be fluid.
While much has been made about how the NDP platform may have positioned them poorly relative to the Liberals, it is also clear that feelings about the NDP leader are part of the challenge for that party. Mr. Mulcair, who began the campaign as a front-runner, has been leaving voters wanting. It seems reasonable to assume that at least some of this about reaction to his debate performances.
Mr. Trudeau, on the other hand, has capitalized on the fact that he started the campaign as something of an underdog, and has built substantially more opportunity for his party to stake a claim as the party best positioned to unseat the Conservatives, a point of differentiation which may be critical in the final days.
Tomorrow, we’ll provide data on the mood for change, the views of change voters, and reactions to the TPP deal.
Methodology
Our survey was conducted online with 2,000 Canadians aged 18 and over from 2:0pm ET October 5, 2015 to 4:00pm ET on October 6, 2015.. A random sample of panelists was invited to complete the survey from a large representative panel of over 500,000 Canadians, recruited and managed by Research Now, one of the world’s leading provider of online research samples.
The Marketing Research and Intelligence Association policy limits statements about margins of sampling error for most online surveys. The margin of error for a comparable probability-based random sample of the same size is +/- 2.2%, 19 times out of 20. The data were weighted according to census data to ensure that the sample matched Canada’s population according to age, gender, educational attainment, and region. Totals may not add up to 100 due to rounding.
Abacus Data Inc.
We offer global research capacity with a strong focus on customer service, attention to detail and value added insight. Our team combines the experience of our Chairman Bruce Anderson, one of Canada’s leading research executives for two decades, with the energy, creativity and research expertise of CEO David Coletto, PhD. For more information, visit our website at http://www.abacusdata.ca/