Liberal Re-Election Hopes?
May have less to do with a pipeline, more about attracting investment and helping with housing affordability.
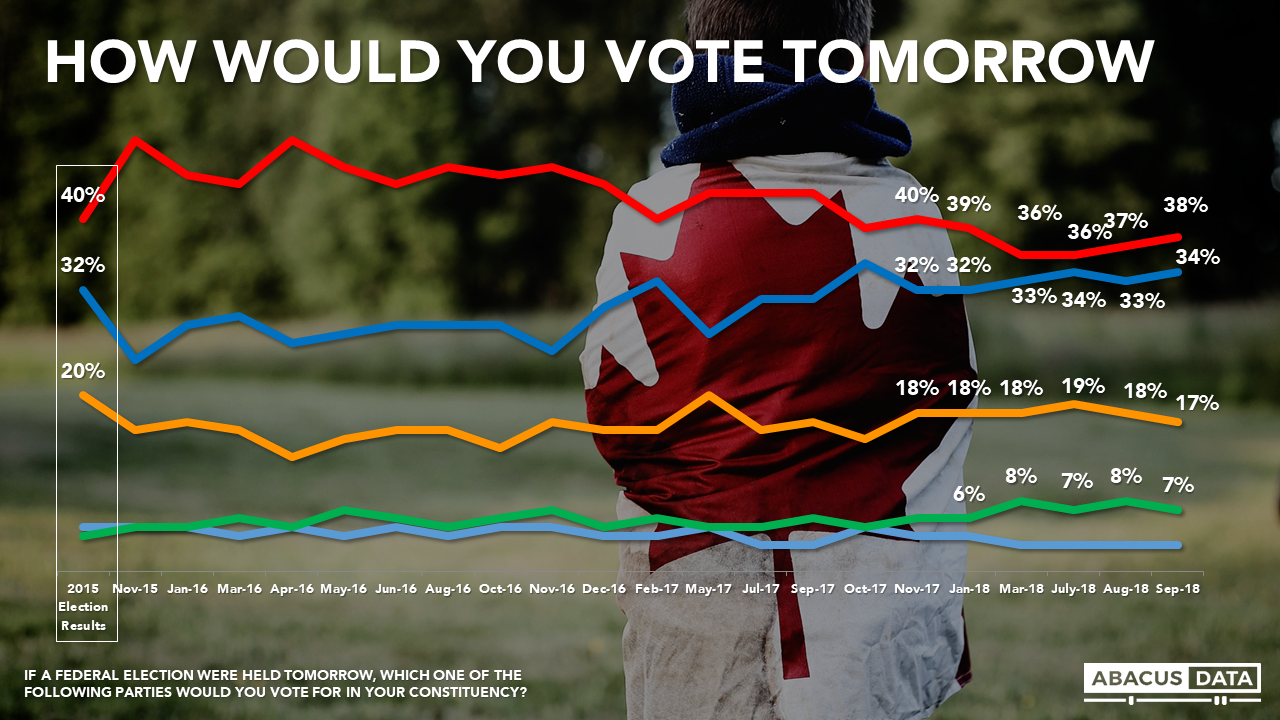
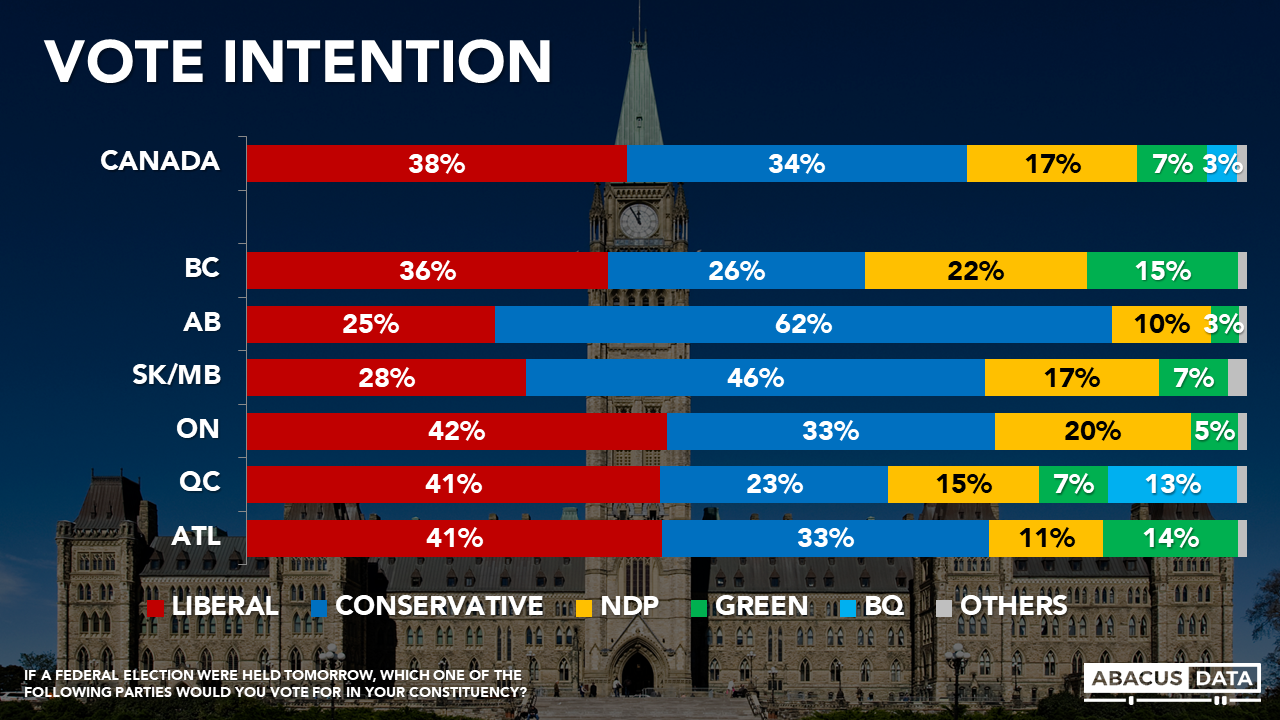
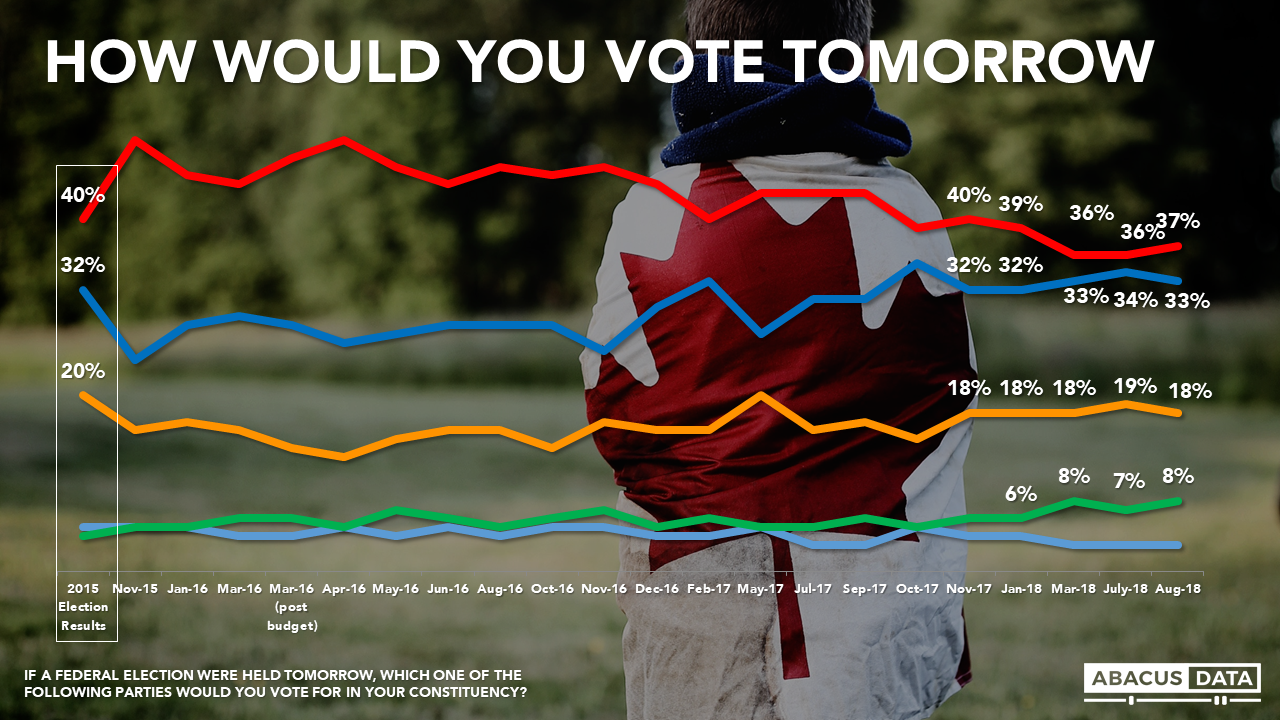
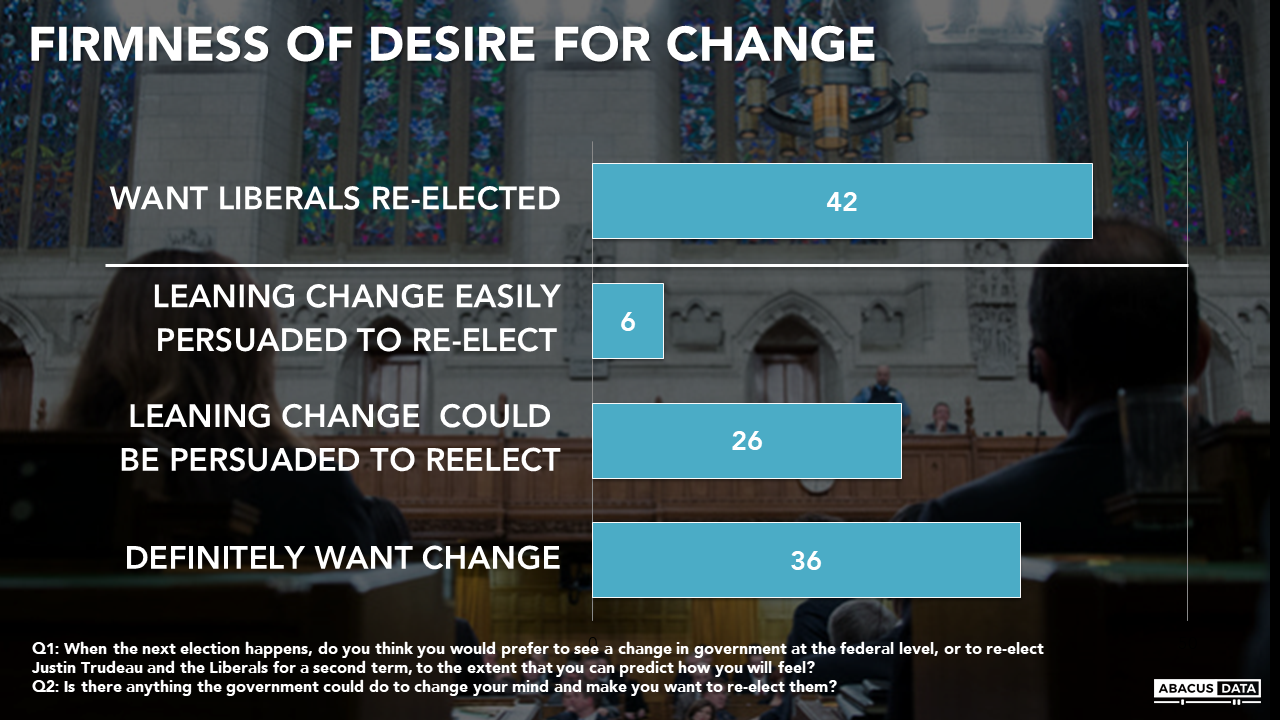
As of today, 42% of voters say they would like to see the Liberals re-elected next year, and 58% say they would prefer to see a different party take power in Ottawa. To put this in context, the Liberal Party won in 2015 with 39% of the vote – so 42% can be enough, but there is not a great deal of room between these two numbers.
While the desire for a change is broad, what often affects the outcome is the intensity of voter feelings. In our latest study we explored more about how determined people were to see change, and what if anything the Liberals could do to persuade them and win a second Trudeau term.
When we ask the 58% who want change whether there is anything the Liberals could do that would persuade them to support. The results reveal a scenario where another 32% of the voting public indicate they could be persuaded to vote to re-elect the Liberals.
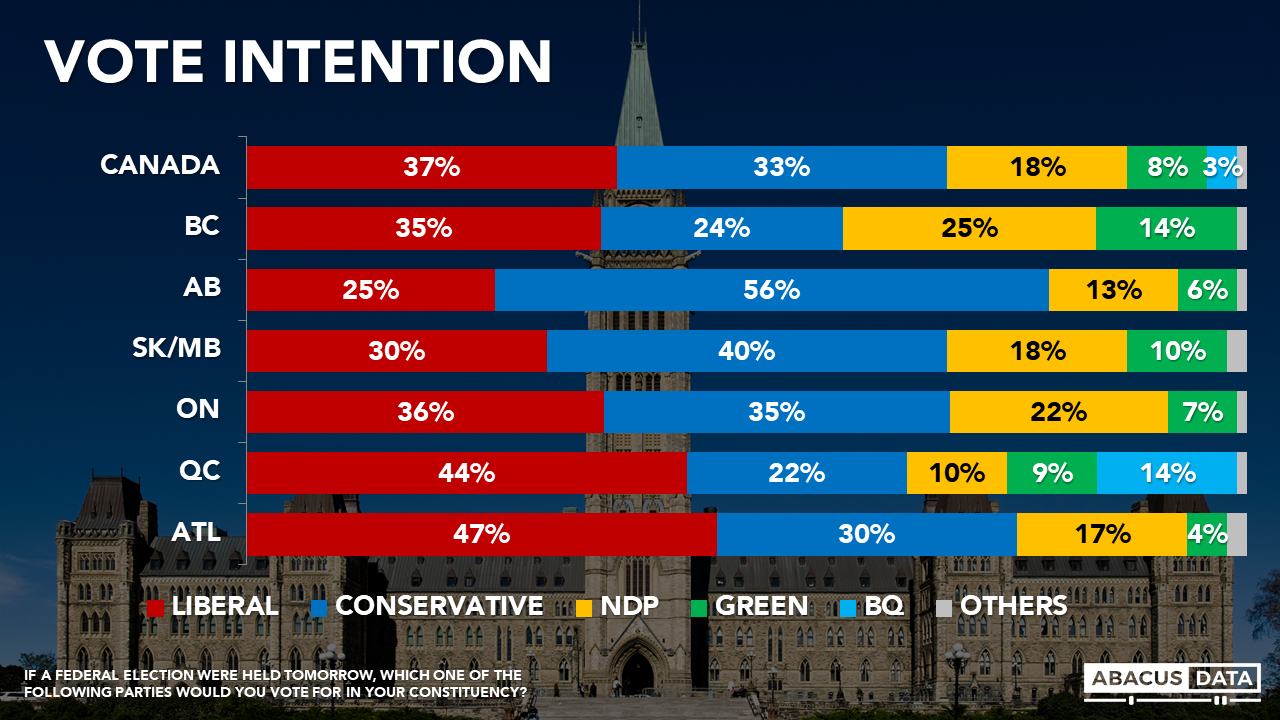
To better understand these 32% persuadable voters, we’ve focused in on a group that is presently planning to vote either Conservative (9% of the population, we will call Blue Persuadables) or NDP (6% of the population, we’ll call Orange Persuadables). Together this 15% could become crucial swing voters for the Liberals as they begin planning their platform and election campaign.
We then went on to explore how many of these voters could be won over to the Liberal column based on a variety of different issues and initiatives. Not surprisingly, the list of things that would pull Orange Persuadables is somewhat different from that which would work for Blue Persuadables – but it’s not as different as one might expect.
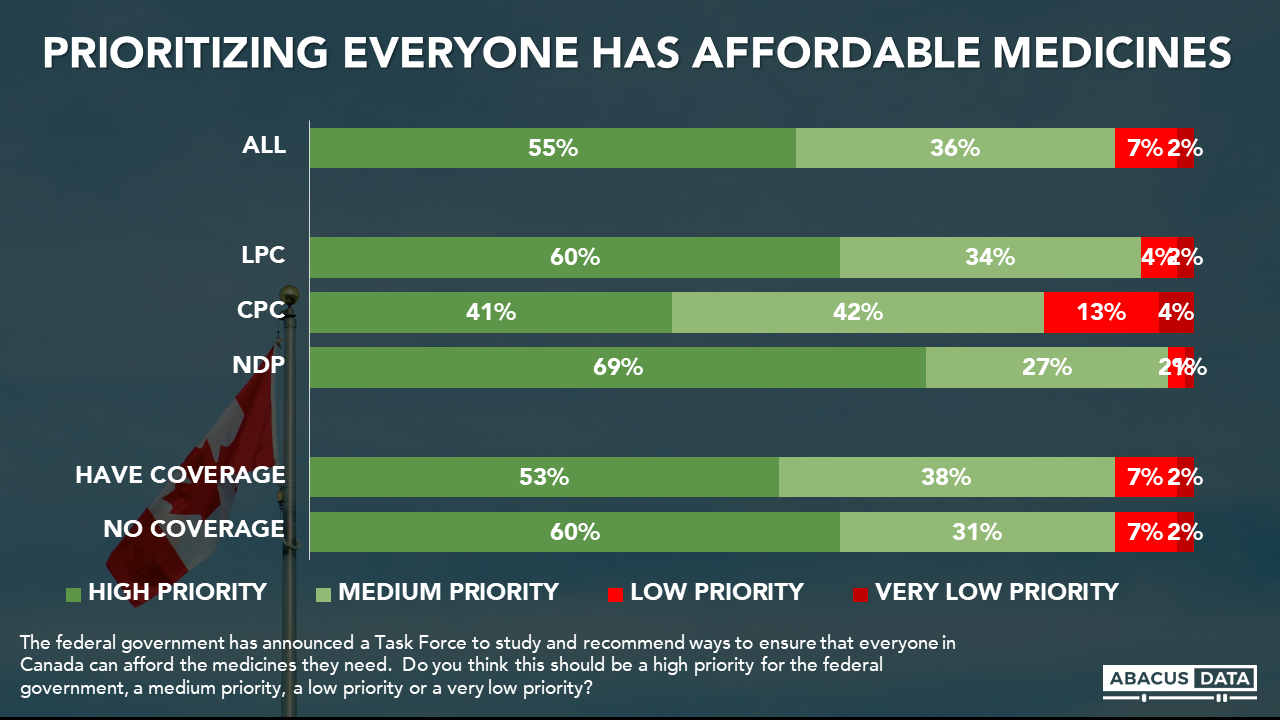
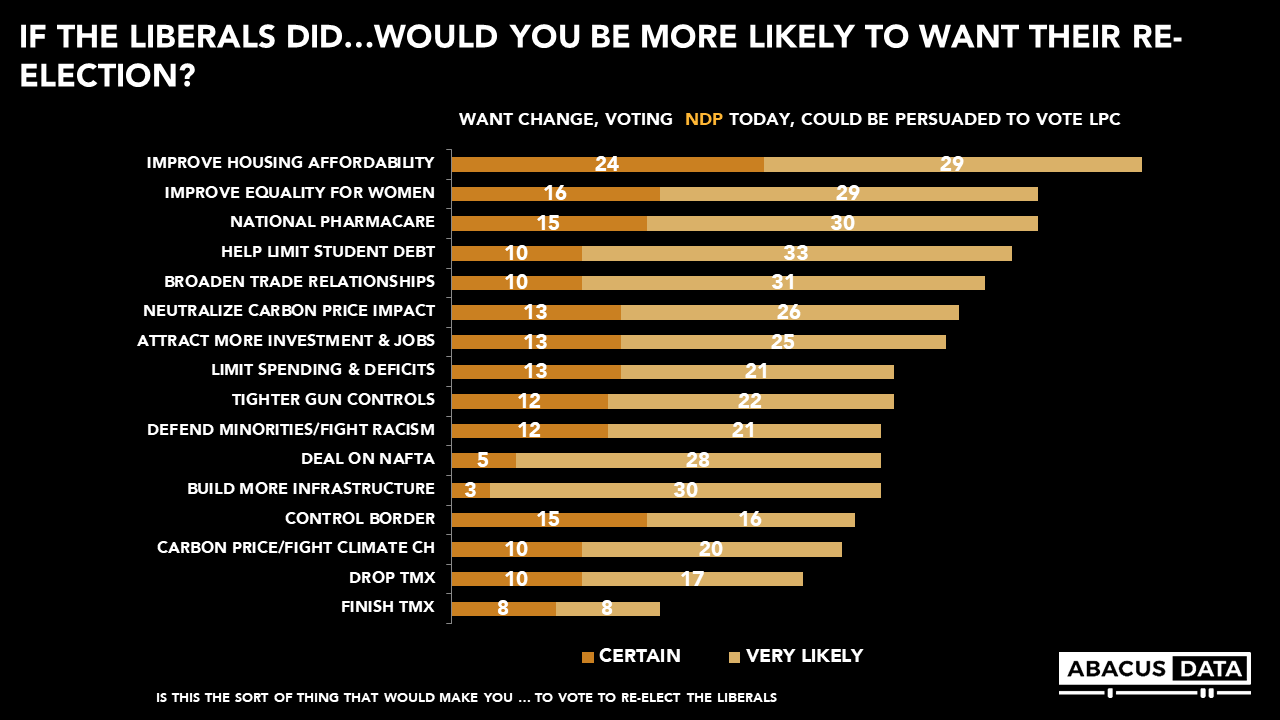
For Orange Persuadables, the top 5 items among the 16 we tested were improving housing affordability, improving equality for women, helping reduce student debt, introducing a national pharmacare plan and broadening our trade relationships. Here are some of the things we find interesting in this data.
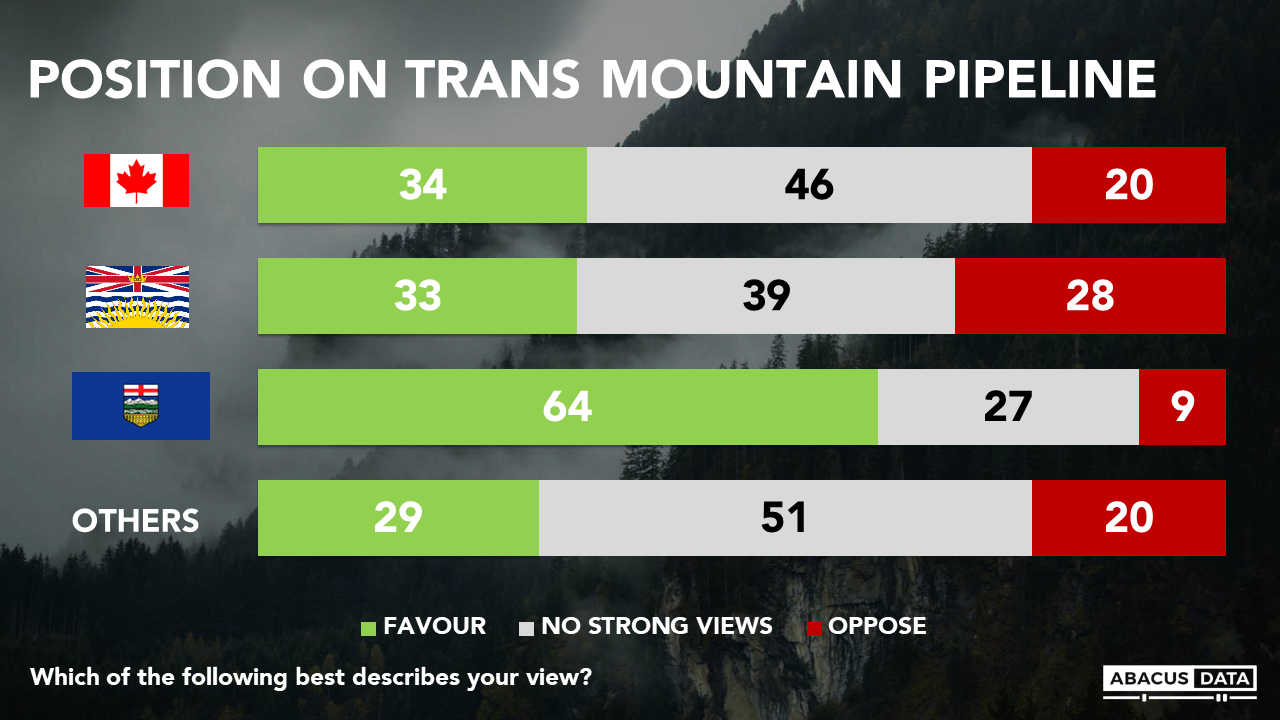
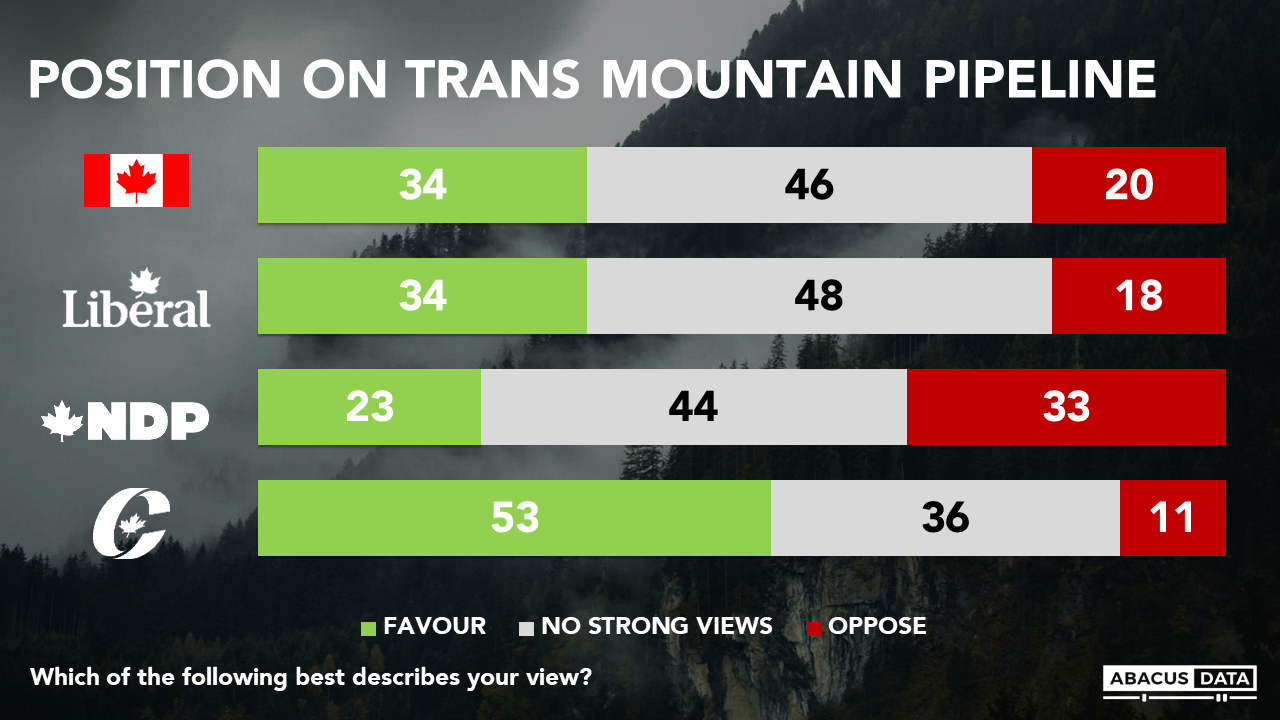
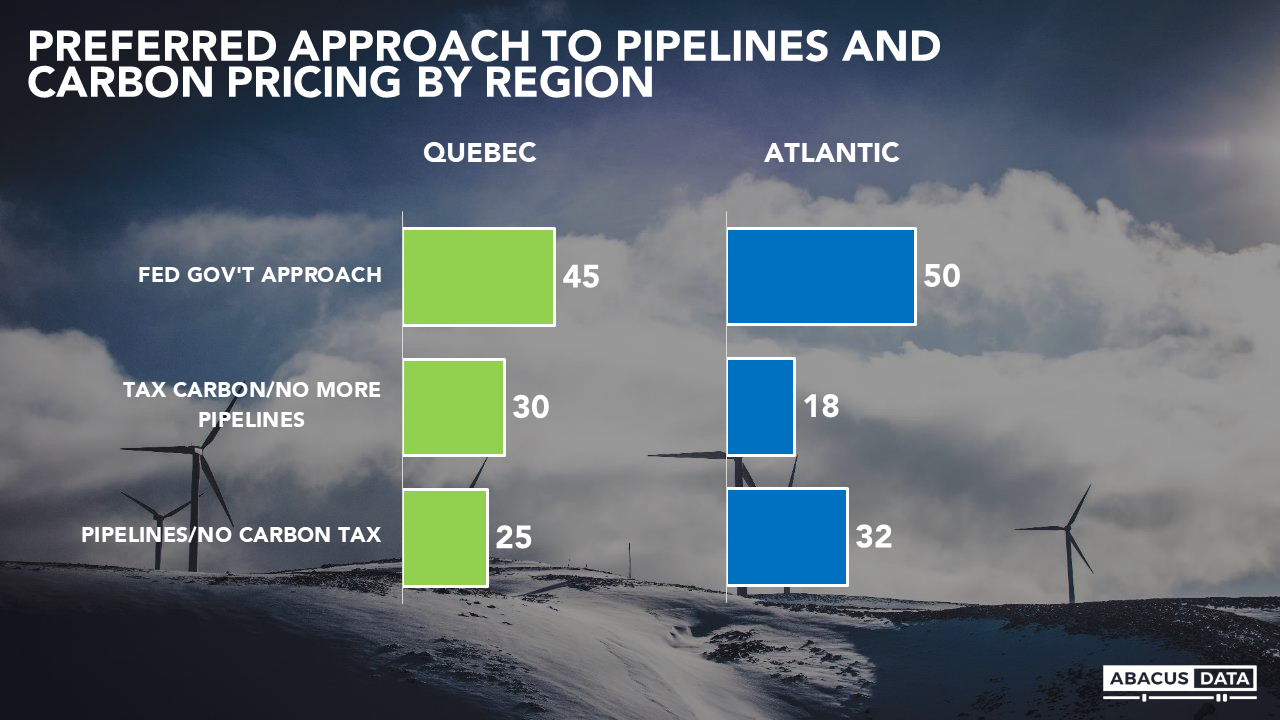
Near the very bottom of the list are introducing a carbon price and dropping the TMX pipeline, which are reminders that while activists may be very vocal on these issues – these may not be matters of great topicality for regular voters. Almost as many Orange Persuadables would be won over by completing the pipeline as by dropping the project, also a reminder that many NDP supporters see value in the jobs of the extractive sector and in the construction business.
On carbon pricing, more Orange Persuadables would be won over by moves to making a carbon price neutral in terms of impact on the cost of living for voters than by the introduction of a carbon price itself. Ideas about consumer rebates could be helpful not only with hesitant conservative voters but “cost of living stressed” left of centre voters as well.
Broadening our trade relationships to more countries has more pulling power than many other items on this list, including completing an updated NAFTA deal. This is a reminder that in the era of Donald Trump, Canadians may be more convinced than ever of the virtue of putting more of our eggs in different baskets.
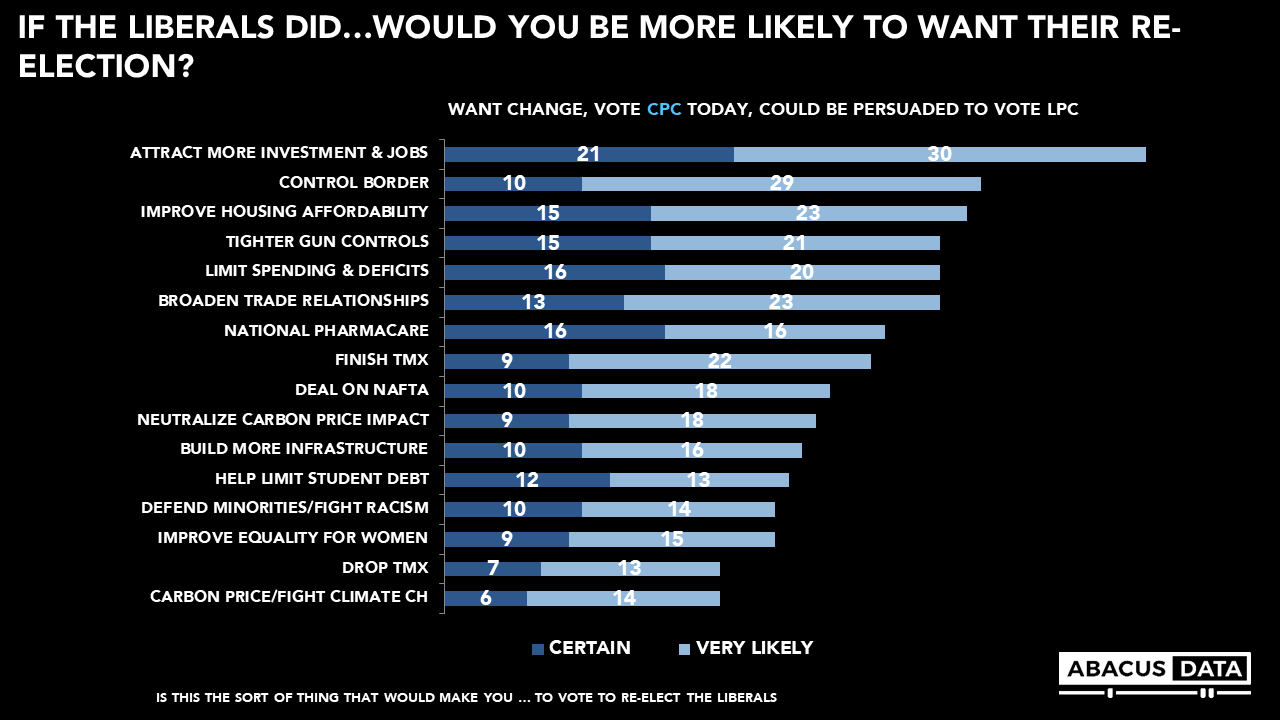
Turning to the Blue Persuadables, the top 5 items that could pull votes towards the Liberals are attracting more investment and jobs, doing more to control the border, improving housing affordability, tighter gun controls and doing more to limit spending and deficits. Number 6 on the list is broadening our trade relationships. What’s interesting in this data?
The current debate about gun controls is not the same as a long-form gun registry. There may be a significant number of conservative voters who see tighter controls over handguns and automatic weapons as a question of public safety/law and order.
The fact that housing affordability is at or near the top of the list for both groups underscores how powerful the cost of housing has become as a source of frustration for many middle to lower income and younger voters, especially in the country’s largest urban centres. Any party looking to create a platform that resonates would be well advised to look for solutions that might appeal to these voters.
Attracting investment and more jobs is a bigger pull than limiting spending, finishing TMX or concluding a deal on NAFTA. These persuadable conservatives will be attentive to a future growth story including about diversification of trading relationships, more than a retrenchment or austerity pitch.
UPSHOT
A lot of commentary focuses on the horserace numbers separating the three main parties, but a more interesting way to evaluate how this election scenario is shaping up is to recognize how many voters are up for grabs, and what might motivate them one way or another.
The Liberals have suffered some losses of top-line support over the last year but a remarkably large number of voters say they could be persuaded to want a Trudeau second term. Doing something to help people trying to get into the housing market, broadening trade relationships, attracting investment, are the areas of focus that tend to cut across the spectrum in terms of appeal, and in some ways are more topical for people than the high profile debates about carbon price and pipelines.
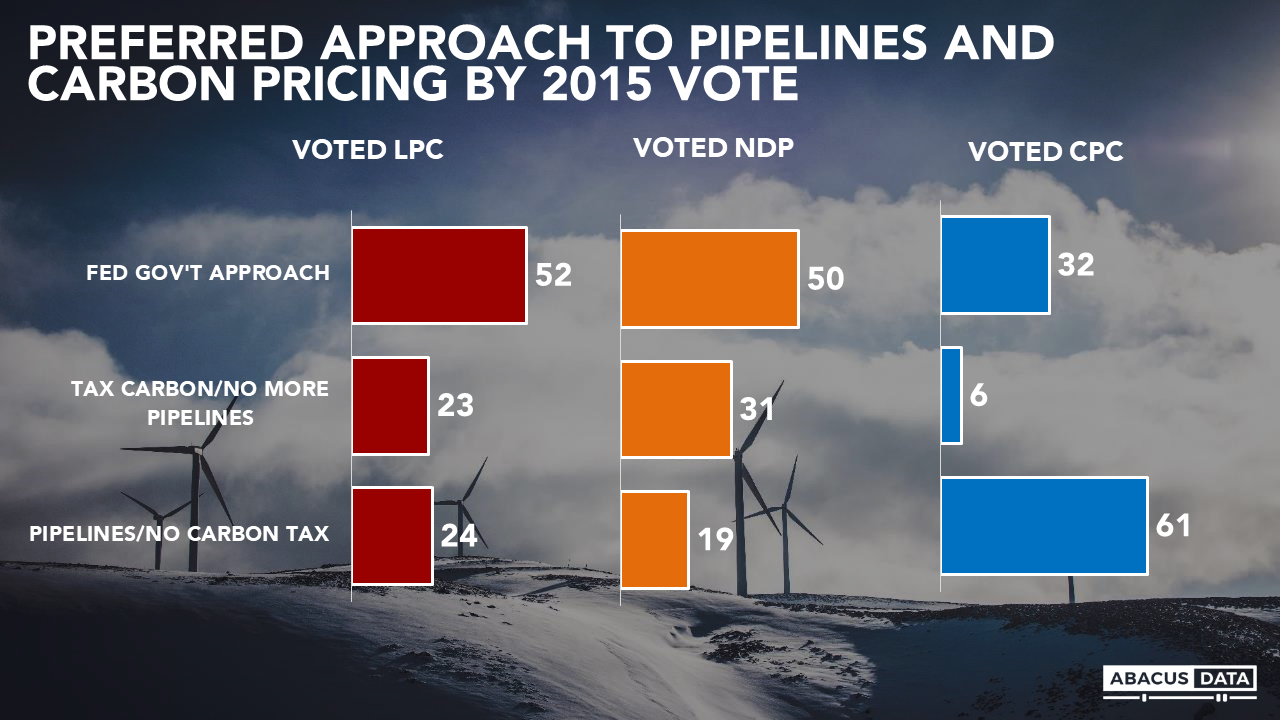
For the Liberals, efforts to complete the pipeline and soften the consumer impact of a carbon price seem to be a path that will be perhaps as good as they can find on these contentious issues.
For Conservatives, these numbers are a reminder that the desire for change is not all that broad at this point, nor is it all that deeply felt. To win, they likely will need more than the current level of frustration with the Liberals and many of the ideas on this list might usefully be considered in their platform development. Certainly, opposing more gun controls might be a question worth careful consideration, as might be the intense focus on the pipeline and carbon price question. No doubt these animate the base but maybe leaving other voters to wonder what’s in a Conservative wish list for them.
Methodology
Our survey was conducted online with 2,000 Canadians aged 18 and over from September 14 to 19, 2018 2018. A random sample of panelists was invited to complete the survey from a set of partner panels based on the Lucid exchange platform. These partners are double opt-in survey panels, blended to manage out potential skews in the data from a single source.
The margin of error for a comparable probability-based random sample of the same size is +/- 2.2%, 19 times out of 20. The data were weighted according to census data to ensure that the sample matched Canada’s population according to age, gender, educational attainment, and region. Totals may not add up to 100 due to rounding.