Each day during the 2021 Federal Election campaign, researchers at Abacus Data will share insights and analysis from our polling in concise, insights-focused reports. To never miss our polls and analysis, subscribe to our newsletter.
Let’s face it, apart from political junkies like me, most people don’t love politics. Elections matter but some elections are more interesting than others. Some are close and the outcome unpredictable. Others have a defining issue that galvanizes voters and spikes interest. Others are change elections that mobilize voters to “throw the bums out” while others feature dynamic, new political leaders that excite voters.
Will voters be engaged or not in this election?
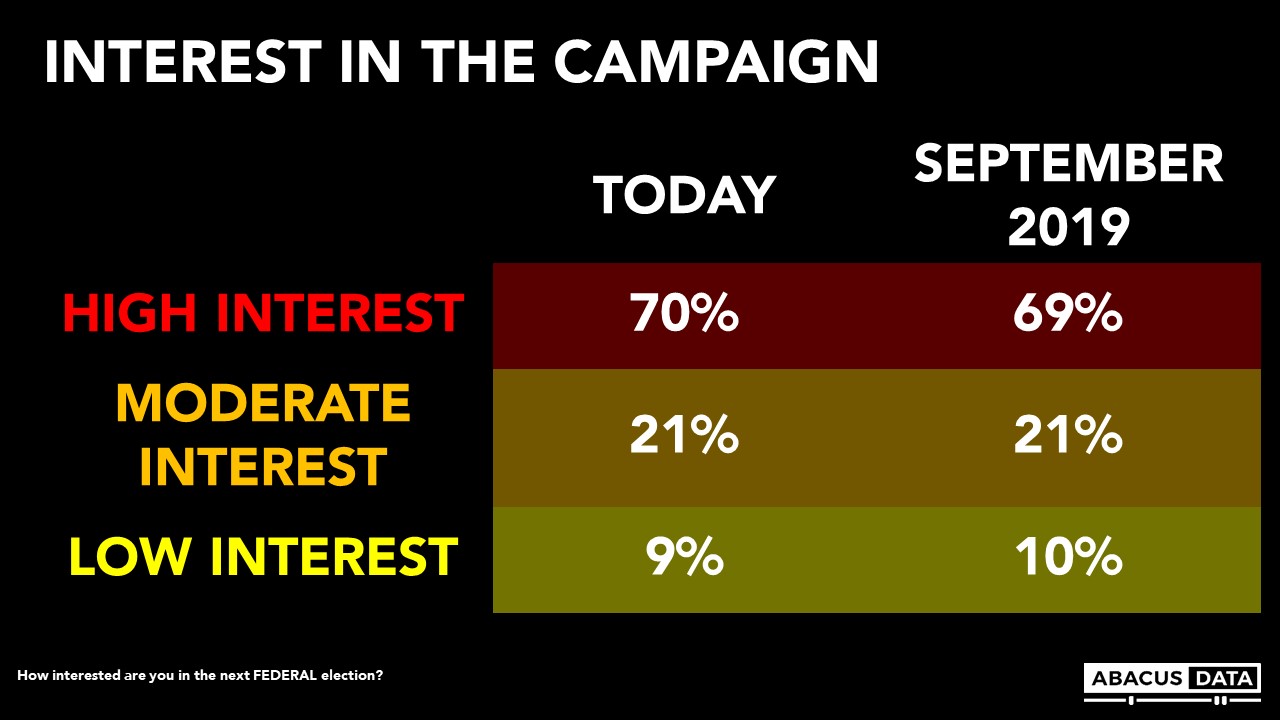
In our pre-election survey of 3,000 Canadians, we asked how interested respondents were in the upcoming election on a scale from 1 to 10.
Overall, interest in this election appears as high as measured in the second week of the 2019 campaign.
70% of respondents said they have a high level of interest (7 to 10) while another 21% said they were moderately interested (4 to 6) while 9% said they had little interest in the campaign (1 to 3).
Back in September 2019, 69% said they had a high interest in the campaign. So early indications are that Canadians are as engaged as they were back in 2019 despite it being in summer and perhaps because it’s coming in the midst of a global pandemic.
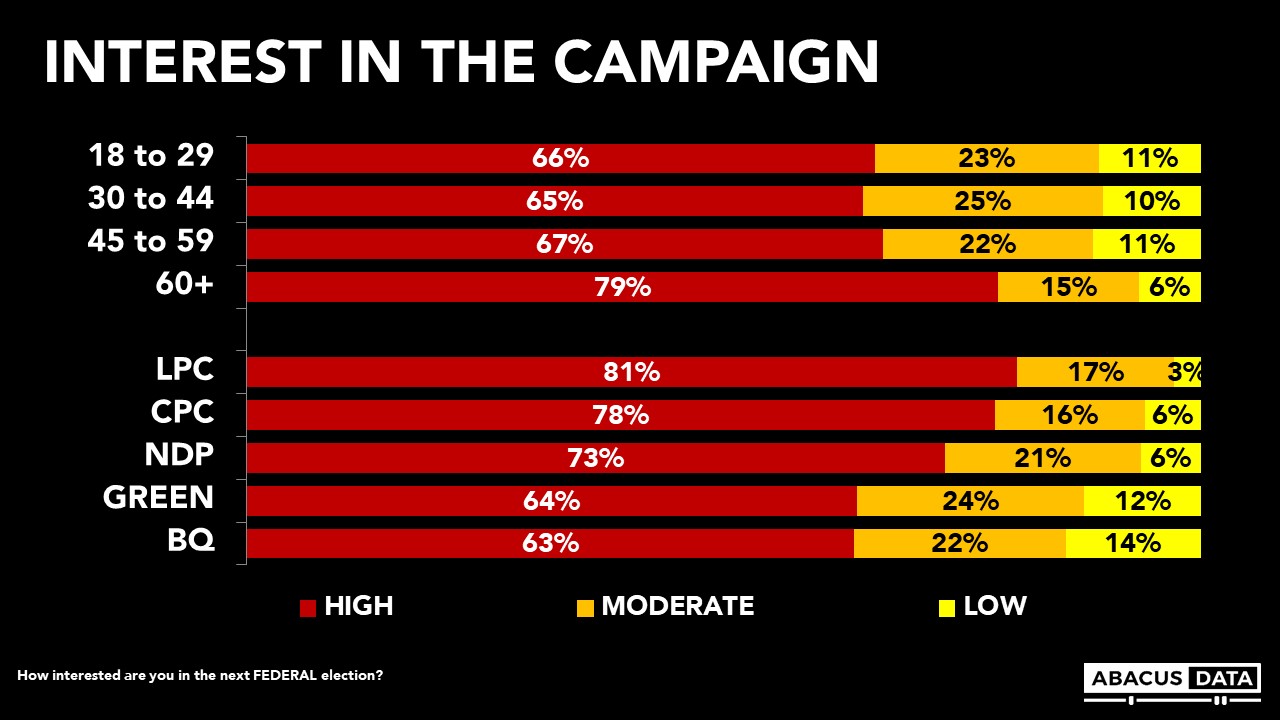
Our survey finds that older Canadians are more interested than younger Canadians while those planning to vote Liberal or Conservative are more likely to have high interest than those planning to vote NDP, Green, or Bloc Quebecois.
UPSHOT
Too often pundits and commentators decry the lack of interest in politics or suggest that interest in any given election will be low without evidence to back up their claim.
I recall this happening during the 2019 campaign.
But early indications from our research suggest that Canadians are as interested in this election as they were back in 2019. That could change of course – interest could increase or dissipate as the campaign progresses.
Interest in the election and politics more generally matters a lot. It impacts voter turnout (definitely read this book about it), it could impact differential turnout (supporters of certain parties being more motivated to vote than others), and it impacts how people react to campaign events. An electorate engaged in a campaign will be paying closer attention and therefore could react more to the campaign.
More importantly this time, despite a summer election call in the midst of the 4th wave of COVID-19 cases, most Canadians say they are at least moderately interested in this campaign.
Let’s not assume no one is paying attention. The Trump era in the US taught us that elections and politics matter. Canadians are paying attention, so far, this time.
METHODOLOGY
The survey was conducted with 3,000 Canadian adults from August 6 to 11, 2021. A random sample of panelists were invited to complete the survey from a set of partner panels based on the Lucid exchange platform. These partners are typically double opt-in survey panels, blended to manage out potential skews in the data from a single source.
The margin of error for a comparable probability-based random sample of the same size is +/- 1.8%, 19 times out of 20.
The data were weighted according to census data to ensure that the sample matched Canada’s population according to age, gender, educational attainment, and region. Totals may not add up to 100 due to rounding.
ABOUT ABACUS DATA
We are the only research and strategy firm that helps organizations respond to the disruptive risks and opportunities in a world where demographics and technology are changing more quickly than ever.
We are an innovative, fast-growing public opinion and marketing research consultancy. We use the latest technology, sound science, and deep experience to generate top-flight research-based advice to our clients. We offer global research capacity with a strong focus on customer service, attention to detail and exceptional value.
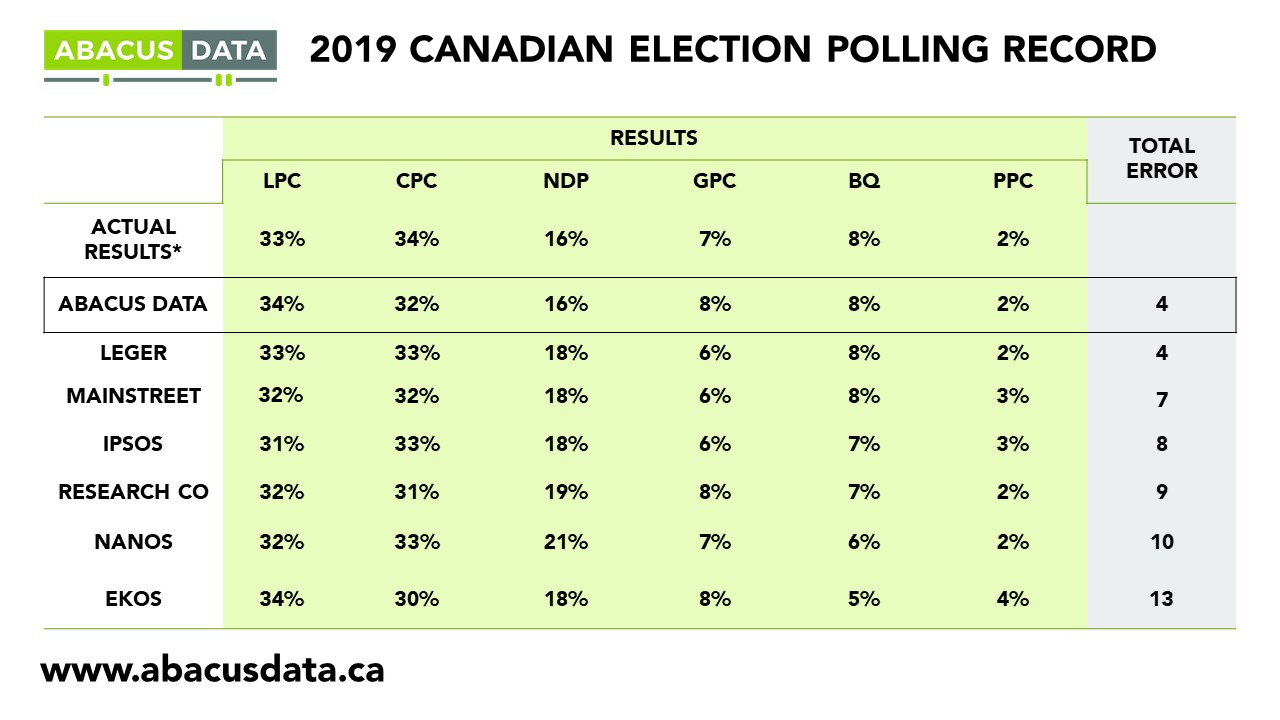
We were one of the most accurate pollsters conducting research during the 2019 Canadian Election.
Along with polling data, there are other data sources that can offer some insight into the dynamics of the election campaign.
Looking at what Canadians are searching for on Google is of particular interest. Not only because Google provides real-time, comparable data, but search behaviour can tell us what Canadians are interested in and looking for more information on. There’s some evidence in other domains that search data can be used to anticipate changes in public opinion.
We have create a few queries that we think you’ll find interesting.
These charts are automatically updated in real-time so check back often to see if, and how, things change over the course of the election.
PARTY LEADERS (Past 7 Days)
PARTY LEADERS – QUEBEC (Past 7 Days)
POLITICAL PARTIES (Past 7 Days)
CONSERVATIVE vs. MAVERICK vs. PEOPLE’S in ALBERTA (Past 30 Days)
ABOUT ABACUS DATA
We are the only research and strategy firm that helps organizations respond to the disruptive risks and opportunities in a world where demographics and technology are changing more quickly than ever.
We are an innovative, fast-growing public opinion and marketing research consultancy. We use the latest technology, sound science, and deep experience to generate top-flight research-based advice to our clients. We offer global research capacity with a strong focus on customer service, attention to detail and exceptional value.
For video interviews by Skype or Zoom or audio interviews, please contact David at 613-884-4730 or david@abacusdata.ca
In a survey I did for the Broadbent Institute back in March 2019, I described the mood at the time as affordability anxiety – a feeling that your income is not covering your day-to-day expenses and your ability to cover those expenses will only get harder, not easier.
This year, we asked several of the same questions again in a survey we did for the Broadbent Institute and the Professional Institute of the Public Service of Canada.
Here’s what we found:
1. Affordability anxiety persists. 83% of Canadians worry at least a little about their cost of living, with 39% saying they are pretty or very worried. Overall, this is slightly down from 2019 but remains elevated. Younger Canadians and those in households earning less than $50,000 per year were more likely to feel worried about their cost of living rising.
2. Affordability anxiety crosses the political spectrum but highest among Green, NDP and undecided voters. Worry about a rising cost of living crosses the political spectrum. Those who say they are pretty or very worried about their cost of living rising by current vote:
Liberal – 33%
Conservative – 31%
NDP – 46%
Green – 51%
BQ – 41%
Undecided voters – 49%
3. Cost of living, healthcare, and housing affordability are the top three vote drivers. When asked which three issues are most likely to impact how they vote, cost of living (35%), healthcare (33%) and housing affordability (28%) along with economic growth and job creation were in the top four.
4. The pandemic has hurt the personal finances of 1 in 3 Canadians – or almost 10 million people. 33% of Canadians say the pandemic left their household budget and savings worse off while 14% they are better off financially.
5. Most Canadians believe the cost of things they use day-to-day and the income differences between the richest 1% and your personal salary have gotten worse over the past 2 years. When assessing whether several things have gotten better or worse over the past two years, 64% feel the cost of things they use and consume day to day have gotten worse. Moreover:
53% think the income difference between the richest 1% and their salary is worse over the past two years.
42% say their ability to save for retirement has gotten worse over the past two years
41% say their feelings of stress about money has gotten worse over the past two years.
6. What would help make life more affordable? There’s no silver bullet and reactions depend on someone’s life stage and economic position. But millions of Canadians believe that covering more under public health care, ensuring everyone has a stable job with a decent wage, and taxing wealthier Canadians and large corporations more to pay for better public services for everyone would help.
For others, forcing companies to reduce prices, cutting taxes for middle and working-class Canadians, and making childcare more affordable would help a lot.
Those under 30 are more likely to think the following would help make their life more affordable:
Making childcare more affordable, raising the minimum wage, reducing tuition fees, creating incentives to encourage employers to raise wages, improving public transit and reducing transit fees, and making it easier for workers to unionize.
Those aged 60 and over are more likely to think the following would help make their life more affordable:
Covering more services under public healthcare, taxing wealthier Canadians and large corporations more to pay for better public services for everyone, and forcing companies to reduce the prices they charge for things.
Although the level of affordability anxiety is lower than it was in 2019, it remains widespread, especially for those most hurt financially by the pandemic and is a top vote driver for over 1 in 3 Canadians – higher than any other issue.
Millions of Canadians worry about being able to afford their lives as pressure from rising costs and stagnant wages increase anxiety.
People believe the pandemic has made things worse. Not only do those most impacted by the pandemic feel even more anxious about affordability, but many feel the pandemic has increased inequality between the richest and everyone else.
The connection between affordability anxiety and perceptions of increasing income and wealth inequality is clear. Concerns about wages and income, job security, and rising prices are colliding with growing uncertainty about the sustainability of public services with a large deficit and more debt along with an uncertain economic recovery.
As we approach a federal election campaign and party leaders and candidates debate how best to deal with the federal deficit and affordability issues – these results clearly indicate that most Canadians will react negatively to ideas that they feel will make their lives more expensive. In contrast, as we have seen in the previous research we released, there’s broad appetite for asking those with the most to pay a bit more.
Protecting public services and keeping costs down for middle- and lower-income Canadians while asking those with the most to pay more to cover the cost of the pandemic and the recovery is a cross-partisan, broadly supported approach.
METHODOLOGY
Our survey was conducted online with 1,500 Canadians aged 18 and over from July 13 to 19, 2021. A random sample of panellists was invited to complete the survey from a set of partner panels based on the Lucid exchange platform. These partners are double opt-in survey panels, blended to manage out potential skews in the data from a single source.
The margin of error for a comparable probability-based random sample of the same size is +/- 2.6%, 19 times out of 20. The data were weighted according to census data to ensure that the sample matched Canada’s population according to age, gender, educational attainment, and region. Totals may not add up to 100 due to rounding.
ABOUT ABACUS DATA
We are the only research and strategy firm that helps organizations respond to the disruptive risks and opportunities in a world where demographics and technology are changing more quickly than ever.
We are an innovative, fast-growing public opinion and marketing research consultancy. We use the latest technology, sound science, and deep experience to generate top-flight research-based advice to our clients. We offer global research capacity with a strong focus on customer service, attention to detail and exceptional value.
We were one of the most accurate pollsters conducting research during the 2019 Canadian Election.
We just completed a national survey of 3,000 Canadian adults (August 6 to 11, 2021).
As we head towards a likely election call in the next few weeks, here’s our latest look at the Canadian political environment.
HOW WILL CANADIANS REACT TO AN EARLY ELECTION CALL?
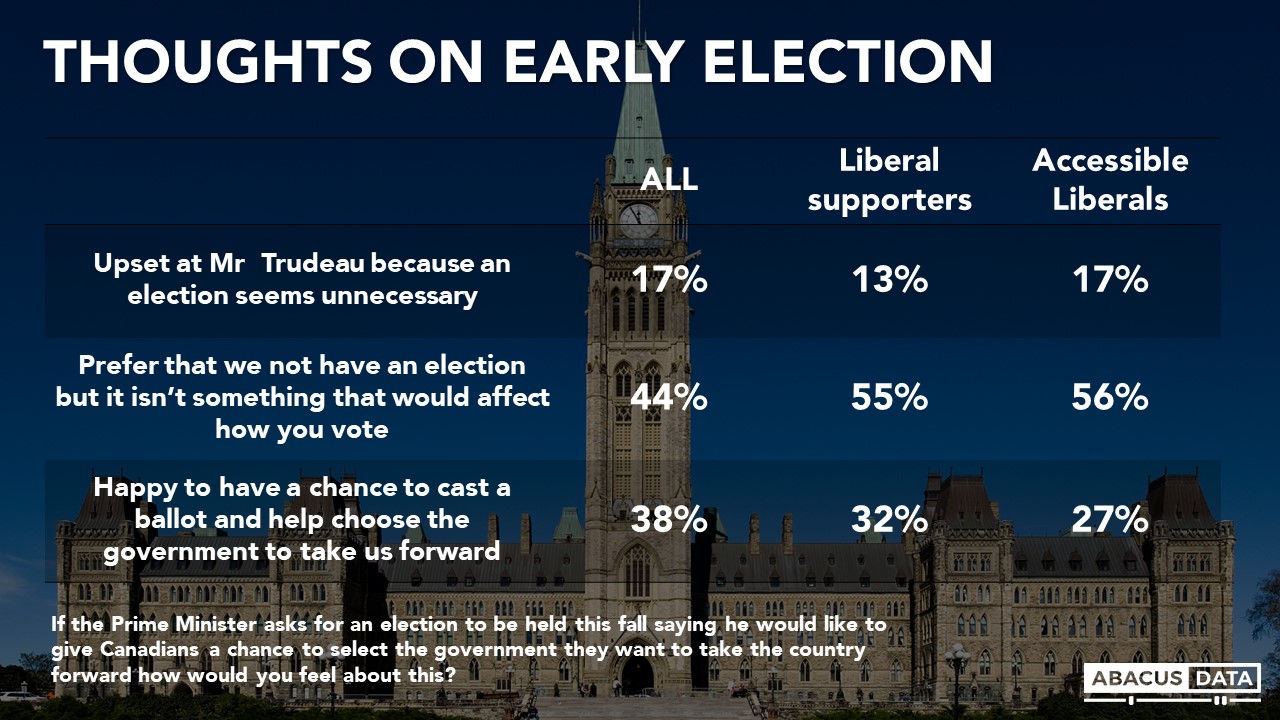
While only a minority prefer an election now, the vast majority (83%) won’t be upset at Mr. Trudeau if he asks the Governor General for an early election.
When asked, “If the Prime Minister asks for an election to be held this fall saying he would like to give Canadians a chance to select the government they want to take the country forward, how would you feel about this?” 38% say they would be happy to have a chance to cast a ballot and help choose the government to take us forward, 44% would prefer not to have an election but it isn’t something that would affect how they vote, while 17% say they would be upset at Mr. Trudeau because an election seems unnecessary.
Most (72% of the 17%) of those who would be upset about an election call are supporters of opposition parties – 40% Conservatives, 17% NDP, and 8% BQ.). 28% are Liberal supporters.
Among current Liberal supporters, 13% would be upset. Among accessible Liberals (those open to voting Liberal but don’t support the party), 17% would be upset.
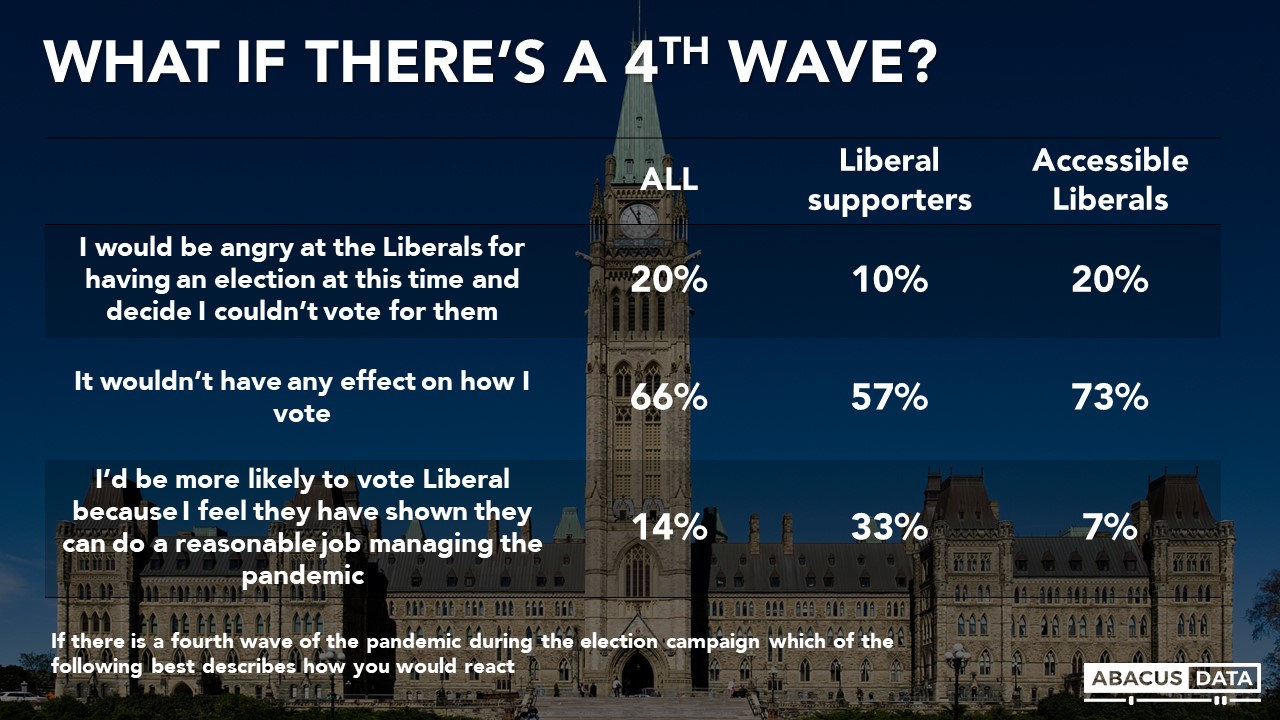
WHAT IF THERE’S A 4TH COVID WAVE?
We asked how people would react if a fourth COVID wave happens during an election campaign. Two-thirds (66%) say it wouldn’t have any effect on how they vote, 20% would be angry enough not to vote Liberal while 14% say they would be more likely to vote Liberal because they feel they have don’t a reasonable job already managing the pandemic.
Those who say they would be angry enough not to vote Liberal include 10% of current Liberal supporters and 20% of accessible Liberals.
MOOD OF THE COUNTRY
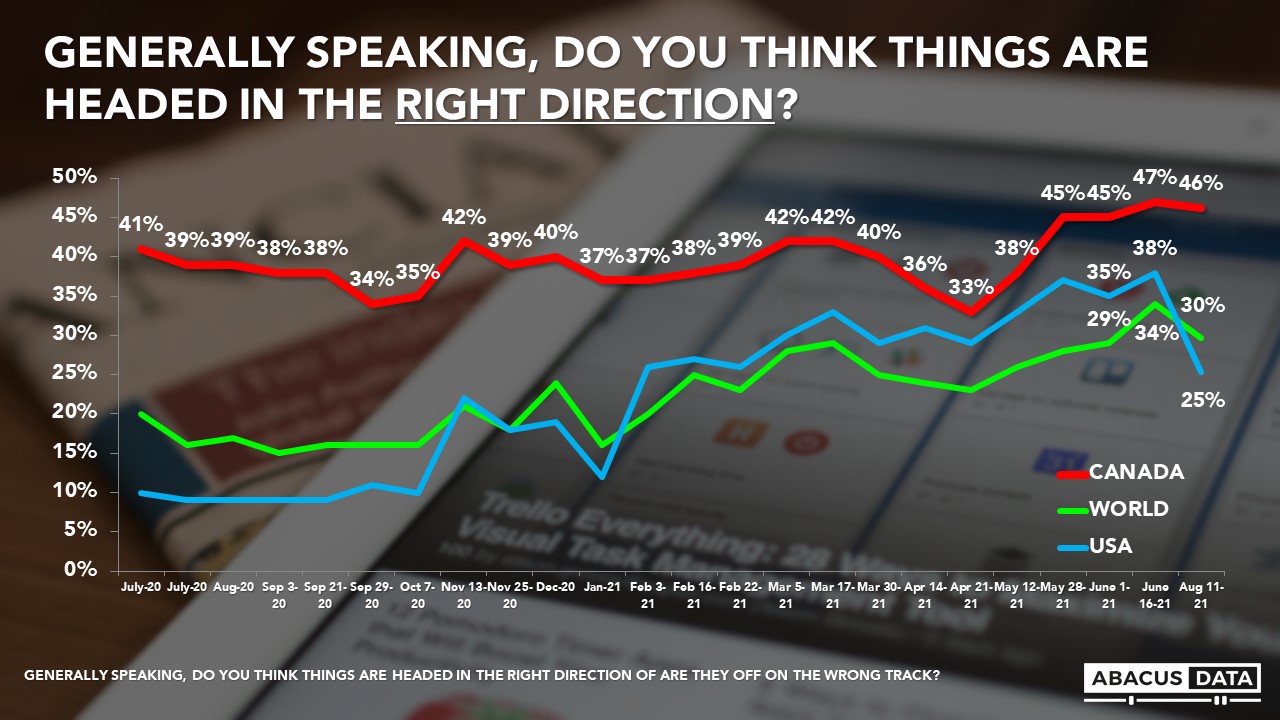
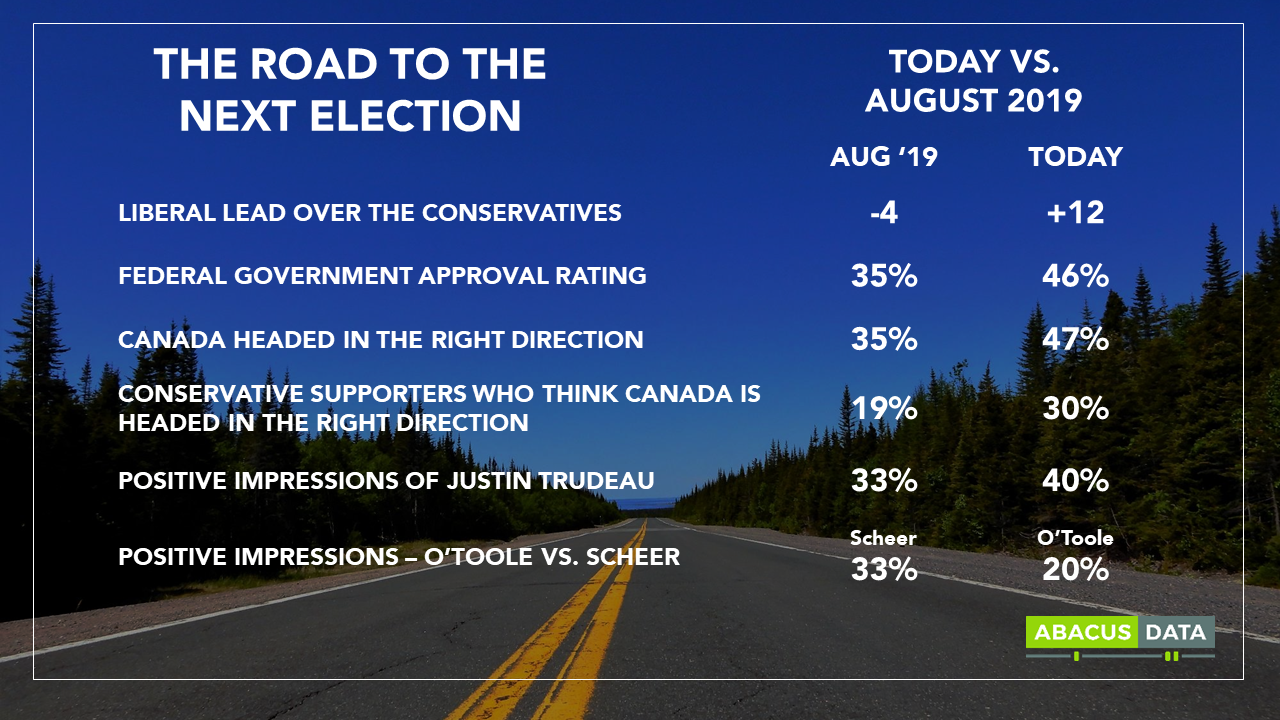
If a campaign starts imminently, Canadians will be in a far better mood than they were at the start of the 2019 campaign – 46% think the country is headed in the right direction. This is near the highest it has been in over 5 years and 11-points higher than at the start of the 2019 campaign.
In contrast, views about the direction of the US and the world more generally have turned more negative. While 38% of Canadians felt the US was headed in the right direction in June, today 25% feel the same way – a 13-point swing likely related to the rapid increase in COVID-19 cases in the US among the large unvaccinated population.
GOVERNMENT APPROVAL
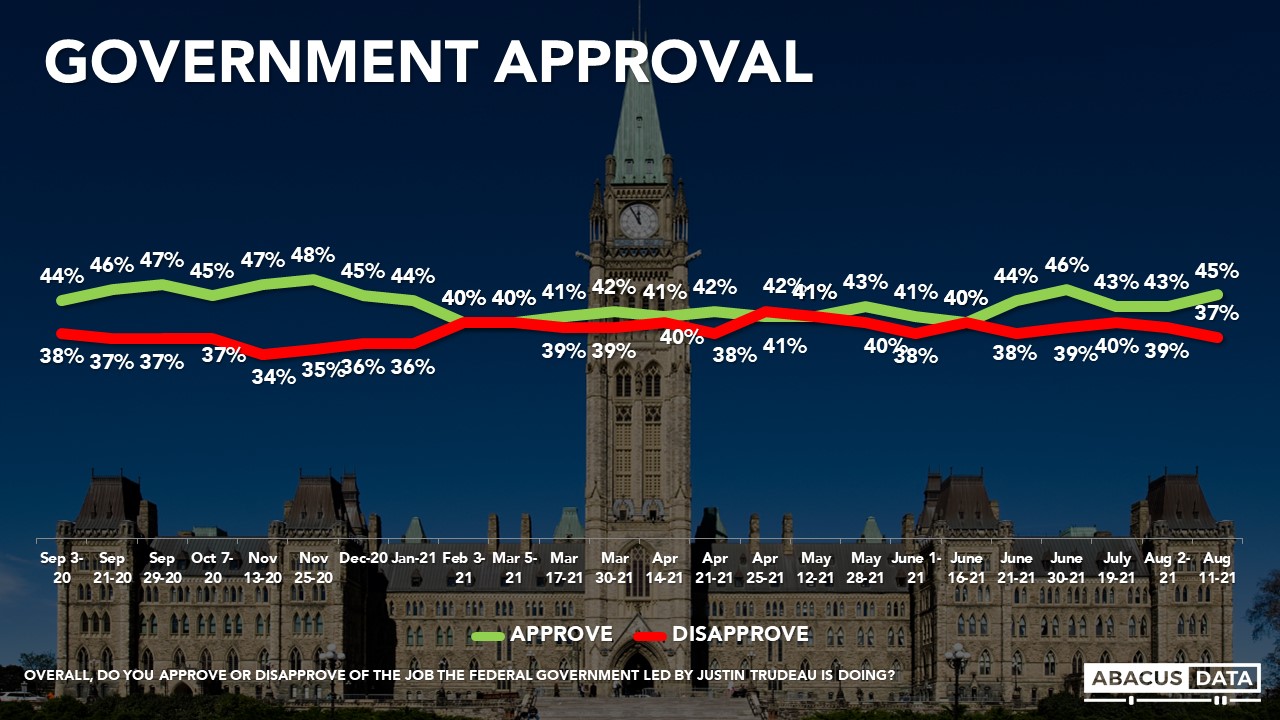
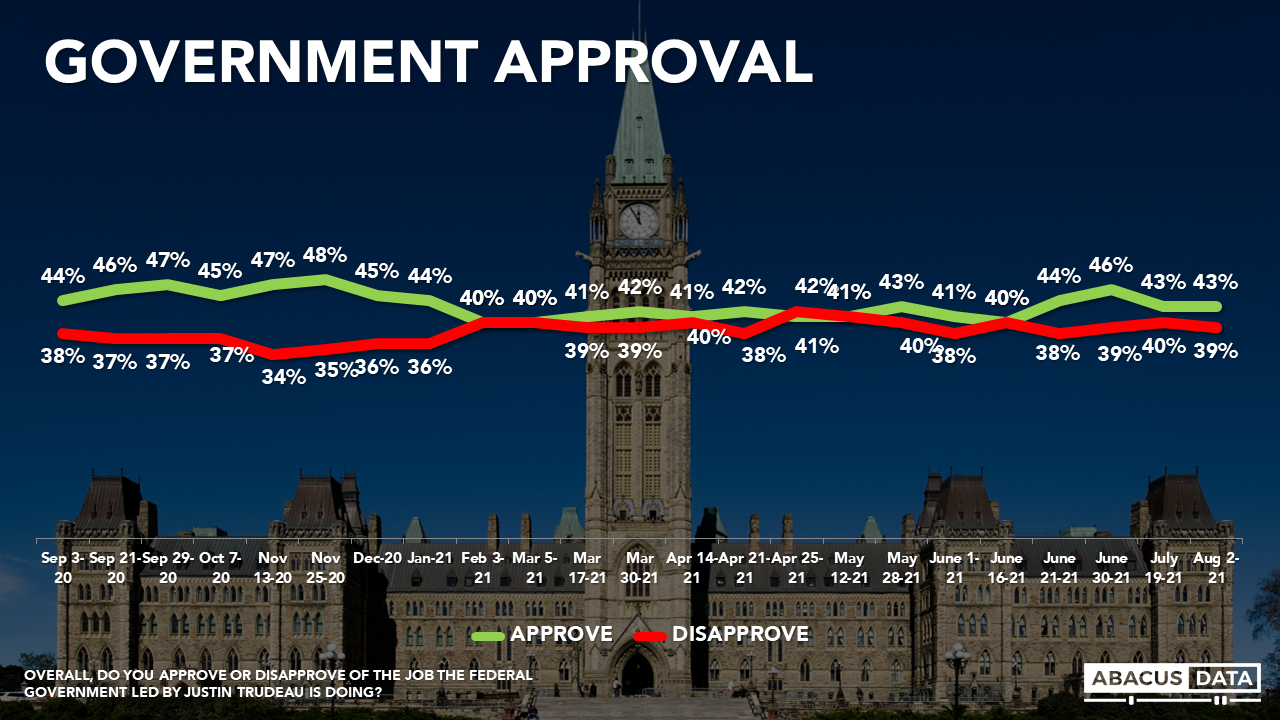
Today 45% approve of the job being done by the Trudeau government, while 37% disapprove – which is the lowest disapproval rating since January 2021. This +8 net score nationally breaks down to a +15 in BC, -20 in Alberta, -13 in Man/Sask, +15 in Ontario, +8 in Quebec, +27 in Atlantic Canada.
DESIRE FOR CHANGE
Over the past few months, the desire for change has inched up but is still far below views held at the end of the last campaign in 2019.
Today, 43% say it’s definitely time for a change in government while another 23% think it would be good to have a change (66% want change), but it’s not that important to them. In contrast, 20% say it’s definitely best to keep the Liberals in office while another 13% would like to keep the Liberals but say it’s not that important to them (33% want Liberals re-elected).
To put this in context, the strong desire for change is 9-points lower overall today than when Canadians voted on Election Day in 2019 (43% vs. 52%) – an election in which the Liberals won the most seats in the House of Commons.
LEADER IMPRESSIONS
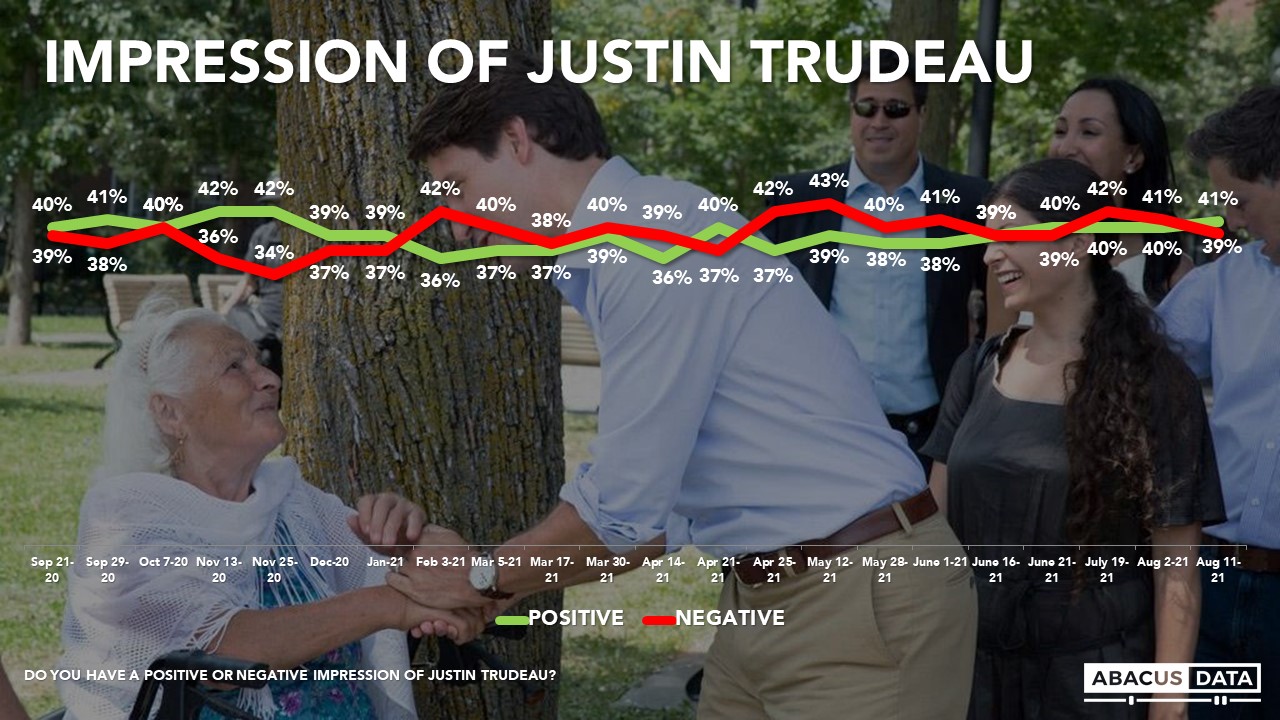
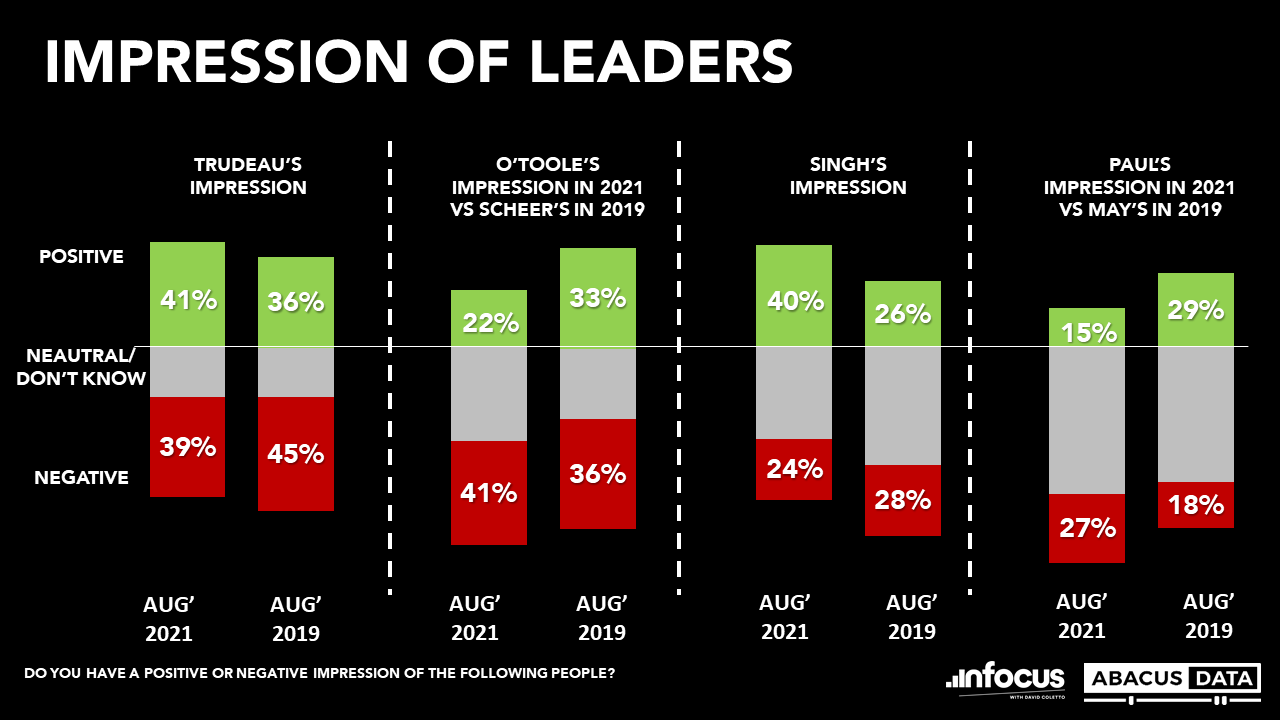
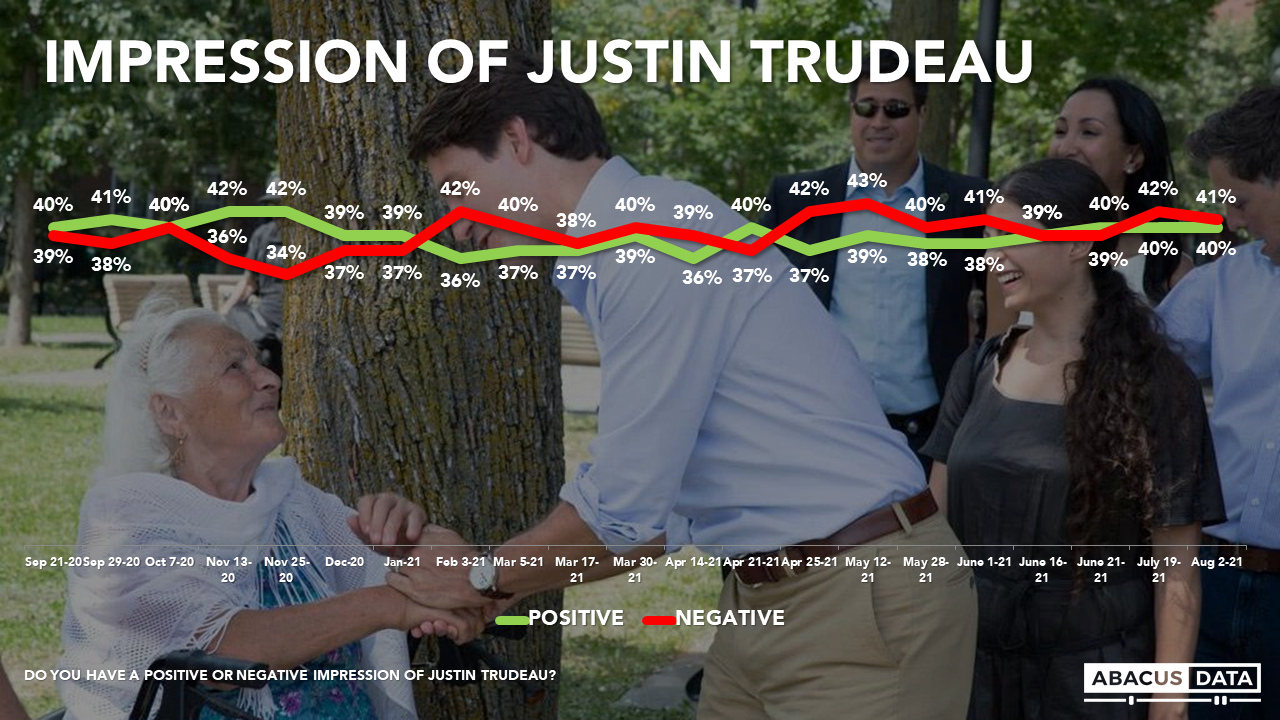
Justin Trudeau enjoys a positive impression among 40% and negative impressions among 41%, for a net score of -1. Views of Mr. Trudeau have been stable for most of 2021. In August 2019, 33% had a positive impression of Mr. Trudeau compared with 45% who had a negative view for a net score of -12.
Mr. Trudeau is more popular with women (+7), Atlantic Canadians (+19), Ontarians (+8), and those who self-ID as a racialized Canadian (+20). Among Liberal supporters he is +83 and among Liberal accessible voters (those open but not currently voting Liberal) he is +23.
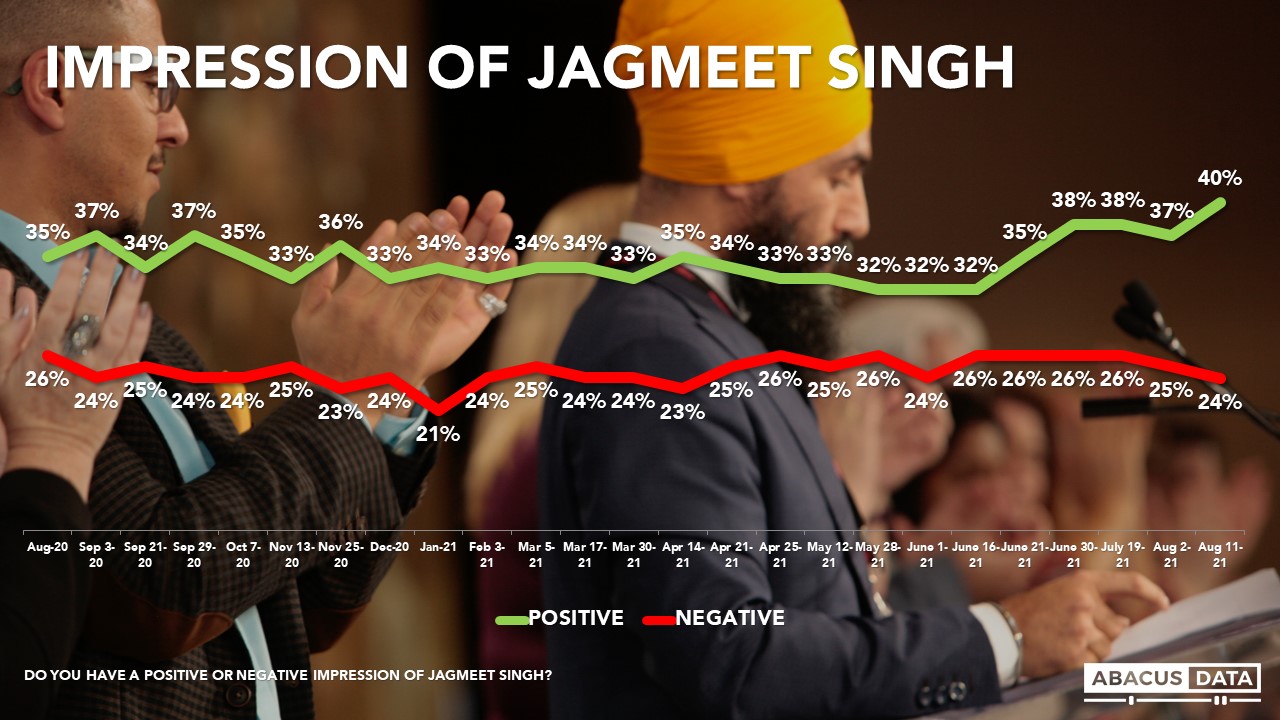
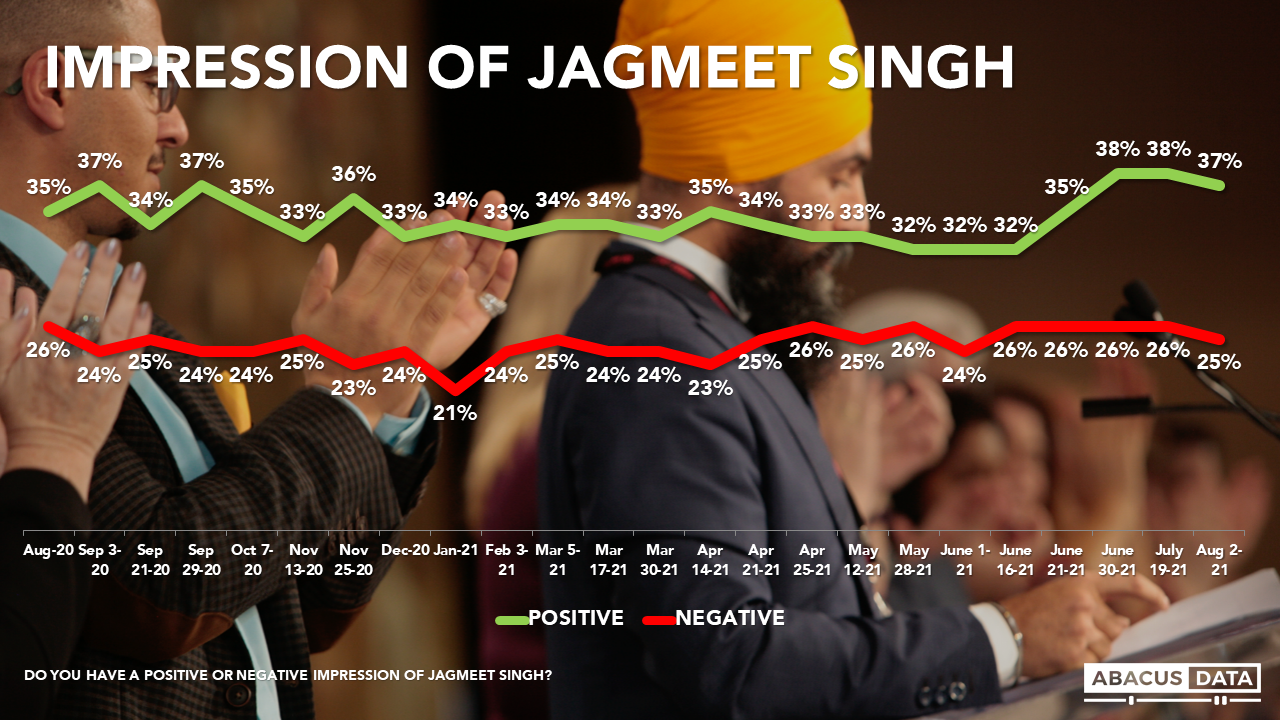
Jagmeet Singh enjoys a positive impression among 40% and finds negative impressions among 24% for a net score of +16. Mr. Singh has had a net positive impression for the entire period since the previous election. In August 2019, Mr. Singh’s positives were 25% and negatives were 28% for a net score of -3.
Mr. Singh is more popular with those under 30 (+37), women (+25) and those in BC (+30). Among NDP supporters he is +83 and among NDP accessible voters (those open but not currently voting NDP) he is +54.
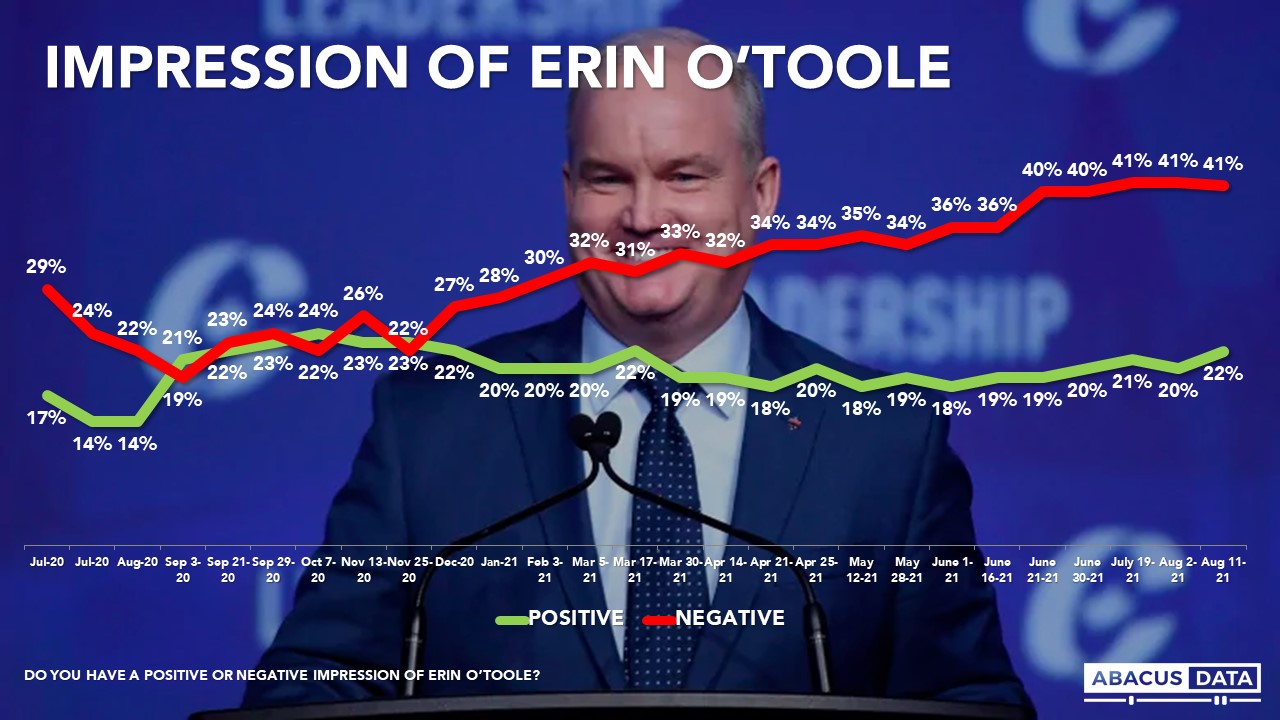
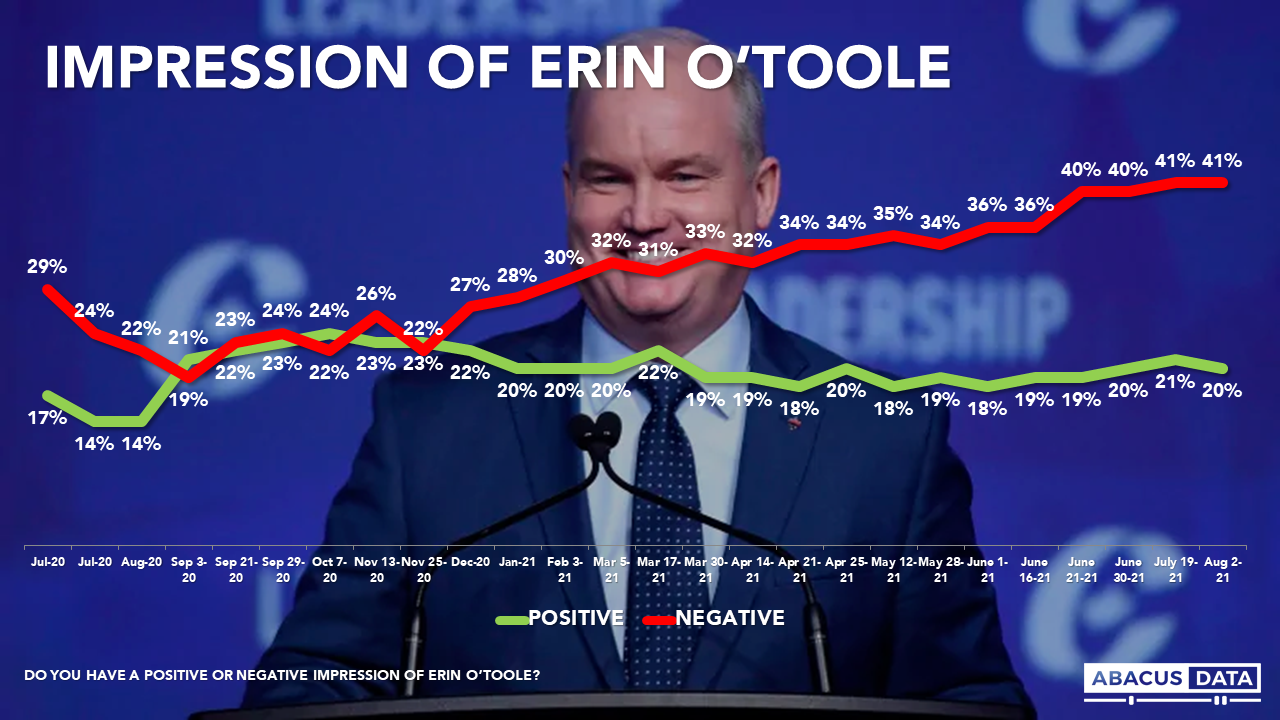
Erin O’Toole enjoys a positive impression among 22% and finds negative impressions among 41%, for a net score of -19. In August 2019, Mr. O’Toole’s predecessor Andrew Scheer had positives at 33% and negatives at 36% for a net score of -3.
Among Conservative supporters, he is +62 and among Conservative accessible voters (those open but not currently voting Conservative) he is +13 with a majority saying they have either neutral views of him or don’t know enough to have an opinion.
In short, the Liberal and NDP leaders are both in stronger reputational shape than they were in 2019 and the Conservative leader is in a worse position. Trudeau has improved by a net 11, Singh by a net 19 and O’Toole is a net 16 worse than where Scheer was at.
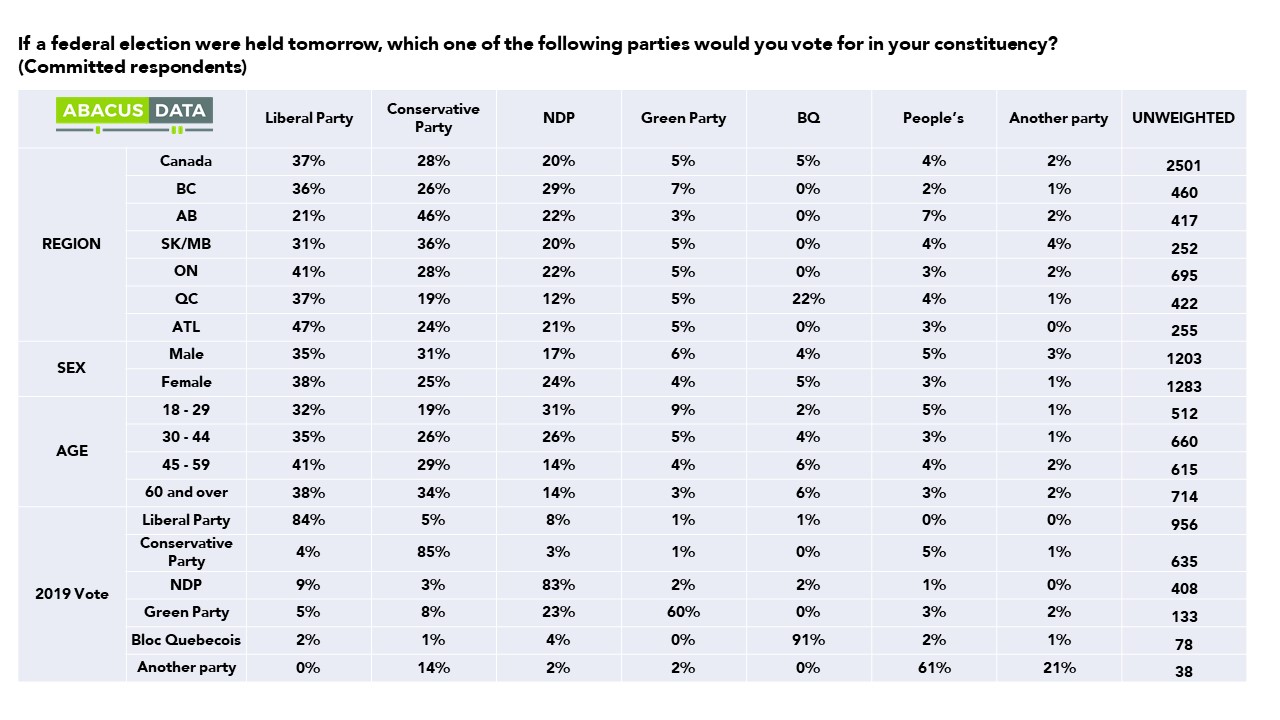
HOW DOES THIS TRANSLATE INTO VOTE INTENTION?
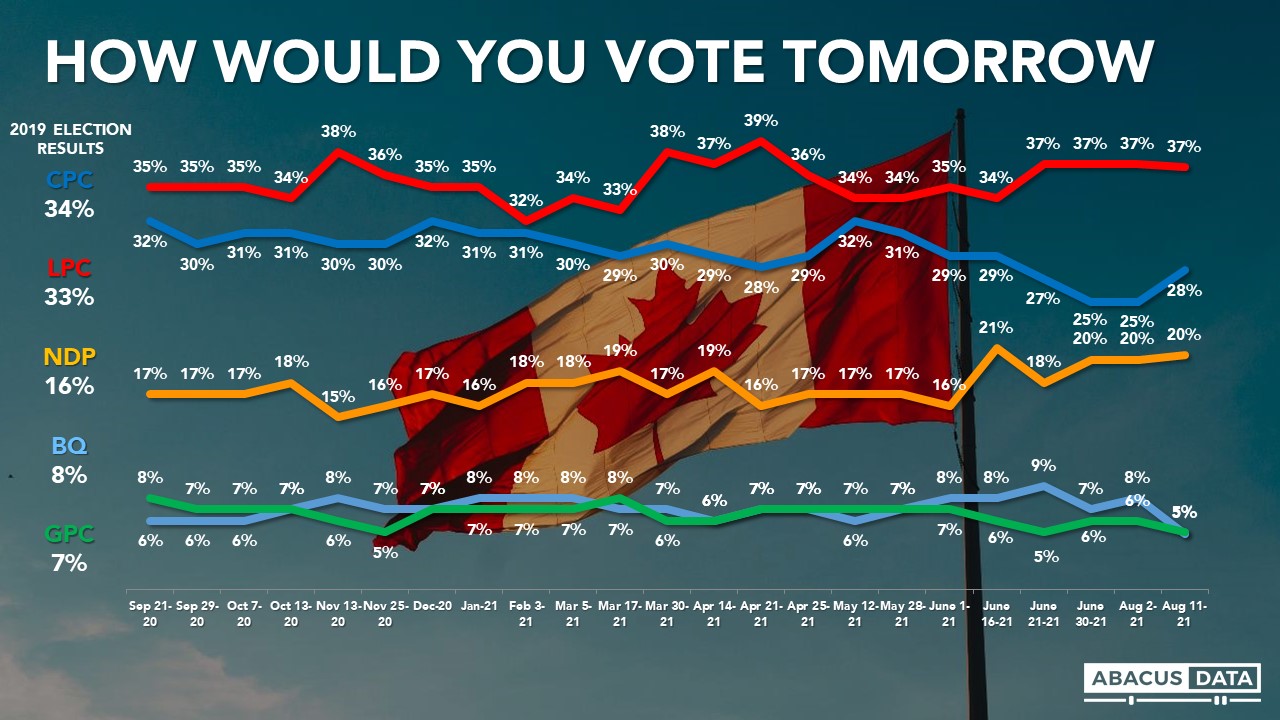
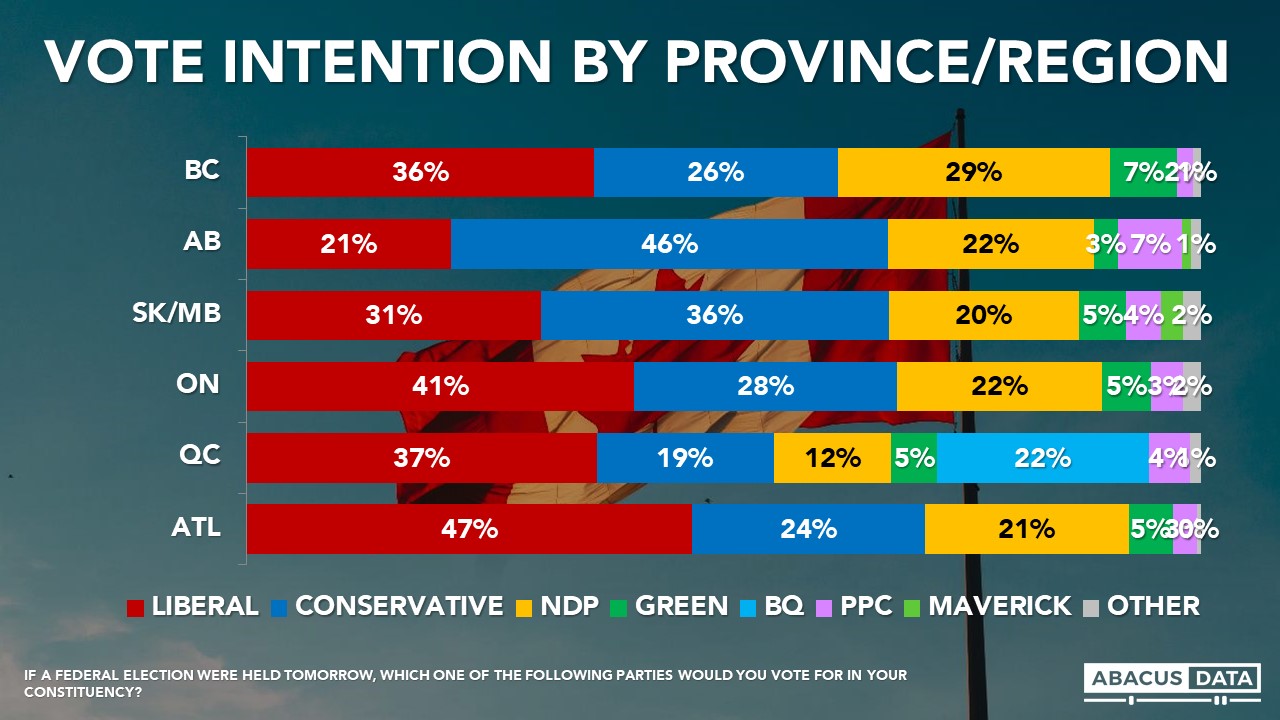
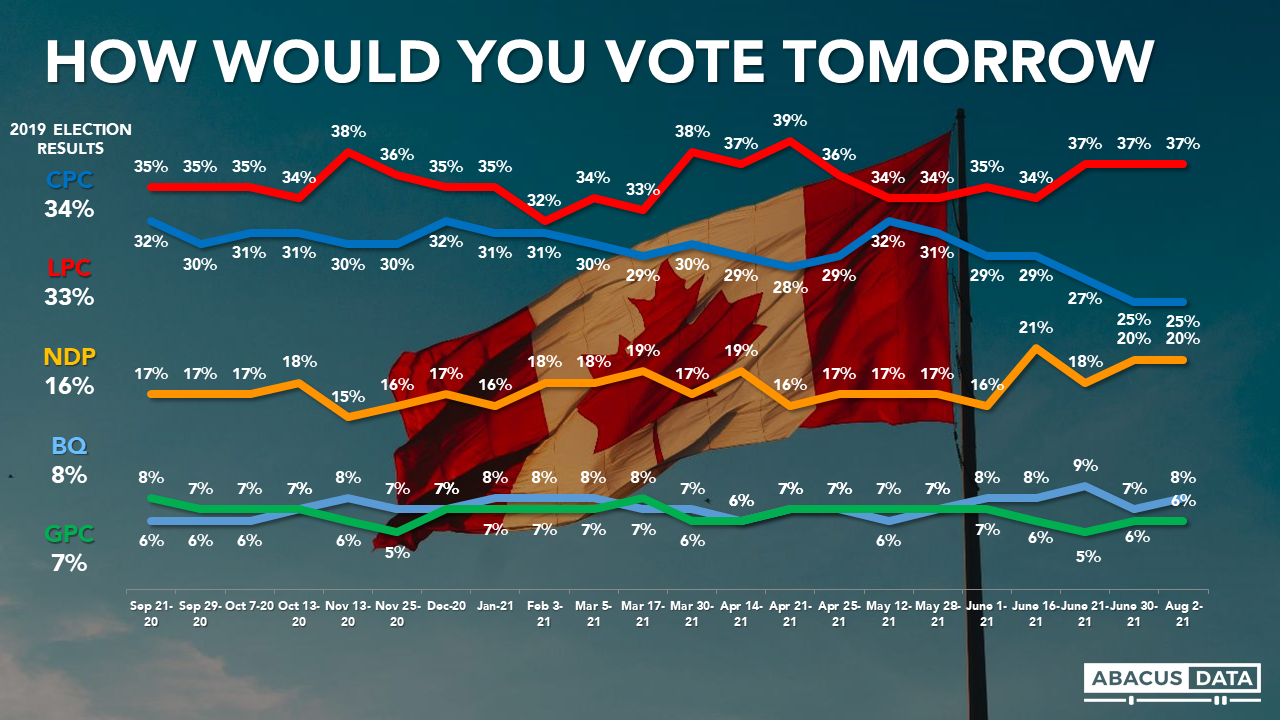
If an election were held now, the Liberals would win 37% of the vote, the Conservatives 28%, the NDP 20%, the Green Party 5% and the BQ at 22% in Quebec (15-points behind the Liberals and down 9 points since earlier this month). The People’s Party captures 4% of the vote, the highest we have had in our tracking while the Maverick Party is at 0% nationally but registers a bit in Alberta (1%) and MB/SK (2%).
• In BC, we see the Liberals ahead of the NDP and Conservatives (36% to 29% and 26%). In 2019 the Conservatives won BC with 34% of the vote, followed by the Liberals at 26% and the NDP at 32%.
• In Alberta, 46% would vote Conservative compared with 22% for the NDP and 21% for the Liberals, 7% for the People’s Party and 3% for the Greens. In 2019, the Conservatives won 69% of the votes, compared to 14% for the Liberals and 12% for the NDP.
• In Manitoba and Saskatchewan, the Conservatives are only slightly ahead of the Liberals (36% to 31%).
• The Liberals (with 41%) have a 13-point lead over the Conservatives (28%) in Ontario, with the NDP at 22% and the Green Party at 5%. In 2019, the Liberals won 42% of the vote, compared to 33% for the Conservatives and 17% for the NDP, and 6% for the Green Party.
• In Quebec, we see the Liberals with 37%, followed by the BQ (22%), the Conservatives (19%) the NDP at 12%. In 2019, the Liberals won 34% of the vote compared to 32% for the BQ, 16% for the Conservatives and 11% for the NDP. The BQ is down by 9-points from earlier this month.
• In the Atlantic provinces, the Liberals (47%) are well ahead of the Conservatives (24%) and the NDP (21%).
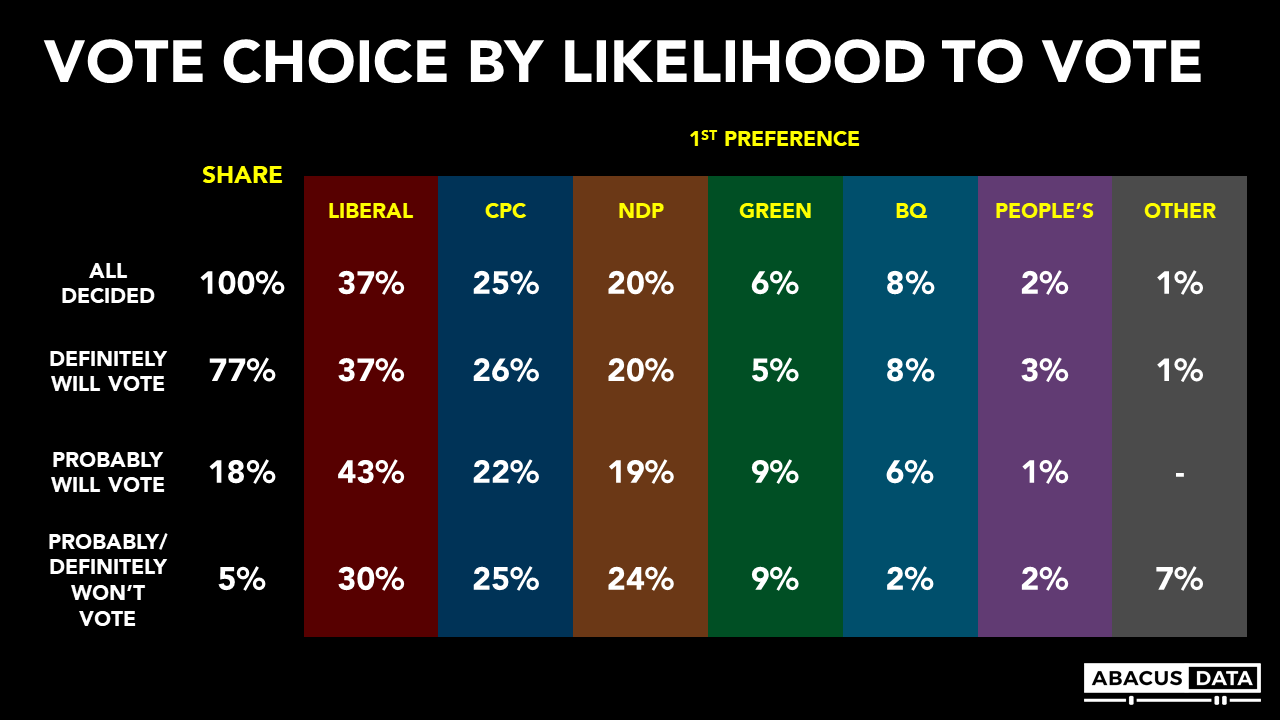
We are also resuming testing levels of motivation, by asking people how likely they are to turn out and cast a ballot on election day. Among the 77% of respondents who said they would definitely be voting, the Liberals lead by 9 as well: 38% Liberal, 29% Conservative, 20% NDP, 5% BQ and 4% Green. 4% would vote for the People’s Party.
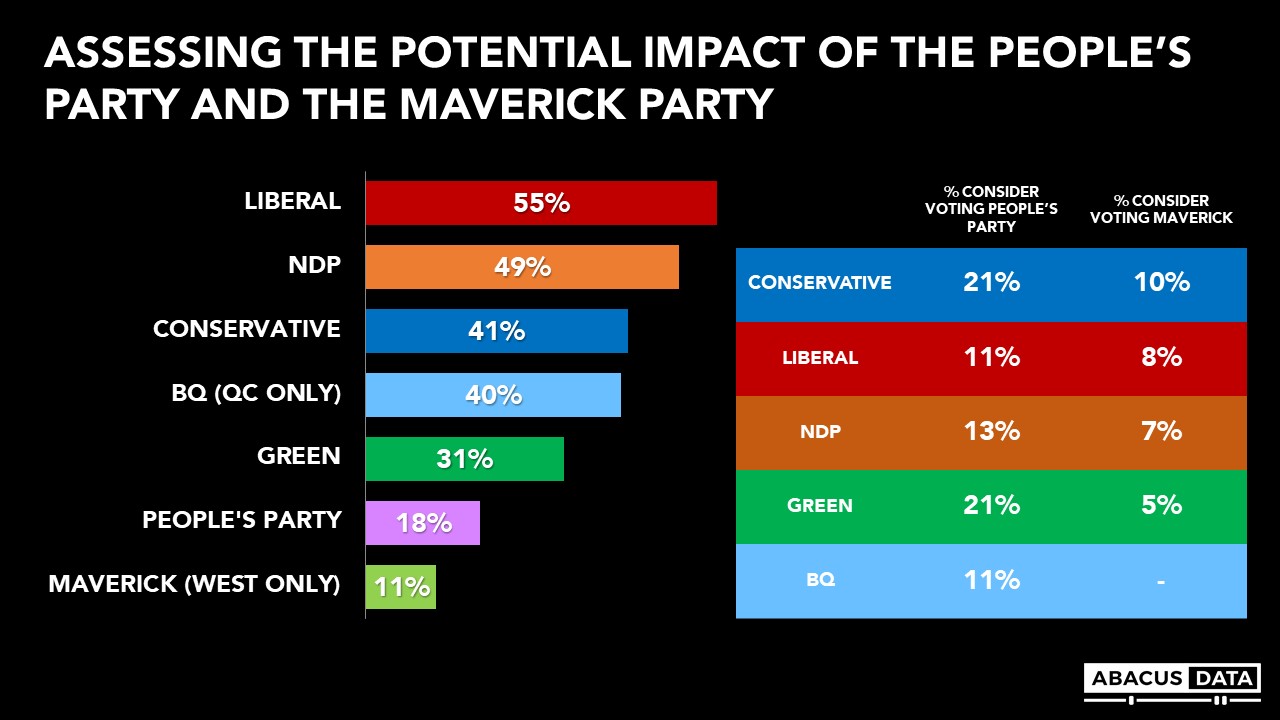
WHAT IMPACT COULD THE PEOPLE’S PARTY AND MAVERICK PARTY HAVE?
In this survey, we asked respondents whether they would consider voting People’s Party and the Maverick Party (in the west only) and also included the Maverick Party in our prompted vote intention question.
Overall, 18% of respondents are open to voting for the People’s Party while 11% of those living in Western Canada are open to voting for the Maverick Party. Both pools of accessible voters for these parties are much smaller than the other parties we ask about.
To assess where each might pull additional support, we explored what percentage of a party’s current supporters are open to voting for either party. Right now, 21% of Conservative supporters say they are open to voting People’s Party while 10% of Conservatives in Western Canada are open to the Maverick Party.
21% of Green supporters say they are open to voting for the People’s Party compared with 11% among Liberals and 13% among NDP supporters. 11% of BQ supporters in Quebec are open to voting for the People’s Party.
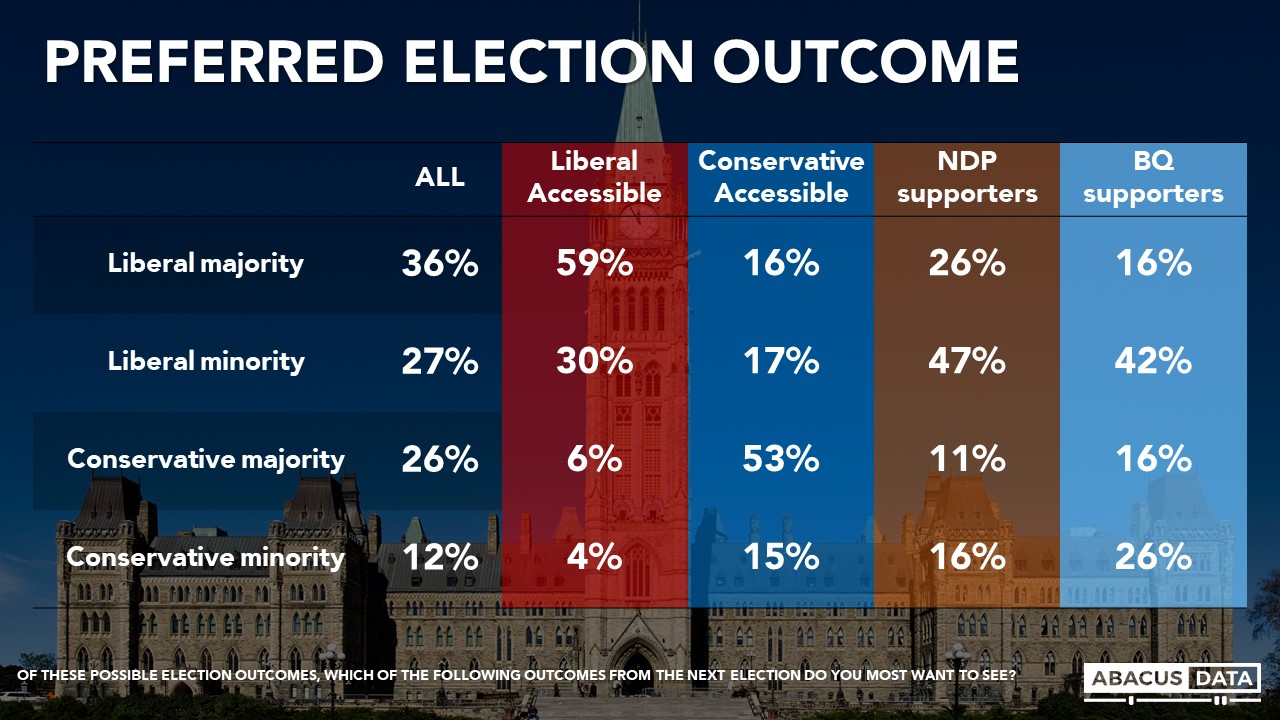
WHAT OUTCOME WOULD PEOPLE PREFER?
We asked respondents which of four outcomes they would prefer to see happen – a Liberal majority, a Liberal minority, a Conservative majority, or a Conservative minority.
Overall, 64% would prefer to see some form of Liberal government over a Conservative one (37% majority vs. 27% minority) while 36% would prefer to see some form of Conservative government over a Liberal one (26% majority vs 10% minority).
75% of current NDP supporters would prefer to see a Liberal government, including 26% who want a Liberal majority. Among BQ supporters, 58% would prefer a Liberal government while 42% would prefer a Conservative one.
Most interesting, among those open to voting Conservative – 34% would prefer to see a Liberal government including 16% who want to see a Liberal majority.
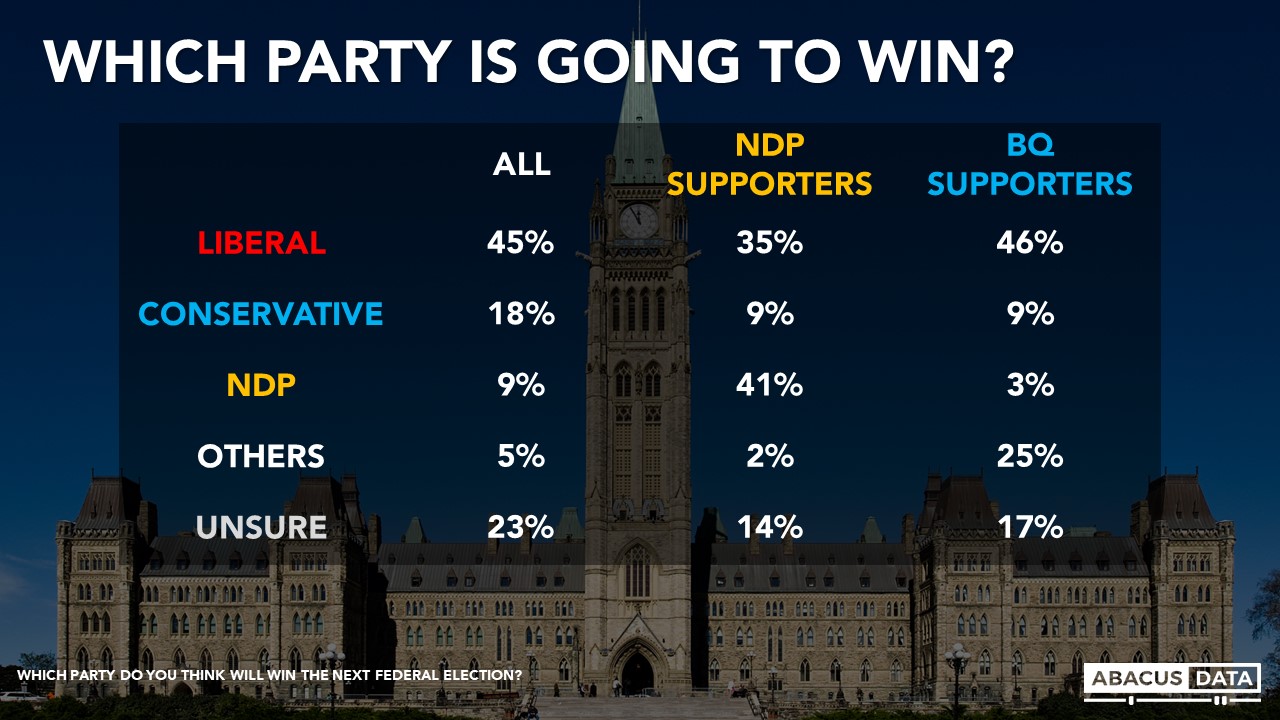
WHICH PARTY DO CANADIANS THINK WILL WIN?
Almost half of Canadians surveyed think the Liberals are going to win the election (45%) while 18% think the Conservatives will win and 9% think the NDP. 23% are unsure.
• Among Conservative supporters, 61% think the CPC will win while 20% think the Liberals will.
• Among Liberal supporters, 86% think the LPC will win while 4% think the Conservatives will.
• Among NDP supporters, 41% think the NDP will win while 35% think the Liberals will and only 9% think the Conservatives will. Among BQ supporters, 46% think the Liberals will win while 9% think the Conservatives will.
UPSHOT
According to Bruce Anderson: “Canadians don’t particularly want an election, but mostly won’t take umbrage at the prospect of one. The big questions for me are these:
How splintered is the Conservative coalition and is it/will it be as motivated as it has tended to be since the time of Stephen Harper? Fighting over marijuana legalization, carbon pricing, SNC Lavalin all seemed more rallying than umbrage with China and the other current points on offer from the Conservatives. Conservatives will have the most money but will they have the most motivated voters, especially given one in five of them think the Liberals will win?
Is the likeability of Jagmeet Singh going to translate into seats? Recently it seems the Liberals may have been working pretty hard to close off risks on the left and appeal to progressive voters who were disappointed in them. Will those voters mark a ballot for a strong NDP caucus or stay home, or vote Liberal?
Voters don’t usually reward governments but it’s hard not to imagine that the general satisfaction with the direction of the country and the handling of the pandemic is not part of the math that gives the Liberals the lead today. Will this election be as much about Justin Trudeau the leader as 2015 or 2019, or more about the policy direction he proposes and the lack of a strong desire for change.?
According to David Coletto: “If the federal election campaign kicks off this weekend, the Liberals remain in a strong position not only to win the most seats, but perhaps win a majority.
Few say they would be upset with the Prime Minister for the early election call (including only 13% of Liberal supporters) so the risk of backlash from an election seems small.
The mood of the country has not been this positive in years, fewer disapprove of the federal government’s performance than at any time in 2021, the desire for change remains much lower and dislike for Mr. Trudeau is far less intense. When the 2019 campaign started, the Liberals trailed the Conservatives by 4. Today they lead by 9.
But that doesn’t mean a Liberal victory is a forgone conclusion. There are a few things I’d watch closely.
The first is whether the NDP can capitalize on the goodwill Mr. Singh has developed. He’s the most popular leader and the NDP’s pool of accessible voters is larger today than when the 2019 campaign started. Perhaps more important, people think the Liberals will win giving those inclined to vote NDP freedom to vote NDP given the chance of a Conservative government seems so low.
Second, while Mr. O’Toole’s personal numbers are quite weak, many still don’t know much about him giving him an opportunity to introduce himself to people for the first time and try and change some people’s views of him. He starts the campaign well back and a short campaign may not give him enough time to catch up – but I wouldn’t completely count him and the Conservatives out at this point.
Finally, tracking interest in the campaign will be critical to understanding likely turnout. Who is more motivated and who will turnout? What impact will early voting and mail voting have? We will continue to track that over the campaign to better understand the impact of turnout on the outcome.
METHODOLOGY
The survey was conducted with 3,000 Canadian adults from August 6 to 11, 2021. A random sample of panelists were invited to complete the survey from a set of partner panels based on the Lucid exchange platform. These partners are typically double opt-in survey panels, blended to manage out potential skews in the data from a single source.
The margin of error for a comparable probability-based random sample of the same size is +/- 1.8%, 19 times out of 20.
The data were weighted according to census data to ensure that the sample matched Canada’s population according to age, gender, educational attainment, and region. Totals may not add up to 100 due to rounding.
[sc name=”signup”]
ABOUT ABACUS DATA
We are the only research and strategy firm that helps organizations respond to the disruptive risks and opportunities in a world where demographics and technology are changing more quickly than ever.
We are an innovative, fast-growing public opinion and marketing research consultancy. We use the latest technology, sound science, and deep experience to generate top-flight research-based advice to our clients. We offer global research capacity with a strong focus on customer service, attention to detail and exceptional value.
We were one of the most accurate pollsters conducting research during the 2019 Canadian Election.
In mid-July, the Broadbent Institute and the Professional Institute for the Public Service of Canada commissioned Abacus Data to conduct a national public opinion survey to explore attitudes and opinions about the federal deficit and the post-pandemic recovery.
The survey found:
HOW TO DEAL WITH THE DEFICIT
1. To reduce the deficit, most think that taxes on lower- and middle-income households will rise and programs and services will be cut, but most want to see loopholes closed and taxes increased on the rich and corporations. A majority of Canadians think that in order to reduce the deficit, the federal government will need to increase taxes on lower- and middle-income Canadians and cut programs and services. But, when asked to rank their preferred way to reduce the deficit, overwhelming majorities would like to see taxes on large corporations and wealthy people raised and loopholes closed. Increased enforcement of existing tax laws and natural economic growth with the next highest-ranked options.
A majority of Liberal, Conservative, and NDP supporters rank increasing taxes on large corporations and wealthy people as a top priority when it comes to reducing the federal deficit.
2. Few Canadians think tax increases on large corporations and wealthy people will negatively impact them. When asked whether the same ideas for reducing the deficit will have a positive or negative impact on them personally, only 6% felt that raising taxes on large corporations and wealthy people will have a negative impact on them. The same is true for closing loopholes or increasing enforcement of existing tax laws. In fact, a majority feel raising taxes on the rich and large corporations and closing loopholes will have a positive impact on them.
3. But most think program and service cuts and tax increases on lower- and middle-income people will have a negative impact on them. In contrast, most think that if taxes were raised on lower- and middle-income people or if programs and services were cut to deal with the deficit there would be a negative impact on their lives.
4. Most Canadians don’t think you can reduce the federal deficit and pay for the pandemic without increasing taxes. Although most people don’t want taxes raised on lower- and middle-income households, most Canadians don’t think it’s possible to reduce the deficit and pay for the pandemic without some form of tax increase. This view is consistent across the political spectrum. 58% of Liberal, 59% of Conservative, and 63% of NDP supporters feel this way.
WHAT CANADIANS WANT IN A POST-PANDEMIC RECOVERY PLAN
1. Don’t cut healthcare, education, or other important social programs. 92% of Canadians say that a post-pandemic recovery plan should include a promise not to cut funding for healthcare, education, or other important social programs. 54% say it is a must have.
2. 88% want to see a wealth tax of 1% paid by the wealthiest Canadians included in a post-pandemic recovery plan. 54% say a wealth tax is a must have while another 34% say it is a nice to have. A wealth tax is as popular an idea as not cutting health or education spending.
3. Reduce health-related costs, build more affordable housing and don’t raise the HST. Beyond promising not to cut health and education spending and bringing in a wealth tax, Canadians also want to see a plan to reduce health-related costs, more affordable housing, and a promise not to raise the HST in a plan to pay for the post-pandemic recovery and make life more affordable.
As a federal election call looms, Canadians believe that it won’t be possible to reduce the deficit without some form of tax increase. While they worry that lower- and middle-income households will be asked to pay more, the overwhelming view is that those who have the most – large corporations and the wealthiest Canadians – should be asked to pay more to help reduce the deficit and pay for the post-pandemic recovery.
The survey results confirm the cross-partisan nature of public opinion on these questions. Conservative supporters are almost as likely as NDP or Liberal supporters to support implementing a wealth tax or raising taxes on the rich or large corporations.
And as the debate about what to do about the deficit and paying for the post-pandemic recovery heats up, there’s a warning in these numbers. Canadians don’t want to see cuts to cherished programs and services, they don’t want an HST increase but they do want governments to tackle affordability issues – around housing and health-related costs – and ask the richest and largest corporations to pay their fair share.
A plan that raises taxes on the wealthy, closes loopholes, and increases enforcement of existing taxes laws are politically low risk, high reward solutions. Few think they will be hurt by those measures and many think they will benefit in the long run.
METHODOLOGY
Our survey was conducted online with 1,500 Canadians aged 18 and over from July 13 to 19, 2021. A random sample of panellists was invited to complete the survey from a set of partner panels based on the Lucid exchange platform. These partners are double opt-in survey panels, blended to manage out potential skews in the data from a single source.
The margin of error for a comparable probability-based random sample of the same size is +/- 2.6%, 19 times out of 20. The data were weighted according to census data to ensure that the sample matched Canada’s population according to age, gender, educational attainment, and region. Totals may not add up to 100 due to rounding.
ABOUT ABACUS DATA
We are the only research and strategy firm that helps organizations respond to the disruptive risks and opportunities in a world where demographics and technology are changing more quickly than ever.
We are an innovative, fast-growing public opinion and marketing research consultancy. We use the latest technology, sound science, and deep experience to generate top-flight research-based advice to our clients. We offer global research capacity with a strong focus on customer service, attention to detail and exceptional value.
We were one of the most accurate pollsters conducting research during the 2019 Canadian Election.
In new public opinion research commissioned by the Canadian Life and Health Insurance Association, 3200 adult Canadians were interviewed by Abacus Data, between July 20th and 24th, 2021.
Results show that Canadians tend to see our health care system as functioning in line with their expectations, with relatively better satisfaction regarding virtual care, access to GPs and timely tests, drug costs and access to quality medicines.
Areas where people see more room for improvement, include access to specialists, timely ER and surgical care, the cost of mental health services and long-term care.
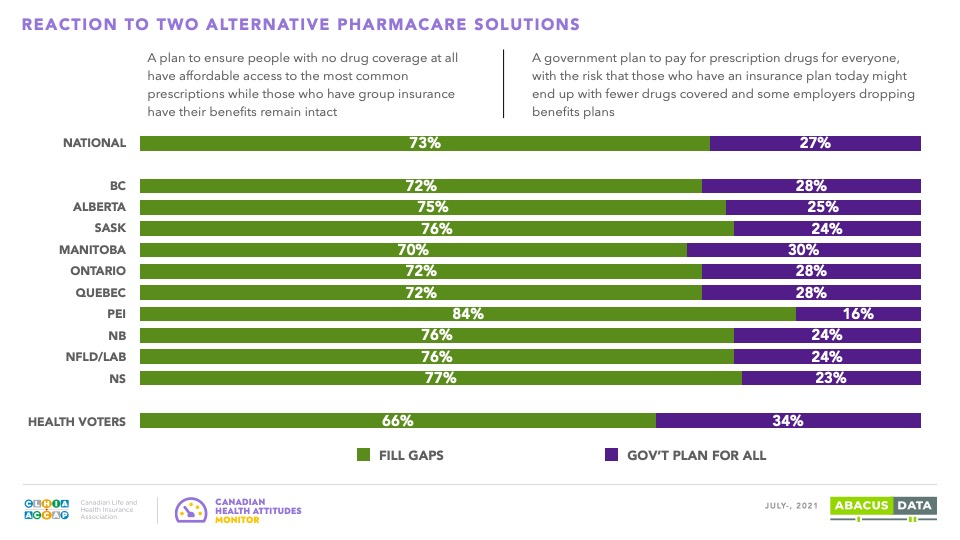
Nearly 3/4ths of Canadians support an approach to pharmacare that provides coverage for those who do not have it without impacting the coverage of those who do. This view is held consistently across geographic regions and also with Canadians who identify with the three major national parties.
OVERALL SYSTEM PERFORMANCE
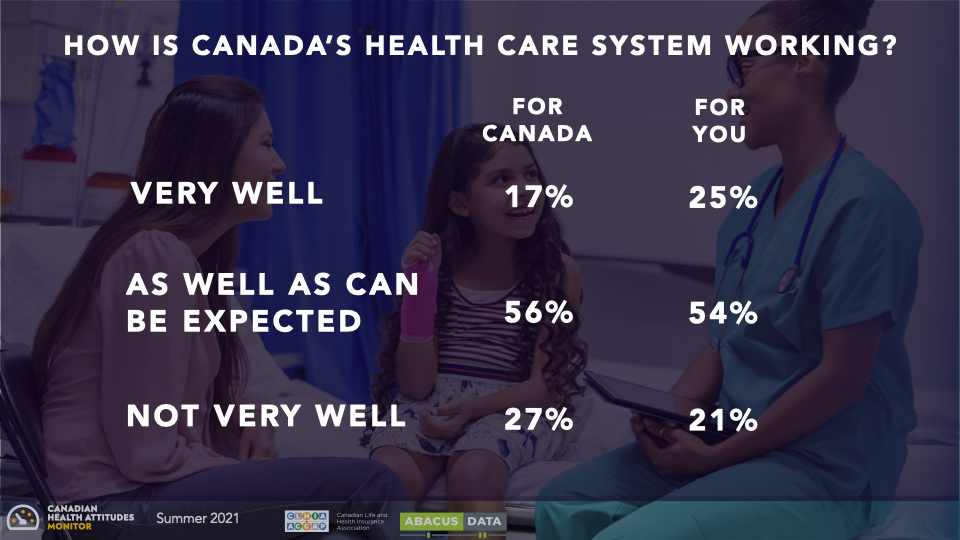
We Asked, “setting aside the impact of the pandemic and thinking about the last few years, how has the overall system of health care been working for Canada as a whole very well, as well as can be expected, or not working very well.” The majority (73%) say the system has been working very well (17%) or as well as can be expected (56%) while 27% say the system has not been working very well.
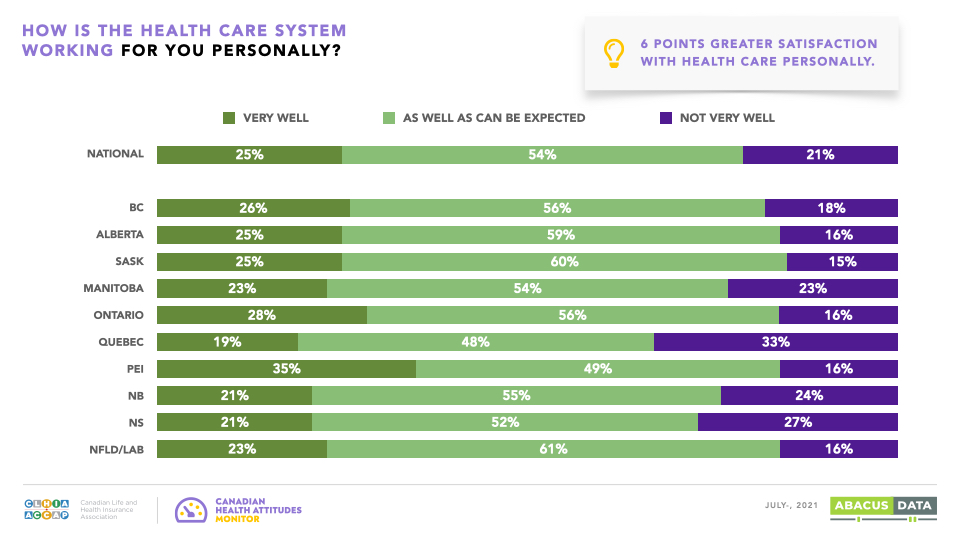
When asked the same question in terms of how well the system has been doing at meeting their own needs, results showed slightly higher levels of satisfaction.
At different ages, people have different health care needs and experiences. However, there are fairly modest differences in satisfaction by demographic group, when it comes to assessments of the health care system. Roughly three quarters or more of every age and income group say the system is doing at least as well as can be expected at meeting their needs.
Worth noting is that voters who say health care will be the deciding factor in terms of how they vote in the next election are a little more satisfied with the system than average.
SPECIFIC PERFORMANCE ASSESSMENTS
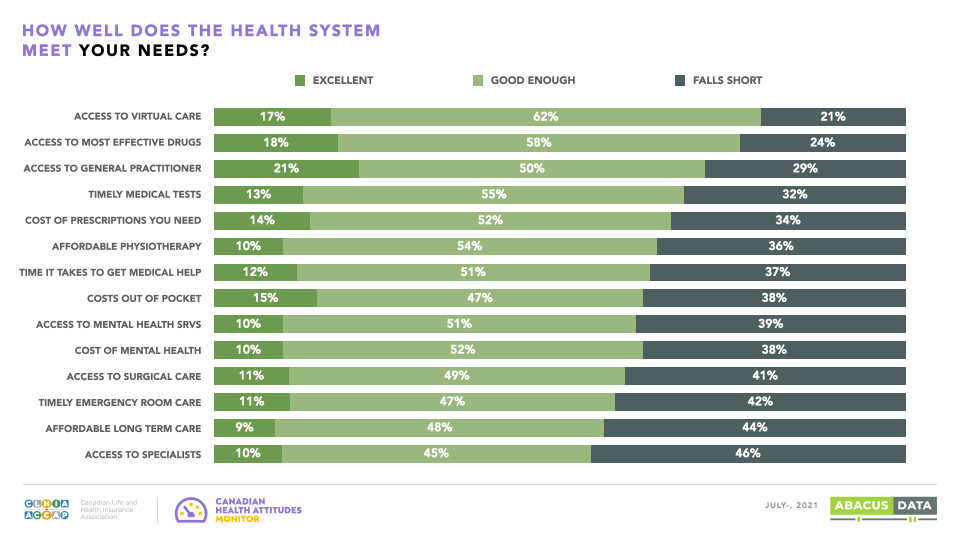
Canadians see areas where they think the system is performing better and others where they are more likely to feel it is falling short of their needs. Best marks are for virtual care, access to and cost of prescription medicines, access to general practitioners and timely tests.
The areas where 40% or more feel the system is falling short of their needs include access to surgical care, timely ER care, affordable long-term care, and access to specialists. There is a consensus around the need to improve the cost of long-term care, and access to specialists.
PHARMACARE
One topical question is the nature of a federal pharmacare initiative. This survey’s results show a similar finding to those we have seen before. While Canadians like the idea of a pharmacare initiative, they prefer an approach that supports the needs of those who do not have drug insurance coverage today, while ensuring that those who do have a benefits plan do not find their plan put at risk.
More than 70% in every part of the country favour a targeted “fill the gaps” style approach over a single government plan covering everyone.
Support for a fill the gaps approach is based on the fact that more than 90% think some, a fair number, or many businesses would see a government plan for drug coverage as an “opportunity to drop their group workplace benefit plans as a way to reduce business expenses.”
UPSHOT
Most people see Canada’s health care system functioning in line with their expectations. Best marks are for virtual care, access to and cost of prescription medicines, access to general practitioners and timely tests.
The areas where more feel the system is falling short include access to surgical care, timely ER care, affordable long-term care, and the cost of mental health supports. Almost 3 in 4 Canadians prefer a targeted approach to pharmacare over a plan where the government provides coverage for everyone. According to Bruce Anderson, Chairman of Abacus Data “In a number of studies we’ve conducted, it’s clear that the many Canadians who have group benefits plans value the coverage they have and want a pharmacare policy that helps others but does not put their coverage in jeopardy.”
METHODOLOGY The survey was conducted online with 3,200 Canadians aged 18 and over from July 20 to 24, 2021. A random sample of panellists was invited to complete the survey from a set of partner panels based on the Lucid exchange platform. These partners are double opt-in survey panels, blended to manage out potential skews in the data from a single source.
The margin of error for a comparable probability-based random sample of the same size is +/- 1.73%, 19 times out of 20. The data were weighted according to census data to ensure that the sample matched Canada’s population according to age, gender, educational attainment, and region. Totals may not add up to 100 due to rounding.
The survey was paid for by the Canadian Life and Health Insurance Association
[sc name=”signup”]
ABOUT ABACUS DATA
We are the only research and strategy firm that helps organizations respond to the disruptive risks and opportunities in a world where demographics and technology are changing more quickly than ever.
We are an innovative, fast-growing public opinion and marketing research consultancy. We use the latest technology, sound science, and deep experience to generate top-flight research-based advice to our clients. We offer global research capacity with a strong focus on customer service, attention to detail and exceptional value.
We were one of the most accurate pollsters conducting research during the 2019 Canadian Election.
In mid-July, we conducted a national public opinion survey of 1,500 Canadian adults for the Canadian Institute for Climate Choices exploring what impact, if any, the recent extreme heat and wildfires across the country have had on public concern about climate change.
The survey found:
1. A majority of Canadians are extremely or quite concerned about climate change. More than half (52%) say they are extremely concerned or quite concerned about climate change. Another 35% say they are a little concerned while 13% are not concerned at all. Those in BC and Quebec are the most likely to be extremely worried as are those aged 18 to 29 and 60+.
2. 3 in 10 say they have become more concerned about climate change since the heatwave and fires began. 29% of Canadians say they have become more concerned about climate change over the past few weeks including 37% in BC and 30% in Alberta and 34% among those aged 60 and over.
3. Most think climate change will have a negative impact on the health of people living in areas most impacted by climate change and on costs to our public healthcare system and at least 8 in 10 feel it will have some impact on their personal health. There’s broad concern and recognition that climate change will have negative impacts on health outcomes, costs to the health system and on the life expectancy between poor and wealthy people.
4. Since December, there has been an increase in those who feel climate change is directly impacting their health but most still aren’t convinced it is having direct impacts yet. Today, 35% of Canadians think that climate change is directly impacting their health because of poor air quality and the higher risk of floods, forest fires, or storms. That’s 5-points higher than in December 2020. Another 50% don’t think climate change is impacting their health now but worry about its future impact on their health and that of future generations.
UPSHOT For the past few years, concern about climate change has been growing and intensifying. More frequent extreme weather events have put a spotlight on the impact of climate change and are expanding the lens by which people assess the risk of it. The impact on personal health is one area.
Most Canadians are quite concerned about climate change and recent extreme weather and wildfires have intensified that concern. Although most don’t see a direct link between their health and climate change, that is shifting. More and more understand the risk that climate change poses to their health— and within the past 7 months, 1.5 million Canadians have been convinced that climate change is having a direct impact on their health. That shift will continue as the impact of climate change intensifies and evidence of it appears more frequently.
METHODOLOGY The survey was conducted online with 1,500 Canadians aged 18 and over from July 9 to 14, 2021. A random sample of panellists was invited to complete the survey from a set of partner panels based on the Lucid exchange platform. These partners are double opt-in survey panels, blended to manage out potential skews in the data from a single source.
The margin of error for a comparable probability-based random sample of the same size is +/- 2.6%, 19 times out of 20. The data were weighted according to census data to ensure that the sample matched Canada’s population according to age, gender, educational attainment, and region. Totals may not add up to 100 due to rounding.
The survey was paid for by the Canadian Institute for Climate Choices
[sc name=”signup”]
ABOUT ABACUS DATA
We are the only research and strategy firm that helps organizations respond to the disruptive risks and opportunities in a world where demographics and technology are changing more quickly than ever.
We are an innovative, fast-growing public opinion and marketing research consultancy. We use the latest technology, sound science, and deep experience to generate top-flight research-based advice to our clients. We offer global research capacity with a strong focus on customer service, attention to detail and exceptional value.
We were one of the most accurate pollsters conducting research during the 2019 Canadian Election.
We just completed a national survey of 2,000 Canadian adults (July 29 to Aug 2). As we head towards a likely election call in the next few weeks, here’s our latest look at the Canadian political environment.
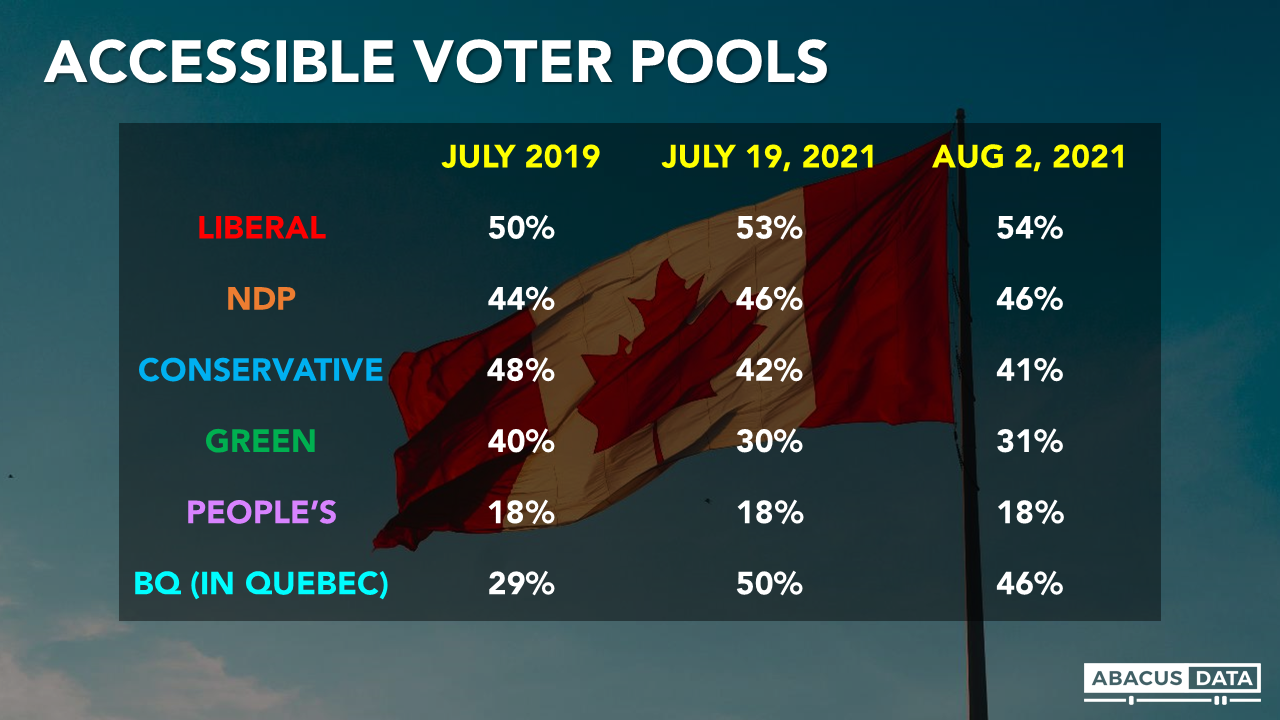
HOW BIG ARE THE PARTY VOTER POOLS?
The Liberals continue to have the largest potential voter pool with 54% saying they would consider voting Liberal. This is 8-points larger than the NDP (46%), 13-points larger than the Conservatives (41%), and 23-points larger than the Greens (31%).
Comparing today with July 2019, the Liberals have a slightly larger accessible voter pool (+4), the NDP’s is marginally larger (+2) while the Conservative pool is much smaller (-7).
CURRENT VOTING INTENTION
If an election were held now, the Liberals would win 37% of the vote, the Conservatives 25%, the NDP 20%, the Green Party 6% and the BQ 31% in Quebec (8 points behind the Liberals). This is pretty much the exact same vote split as we found at the end of June.
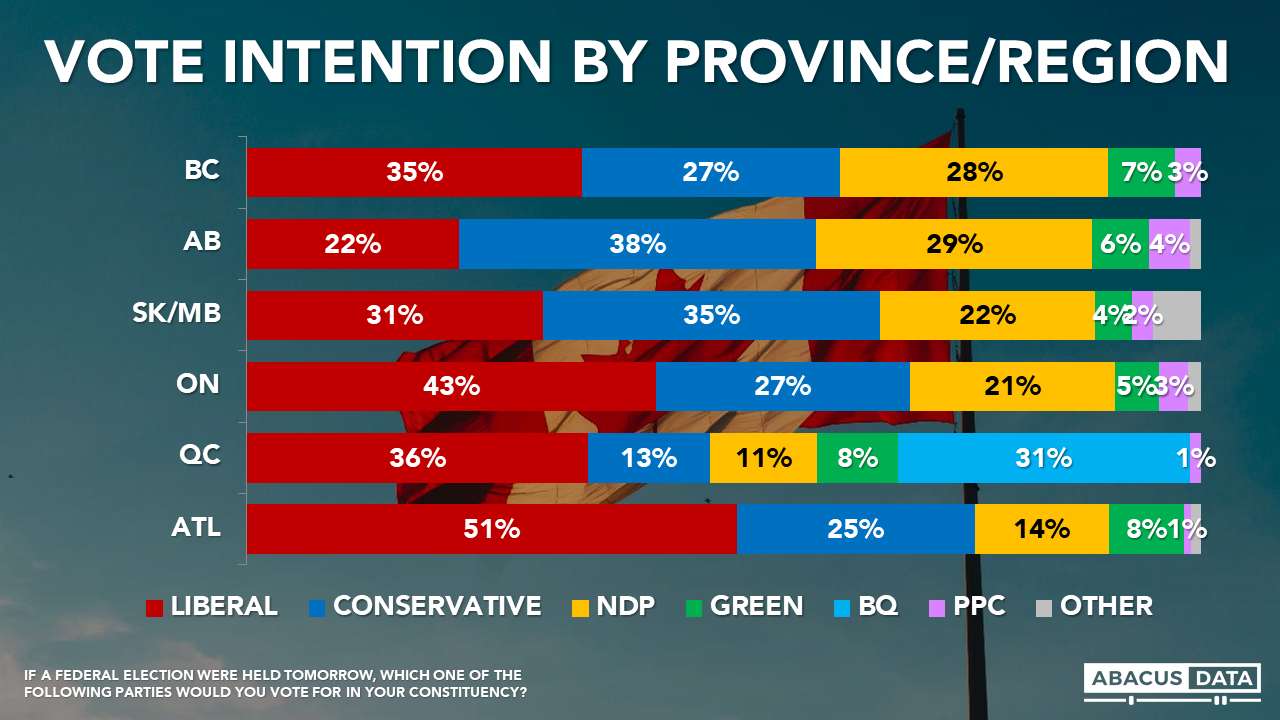
• In BC, we see the Liberals ahead of the NDP and Conservatives (35% to 28% to 27%).
• The typical wide Conservative leads in the Prairies are not there. In Alberta, 38% would vote Conservative compared with 29% for the NDP and 22% for the Liberals. In Manitoba and Saskatchewan, the Conservatives are only slightly ahead of the Liberals (35% to 31%).
• The Liberals (with 43%) have a 16-point lead over the Conservatives (27%) in Ontario, with the NDP at 21% and the Green Party at 5%.
• In Quebec, we see the Liberals with 36%, followed by the BQ (31%), the Conservatives (13%) the NDP at 11%.
• In the Atlantic provinces, the Liberals (51%) are well ahead of the Conservatives (25%) and the NDP (14%).
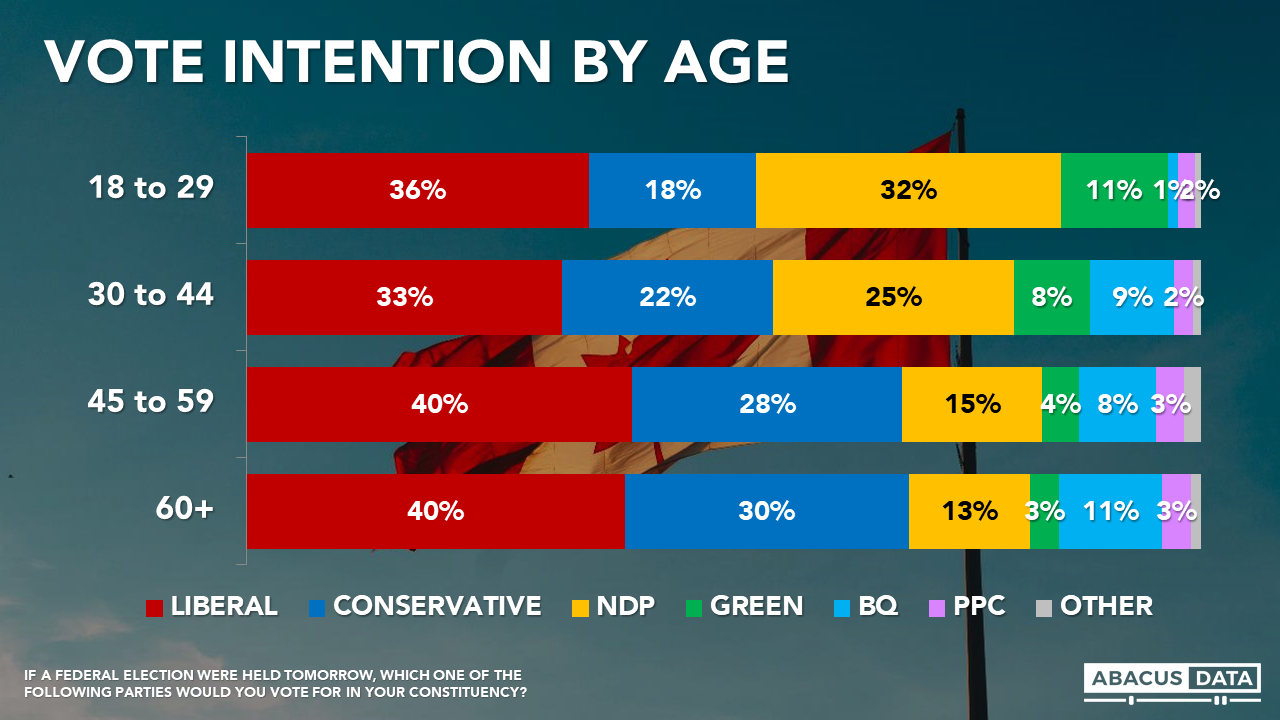
• The Liberals also lead across all age groups, although the NDP is competitive with those under 30.
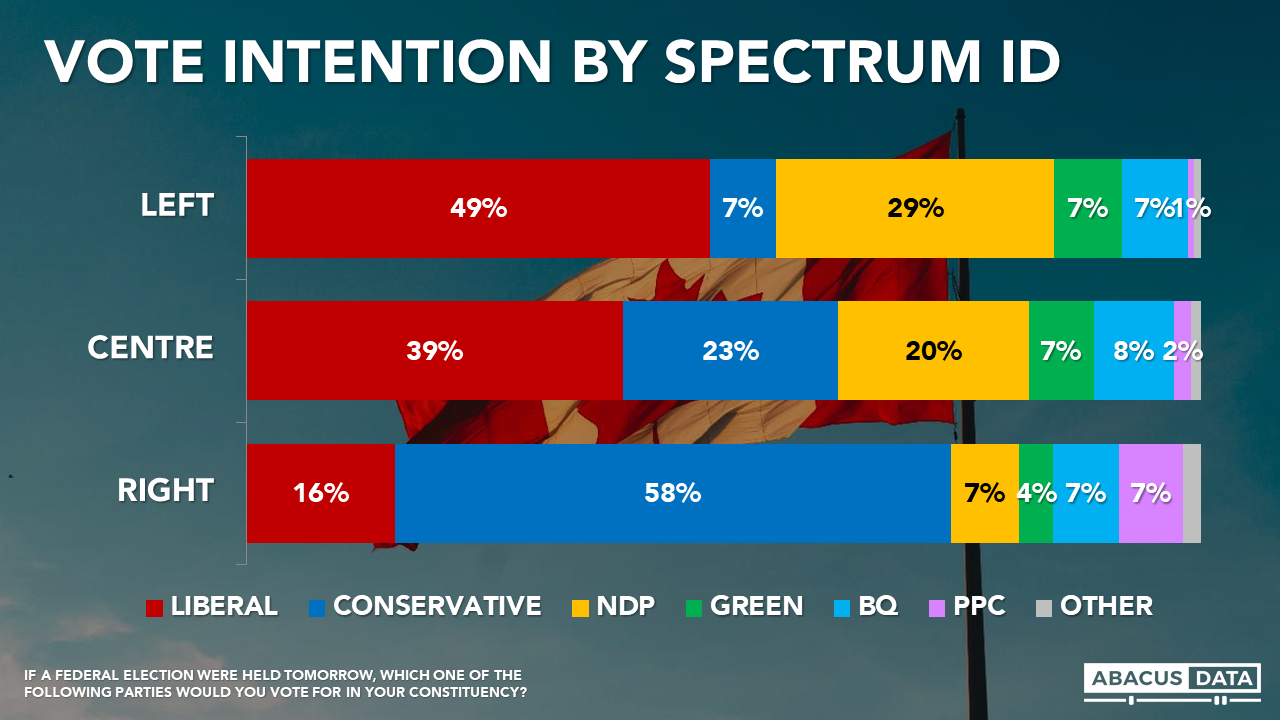
• Among self-described “left of centre” voters, the Liberals (49%) lead the NDP (29%) and the Conservatives have 7% support.
• Among self-described right of centre voters, the Conservatives have 58% support, followed by the Liberals (16%) the NDP (7%) the Peoples Party (7%) the BQ (7%) and Green Party (4%).
• Among those who say they are on the centre of the spectrum, the Liberals lead with 39% compared to 23% for the Conservatives, 20% for the NDP, and 7% for the Greens.
We are also resuming testing levels of motivation, by asking people how likely they are to turn out and cast a ballot on election day. Among the 77% of respondents who said they would definitely be voting, the Liberals lead by 11: Liberal, 26% Conservative, 20% NDP, 8% BQ and 5% Green. 3% would vote for the People’s Party.
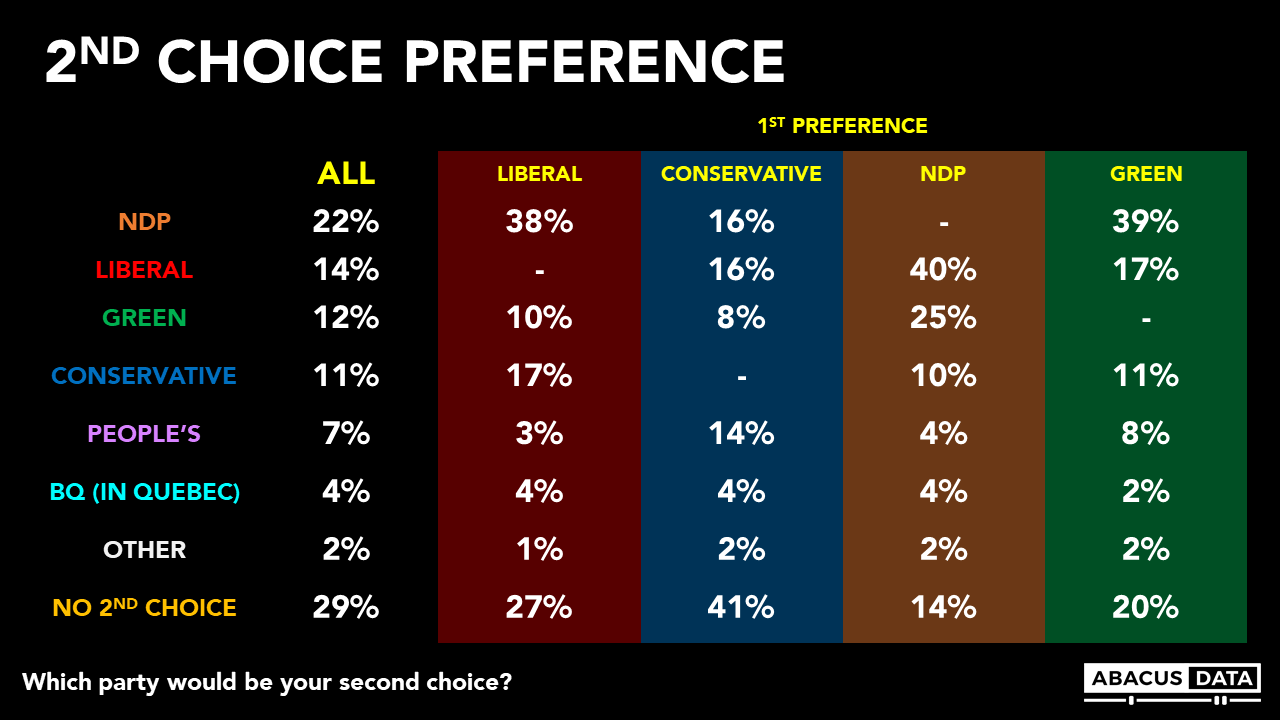
SECOND CHOICE PREFERENCES
We asked decided respondents which party was their second choice. Overall, 29% of respondents said they do not have a second choice ranging from a high of 41% among Conservative supporters to a low of 14% among NDP supporters.
The NDP has the most room to grow with 22% of respondents saying their second choice was the NDP – 38% among Liberal supporters, 39% among Green supporters, and 16% among Conservative supporters.
14% selected the Liberals as their second choice – 40% among NDP supporters, 17% among Green supporters, and 16% among Conservative supporters.
The Conservative Party has the 4th largest pool of second-choice support at 11%, behind the Greens. 17% of Liberal supporters say the Conservatives are their second choice as do 10% of NDP supporters and 11% of Green supporters.
We also asked to what extent decided respondents are likely to switch their support. Overall, we don’t find a lot of potential switching. Only 4% said they are very likely to switch while another 23% are somewhat likely.
The size of persuadable pools is fairly consistent across the three largest parties – 28% of Liberal, 25% of Conservative, and 31% of NDP supporters say they are very or somewhat likely to switch their vote preference. Only 12% of BQ supporters say they are likely to switch while 41% of Green supporters are open to doing so – the highest of any party.
LEADER IMPRESSIONS
Justin Trudeau enjoys a positive impression among 40% and finds negative impressions among 41%, for a net score of -1. Views of Mr. Trudeau have been stable for most of 2021. Back in August 2019, 33% had a positive impression of Mr. Trudeau compared with 45% who had a negative view for a net score of -12.
Jagmeet Singh enjoys a positive impression among 37% and finds negative impressions among 25% for a net +12. Mr. Singh has had a net positive impression for the entire period since the previous election. In August 2019, Mr. Singh’s positives were 25% and negatives were 28% for a net score of -3.
Erin O’Toole enjoys a positive impression among 20% and finds negative impressions among 41%, for a net score of -21. Back in August 2019, Mr. O’Toole’s predecessor Andrew Scheer had positives at 33% and negatives at 36% for a net score of -3.
GOVERNMENT APPROVAL
Today 43% approve of the job being done by the Trudeau government, while 39% disapprove. This +4 net score nationally breaks down to a +4 in BC, -16 in Alberta, -13 in Man/Sask, +9 in Ontario, +1 in Quebec, +31 in Atlantic Canada.
2019 vs. 2021
Going back to data from our August 2019 survey (just before the start of the 2019 campaign), we find a decidedly different political environment. The Liberals have a large lead, the government’s approval rating is 11-points higher, and Canadians are 12-points more likely to feel like the country is headed in the right direction.
As well, more people have a positive impression of Mr. Trudeau today than back in August 2019 and think far less positively of Mr. O’Toole than they did of Mr. Scheer.
UPSHOT
According to Bruce Anderson: “There are three factors to watch right now. First, the Conservatives are facing competition on the right, a lack of voter interest on the centre and weak motivation, given that a third of their voters feel the country is heading in a good direction right now.
Second, the NDP has built appeal around a popular leader and a progressive agenda, but it remains to be seen whether they can draw more votes on the centre of the spectrum, or whether the Liberals policy announcements over the summer have filled-in some of the gaps that progressive voters were looking at and that had been making the Liberals somewhat vulnerable.
Finally, how much and in what ways the pandemic will drive voting – will this election hinge on anxiety about a potential fourth wave and what kind of political leadership people are looking for – or will it feel like an exercise that was poorly timed and unnecessary.”
According to David Coletto: “Not much has changed in our tracking over the past month. The Liberals continue to hold a sizeable national lead built on solid leads in Ontario, BC, and Atlantic Canada. They are strong in Quebec and are increasingly competitive in the Prairies – especially in Manitoba.
If an election were to be called this weekend, the Liberals would start that campaign in a much stronger position than in 2019. More people feel the country is headed in the right direction, the Prime Minister’s personal image is more positive, and the Liberals have a healthy lead – a big difference from the deficit they faced when the campaign started in 2019.
Evidence from our survey suggests the Conservative base is less motivated than in 2019. 30% of Conservative supporters think the country is headed in the right direction and Erin O’Toole’s image is decidedly more negative than Mr. Scheer at this point in the election cycle.
The biggest wildcard remains the NDP. With a weakened Green Party, the most popular leader, and the largest pool of 2nd choice voters, the NDP has a lot of room to grow if dissatisfaction with the Liberals grows.
We don’t necessarily see a volatile electorate – only 4% say they are very likely to switch their vote choice now – but if the other 23% who say they could switch engage and find a better option than their current choice – we could see some shifts over the election campaign.”
METHODOLOGY
The survey was conducted with 2,000 Canadian adults from July 29 to August 2, 2021. A random sample of panelists were invited to complete the survey from a set of partner panels based on the Lucid exchange platform. These partners are typically double opt-in survey panels, blended to manage out potential skews in the data from a single source.
The margin of error for a comparable probability-based random sample of the same size is +/- 2.2%, 19 times out of 20.
The data were weighted according to census data to ensure that the sample matched Canada’s population according to age, gender, educational attainment, and region. Totals may not add up to 100 due to rounding.
[sc name=”signup”]
ABOUT ABACUS DATA
We are the only research and strategy firm that helps organizations respond to the disruptive risks and opportunities in a world where demographics and technology are changing more quickly than ever.
We are an innovative, fast-growing public opinion and marketing research consultancy. We use the latest technology, sound science, and deep experience to generate top-flight research-based advice to our clients. We offer global research capacity with a strong focus on customer service, attention to detail and exceptional value.
We were one of the most accurate pollsters conducting research during the 2019 Canadian Election.
In mid-July, the Broadbent Institute and the Professional Institute for the Public Service of Canada commissioned Abacus Data to conduct a national public opinion survey to explore attitudes and opinions about tax fairness in Canada. These questions were part of a larger survey exploring opinions about tax fairness, affordability, and the impact of the pandemic on household finances.
The survey found:
1. Most think the pandemic has increased inequality in Canada. More than half of Canadians believe that the pandemic has increase inequality in Canada while 34% think it is about where it was before the pandemic started.
2. Most think Canada’s tax system is unfair. 62% of Canadians describe Canada’s tax system as unfair while only 14% believe it is fair.
3. Tax fairness ≠ “I have to pay more taxes”. Almost all believe that if the tax system was made fairer the amount of taxes they pay would not increase
4. Why do people feel the tax system is unfair? 70% or more feel that large corporations and wealthy Canadians do not pay their fair share in taxes while 40% feel that lower- and middle-income Canadians pay more than their fair share. Most Canadians feel that small businesses pay their fair share in taxes.
5. Now is the time to tackle wealth inequality: A clear majority (82%) believe now is the time to tackle wealth and income inequality by increasing taxes on wealthy Canadians and large, profitable corporations. And we find broad and deep support for several ideas.
6. There is wide support for several tax measures to reduce inequality and raise revenue. The survey also tested support for several ideas to raise revenue to help pay for the pandemic and the post-pandemic recovery.
a. 92% support closing tax loopholes used primarily by the wealthy to lower their overall income tax rate. b. 92% support making it harder for corporations to strategically book profits in tax havens when no economic activity happens there. c. 89% support (50% strongly support) a wealth tax paid by the richest Canadians every year. d. 89% support (44% strongly support) increasing the income tax rate for those who earn $750,000 or more to 37%. e. 87% support (43% strongly support) an excessive corporate profit tax paid by businesses whose profits are extraordinarily high during the pandemic.
7. Support for these ideas is deep and broad-based: Most telling, support for these ideas cross regional, demographic, and political groups in Canada. For example, when it comes to a wealth tax, 83% of those intending to vote Conservative support the idea, as does 91% of Liberal supporters, 93% of NDP supporters, 96% of BQ supporters, and 95% of Green Party supporters.
8. Tax fairness is a low-risk proposition to most Canadians. When asked to assess the potential impact of increasing taxes on the wealthiest Canadians and large, profitable corporations, most felt that it the quality of life for all Canadians would improve, the federal government wouldn’t have to make as big spending cuts to reduce the deficit and there would be little impact on the Canadian economy.
9. The Trudeau government hasn’t done enough. Most think the Trudeau government hasn’t done enough to make life more affordable, ensure everyone pays their fair share in taxes, and reduce income and wealth inequality in Canada, including a sizeable proportion Liberal Party supporters.
10. Tax Fairness is politically powerful. Almost all Canadians (89%) say they would definitely would consider (33%) or probably would consider (56%) voting for a party that promised to “take real and concrete action in making sure everyone pays their fair share and increasing taxes paid by the wealthiest Canadians and large, profitable corporation.” This view was shared by 97% of NDP supporters, 92% of Liberal supporters, and 84% of Conservative supporters.
11. No Leader or party has a clear advantage on tax fairness or affordability: When asked which party or leader would do the best on affordability, inequality, and tax fairness, no party or leader was the clear preference. When it comes to tax fairness, 21% felt Justin Trudeau and the Liberals would be best, the same percentage who felt that way about Jagmeet Singh and the NDP. Erin O’Toole and the Conservatives were third at 15%. Over 1 in 3 were unsure.
The same was true for who people felt would be best at reducing income and wealth inequality in Canada. Jagmeet Singh and the NDP have a marginal advantage over the Liberals and Mr. Trudeau (24% to 22%) but 1 in 3 are unsure.
Even when it comes to making life more affordable, no leader has a clear advantage with Trudeau coming slightly ahead of Singh (24% vs. 20%) with Erin O’Toole back in third at 17%.
For all the results with breakouts by region, demographics, and political support, please download the full report here.
UPSHOT The COVID-19 pandemic put a spotlight on the inequalities that exist in our society and most Canadians believe the pandemic has increased income and wealth inequality.
Recognizing that paying for the pandemic and the post-pandemic recovery will mean higher public debt, there’s a near public consensus that increasing taxes on the wealthiest people and large corporations not only will help reduce the deficit but also decrease inequality in Canada.
Consider the near-universal appeal of a wealth tax, closing loopholes, or increasing personal and business income taxes on wealthy people and large corporations. Few fear that making the tax system fairer will result in them paying more in taxes. This confirmed there’s little political risk in moving ahead on this agenda.
For the Liberal government, this data indicates some vulnerability. Most, including many Liberal supporters, feel the Trudeau government hasn’t done enough to address inequality or ensure everyone pays their fair share. And Mr. Singh and the NDP are seen as the best option on achieving those outcomes as Mr. Trudeau and the Liberals are.
As we enter a likely election campaign this summer and debates about how we will pay for the pandemic and recovery start, the appeal of a tax fairness agenda is clear – for all political parties.
Canadians think their tax system is unfair. They know we need to raise more revenue and, as a future release of this survey will show, they think spending cuts will have a negative impact on their lives. Asking those who have the most and have benefited from the pandemic seems like a reasonable and low-risk solution to almost all of them.
Tax fairness could become the lens by which the next election is fought and what impacts the vote choice of millions of voters.
Our survey was conducted online with 1,500 Canadians aged 18 and over from July 13 to 19, 2021. A random sample of panellists was invited to complete the survey from a set of partner panels based on the Lucid exchange platform. These partners are double opt-in survey panels, blended to manage out potential skews in the data from a single source.
The margin of error for a comparable probability-based random sample of the same size is +/- 2.6%, 19 times out of 20. The data were weighted according to census data to ensure that the sample matched Canada’s population according to age, gender, educational attainment, and region. Totals may not add up to 100 due to rounding.
ABOUT ABACUS DATA
We are the only research and strategy firm that helps organizations respond to the disruptive risks and opportunities in a world where demographics and technology are changing more quickly than ever.
We are an innovative, fast-growing public opinion and marketing research consultancy. We use the latest technology, sound science, and deep experience to generate top-flight research-based advice to our clients. We offer global research capacity with a strong focus on customer service, attention to detail and exceptional value.
We were one of the most accurate pollsters conducting research during the 2019 Canadian Election.
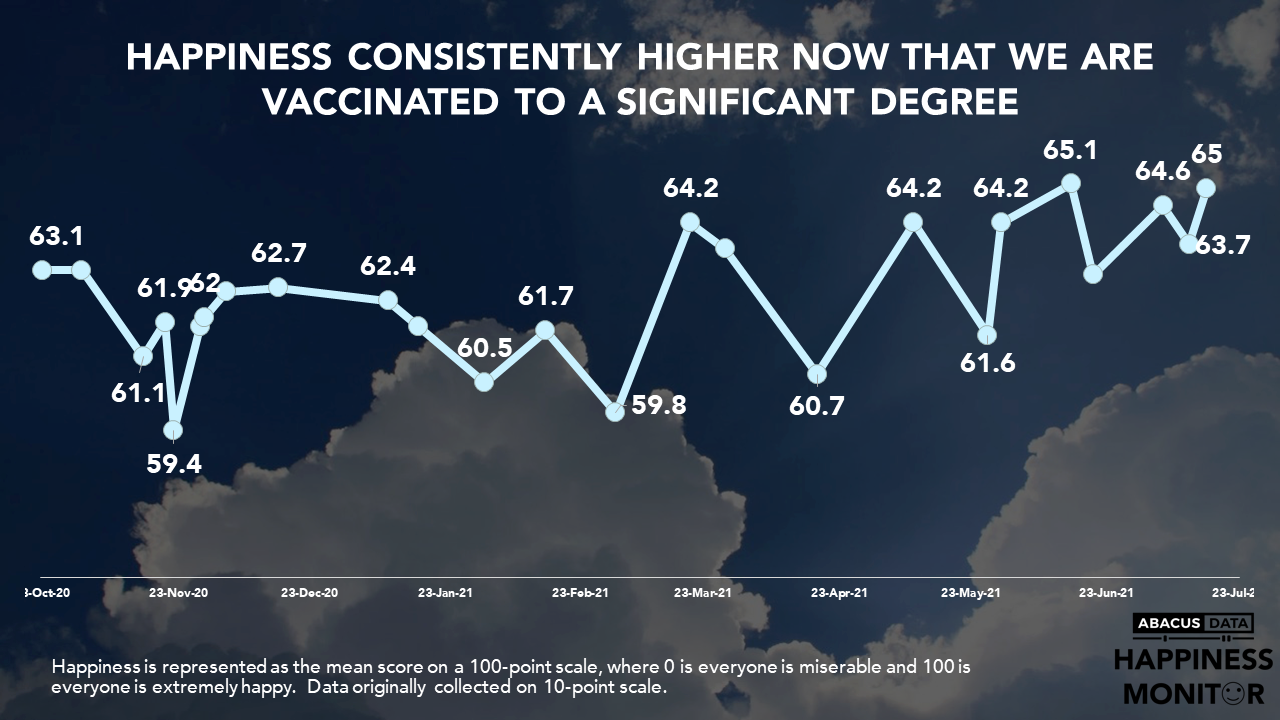
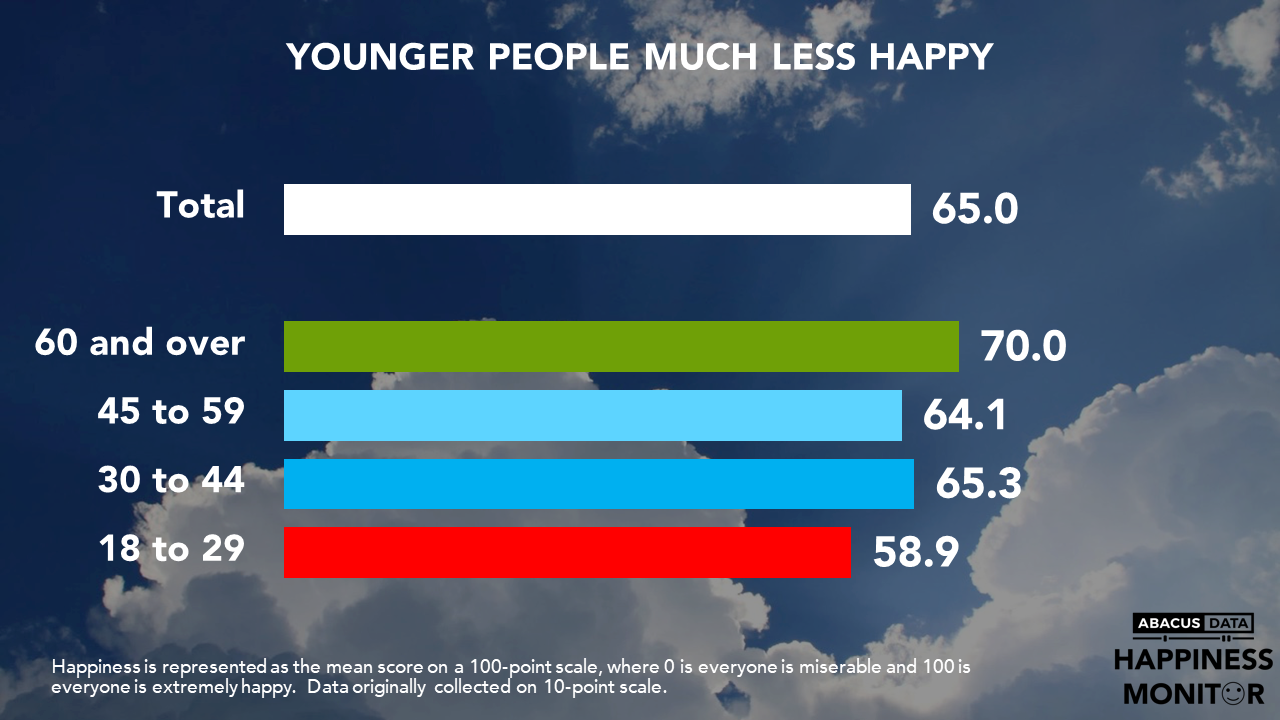
It feels like a happier place. As restrictions have loosened and more and more people are seeing family and friends the word on the street feels more positive. Certainly, Canadians this spring are as happy as they have been since the Happiness Monitor was launched in October. But our brighter outlook is not a state of euphoria. One group that continues to be less happy are young people (under 30).
As of July 19th, the average happiness score is 65.0 out of 100. While happiness has risen and fallen since May, our overall happiness is consistently higher than it was last fall and winter. Quebec (69) and Atlantic Canada (68) are the happiest places.
Compared to the end of May when happiness dropped significantly to 62, Canadians are more hopeful, have a sense of personal fulfillment and are more likely to start the day with a sense of excitement.
[sc name=”signup”]
One of the consistent drivers of happiness is age. Younger people, those 18 to 29, are consistently less happy than their older peers. The difference between 18 to 29 year old Canadians and those over 60 is 11.1 points. As we tend to think of optimism and youth going together, this has always been a striking finding. However, looking at what drives happiness and the recent impacts of the pandemic on future opportunities for young Canadians, the lower levels of happiness among this group might not be as surprising.
Of course, not all of the 18 to 29 year old cohort is unhappy. Some of the cohort are decidedly happy and this reveals some insight into the drivers of unhappiness for these Canadians. Those who are employed in a permanent full-time position are very happy (68.8). In fact, this is almost same level of happiness for the average Canadian with full-time work.
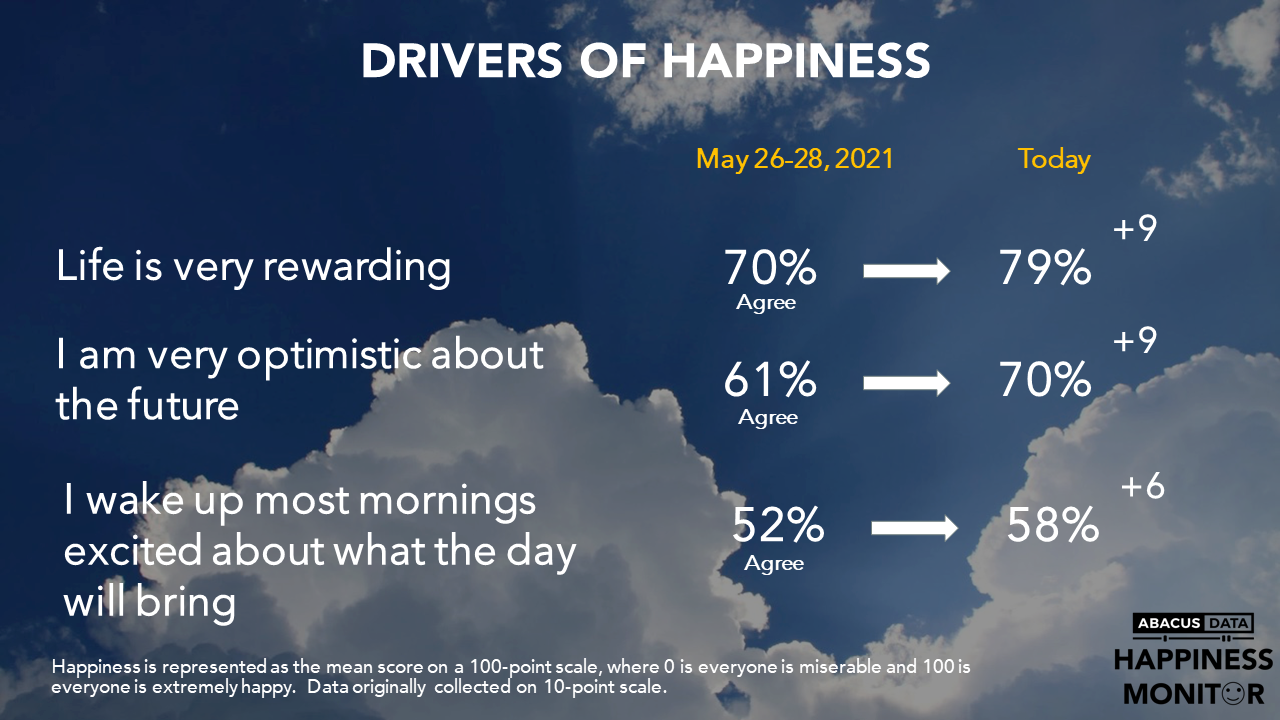
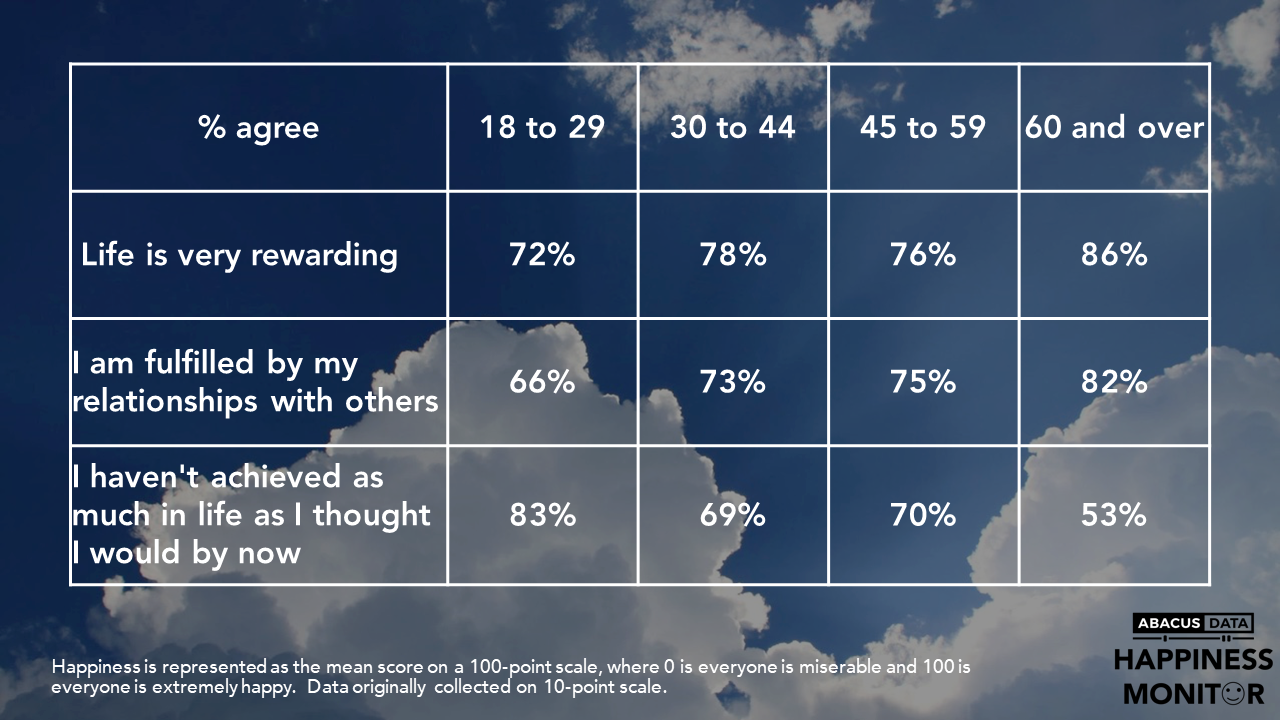
Another way to look at this is in terms of key attitudes that are strongly tied to happiness. The 18 to 29 year old cohort differs from the older cohorts on three key questions. While 86% of those over 60 years agree that life is rewarding, only 72% of those under 30 feel this way. Similarly, those under 30 are much less likely to feel fulfilled by their relationship with others and much more likely to think they have not achieved what they thought they would by now.
THE UPSHOT
According to Richard Jenkins: The pandemic’s impact has been unevenly distributed and this is certainly reflected in the relative unhappiness of younger Canadians. While it is tempting to think of this malaise as generational, it is noteworthy that when we look at employed full-time members of this generation, they look a lot like their older peers. The more likely explanation is that the pandemic has left many of those under 30 with the feeling of being left behind or left out of life.
Time will tell if happiness improves among the under 30 crowd as things return to normal. In the meantime we need to be aware of the potential political fallout of a generation that is not feeling as positive as other Canadians.
According to Oksana Kishchuk: The lack of rebound in happiness among the younger generations is likely due to the uneven impacts of the pandemic on things that matter to long-term success or happiness. Certainly everyone has had a shift in their daily lives this past year, but older Canadians just had a better chance at having a security blanket (higher levels of home ownership, further on in their careers, bigger savings pools, etc.) to weather it. For younger Canadians, not so much. As an example, the unpredictable and hotter than ever housing market impacting the dream of home ownership, something young people say is one of their life goals. Or the devastating job loss among younger generations during the pandemic, and the impact a rocky start in a career will have on long-term career projections, and financial stability. On these issues in particular, young people aren’t yet seeing the same kind of rebound, and it’s likely their happiness won’t start on an upward trajectory until they do.
And don’t miss any of our research and analysis, plus get our weekly Worth A Look newsletter. Sign up today.
METHODOLOGY
Our survey was conducted online with 1,500 Canadians aged 18 and over from July 14 to 19, 2021. A random sample of panellists was invited to complete the survey from a set of partner panels based on the Lucid exchange platform. These partners are double opt-in survey panels, blended to manage out potential skews in the data from a single source.
The margin of error for a comparable probability-based random sample of the same size is +/- 2.5%, 19 times out of 20. In Canada the data were weighted according to census data to ensure that the sample matched Canada’s population according to age, gender, educational attainment, and region.
This poll was conducted and paid for by Abacus Data.
ABOUT ABACUS DATA
We are the only research and strategy firm that helps organizations respond to the disruptive risks and opportunities in a world where demographics and technology are changing more quickly than ever.
We are an innovative, fast-growing public opinion and marketing research consultancy. We use the latest technology, sound science, and deep experience to generate top-flight research-based advice to our clients. We offer global research capacity with a strong focus on customer service, attention to detail and exceptional value.
We were one of the most accurate pollsters conducting research during the 2019 Canadian Election.