Each day during the 2021 Federal Election campaign, researchers at Abacus Data will share insights and analysis from our polling in concise, insights-focused reports. To never miss our polls and analysis, subscribe to our newsletter.
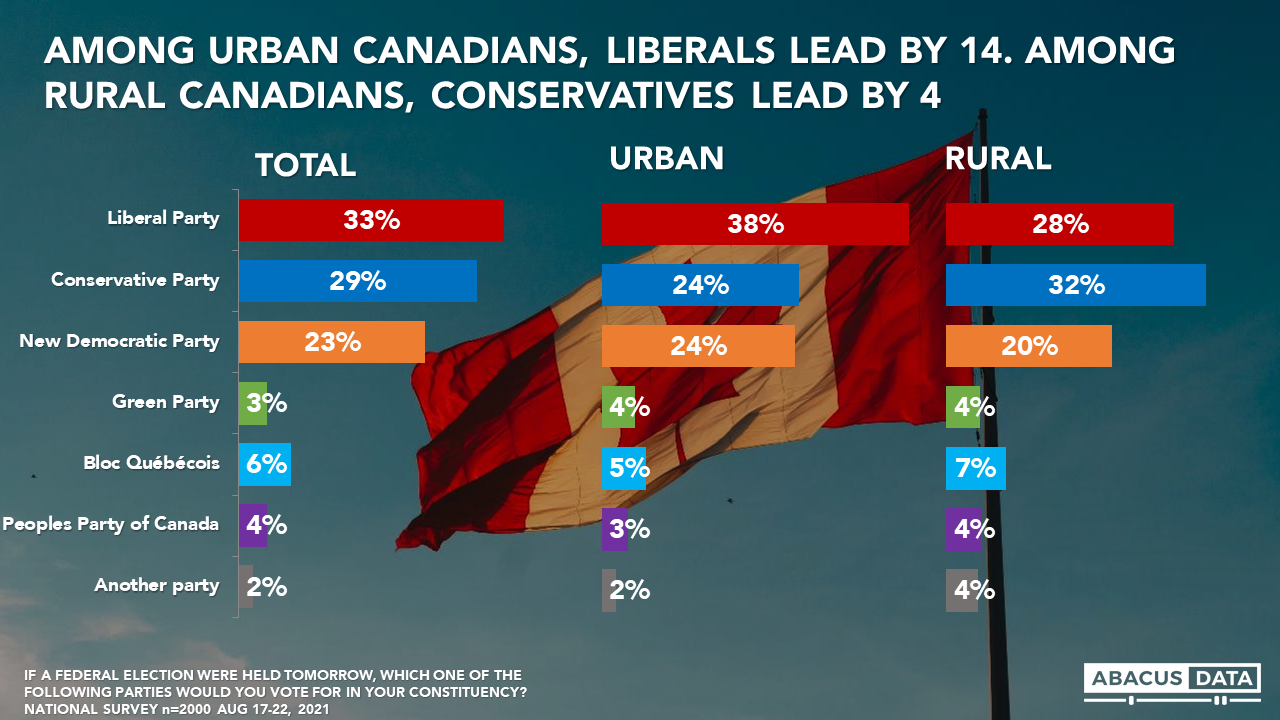
The US has a prevalent urban-rural divide, which often finds itself impacting how individuals vote, with rural voters swaying to the right, and urban to the left. As the federal election kicks off, we’re noticing that this divide is not unique to our southern neighbours. When considering current voter intentions, urban voters are inclined to favour the Liberals, who lead by 14 among this group. However, among rural voters, the Conservative party leads the Liberals by 3.
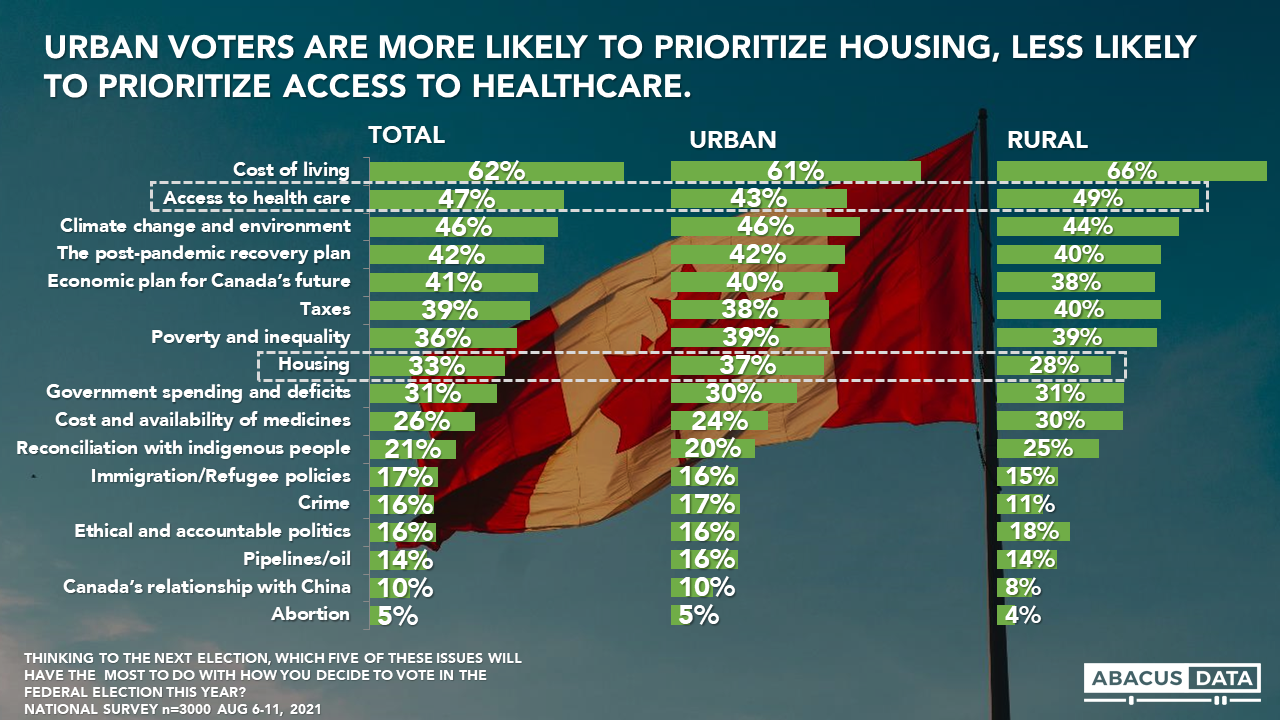
Furthermore, when we look back at data from Aug 11th, there are very limited differences in the issues that are most likely to drive votes this election. Urban voters are slightly more likely to prioritize housing and are less likely to prioritize access to healthcare than rural voters. With that being said, Urban and Rural voters are relatively consistent on the remaining issues that will drive their vote. Cost of living continues to be the key issue this election, with 62% of Canadians including it in their top 5.
UPSHOT
Although the current vote intention widely differs between the two, it is evident that, here in Canada, we aren’t as divided as we think. Whether urban or rural, Canadians in general find themselves in agreement over the key issues that will drive their vote this election.
Overall, it’s not the differing priorities that define these two groups, but rather how these priorities are expressed. Canadians of all walks of life are a lot more similar than many are willing to believe.
METHODOLOGY
The data in this report come from two surveys.
One was conducted online with 3000 Canadians aged 18 and over from August 6 to 11, 2021 and the other with 2,000 Canadian adults from August 17 to 22, 2021. A random sample of panellists was invited to complete the survey from a set of partner panels based on the Lucid exchange platform. These partners are double opt-in survey panels, blended to manage out potential skews in the data from a single source.
The margin of error for a comparable probability-based random sample of the same size is +/- 1.8% and +/- 2.2% 19 times out of 20, respectively. The data were weighted according to census data to ensure that the sample matched Canada’s population according to age, gender, educational attainment, and region.
We are the only research and strategy firm that helps organizations respond to the disruptive risks and opportunities in a world where demographics and technology are changing more quickly than ever.
We are an innovative, fast-growing public opinion and marketing research consultancy. We use the latest technology, sound science, and deep experience to generate top-flight research-based advice to our clients. We offer global research capacity with a strong focus on customer service, attention to detail and exceptional value.
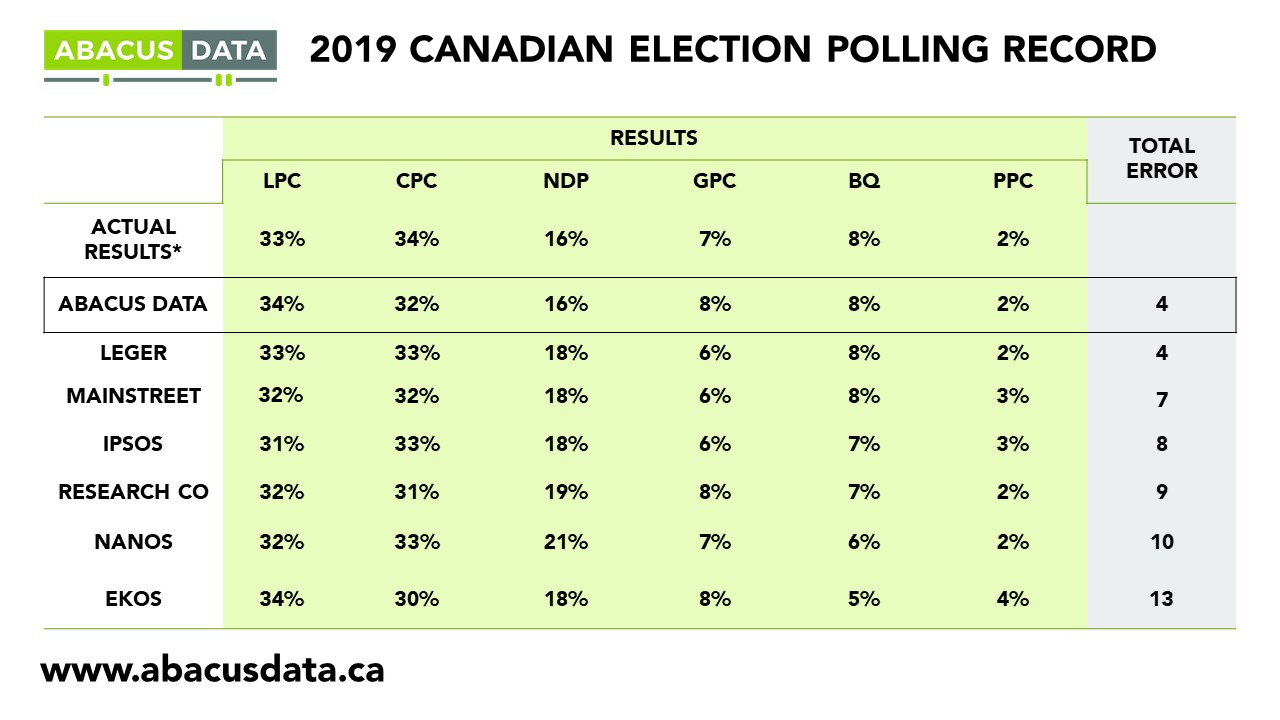
We were one of the most accurate pollsters conducting research during the 2019 Canadian Election.
We just completed a national survey of 2,000 Canadian adults eligible to vote (August 17 to 22, 2021).
After the first week of the campaign, here’s what we are seeing:
GOVERNMENT APPROVAL
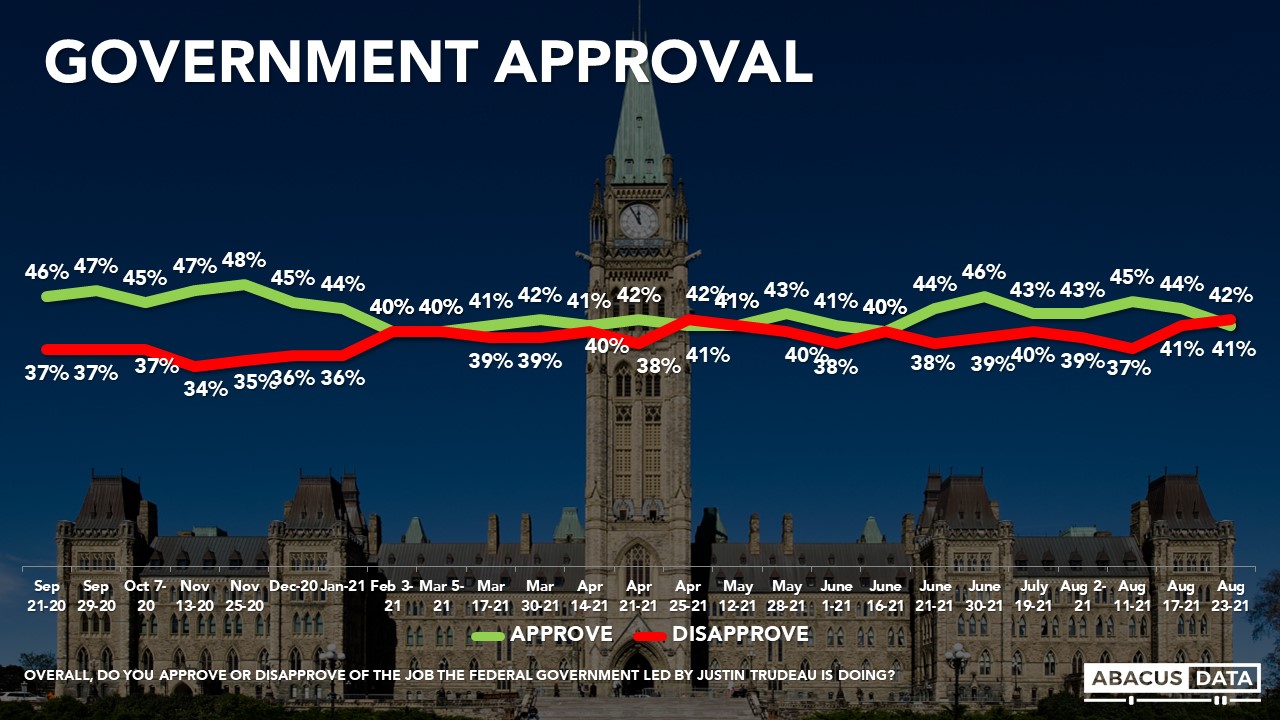
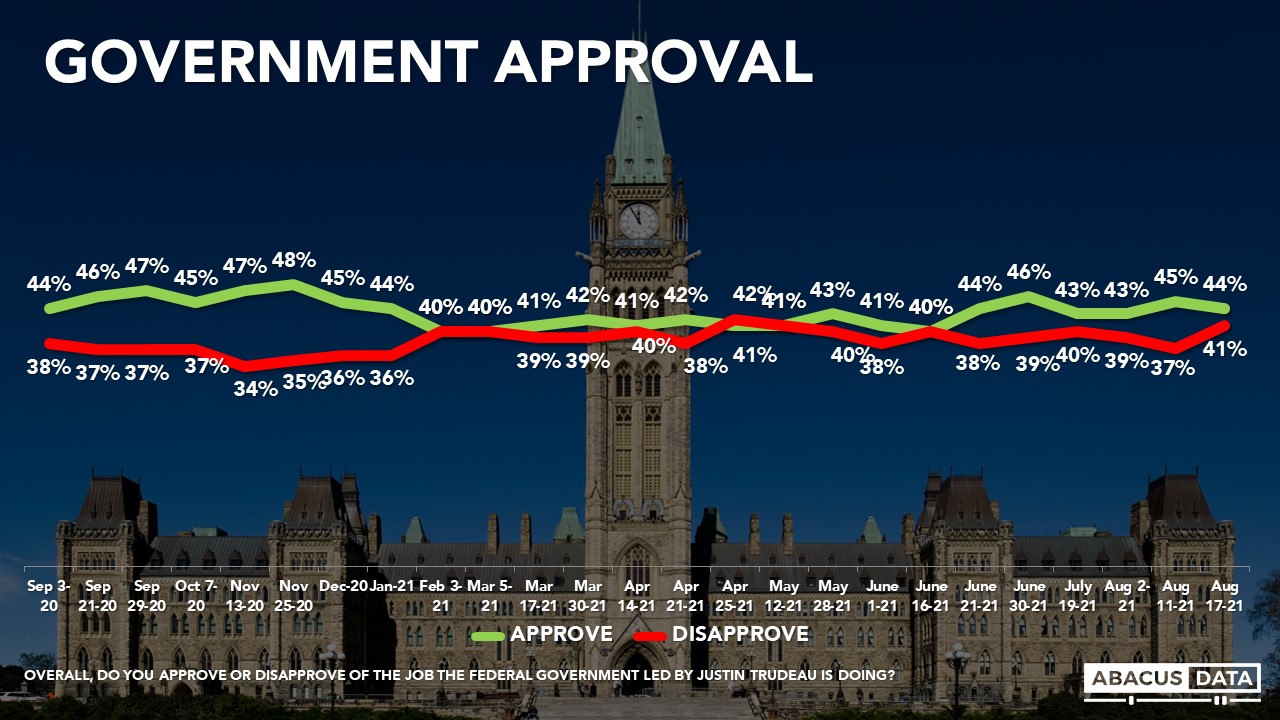
Today 41% approve of the job being done by the Trudeau government, while 42% disapprove. Regionally, net approval is +4 in BC, -36 in Alberta, -22 in Saskatchewan and Manitoba, +3 in Ontario, +11 in Quebec, and +7 in Atlantic Canada.
DESIRE FOR CHANGE
At the time of the 2019 election, 69% wanted change including 52% who felt strongly about it. Today, 71% want change, which includes 44% who feel strongly about it. The desire for change hasn’t changed much in the past week.
LEADER IMPRESSIONS
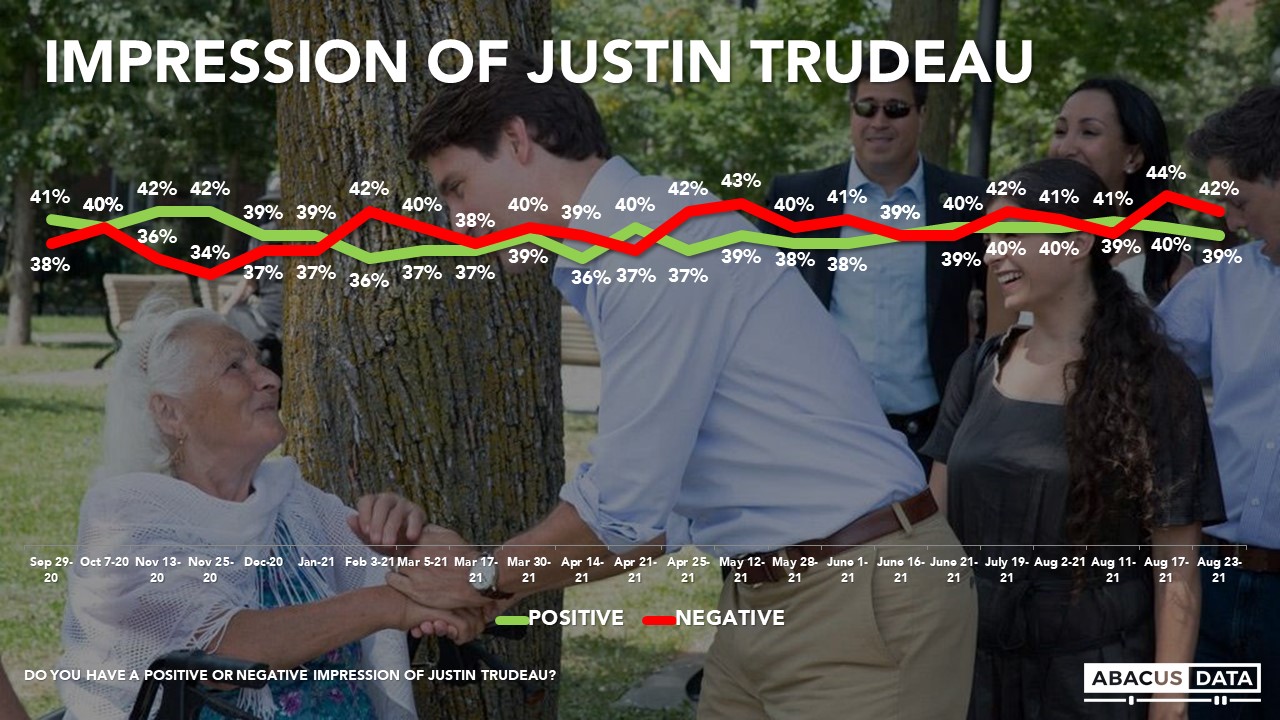
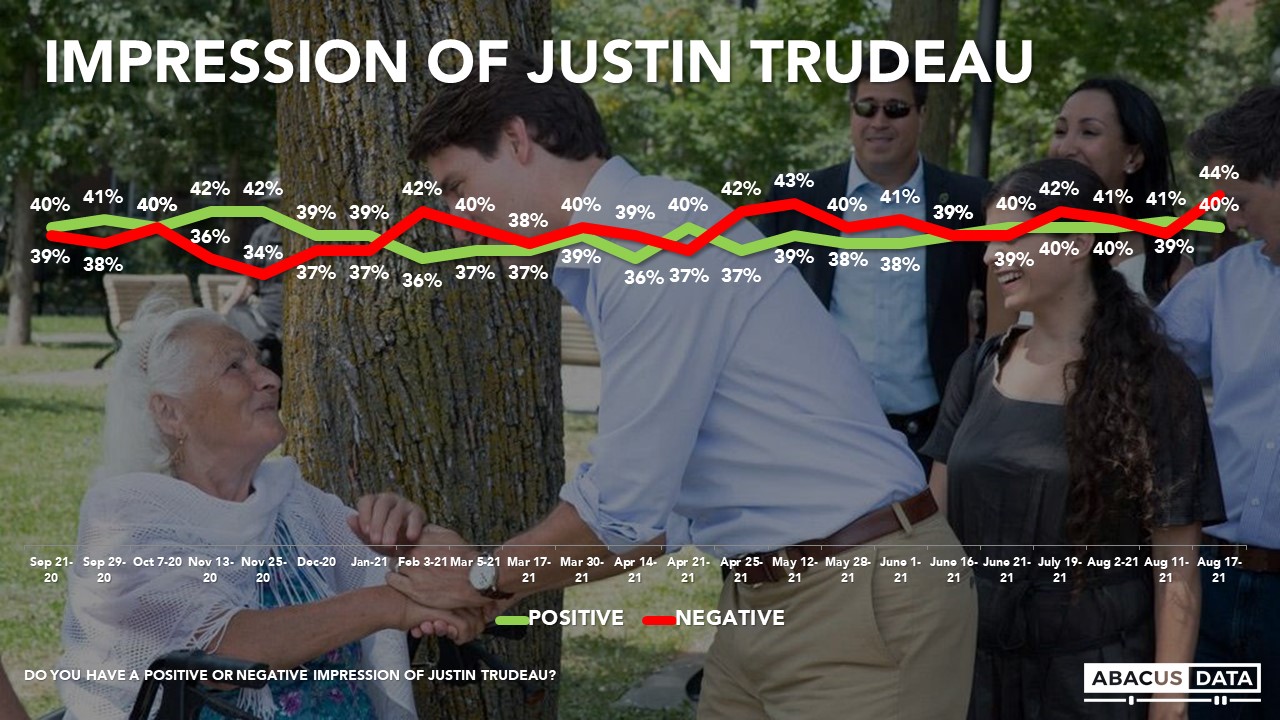
Justin Trudeau enjoys a positive impression among 39% and negative impressions among 42%, for a net score of -3. This is unchanged from last week. Regionally, Trudeau is +2 in BC, -41 in Alberta, -21 in SK/MB, 0 in Ontario, +9 in Quebec, and +11 in Atlantic Canada.
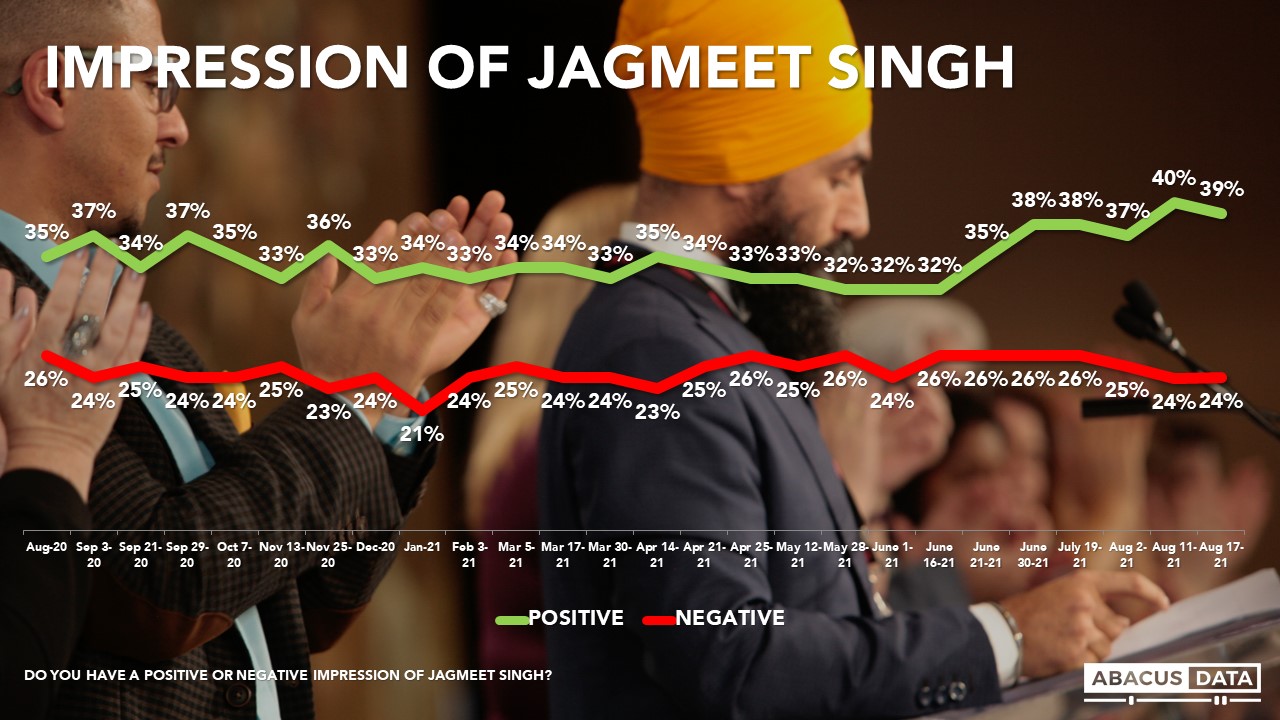
Jagmeet Singh enjoys a positive impression among 42% and finds negative impressions among 24% for a net score of +18. Positive impressions of Mr. Singh are up slightly in the last week (+3). Regionally, Mr. Singh’s is +34 in BC, +3 in AB, +23 in SK/MB, +18 in Ontario, +10 in Quebec, and +22 in Atlantic Canada.
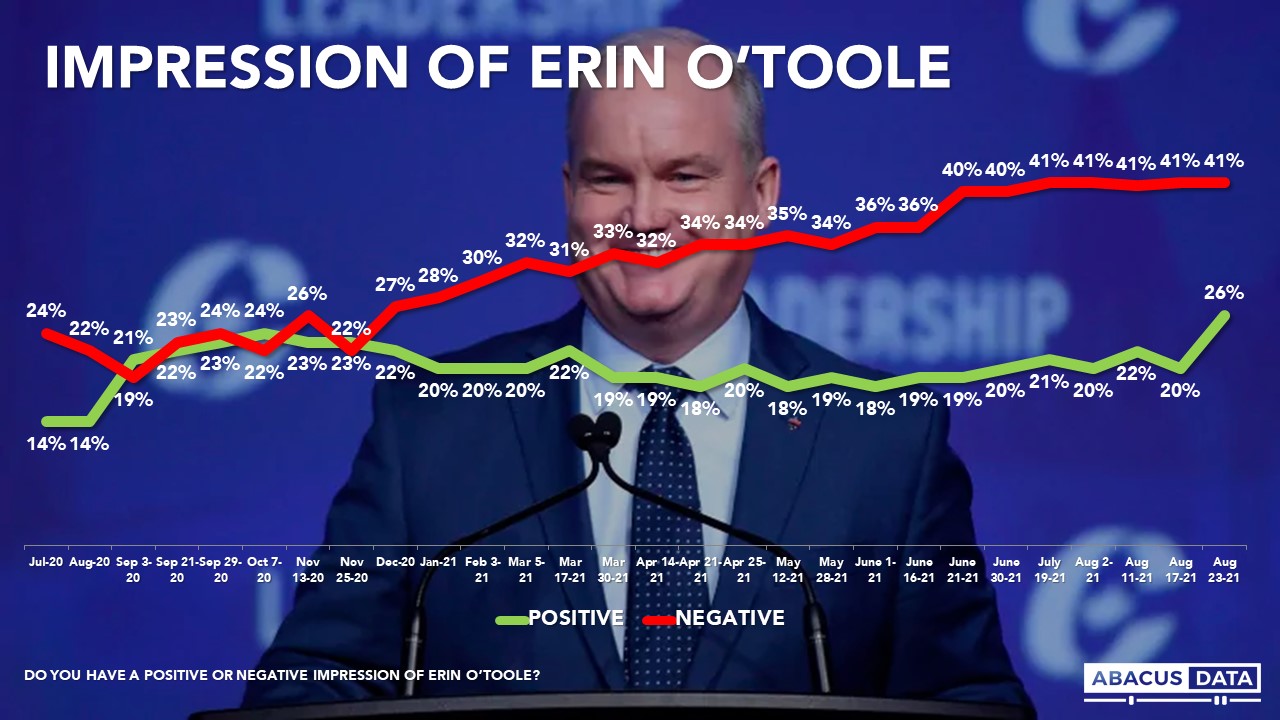
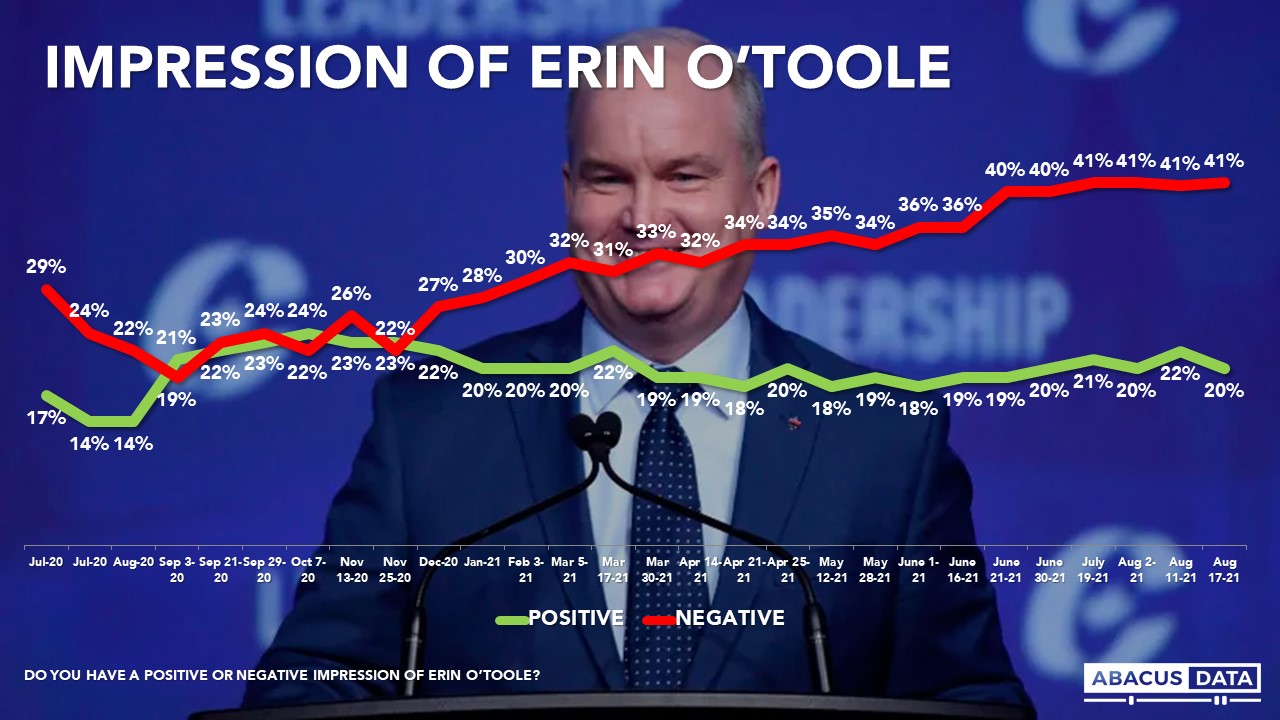
Erin O’Toole’s image has improved over the past week. Today 26% have a positive impression of the Conservative leader (+5) while his negatives remain at 41% for a net score of -15. Regionally, Mr. O’Toole is -20 in BC, +1 in AB, -14 in SK/MB, -16 in Ontario, -15 in Quebec, and -7 in Atlantic Canada.
In terms of whether people’s views are improving or declining of the three main party leaders, we find Mr. Trudeau has the lowest momentum score while Mr. Singh has the highest.
• Justin Trudeau: 20% say their impressions are improving, 36% declining, for a momentum score of -16. Among those open to voting Liberal but not currently supporting the party, 18% say their views of Mr. Trudeau are improving while 25% say they are declining (score -7).
• Erin O’Toole: 24% say their impressions are improving, 28% declining, for a momentum score of -4. Among those open to voting Conservative but not currently supporting the party, 28% say their views of Mr. O’Toole are improving while 16% say they are declining (score +12). Among those with a neutral view of Mr. O’Toole, 18% say their views are improving while 12% say they are declining.
• Jagmeet Singh: 32% say their impressions are improving, 16% declining, and 52% not changing for a momentum score of +16. Among those open to voting NDP but not currently supporting the party, 41% say their views of Mr. Singh are improving while 5% say they are declining (score +36).
FEDERAL VOTE INTENTION
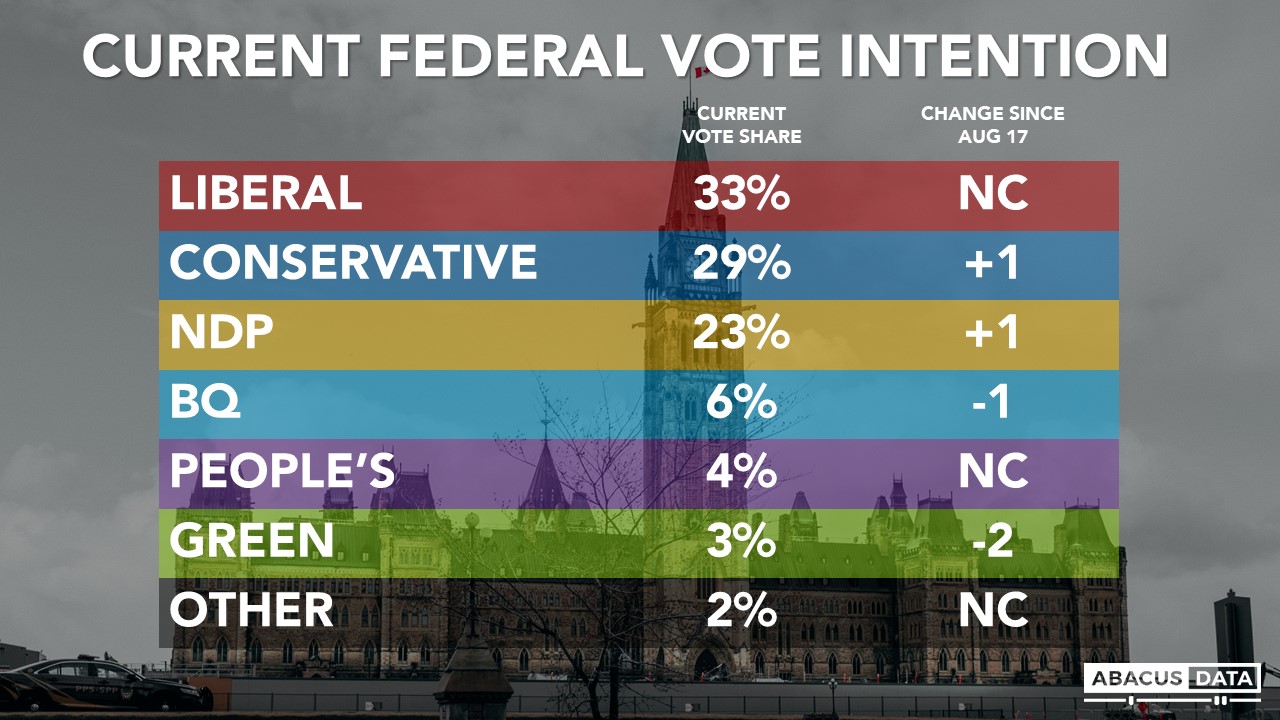
If the election were today:
• The Liberals would win 33% of the vote (unchanged from last week, and the same result they got in 2019).
• The Conservatives would garner 29% (+1 from last week but still down 5 from their 2019 result)
• The NDP would get 23% of the vote (+1 over the week, and 7-points above their 2019 result)
• The Green Party would find 3% support (-2 in a week and down 4 from 2019.
• The BQ at 29% in Quebec (down 2 from last week down 3 from their 2019 result.
The regional races look like this:
• In BC, we see the Liberals at 33%, the NDP at 31% and the Conservatives at 28%. The Greens are at 7%.
• In Alberta, 45% would vote Conservative, 30% for the NDP, 15% for the Liberals, and 5% for the People’s Party.
• In Manitoba and Saskatchewan, the Conservatives lead by 9 over the NDP and Liberals.
• In Ontario, the Liberals lead by 6 (36% to 29% for the Conservative Party) with the NDP close behind at 26%. The People’s Party is at 5% in Ontario.
• In Quebec, we see the Liberals with 35%, followed by the BQ (29%), the Conservatives (19%) the NDP at 11%. The Greens are at 3% in Quebec.
• In the Atlantic provinces, the Liberals (45%) are well ahead of the Conservatives (32%) and the NDP (16%).
Some additional breakouts that are worth noting:
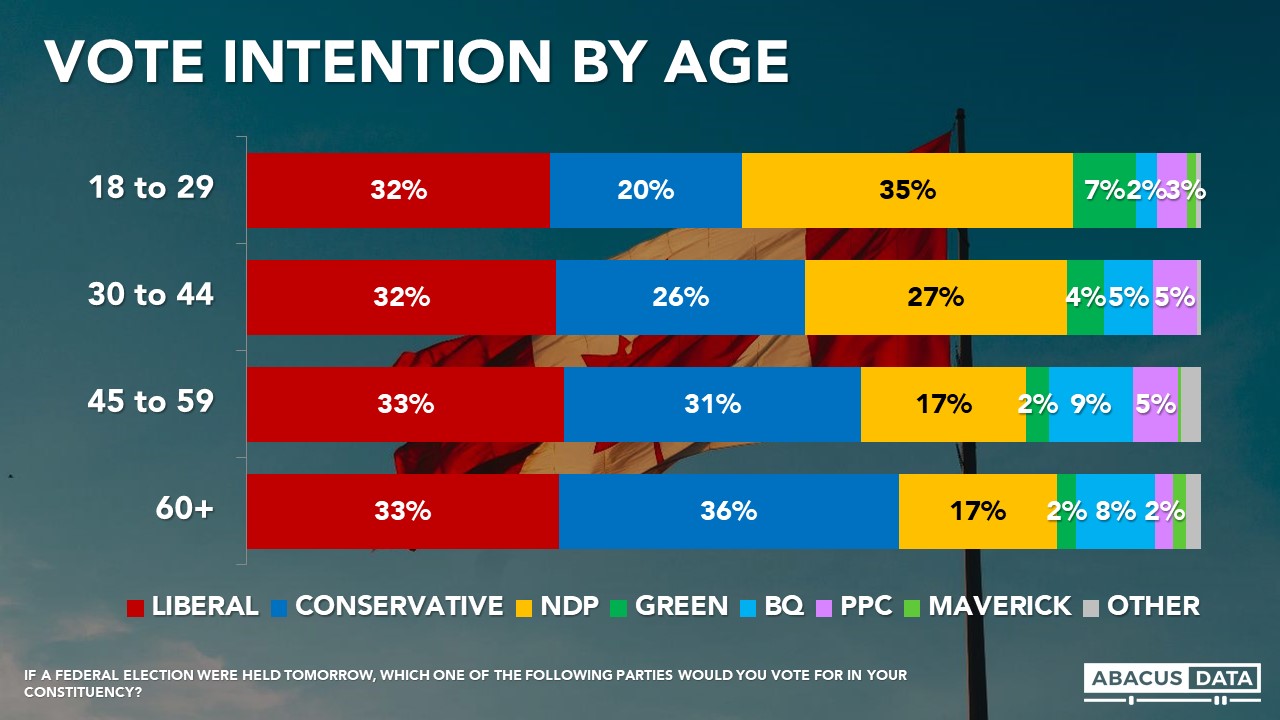
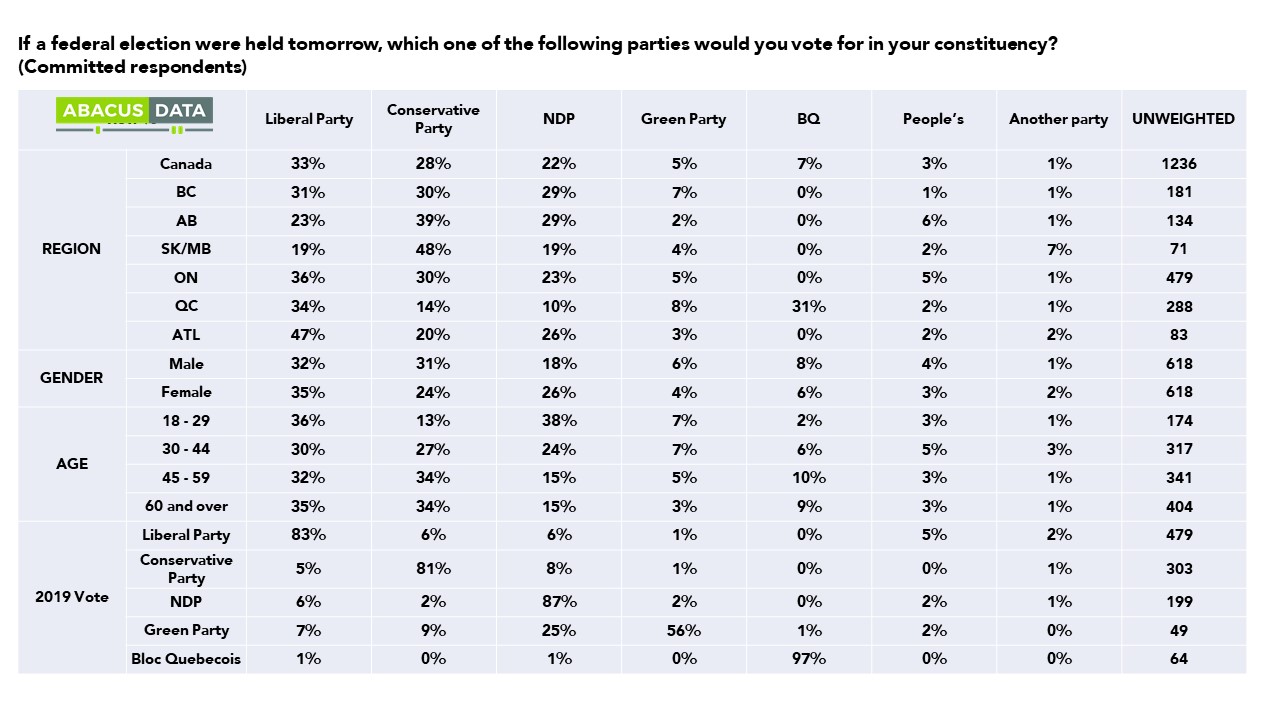
• The NDP and Liberals are statistically tied among those under 30 (NDP 35%, LPC 32%, CPC 20%). The Liberals have a 5-point lead among those aged 30 to 44 (LPC 32%, NDP 27%, CPC 26) while the Conservatives and Liberals are competitive among those aged 45 and over.
• The Liberals have a 7-point lead among those with a university education while the Conservatives have a 4-point lead among those with a high school diploma or less.
• Among union members, 38% would vote Liberal, 28% Conservative and 21% NDP. The NDP does slightly better among those who are not unionized.
• Among those who have received CERB or live in a household who has received CERB, the Liberals are ahead by 8 (LPC 36%, NDP 28%, CPC 26%).
• Among homeowners, the Conservatives lead by 6 (CPC 36%, LPC 30%, NDP 19%). Among renters, the Liberals lead by 14 over the NDP (LPC 39%, NDP 25%, CPC 20%).
VOTE BY THOSE WHO SAY THEY DEFINITELY WILL VOTE
Among the 72% of respondents who said they would definitely be voting, the Liberals and Conservatives are tied at 31% with the NDP at 22%. The BQ is at 7%, the People’s Party at 4%, and the Greens at 3%.
OPEN TO CHANGING MIND?
Right now, 60% of decided voters say they have made up their mind and won’t change while 40% say they could still change their mind about who to vote for.
About two-thirds of Conservative, BQ, and Liberal supporters say their mind is made up (69%, 67%, and 63%), while less than half of NDP (47%) and Green (42%) supporters say they are locked into their choice.
Among those who are firm in their choice, the vote split is 34% Liberal, 34% Conservative, and 18% NDP.
It’s clear many current NDP and Green supporters are still up for grabs. Among these soft NDP and Green supporters, 79% would prefer Justin Trudeau as Prime Minister over Erin O’Toole and 83% would prefer some form of Liberal government while 17% would prefer a Conservative government of some form.
INTRODUCING THE SWITCHERS
To understand the potential shifts in the electorate over the final four weeks of the campaign, we identify two key voter groups: LPC/CPC switchers and LPC/NDP switchers.
LPC/NDP Switchers are those whose first preference is either Liberal or NDP and whose second preference is either Liberal or NDP. In total, they make up 21% of the entire electorate.
Currently, 55% of this group would vote Liberal and 45% would vote NDP. In 2019, 55% voted Liberal, 23% voted NDP and 17% did not vote. 3% voted Conservative while 1% voted Green.
79% have a positive impression of Mr. Singh while 63% have a positive impression of Mr. Trudeau. 55% would prefer Mr. Trudeau as PM after the election while 44% would prefer Mr. Singh.
76% think the Liberals are going to win the election versus 14% who think the NDP will win. 7% are unsure.
Between Justin Trudeau and Erin O’Toole, 97% would prefer Mr. Trudeau to be Prime Minister after the election while 3% would prefer Mr. O’Toole. 99% would prefer a Liberal government and 1% would prefer a Conservative government.
When asked to select the top two issues from a list, 30% selected cost of living, 29% selected climate change, 24% improving the healthcare system and 20% selected making housing more affordable. 16% said getting more people vaccinated and getting the country back to normal quicker was a top 2 issue for them.
LPC/CPC Switchers are respondents whose first preference is either Liberal or Conservative and whose second preference is either Liberal or Conservative. In total, they make up 9% of the entire electorate.
Currently, 64% of this group would vote Liberal and 36% would vote Conservative. In 2019, 50% voted Liberal, 25% Conservative, 3% NDP, and 21% did not vote.
62% have a positive impression of Mr. Trudeau compared with 42% for Mr. O’Toole although 44% have a neutral opinion of Mr. O’Toole.
72% think the Liberals are going to win the election versus 21% who think the Conservatives will win. 55% are unsure. 73% would prefer a Liberal government after the election while 27% would prefer a Conservative one.
When asked to select the top two issues from a list, 29% selected improving Canada’s health care system, 28% picked growing the economy, and 26% reducing the cost of living. 18% said getting more people vaccinated and getting the country back to normal quicker while 14% picked climate change and reducing carbon emissions.
A CLOSER LOOK AT ONTARIO
In Canada’s most populous province the Liberals hold a 6-point lead over the Conservatives (35% to 29%) which is unchanged from last week. The NDP is not far behind at 26%.
Regionally in Ontario, we find the Liberals well ahead in Toronto (Liberal 48%, Conservative 22%, NDP 20%) but a close three-way race in the Greater Toronto/Hamilton/Niagara region. The Liberals are at 32%, the Conservatives 31%, and the NDP 30%. In Eastern Ontario, we have the Conservatives and Liberals basically tied (36% to 35%) with the NDP at 21% while in Southwestern Ontario, the Liberals and Conservatives are tied at 30% with the NDP not far behind at 25%.
Some other insights to consider:
• Accessible voter pools: In Ontario, the pool of accessible voters is 57% for the Liberals (-4 since before the election), 52% for the NDP (unchanged) and 47% for the Conservatives (+5 since before the election).
• Leader Impressions: While positive impressions of Mr. Singh are largely consistent (before election call 43%, today 42%), those with positive views of Mr. O’Toole in Ontario are up 3 (21% to 24%) and Mr. Trudeau’s positives are down marginally by 2-points (43% to 41%).
• Desire for Change: There has been no change in the more intense desire for change in Ontario. Before the campaign, 43% of Ontarians definitely wanted a change in government, the same number as today.
METHOD OF VOTING?
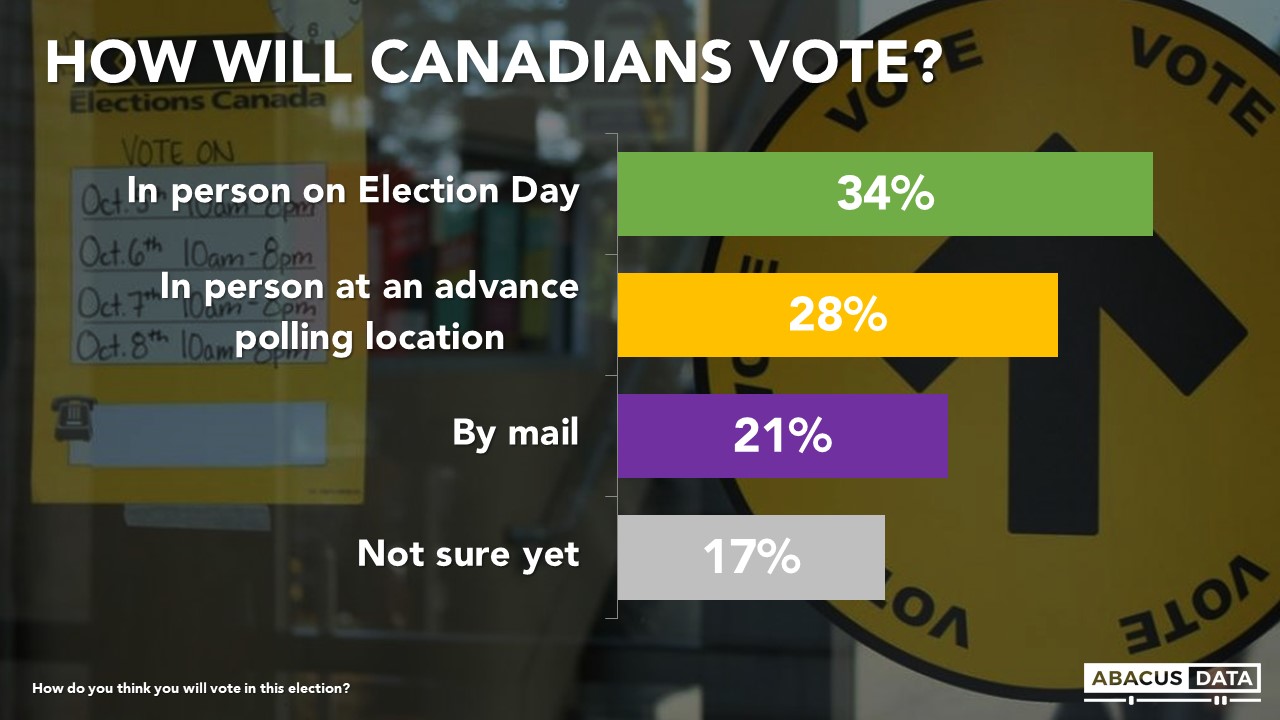
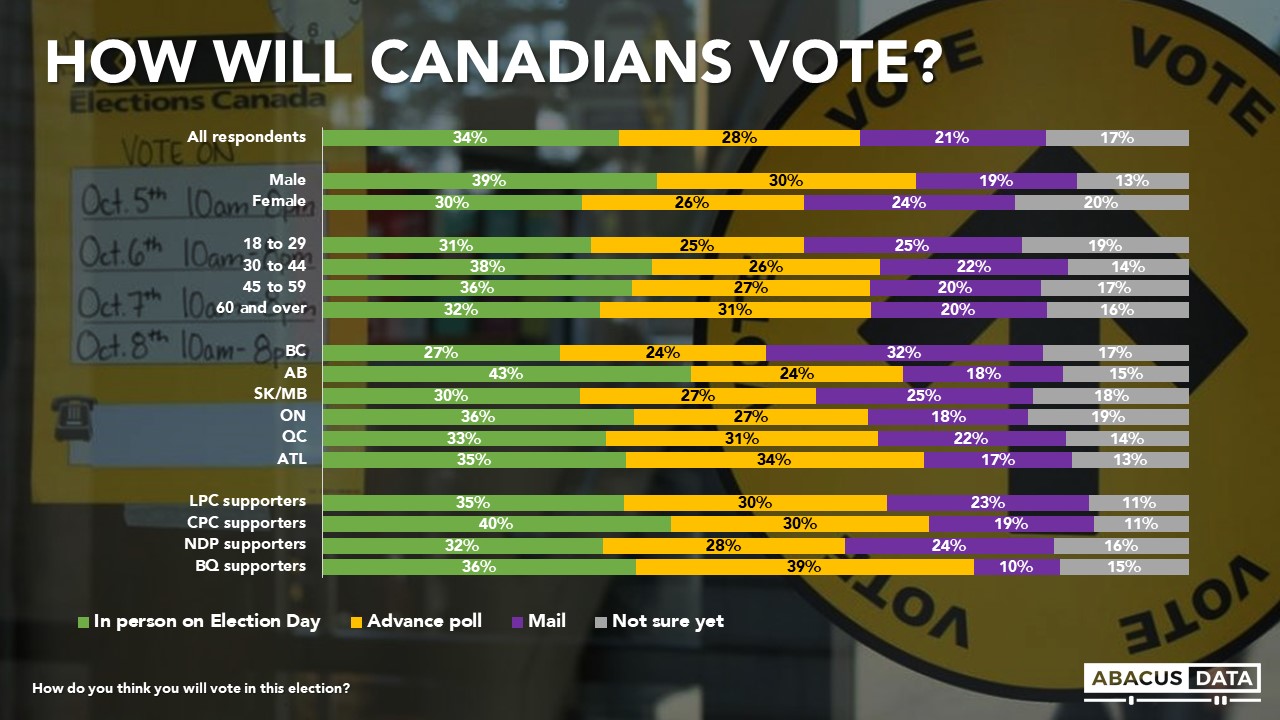
When asked how they think they will vote in this election, 34% said they planned to vote in person on Election Day, 28% planned to vote at an advance polling location before election day, while 21% intend to vote by mail. 17% were not sure yet.
Among those who say they will definitely be voting in the election, 38% plan to vote in person on Election Day, 31% at an advance poll, and 18% by mail.
Liberal and NDP supporters are more likely to say they intend to vote by mail (Liberal 24%, NDP 25%, CPC 18%) while Conservative supporters are more likely to say they will vote in person on Election Day (CPC 41%, 34% Liberal, NDP 32%).
UPSHOT
According to Bruce Anderson: “Voters are signalling that now that the hypothetical election is an actual election, they will consider their choices carefully, and are open to persuasion. There’s no doubt that younger voters in particular are showing high levels of interest in the NDP as we’ve reported on for a few months and this trend is continuing. Erin O’Toole is out of the gates well, but still has an image deficit relative to his competitors and Conservative vote intention is hobbled a bit by the presence of the People’s Party on the ballot.
The Liberals see competition from the Conservatives among older voters and from the NDP among younger voters. Clearly there is more to be gained or lost with progressive voters, with so many NDP and Green Party voters unsure if they really want a change in government, and definitely preferring a Liberal to a Conservative outcome. It’s too early to read much into the public mood about any specific thing that has happened in the campaign, but it’s not too early to know that a lot of different outcomes are possible, and winning the vote will take real effort and getting those ballots cast will also require an unusual effort by the campaigns.”
According to David Coletto: “After week one of the campaign, the Liberals continue to hold a five-point national lead over the Conservatives and not a lot has changed in many of the metrics we regularly track like mood, desire for change, government approval, or leader impressions.
Mr. O’Toole seems to have made the most progress over the first week as his positives are up 6-points in a week. Although, the Conservative vote share remains below 30%.
Based on our momentum numbers, Mr. Singh likely had the best week with Mr. O’Toole not far behind. Mr. O’Toole seems to have made a lot of progress over the first week as his positives are up 6-points in a week but he still has a wide affinity gap that he will need to close quickly. The NDP are inching up, especially in Ontario, but the Conservatives are still stuck below 30% in our tracking.
This data also shows that much of NDP and Green support is soft, and many might be persuaded to vote strategically if the Conservatives appear in contention. By a 66-point margin, soft NDP and Green supporters would prefer some form of Liberal government rather than a Conservative government after the election is over.
If voters want this election to be about affordability, housing, the economy, and climate change, the results of this survey give us some insight into how those potential ballot questions are playing out.
Right now, neither Mr. Trudeau nor Mr. O’Toole has an advantage on the economy. Mr. Singh has a slight advantage on housing, while the Liberals and Mr. Trudeau lead on who voters think is best on climate change.
But when it comes to affordability and reducing the cost of living – the NDP, Liberals, and Conservatives are all within three points of each other and none of them have a clear advantage on the issue more voters say will drive their vote than on any other.”
METHODOLOGY
The survey was conducted with 2,000 Canadian adults from August 17 to 22, 2021. A random sample of panelists were invited to complete the survey from a set of partner panels based on the Lucid exchange platform. These partners are typically double opt-in survey panels, blended to manage out potential skews in the data from a single source.
The margin of error for a comparable probability-based random sample of the same size is +/- 2.2%, 19 times out of 20.
The data were weighted according to census data to ensure that the sample matched Canada’s population according to age, gender, educational attainment, and region. Totals may not add up to 100 due to rounding.
The survey was commissioned and paid for by Abacus Data Inc.
ABOUT ABACUS DATA
We are the only research and strategy firm that helps organizations respond to the disruptive risks and opportunities in a world where demographics and technology are changing more quickly than ever.
We are an innovative, fast-growing public opinion and marketing research consultancy. We use the latest technology, sound science, and deep experience to generate top-flight research-based advice to our clients. We offer global research capacity with a strong focus on customer service, attention to detail and exceptional value.
We were one of the most accurate pollsters conducting research during the 2019 Canadian Election.
Each day during the 2021 Federal Election campaign, researchers at Abacus Data will share insights and analysis from our polling in concise, insights-focused reports. To never miss our polls and analysis, subscribe to our newsletter.
Elections often feel like a referendum on the previous 4 years, or in this case 2 years. A choice between “kicking the bums out” or acknowledging that we are better off than perhaps we would be otherwise. So what role does voter emotion play in election campaigns and outcome? Are Canadians happy or unhappy with where we are now?
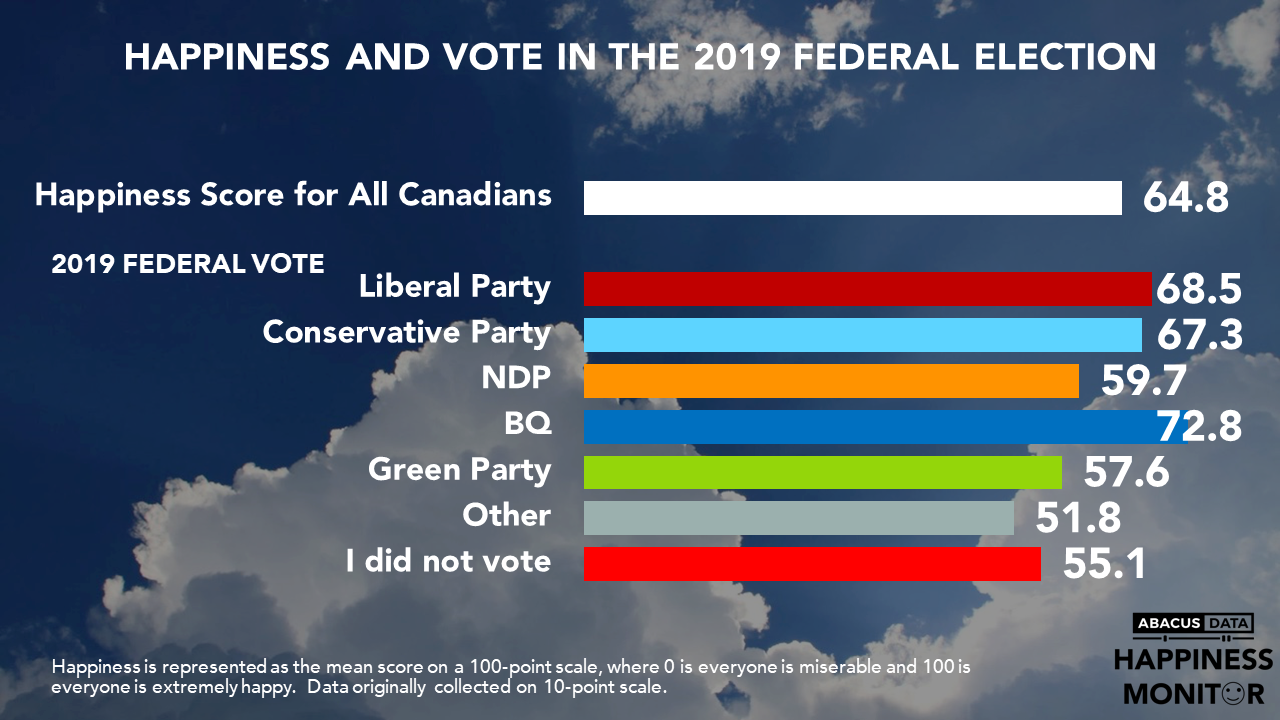
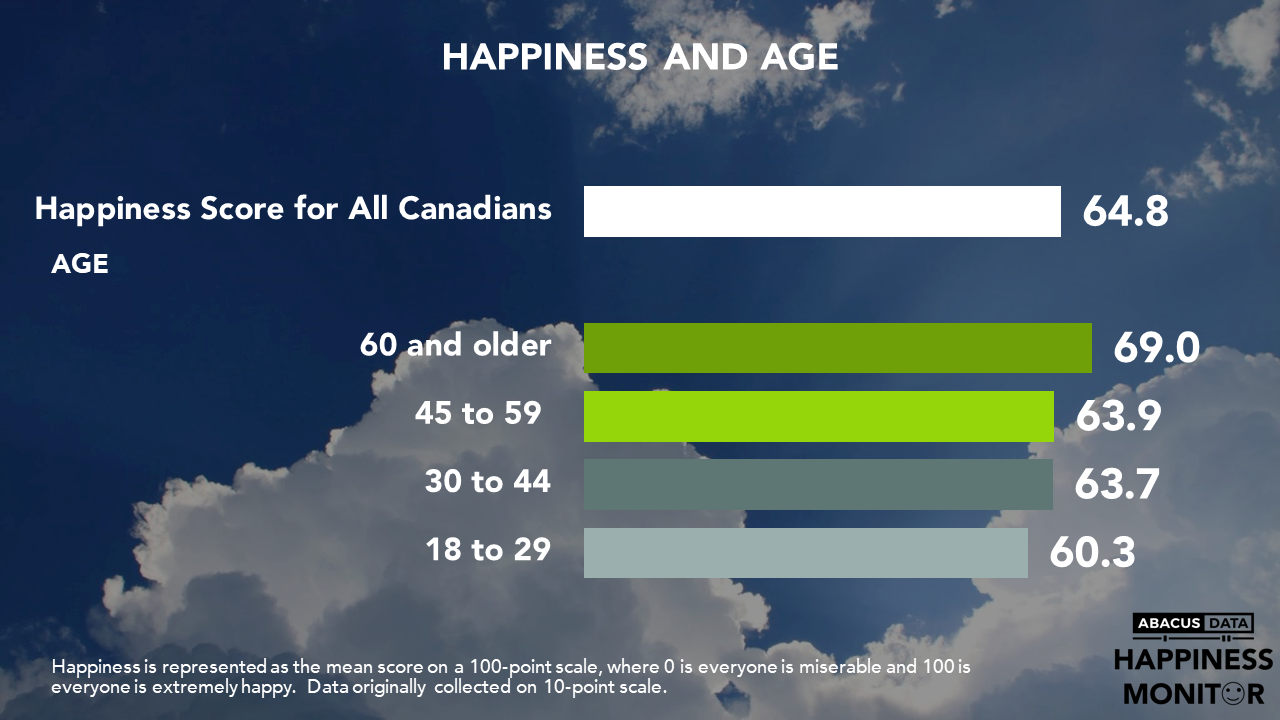
With the first week of the campaign underway, in the books, the average happiness score is 64.8 out of 100. Our overall happiness is consistently higher than it was last fall and winter. While this is good news for the incumbent party, as it may indicate a potential “reward” for getting us through the pandemic so far.
Happiness and Political Engagement Go Together
It turns out that political participation is related to happiness. The average happiness score for people who didn’t vote in 2019 is 55.1; a full ten points lower than the average Canadian. Voters for the smaller parties are also less happy now. Those who voted Liberal, Conservative and BQ in 2019 are the most happy now. NDP voters in the last election are, however, a major party of voters who are not happy right now.
[sc name=”signup”]
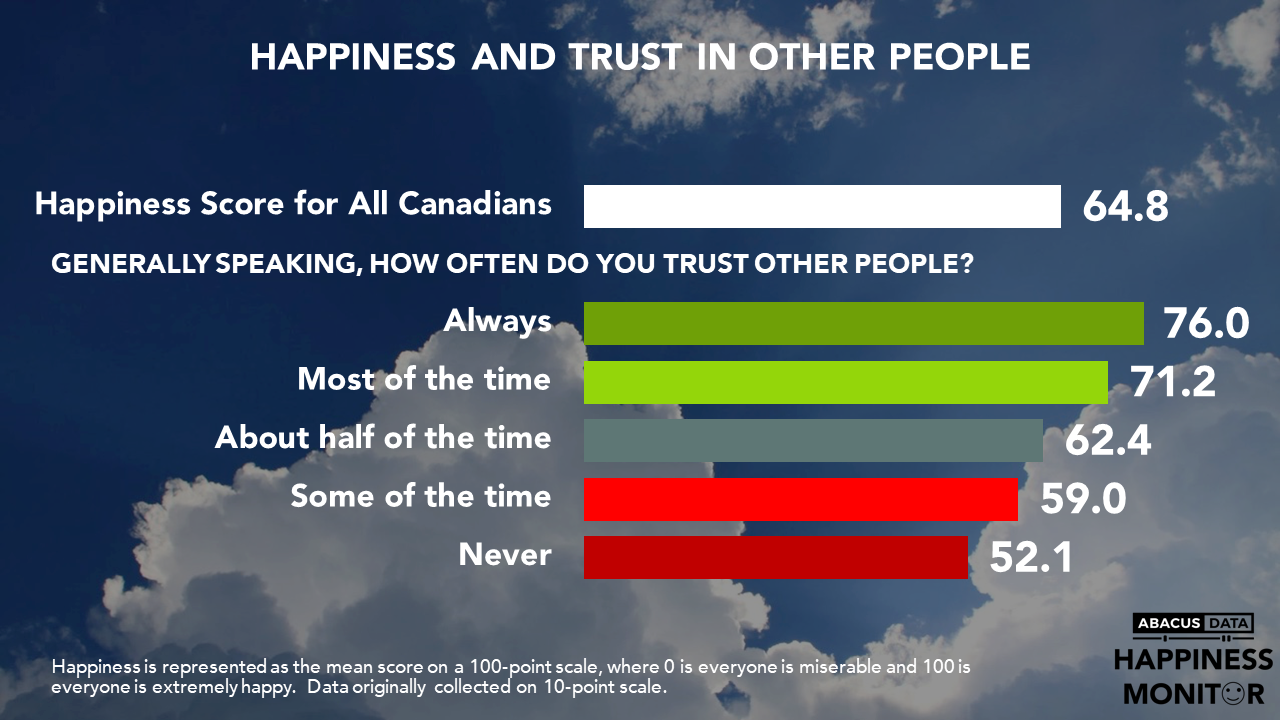
While we don’t know if their unhappiness caused them to not vote, unhappiness, it appears, is part of a disengagement with community. Those who don’t trust other people are much less happy. The happiness score for those who trust other people always is 76.0. This is 24 points higher than for people who never trust other people.
While unhappiness may be a motivator to act for change, it also appears (perhaps over time) to disengage Canadians from the political process. This is important because of the very strong relationship between age and happiness. Older Canadians are much more happy than those under 30 years of age.
UPSHOT
According to Richard Jenkins: The improved positive emotion that Canadians have now compared with the pandemic offers the incumbent some good news. The three big questions are: (1) Will young people punish the incumbent as a reflection of their relative unhappiness or will they simply disengage? (2) Does the relative happiness of Conservative voters from 2019 offer the Liberals a chance to convert them to Liberal voters in 2021? (3) Will the unhappiness of NDP voters from 2019 lead to NDP gains?
We know that emotion will be central the happiness levels of different kinds of voters are likely to impact the strategies that parties use to activate them and get them to vote.
METHODOLOGY
Our survey was conducted online with 2000 Canadians aged 18 and over from August 17 to 22, 2021. A random sample of panellists was invited to complete the survey from a set of partner panels based on the Lucid exchange platform. These partners are double opt-in survey panels, blended to manage out potential skews in the data from a single source.
The margin of error for a comparable probability-based random sample of the same size is +/- 2.2%, 19 times out of 20. In Canada the data were weighted according to census data to ensure that the sample matched Canada’s population according to age, gender, educational attainment, and region.
The data were weighted according to census data to ensure that the sample matched Canada’s population according to age, gender, educational attainment, and region. Totals may not add up to 100 due to rounding.
We are the only research and strategy firm that helps organizations respond to the disruptive risks and opportunities in a world where demographics and technology are changing more quickly than ever.
We are an innovative, fast-growing public opinion and marketing research consultancy. We use the latest technology, sound science, and deep experience to generate top-flight research-based advice to our clients. We offer global research capacity with a strong focus on customer service, attention to detail and exceptional value.
We were one of the most accurate pollsters conducting research during the 2019 Canadian Election.
Each day during the 2021 Federal Election campaign, researchers at Abacus Data will share insights and analysis from our polling in concise, insights-focused reports. To never miss our polls and analysis, subscribe to our newsletter.
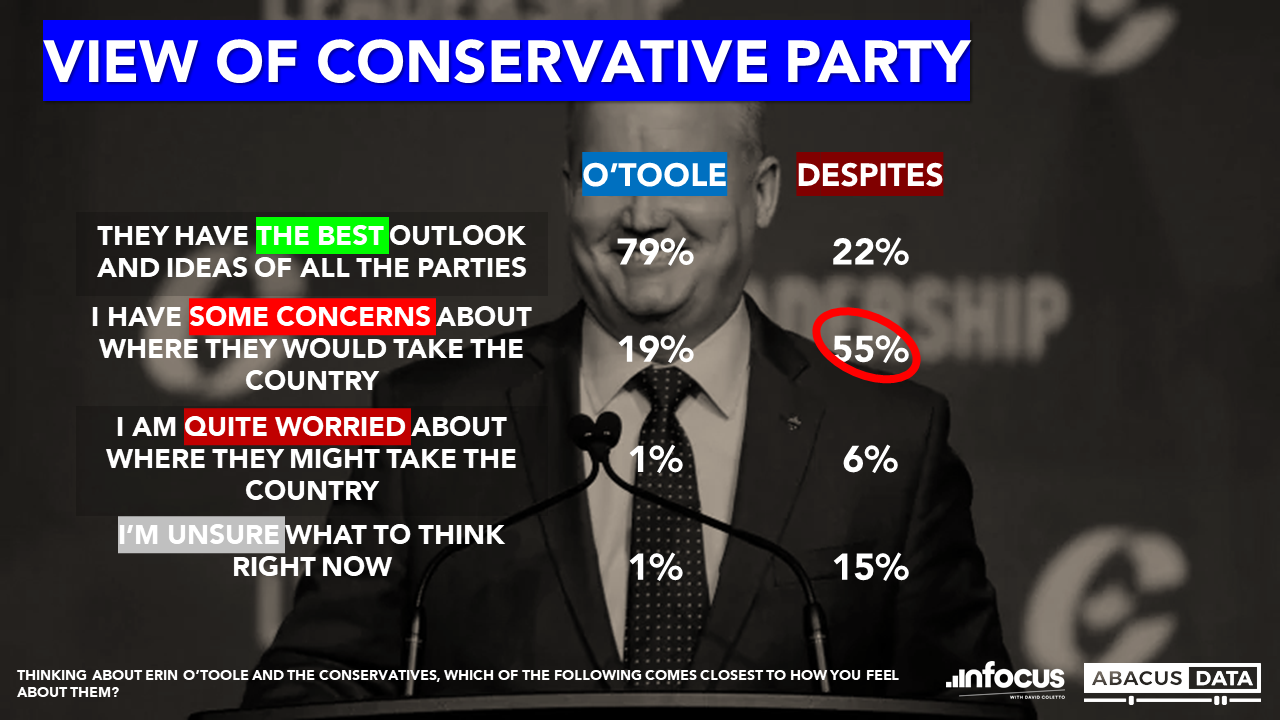
Yesterday we examined “Despite O’Toole” Tory voters and what made them unique. What jumped out most was not that they exist, but how many of them there were in the current CPC vote, especially compared to substantial pro-Singh and pro-Trudeau enthusiasm among NDP and Liberal voters.
Is this something that can be reasonably expected to evolve for Mr. O’Toole? By no means a comprehensive analysis, we looked to see how the Prime Minister’s experience tracked in each election prior, being the only candidate with more than 2 federal elections under his belt. We examined polling results recorded at the start of each respective campaign period for 2015 and 2019 to see how they compared to the strong relationship between his reputation and vote intention today.
Of the waves sampled, Justin Trudeau’s vote has always had strong synergies with his personal popularity, with both his 2015 and 2019 LPC voting bloc seeing strong affect for the Prime Minister. Today’s LPC vote is even more associated with the Prime Minister than it was before (+6 % pts view him positively).
I don’t interpret these data points to mean anything particularly good or bad for the Prime Minister, only to say that there is some evidence that a vote for LPC has been more about PM Trudeau personally, and that any possible phenomenon of LPC voters holding their nose to vote for the PM because of a “big L” Liberal brand loyalty seems both scarce historically and in the present day.
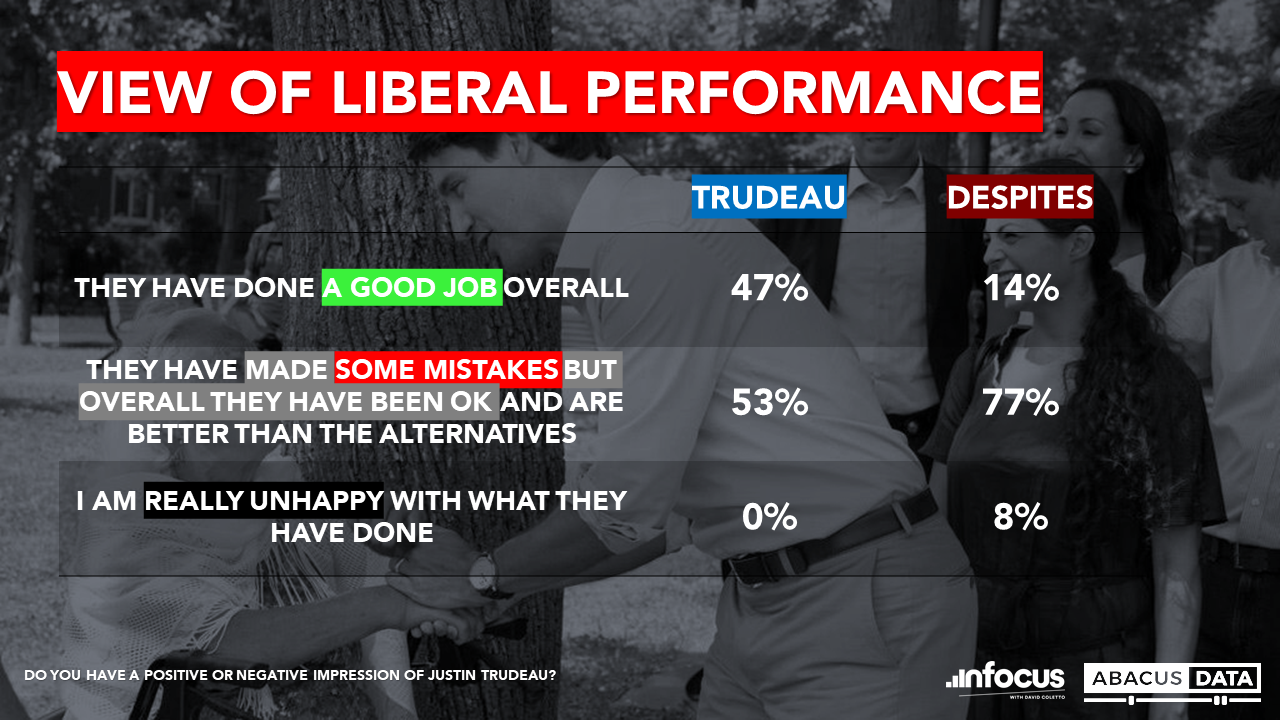
That said, though “Despite Trudeau” voters are few and far between, they exist. And their foundational political perspective is that the Liberal option is better than alternative. Few are unhappy with what the Liberals are done, but they are far less likely to say the Trudeau has done a good job overall. They accept a mixed record and are willing to park with the LPC for now.
What to make of all this? The early data suggests that the Liberals’ existing support may be stickier than what O’Toole’s team is working with. That doesn’t mean he’ll never beat Trudeau’s popular vote. It only means existing Liberal voters – wholly 33% of the voting public – today have maintained a fondness for the Prime Minister through significant tenure with a fair share of scandals.
It’s worth acknowledging that there are many who dislike the Prime Minister and have removed themselves entirely from the Liberal camp to begin with, no doubt driven to other political homes. And there are, to be sure, plenty of voters to steal from all across the political spectrum. Yet having the majority of the 33% of voters who would vote Liberal today comprised of Justin Trudeau enthusiasts will make stealing vote share from the governing party a bit harder than might otherwise be the case.
METHODOLOGY
The survey was conducted with 1500 Canadian adults from August 9th to 12th, 2021. A random sample of panelists were invited to complete the survey from a set of partner panels based on the Lucid exchange platform. These partners are typically double opt-in survey panels, blended to manage out potential skews in the data from a single source.
The margin of error for a comparable probability-based random sample of the same size is +/- 2.5%, 19 times out of 20.
The data were weighted according to census data to ensure that the sample matched Canada’s population according to age, gender, educational attainment, and region. Totals may not add up to 100 due to rounding.
We are the only research and strategy firm that helps organizations respond to the disruptive risks and opportunities in a world where demographics and technology are changing more quickly than ever.
We are an innovative, fast-growing public opinion and marketing research consultancy. We use the latest technology, sound science, and deep experience to generate top-flight research-based advice to our clients. We offer global research capacity with a strong focus on customer service, attention to detail and exceptional value.
We were one of the most accurate pollsters conducting research during the 2019 Canadian Election.
Each day during the 2021 Federal Election campaign, researchers at Abacus Data will share insights and analysis from our polling in concise, insights-focused reports. To never miss our polls and analysis, subscribe to our newsletter.
If you’ve spent some time in our parliamentary democracy, you’ll have caught on that power is centralized here. Very centralized.
A lot of that centralization happens around whoever is Prime Minister, who at some point in their career is an optimistic party leader trying to become one. It follows that voters for any given political party, come election time, are motivated to do so because of who is on top, with their view of the leader’s personality and values being the primary if not a strong tertiary driver of their vote intention.
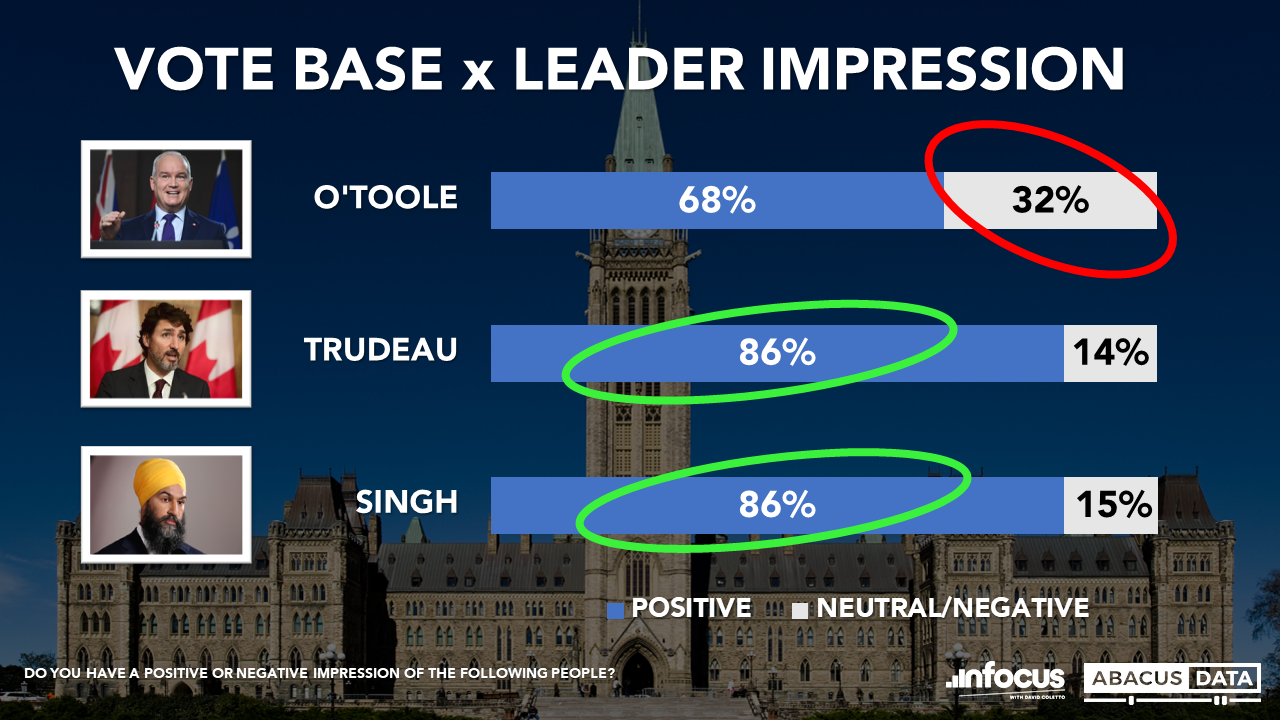
Things don’t always play out that way. Looking at this year’s 3 main hopefuls we see one sticks out as the least established among his own support base; Erin O’Toole. While this is often experienced by new entrants who don’t have ancient pedigrees or a previous election to solidify their reputations, 1/3rd of CPC’s present-day voters are either O’Toole agnostic or antagonistic. In other words, they either have a negative view of him, are neutral, or don’t really know what to think. This is in notable contrast to both Justin Trudeau and Jagmeet Singh, most of whose voters are fond of their party leaders.
[sc name=”signup”]
THE DESPITE O’TOOLE VOTER
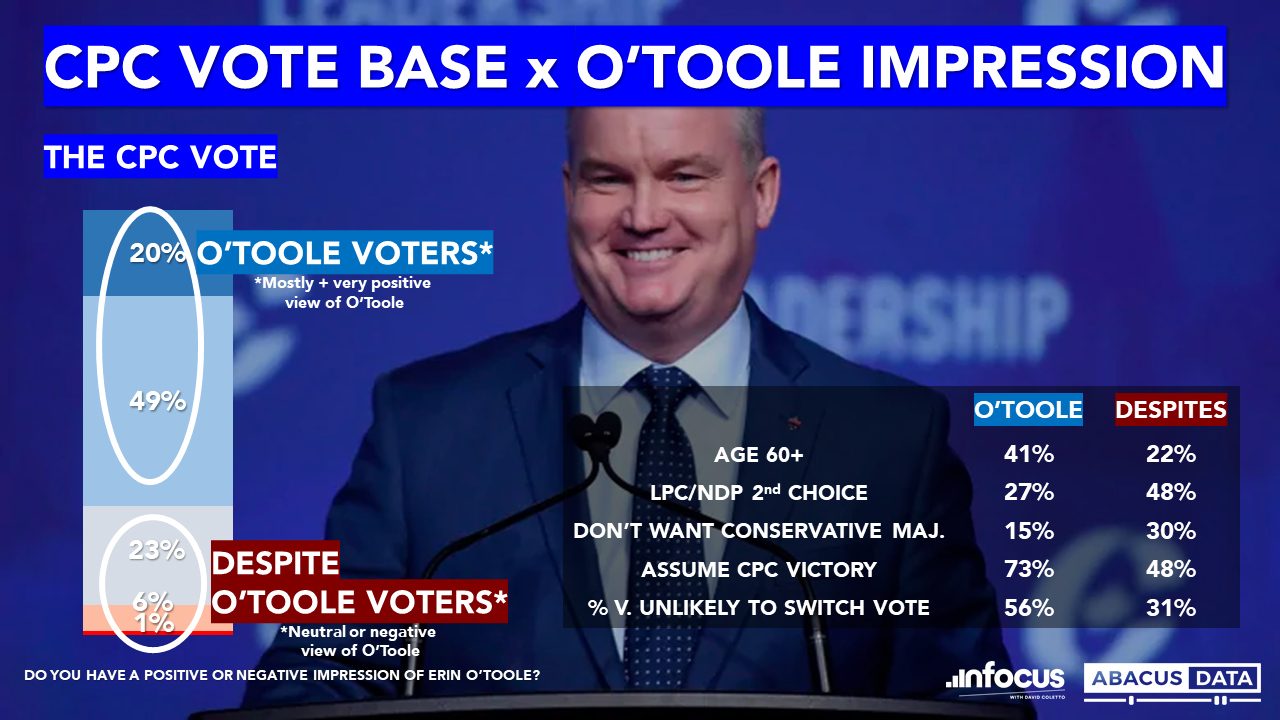
These “Despite O’Toole” voters are the fresher faces of the party base. The vast majority – 8 in 10 – are under the age of 60. Half have the LPC or NDP as their 2nd choice, and when we ask them about their ideal outcome for this election, a substantial proportion aren’t even looking for a Conservative majority government. In part, despite their present vote orientation, most assume the CPC won’t win at all, be it minority or majority. This is a striking attitudinal departure from O’Toole friendly voters, most of whom assume the CPC will win this time around.
Underscoring these views is a softer loyalty to the party. 2 in 3 of these CPC voters say they are either likely to change their vote (30%) or merely “somewhat unlikely” (39%).
They align with other CPC voters on most issues, including their priorities this election. They primarily are concerned about the cost of living and seeing a credible economic plan this campaign. And they like other brands of Conservatism, just not O’Toole’s. On average Premier Ford is more popular with this group than the federal CPC leader, with 70% feeling outright positively (30%) or neutral (39%) about the well-known Premier of Ontario.
Fundamentally they view the Conservative Party and where Erin O’Toole is taking it through a different lens than other Tory voters. Most of these voters reject that the CPC has the best outlook and ideas of all the parties, with most instead having concerns about where they would take the country should they get elected.
There’s enough of a pull towards the party that these younger Canadians would opt for the Conservatives over the Liberals and NDP, but they aren’t entirely confident in their choice. One of O’Toole’s many challenges will be not to lose these fair-weather Conservatives and convince them that the party leadership does have the plan and credibility to carry the country through an unprecedented economic and health crisis. Or at the very least to present one that consistently looks better than what the Prime Minister has had on offer.
METHODOLOGY
The survey was conducted with 1500 Canadian adults from August 9th to 12th, 2021. A random sample of panelists were invited to complete the survey from a set of partner panels based on the Lucid exchange platform. These partners are typically double opt-in survey panels, blended to manage out potential skews in the data from a single source.
The margin of error for a comparable probability-based random sample of the same size is +/- 2.5%, 19 times out of 20.
The data were weighted according to census data to ensure that the sample matched Canada’s population according to age, gender, educational attainment, and region. Totals may not add up to 100 due to rounding.
We are the only research and strategy firm that helps organizations respond to the disruptive risks and opportunities in a world where demographics and technology are changing more quickly than ever.
We are an innovative, fast-growing public opinion and marketing research consultancy. We use the latest technology, sound science, and deep experience to generate top-flight research-based advice to our clients. We offer global research capacity with a strong focus on customer service, attention to detail and exceptional value.
We were one of the most accurate pollsters conducting research during the 2019 Canadian Election.
Each day during the 2021 Federal Election campaign, researchers at Abacus Data will share insights and analysis from our polling in concise, insights-focused reports. To never miss our polls and analysis, subscribe to our newsletter.
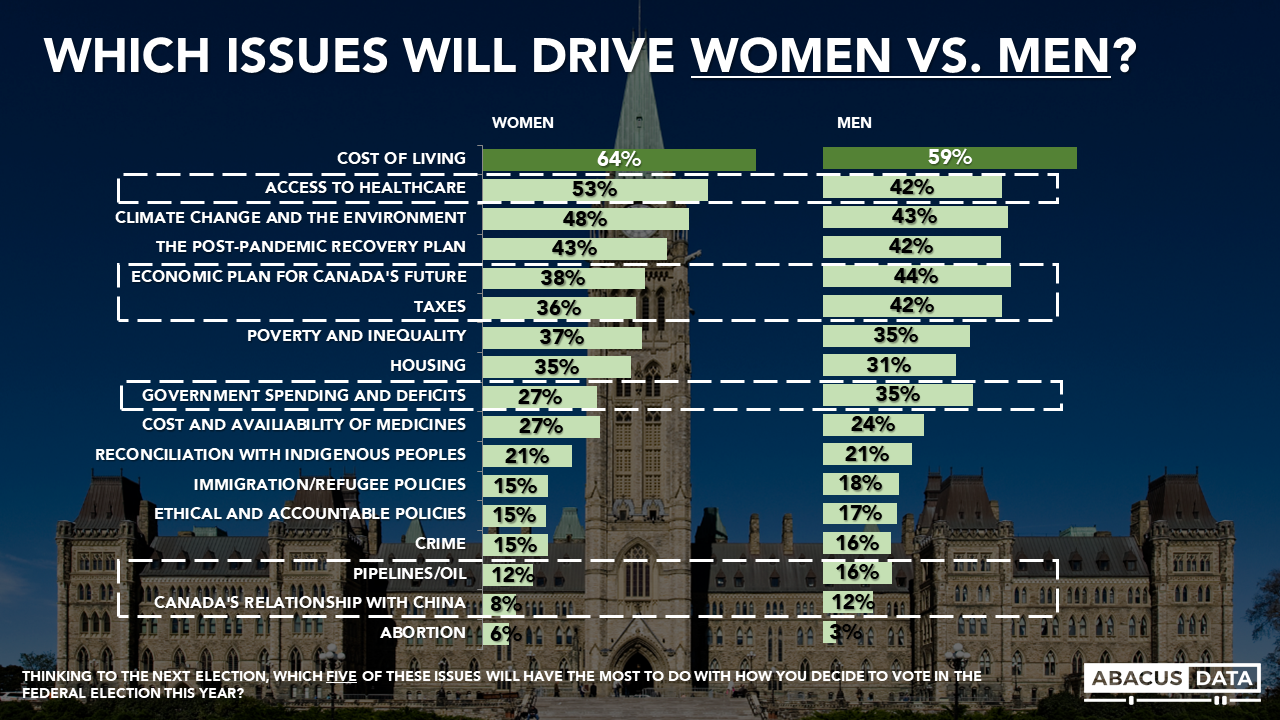
Keeping with our weekly theme of top election issues, we wanted to know if there were any difference between men and women. As a note, the analysis below compares just men vs women as sample sizes for others were too small for analysis.
Unsurprisingly, cost of living tops the list for both men and women, though more women are including it in their top 5 than men (64% vs. 59%).
The differences between what men and women are prioritizing don’t end there. In addition to cost of living, women are prioritizing healthcare more than men, while men tend to be more likely to prioritize issues like an economic plan for Canada’s future, taxes, and government spending.
Does age have any impact on how men and women view the top issues?
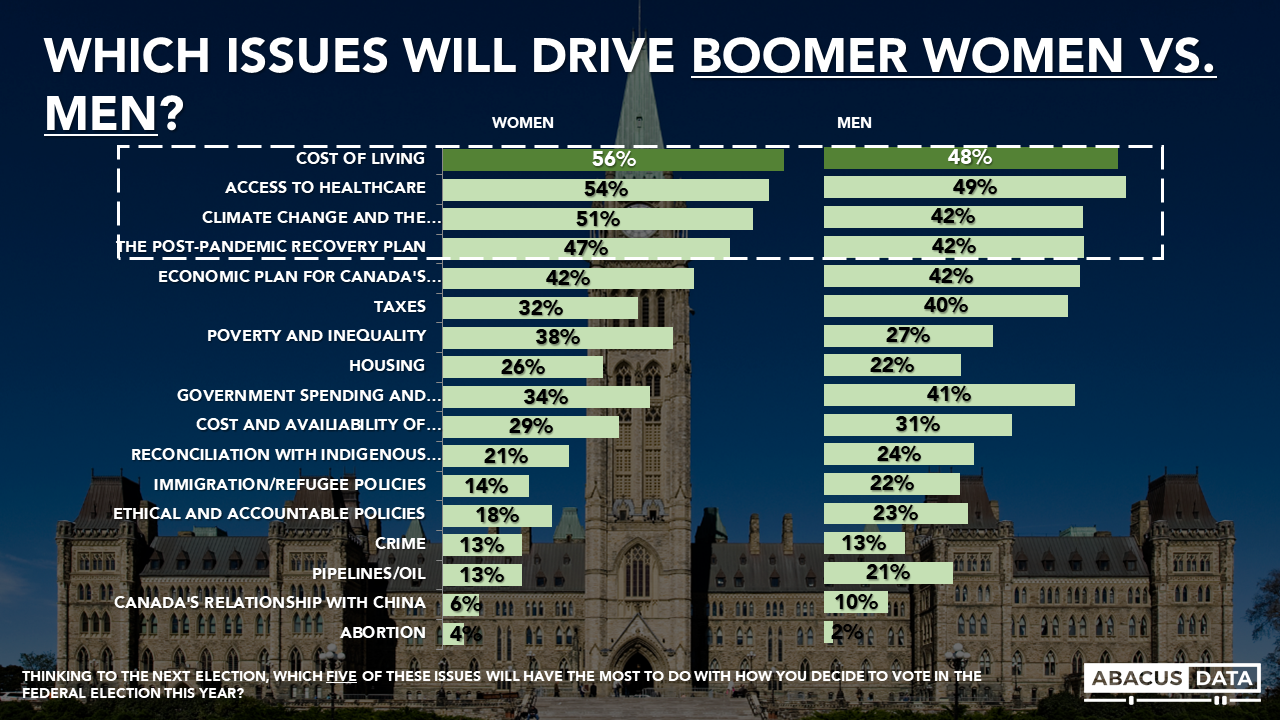
Among the boomer generation, men and women have the same top five issues, but for four of them, place very different levels of importance on each. Among the top 5 issues, boomer women are more likely to prioritize cost of living, access to healthcare, climate change & the environment and the post-pandemic recovery plan. While men are distributing their priorities a little more evenly throughout the list, and placing more priority on taxes, government spending and pipelines.
And for millennials? There are some differences between men and women for sure, but they are not as stark as those seen among boomers.
Among millennials, women are more likely than men to be prioritizing cost of living and access to healthcare, and men are more likely to prioritize an economic plan for Canada’s recovery, but that’s where the large differences end. It seems that among this generation specific age is a better determinant of issue prioritization than gender.
THE UPSHOT According to Oksana Kishchuk: Like much of our other analysis, cost of living continues its dominant position as the top election issue, including both men and women. Still, it’s important to note it is a priority for more women than men.
This difference, and many of the other differences we see between men and women are not surprising, and in fact look very similar to numbers we saw just before the federal election in 2019. During that election we also saw women prioritizing healthcare and climate change more than men, and men more likely to prioritize taxes and government spending.
Given that these priorities have held steadfast for many years, and even through a pandemic, it’s likely that they will more or less remain the same throughout the campaign. Knowing this, we will be watching closely to see how each of the parties try to sell their ideas, especially those that are more of a priority for one gender than another.
METHODOLOGY
The survey was conducted with 3,000 Canadian adults from August 6 to 11, 2021. A random sample of panelists were invited to complete the survey from a set of partner panels based on the Lucid exchange platform. These partners are typically double opt-in survey panels, blended to manage out potential skews in the data from a single source.
The margin of error for a comparable probability-based random sample of the same size is +/- 1.8%, 19 times out of 20.
The data were weighted according to census data to ensure that the sample matched Canada’s population according to age, gender, educational attainment, and region. Totals may not add up to 100 due to rounding.
We are the only research and strategy firm that helps organizations respond to the disruptive risks and opportunities in a world where demographics and technology are changing more quickly than ever.
We are an innovative, fast-growing public opinion and marketing research consultancy. We use the latest technology, sound science, and deep experience to generate top-flight research-based advice to our clients. We offer global research capacity with a strong focus on customer service, attention to detail and exceptional value.
We were one of the most accurate pollsters conducting research during the 2019 Canadian Election.
Each day during the 2021 Federal Election campaign, researchers at Abacus Data will share insights and analysis from our polling in concise, insights-focused reports. To never miss our polls and analysis, subscribe to our newsletter.
Prior to the pandemic, and even before, the political environment has been ripe for affordability to not only dominate a federal election, but drive sharp generational divides. As just one example, when baby boomers were young adults it took them an average of 5 years of full-time work to save for a 20% down payment, compared to today where it will take young adults 14 years of full-time work. As the election kicks off the data from our pre-election survey is no different.
To start, cost of living makes an appearance in almost every generations list of top five issues.
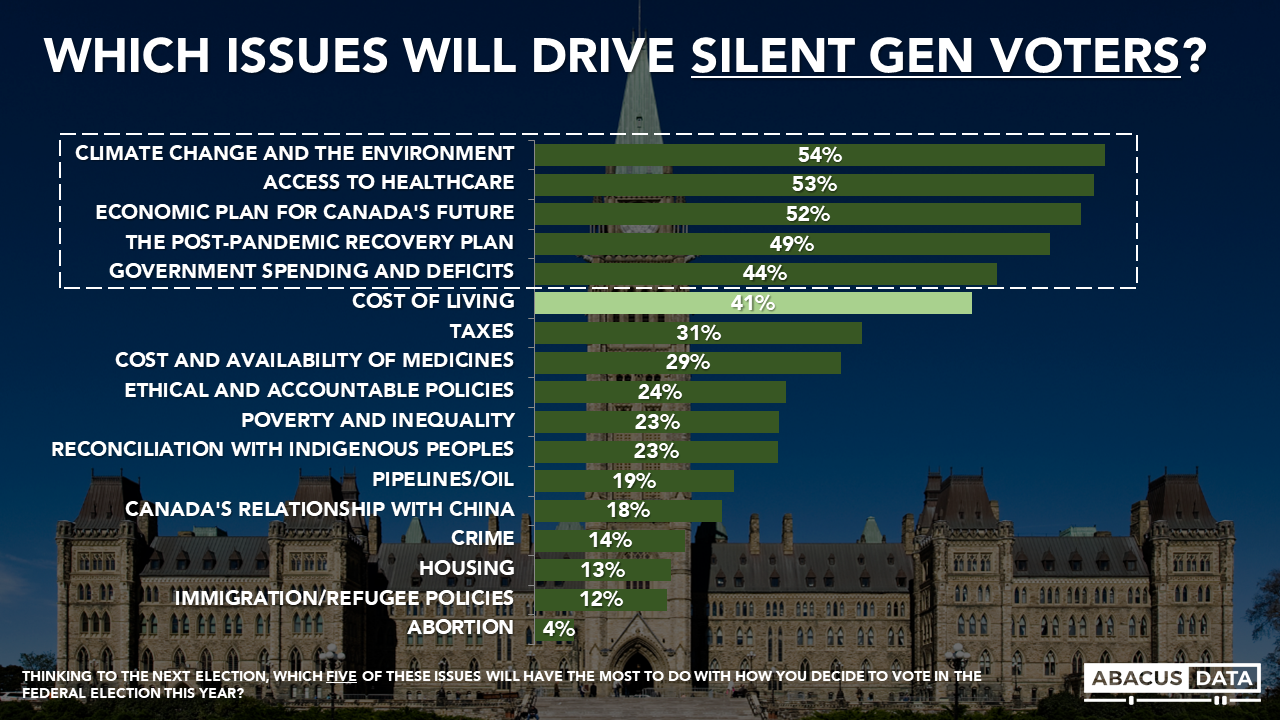
The silent generation is the only one to have cost of living fall below their top 5 issues. Those in this older generation are prioritizing issues like climate change, access to healthcare, and plans for the future. While no party seems to be catering to this generation specifically, the issues the parties have focused on so far are more or less the top issues for these individuals.
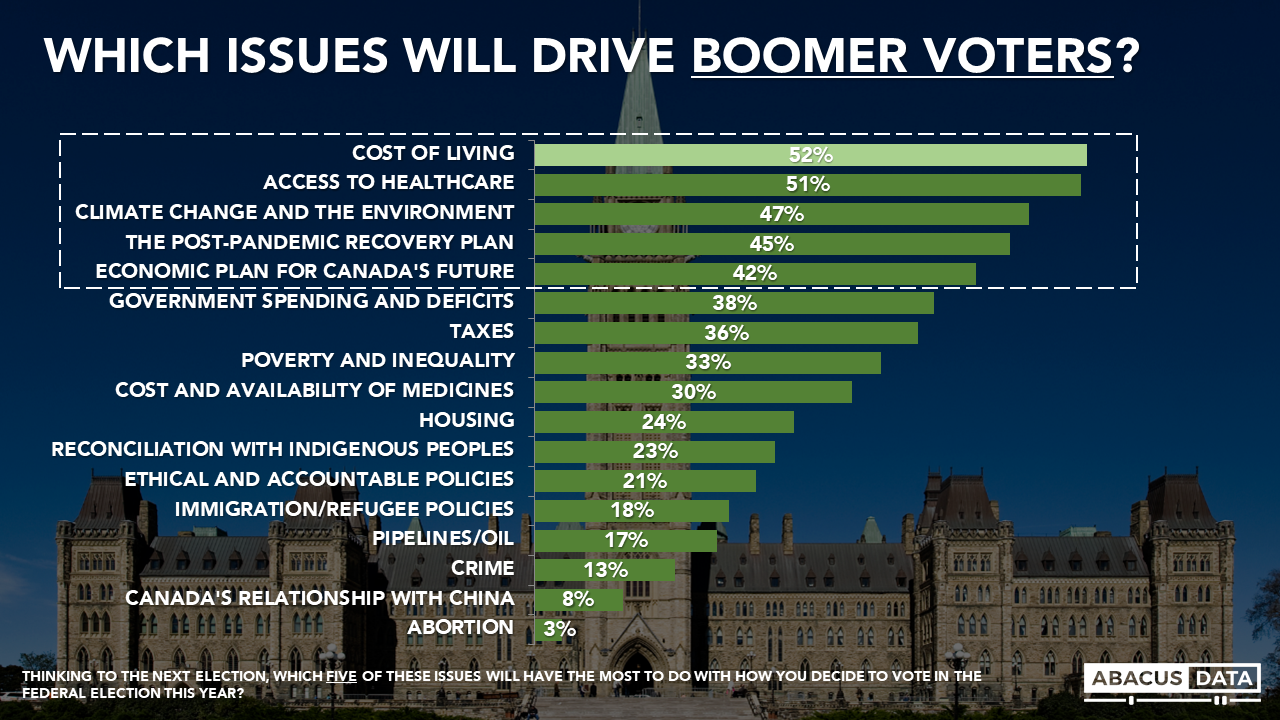
Next up is the baby boomer generation, the top issues look fairly similar though cost of living has been shuffled to the top of the list, and by a large margin.
For boomers, cost of living, healthcare, climate change and the environment, and recovery plans are in the top 5 issues. Percentages aside, their top 5 list mirrors that of the average Canadian.
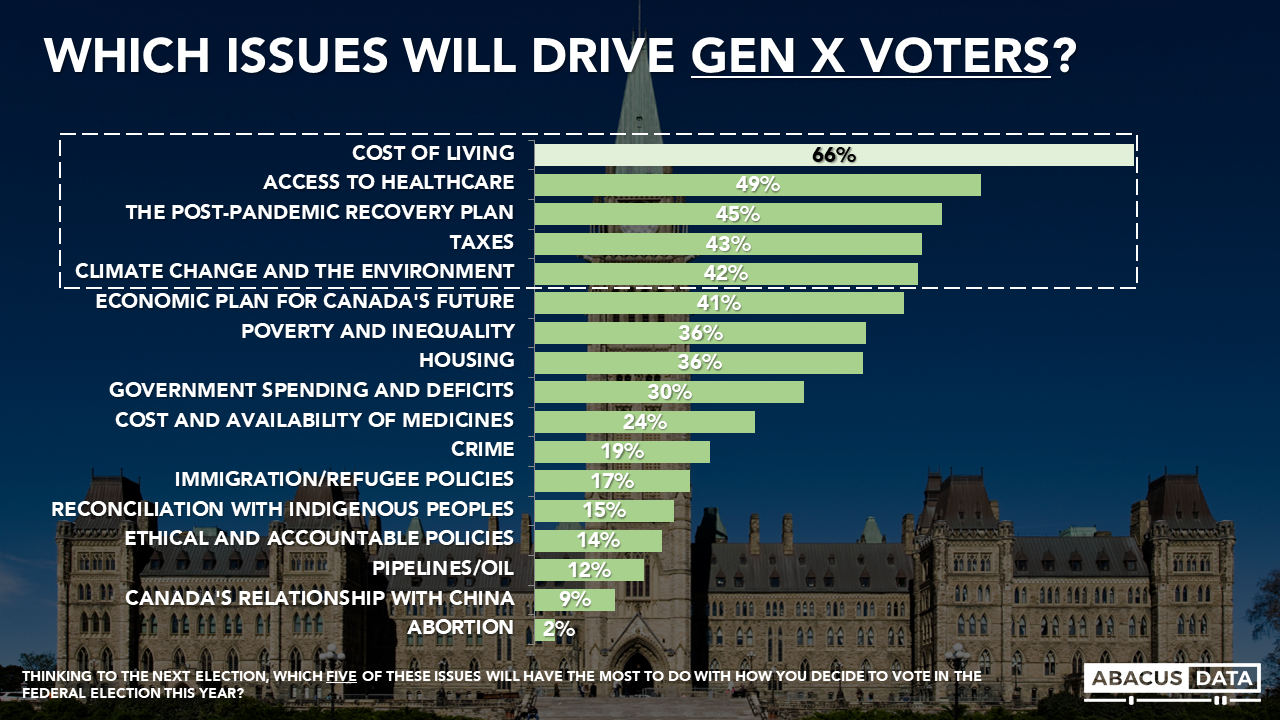
For Gen X voters, the list looks fairly similar, but cost of living continues to grow in importance.
Two thirds of Gen X voters place cost of living in their top 5 issues, and it has a sizable lead over any other issues in their top 5. Gen X (those 56 to 41 years old) likely have very different cost of living worries than millennials: think supporting children vs. purchasing a first home. Still, the importance of cost of living for this demographic is a reminder of how important cost of living is in this election.
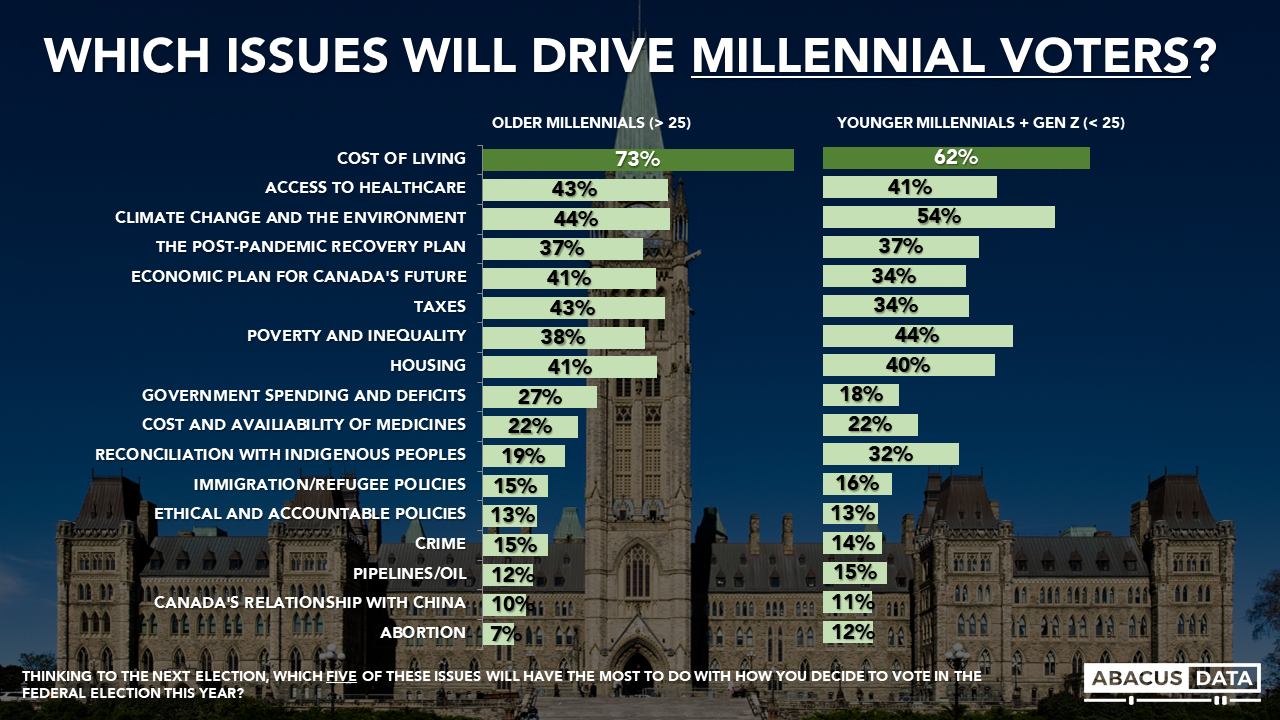
Finally, millennials. Cost of living tops their list, and by an even greater margin. Among this generation, there is a 25-point gap between cost of living and the second most important issue, suggesting this is both a very important issue for this generation, but also the uniting issue across the generation.
Millennials may be the largest voting bloc but they are also the generation that spans the widest array of life stages. Some millennials are nearing 40, onto their second homes, have kids that are nearly teenagers, and are carrying all the costs associated with all these life events. Others are unemployed new grads with student loans, staring down a volatile housing market, but currently have less financial pressures on them when it comes to their own expenses and perhaps more optimism about the future.
Looking at the data these priorities are reflected fairly well. Cost of living is still a top issue for both older and younger millennials (and Gen Z), but younger millennials and Gen Z are in fact placing more importance on the social issues we might expect younger people to be passionate about.
On social issues we see some pretty significant differences on climate change & the environment, poverty and inequality, and reconciliation with indigenous peoples (all are more important for younger millennials + Gen Z). And on the other end, older millennials are more concerned with taxes, and government spending.
Still, what unites this generation and sets it apart from others is cost of living. Millennials as a whole are almost entirely aligned with boomers on social issues like climate change & the environment and indigenous reconciliation, and even on housing (only 1 or 2 points different). But with cost of living, there is a 19-point gap between the percentage of boomers that placed this as a top 5 issue, and the percentage of millennials.
THE UPSHOT According to Oksana Kishchuk: The millennials that helped secure the Liberal win in 2015 have grown up. For older millennials they’ve had six more years to pay taxes, watch government spending and compare it to their own life expenses, and attempt to secure a starter home that will help catapult them through the housing market instead of set them back.
And for younger millennials (and Gen Z) they’ve evaluated progress on climate change commitments, read the news about unmarked graves from residential schools and seen inequality in Canada rise from pandemic impacts.
The Trudeau Liberals are once again attempting to capture these two sides of the young voter – trying to position themselves as the party fighting for the middle class to quell affordability concerns and the party fighting for social issues, namely climate change. But two weeks, never mind six years, can change things in politics.
Our latest numbers show the NDP, who are focusing heavily on the millennial vote by promising social policies to address affordability, have a slight lead over the Liberals among young voters.
And the Conservatives, despite low polling numbers among young voters, could capture these voters using their fiscal solutions for addressing affordability and cost of living.
As parties continue to roll out their messaging and platforms on Canadians top issues we will continue to monitor the moods of each generation, and how they feel throughout the campaign.
METHODOLOGY
The survey was conducted with 3,000 Canadian adults from August 6 to 11, 2021. A random sample of panelists were invited to complete the survey from a set of partner panels based on the Lucid exchange platform. These partners are typically double opt-in survey panels, blended to manage out potential skews in the data from a single source.
The margin of error for a comparable probability-based random sample of the same size is +/- 1.8%, 19 times out of 20.
The data were weighted according to census data to ensure that the sample matched Canada’s population according to age, gender, educational attainment, and region. Totals may not add up to 100 due to rounding.
We are the only research and strategy firm that helps organizations respond to the disruptive risks and opportunities in a world where demographics and technology are changing more quickly than ever.
We are an innovative, fast-growing public opinion and marketing research consultancy. We use the latest technology, sound science, and deep experience to generate top-flight research-based advice to our clients. We offer global research capacity with a strong focus on customer service, attention to detail and exceptional value.
We were one of the most accurate pollsters conducting research during the 2019 Canadian Election.
Each day during the 2021 Federal Election campaign, researchers at Abacus Data will share insights and analysis from our polling in concise, insights-focused reports. To never miss our polls and analysis, subscribe to our newsletter.
This election season comes at a critical moment for Canadians. As we continue the fight against COVID-19, we’ve seen Indigenous peoples from across the nation call for accountability in the wake of mass gravesite discoveries, countless Black Canadians take to the streets in protest of police brutality, and many conversations and conflicts regarding the national housing crisis. As people across the nation fight for a better Canada, this election provides an opportunity to make meaningful change for all – Including LGBTQ2S+ communities.
LGBTQ2S+ communities across Canada have a unique outlook on our nation and politics. Having experienced a different life than many other Canadians, LGBTQ2S+ communities across the nation have struggled and persevered in ways others might not have had to. Similarly, the LGBTQ2S+ community and its allies hold a truly unique perspective when it comes to voting in federal elections.
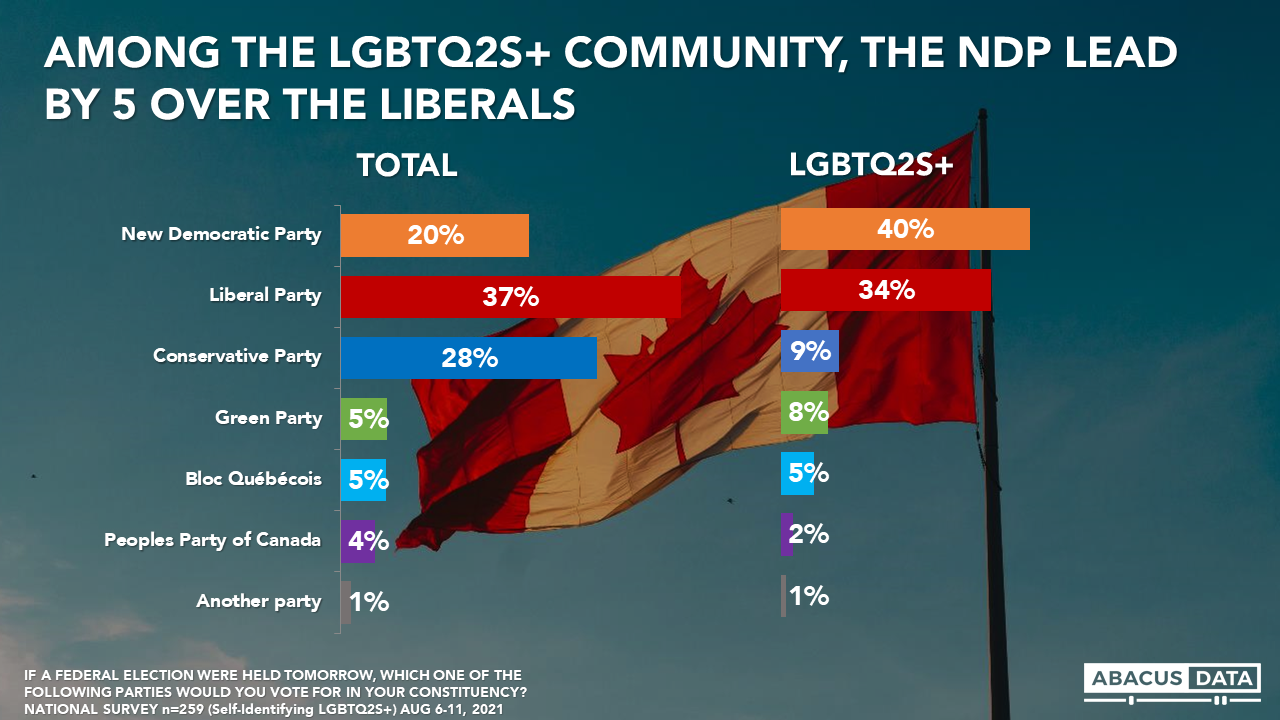
In our pre-election survey (conducted August 6 to 11 with 3,000 Canadians overall, 259 of which self-identified as LGBTQ2S+), we find that among the LGBTQ2S+ community, the NDP lead by 5-points over the Liberals. The LGBTQ2S+ community is twice as likely to vote for the NDP, and half as likely to vote for the Conservatives than the general population. Interestingly, the Liberal vote remains consistent between Canadians overall and the LGBTQ2S+ community. It is important to note that this sample is much younger than the general population, which most likely explains their views on the NDP and Jagmeet Singh.
[sc name=”signup”]
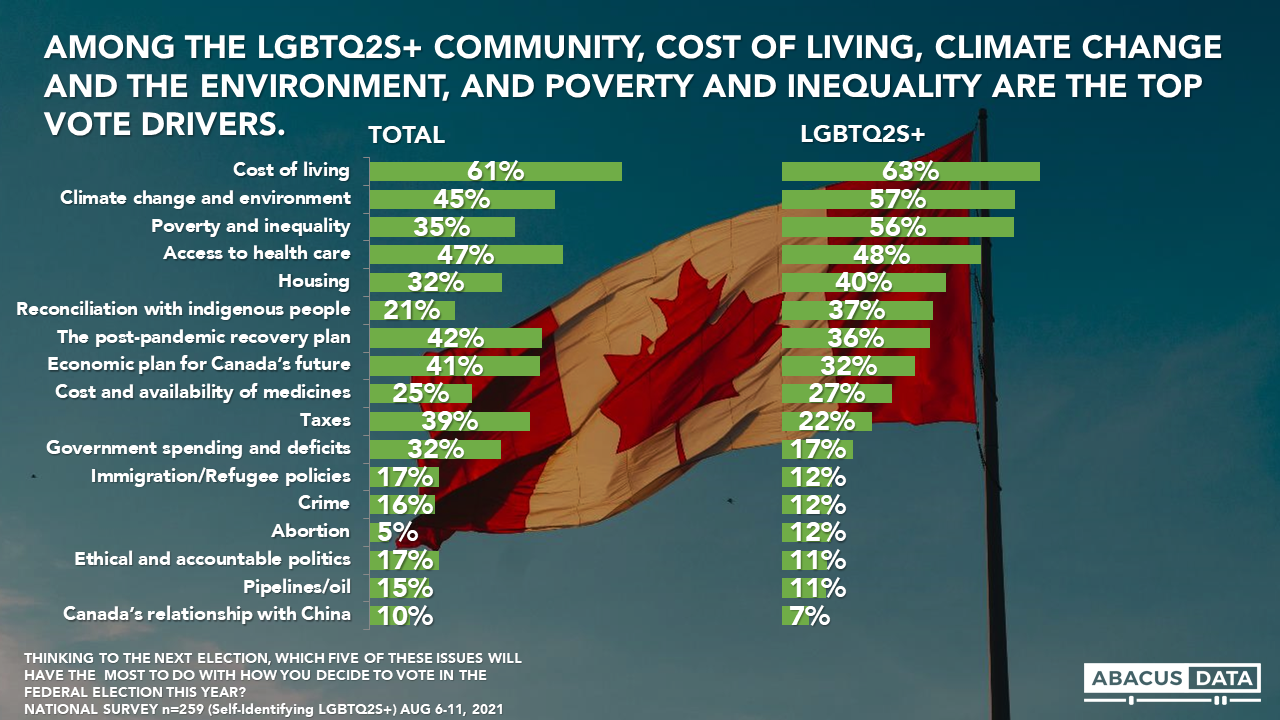
Vote drivers differ slightly among the LGBTQ2S+ community when compared to the general population. Cost of living (63%), climate change and the environment(57%), and poverty and inequality (56%) are the top vote drivers for LGBTQ2S+ Canadians. Among the general population, cost of living (61%), Access to health care (47%), and climate change and the environment (45%) top the list of vote drivers. Interestingly, taxes and government spending were significantly lower drivers for those in the LGBTQ2S+ community on average.
LEADER IMPRESSIONS
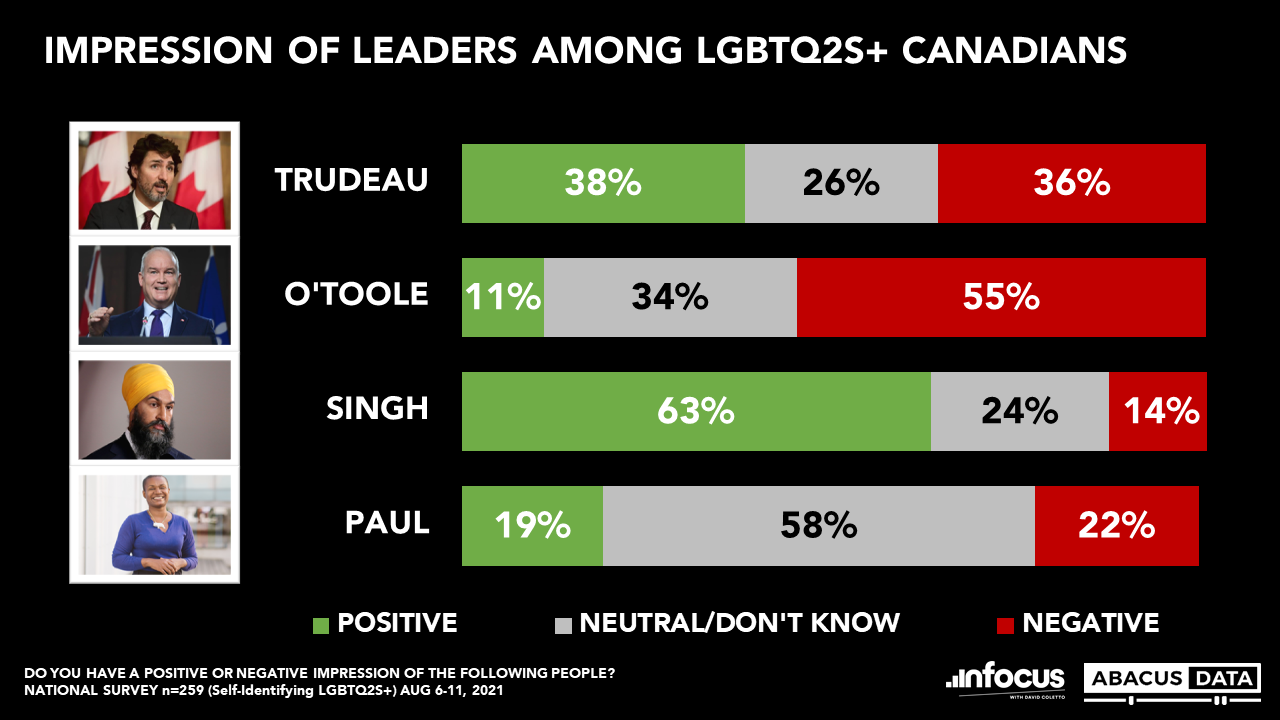
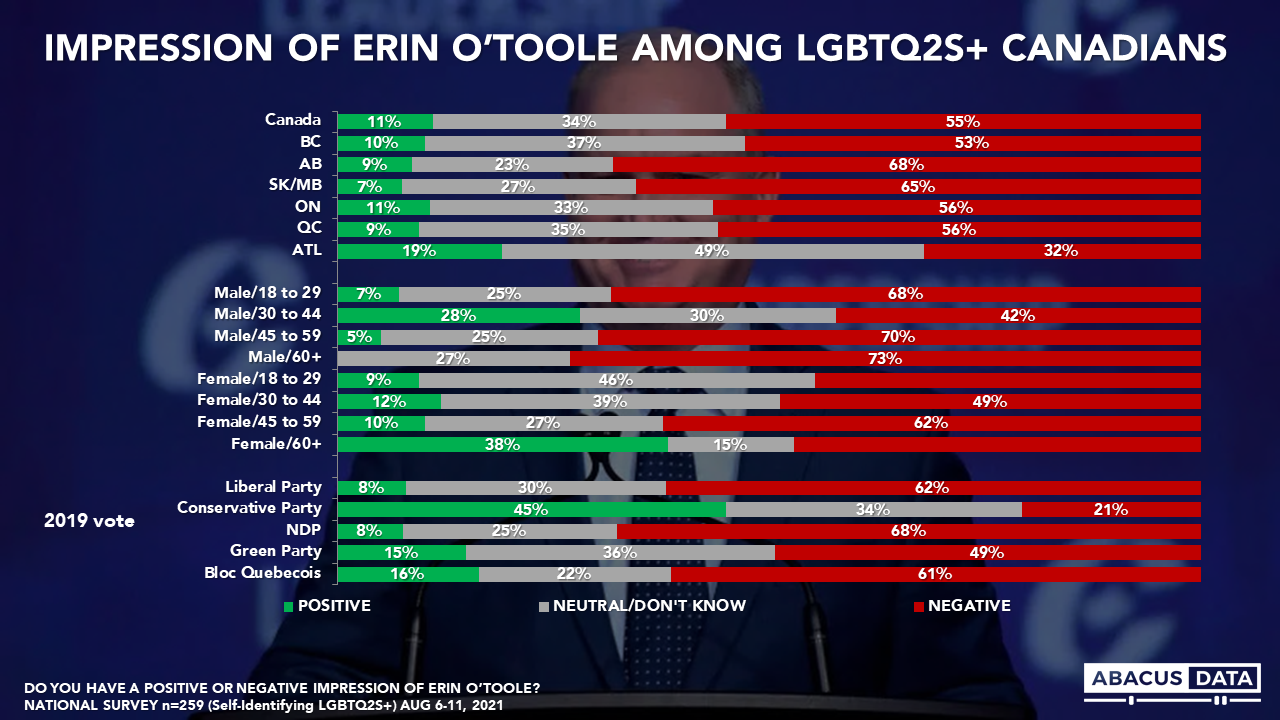
It is also the case that LGBTQ2S+ communities across Canada have a unique perception of their political leaders. Among these communities, Singh is a stand-out favourite, with 63% holding a positive impression of him. This is followed by Trudeau (38%), Paul (19%), and O’Toole (11%) respectively.
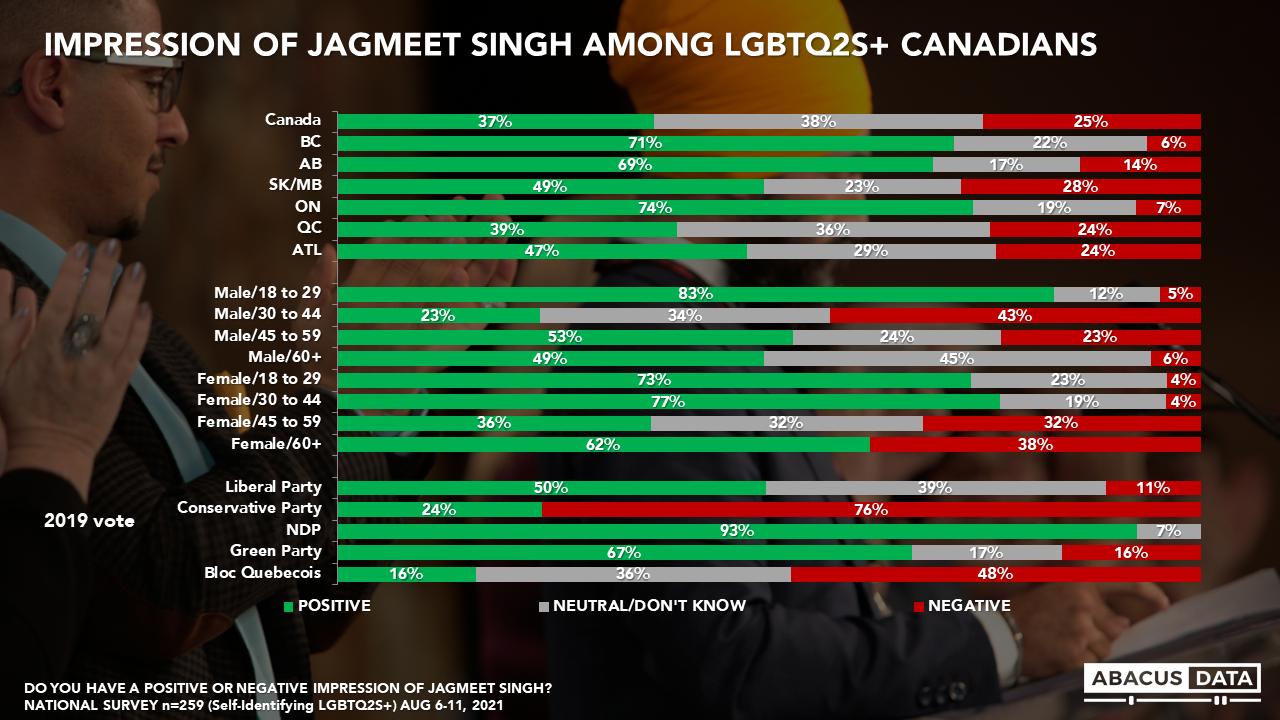
Among all the leaders, Jagmeet Singh has the highest net positive impression at +49. Positive impressions are highest among previous NDP voters, Males aged 18-29, Females aged 30-44, and those living in Ontario.
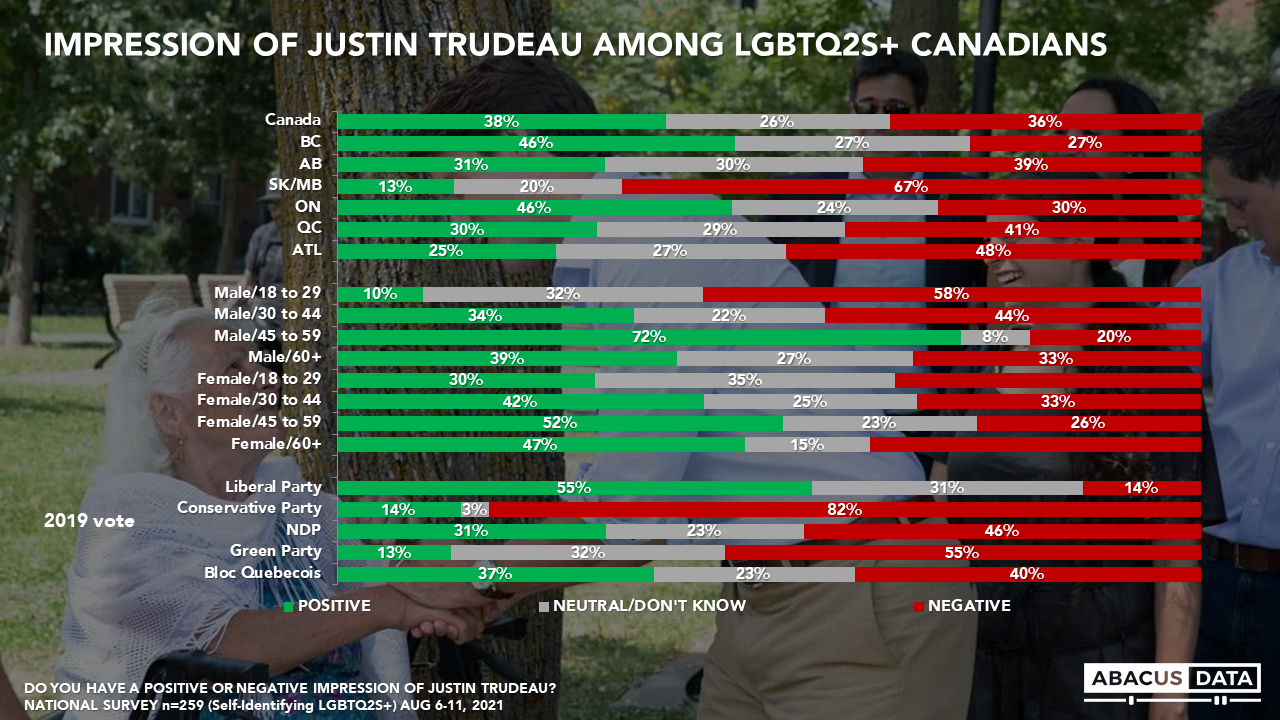
Justin Trudeau enjoys a positive impression among 38% and negative impressions among 36%, for a net score of +2. Positive impressions are significantly higher among males aged 30-44.
Erin O’Toole enjoys a positive impression among 11% and negative impressions among 55%, for a net score of -44. Females aged 60+, Males aged 30-44, and those living in Atlantic Canada are among the most likely to hold a positive impression of O’Toole.
UPSHOT
Although the Liberals have been leading the polls recently, vote intention and the impressions of political leaders among the LGBTQ2S+ community we surveyed paint a different picture.
Jagmeet Singh and the NDP have clearly built a strong affinity among the LGBTQ2S+ community while the Conservatives struggle to even register with this community.
With an estimated 900,000 LGBTQ2S+ Canadians and countless allies across the nation, will this be enough to sway the vote?
METHODOLOGY
The survey was conducted with 3,000 Canadian adults from August 6 to 11, 2021. A total of A random sample of panelists were invited to complete the survey from a set of partner panels based on the Lucid exchange platform. These partners are typically double opt-in survey panels, blended to manage out potential skews in the data from a single source.
The margin of error for a comparable probability-based random sample of the same size is +/- 1.8%, 19 times out of 20.
The data were weighted according to census data to ensure that the sample matched Canada’s population according to age, gender, educational attainment, and region. Totals may not add up to 100 due to rounding.
[sc name=”signup”]
ABOUT ABACUS DATA
We are the only research and strategy firm that helps organizations respond to the disruptive risks and opportunities in a world where demographics and technology are changing more quickly than ever.
We are an innovative, fast-growing public opinion and marketing research consultancy. We use the latest technology, sound science, and deep experience to generate top-flight research-based advice to our clients. We offer global research capacity with a strong focus on customer service, attention to detail and exceptional value.
We were one of the most accurate pollsters conducting research during the 2019 Canadian Election.
We just completed a national survey of 1,500 Canadian adults (August 12 to 16) with about 30% of the interviews done after the election announcement on Sunday.
Here’s what we are seeing:
MOOD OF THE COUNTRY
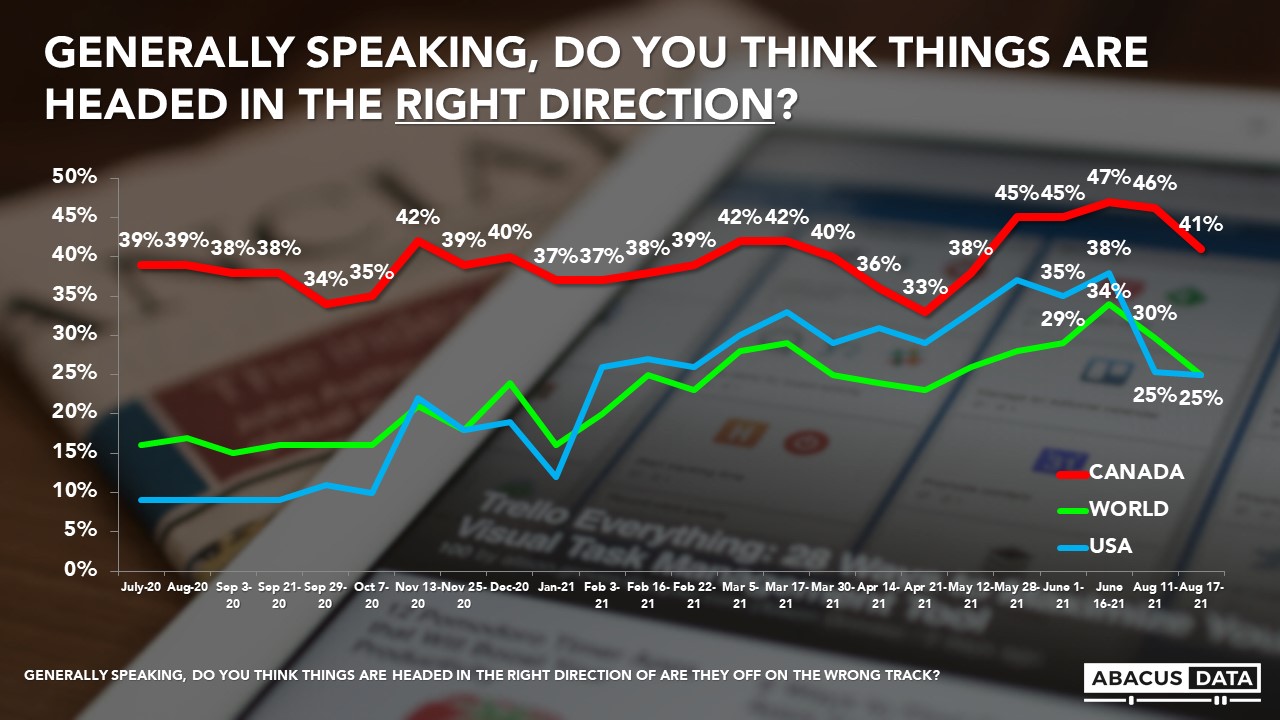
There’s been a five-point drop in the number of Canadians feeling the country is headed in the right direction, as the number of COVID cases rise over the last week. Now, 41% feel the country is headed in the right direction while 42% feel it’s off on the wrong track.
Views about the direction of the US and the world also have become more negative since last week as events in Afghanistan and the 4th wave in the US dominate news coverage.
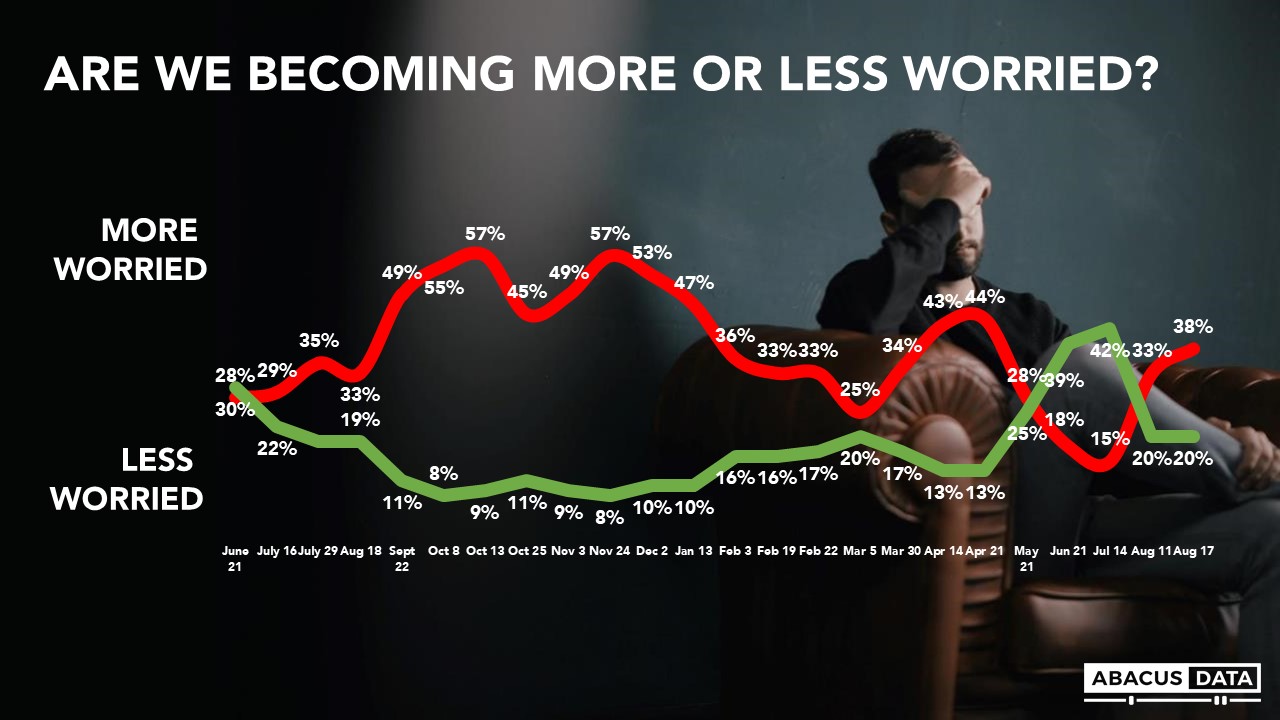
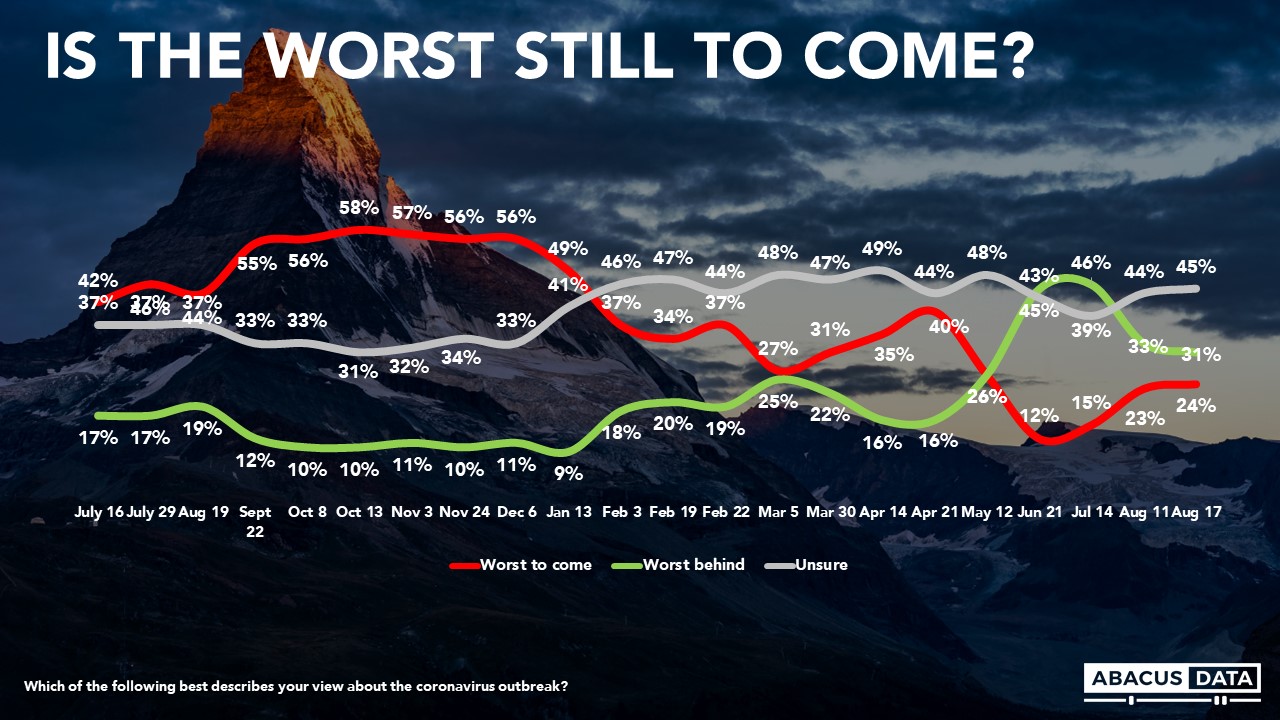
FEELINGS ABOUT THE PANDEMIC
This downward shift in mood is likely attributable to growing concerns about the COVID-19 pandemic. When asked whether they are getting more or less worried about the pandemic over the past few days, 38% say they are getting more worried – up 5-points in a week, and 23-points in a month. Today, 24% believe the worst of the pandemic is still to come (a 9-point increase in a month).
GOVERNMENT APPROVAL
Today 44% approve of the job being done by the Trudeau government, while 41% disapprove – a 4-point increase in those disapproving over the past week.
LEADER IMPRESSIONS
Justin Trudeau enjoys a positive impression among 40% and negative impressions among 44%, for a net score of -3. Negative impressions of Mr. Trudeau are up 3-points since last week.
Jagmeet Singh enjoys a positive impression among 39% and finds negative impressions among 24% for a net +15. Impressions of Mr. Singh are largely unchanged from last week.
Erin O’Toole enjoys a positive impression among 20% and finds negative impressions among 41%, for a net score of -21. Impressions of Mr. O’Toole are also largely unchanged from last week.
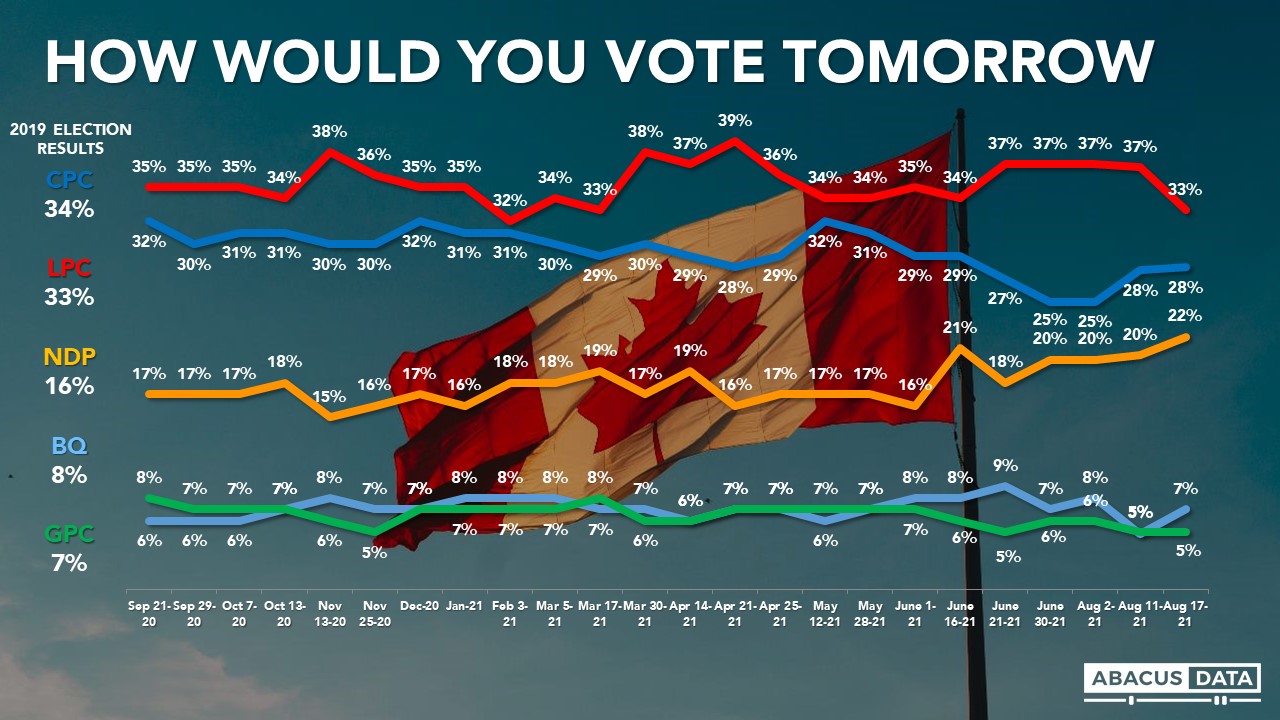
HOW DOES THIS TRANSLATE INTO VOTE INTENTION?
If an election were held now, the Liberals would win 33% of the vote (down 4 from our last measurement point), the Conservatives 28% (unchanged), the NDP 22% (up 2), the Green Party 5% (unchanged) and the BQ at 31% in Quebec (9-points higher than in our last survey).
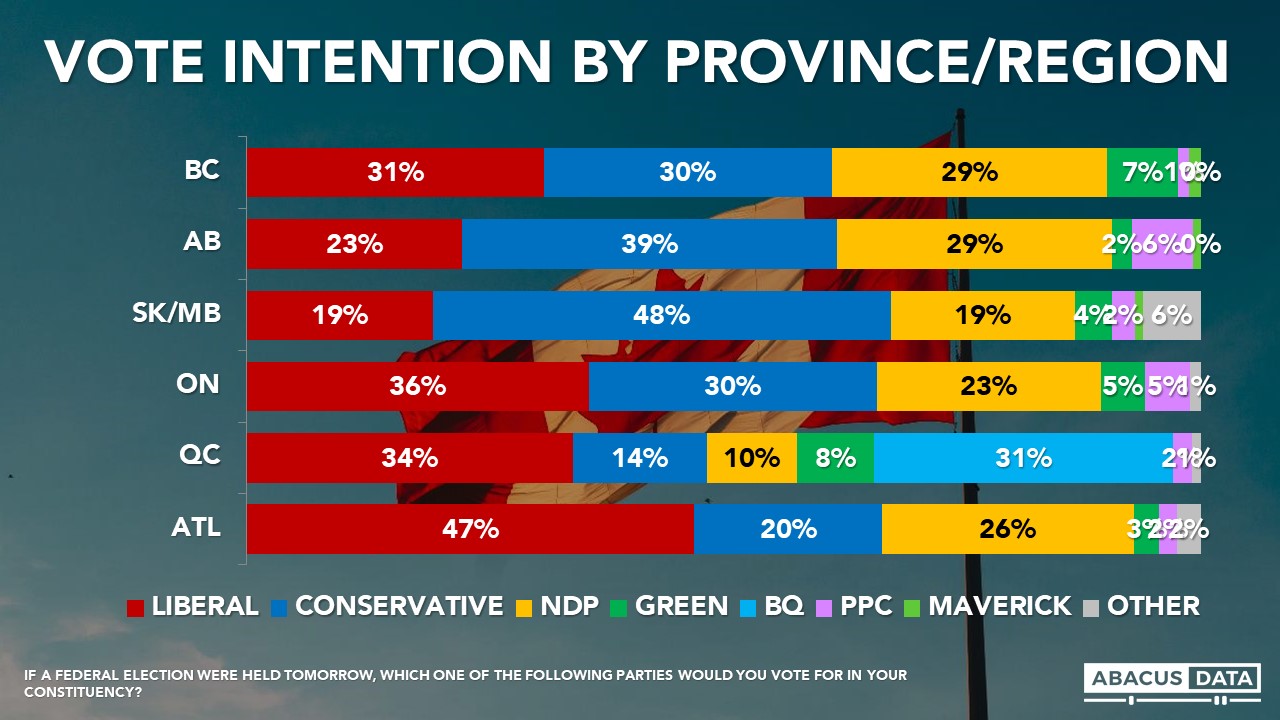
• In BC, we find a three-way race with the Liberals at 31%, the Conservatives at 30%, and the NDP at 29%. The Greens are at 7%.
• In Alberta, 39% would vote Conservative compared with 29% for the NDP and 23% for the Liberals, and 6% for the People’s Party.
• In Manitoba and Saskatchewan, the Conservatives lead the Liberals and NDP by almost 30 points, 48% to 19% and 19%.
• The Liberals (with 36%) have a 6-point lead over the Conservatives (30%) in Ontario, with the NDP at 24% and the Green Party at 5%. The People’s Party is at 5% in Ontario.
• In Quebec, we see the Liberals with 34%, followed by the BQ (31%), the Conservatives (14%) and the NDP at 10%. The Greens are at 8% in Quebec.
• In the Atlantic provinces, the Liberals (47%) are well ahead of the NDP (26%) and the Conservatives (20%).
We are also testing levels of motivation, by asking people how likely they are to turn out and cast a ballot on election day. Among the 70% of respondents who said they would definitely be voting, the Liberals lead by a 3-point margin: 33% Liberal, 30% Conservative, 21% NDP, 8% BQ and 4% Green. 3% would vote for the People’s Party.
UPSHOT
According to Bruce Anderson: “We’ll evaluate events on a continuous basis during this sprint to Election Day. At this point, I’m hesitant to conclude anything about a shift in mood, we’re in the middle of summer, engagement levels are uncertain, and parties and leaders have only begun to make their pitches. I’ll continue to watch for the same things – will Jagmeet Singh be able to turn interest in him into capturing Liberal votes in key battleground regions, will Erin O’Toole be able to overcome hesitancy about his party and himself personally and will Justin Trudeau make a persuasive and galvanizing case for the policy choices he’s advocating especially around vaccines and affordable child care.
According to David Coletto: “Within a few weeks, a 12-point Liberal lead has shrunk to a 5-point lead as the race in Ontario and BC has tightened. The NDP has gained a few points while the Conservatives remain stuck just below 30%.
Given that only a portion of this survey was done after the election call, it’s too early to say whether the opposition parties’ criticism of the early election call is having much impact, but there’s some indication that the rise of COVID-19 cases is increasing anxiety and the mood of the public seems to be shifting.
This shift may ultimately play to the Liberal Party’s advantage as previous research has found most think the government has handled the pandemic well and support for vaccine mandates is strong across the country. It might expose it to concerns about holding an election during the 4th wave of the pandemic.”
METHODOLOGY
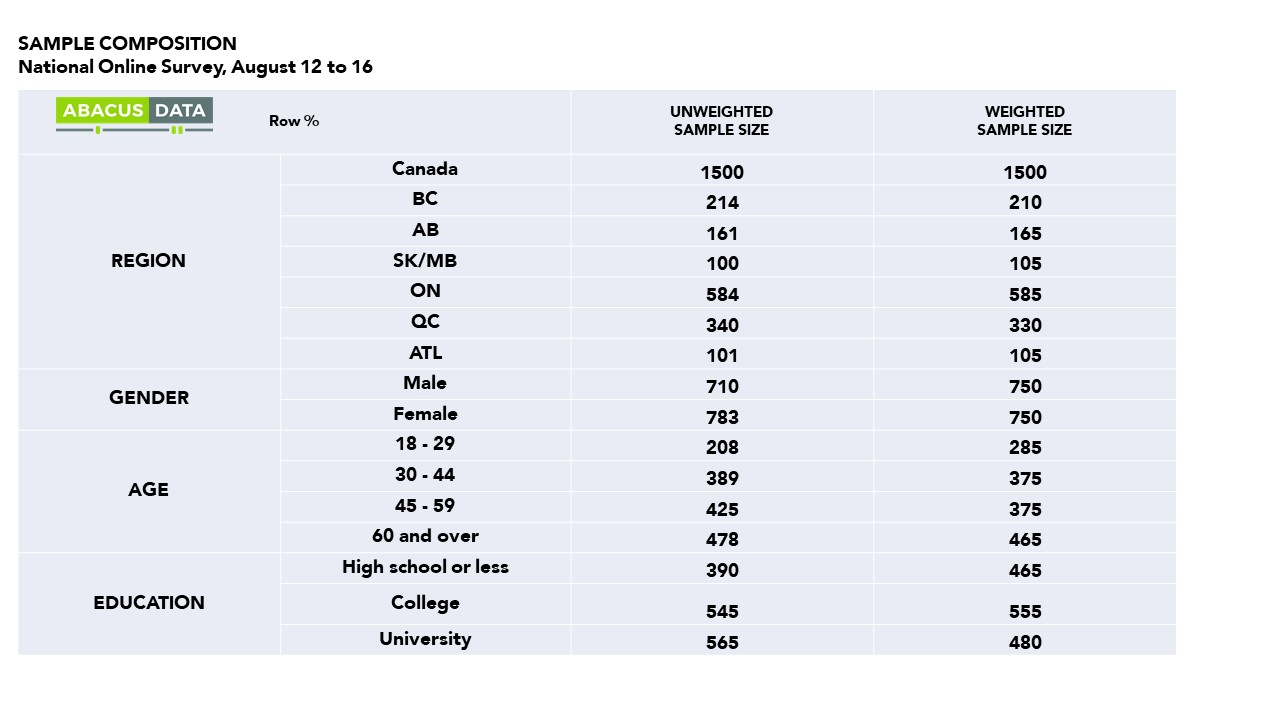
The survey was conducted with 1,500 Canadian adults from August 12 to 16, 2021. A random sample of panelists were invited to complete the survey from a set of partner panels based on the Lucid exchange platform. These partners are typically double opt-in survey panels, blended to manage out potential skews in the data from a single source.
The margin of error for a comparable probability-based random sample of the same size is +/- 2.6%, 19 times out of 20.
The data were weighted according to census data to ensure that the sample matched Canada’s population according to age, gender, educational attainment, and region. Totals may not add up to 100 due to rounding.
The survey was commissioned and paid for by Abacus Data Inc.
We are the only research and strategy firm that helps organizations respond to the disruptive risks and opportunities in a world where demographics and technology are changing more quickly than ever.
We are an innovative, fast-growing public opinion and marketing research consultancy. We use the latest technology, sound science, and deep experience to generate top-flight research-based advice to our clients. We offer global research capacity with a strong focus on customer service, attention to detail and exceptional value.
We were one of the most accurate pollsters conducting research during the 2019 Canadian Election.
Each day during the 2021 Federal Election campaign, researchers at Abacus Data will share insights and analysis from our polling in concise, insights-focused reports. To never miss our polls and analysis, subscribe to our newsletter.
Although many Canadians say they are financially better off or have not been impacted by the pandemic, the cost of living is clearly the top issue for most people as this election campaign kicks off.
Last week we released some new data with the Broadbent Institute and the Professional Institute of the Public Service of Canada about the role affordability, tax fairness, and paying for the pandemic may have in the campaign.
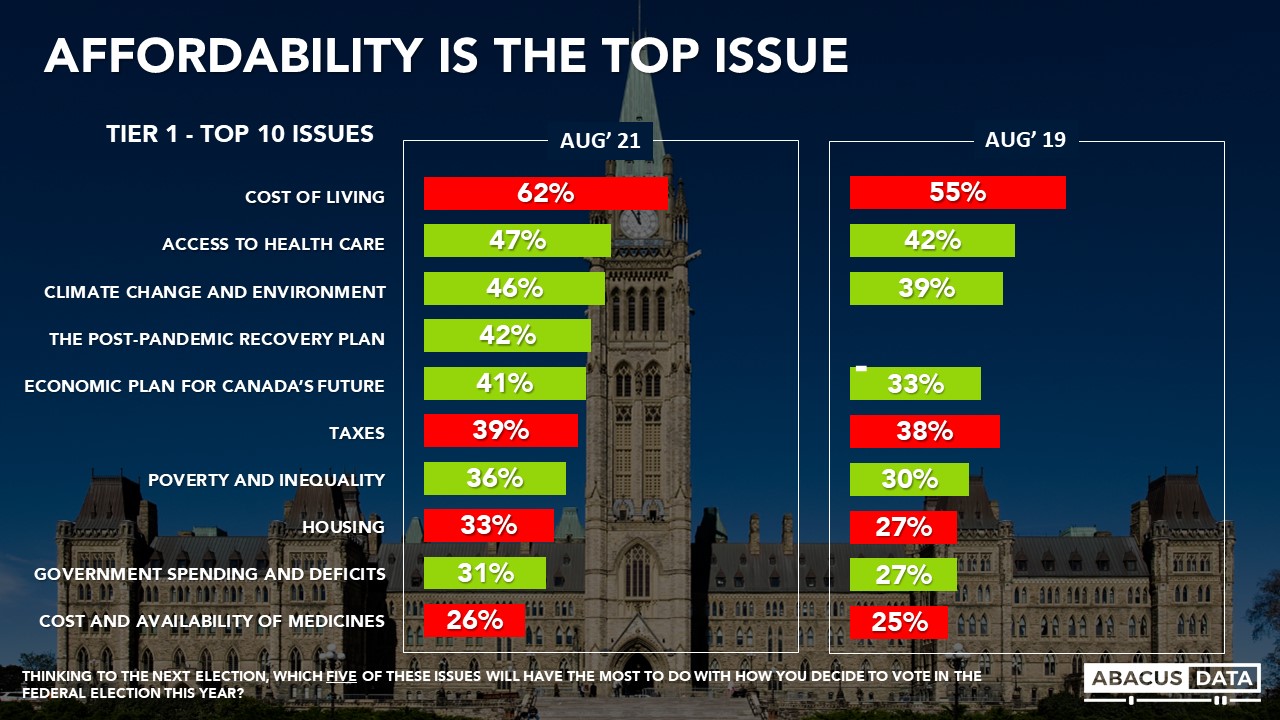
In our own pre-election survey, we find that 62% of respondents ranked the cost of living as one of the top 5 issues that will drive their vote this election. This is higher than any other issue and has increased by 7-points since this point of the 2019 federal election campaign.
But the cost of living isn’t the only “affordability” issue respondents rank high. We also see taxes, housing, and the cost of prescription drugs as being important to at least 1 in 4 eligible voters.
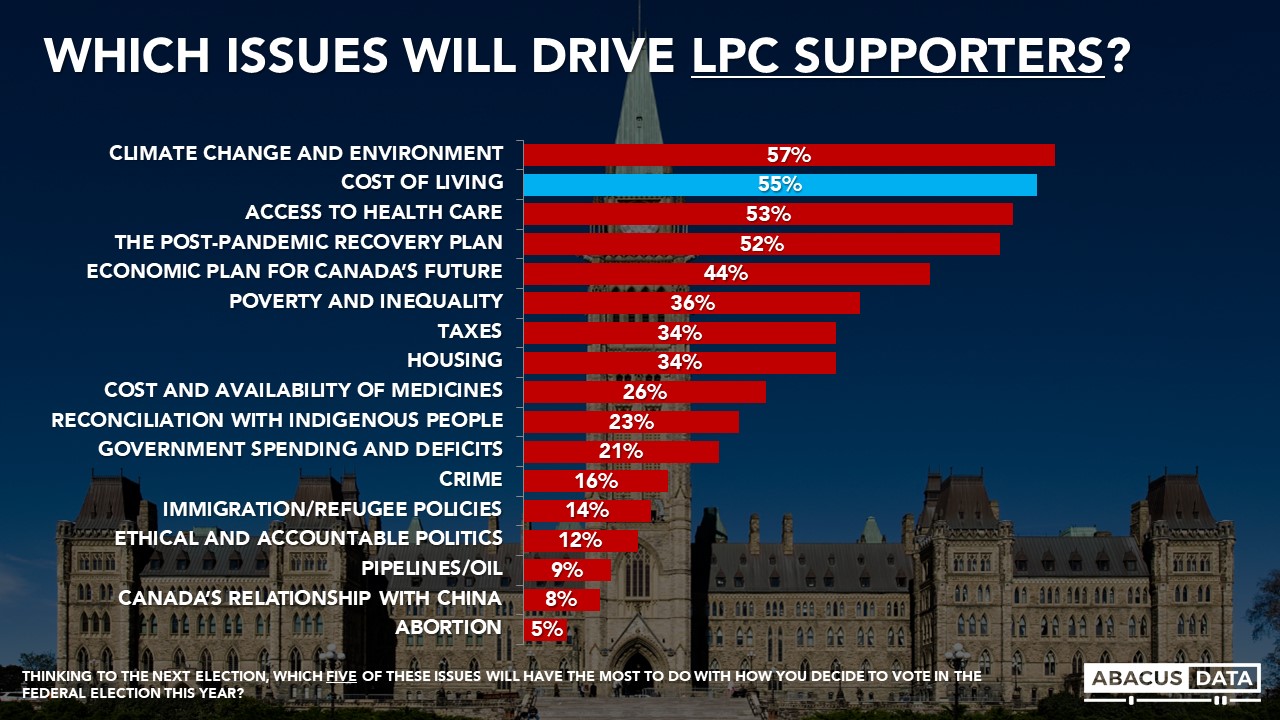
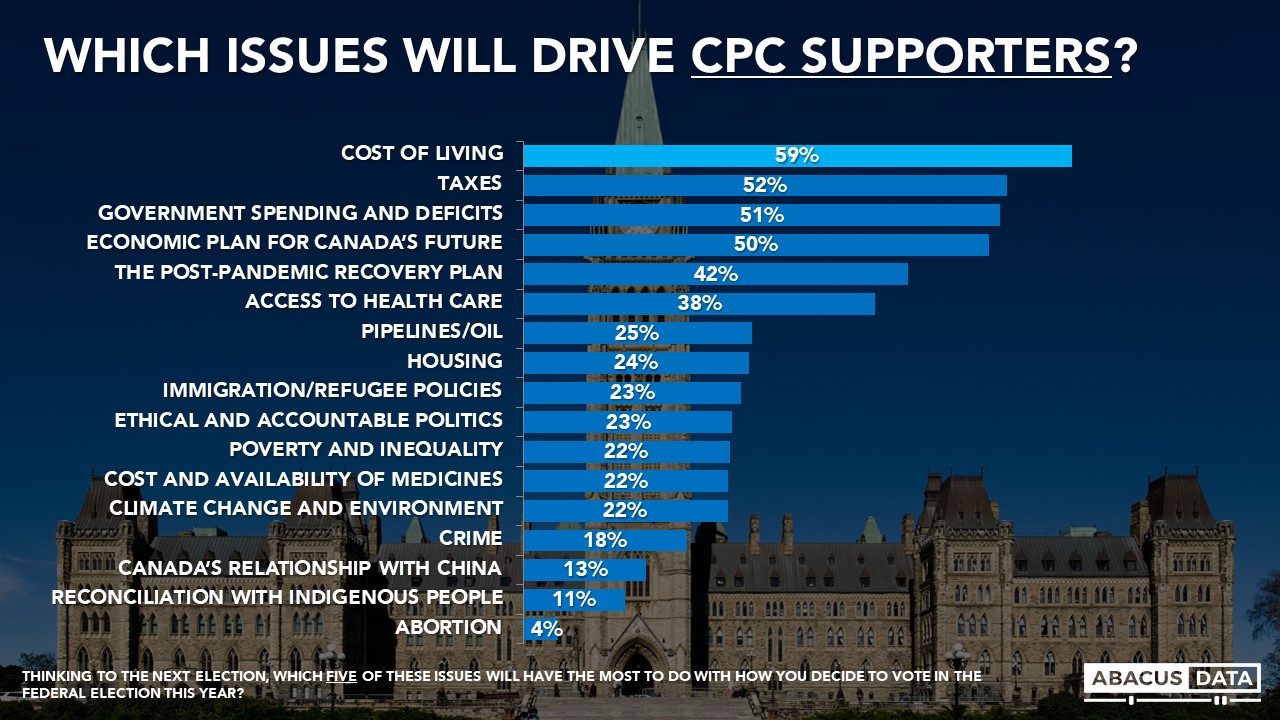
And the power of affordability as an issue is that it crosses the political spectrum. It is the top issue for Conservative and NDP voters and the second-highest among Liberal voters (climate change is the top issue for Liberals – more to come on that later this week).
Political leaders and candidates can expect to be asked their plans on the cost of living as household budgets get squeezed and perceptions of this problem increase. In this environment, there’s absolutely no appetite for tax increases (except on the wealthiest Canadians).
For businesses and associations that represent them, there will be pressure on policymakers to ease this pressure and as we have found in the past, there’s broad support for policy tools that force companies to lower their prices.
The 2019 campaign started as the affordability election. Will the 2021 one repeat that?
METHODOLOGY
The survey was conducted with 3,000 Canadian adults from August 6 to 11, 2021. A random sample of panelists were invited to complete the survey from a set of partner panels based on the Lucid exchange platform. These partners are typically double opt-in survey panels, blended to manage out potential skews in the data from a single source.
The margin of error for a comparable probability-based random sample of the same size is +/- 1.8%, 19 times out of 20.
The data were weighted according to census data to ensure that the sample matched Canada’s population according to age, gender, educational attainment, and region. Totals may not add up to 100 due to rounding.
ABOUT ABACUS DATA
We are the only research and strategy firm that helps organizations respond to the disruptive risks and opportunities in a world where demographics and technology are changing more quickly than ever.
We are an innovative, fast-growing public opinion and marketing research consultancy. We use the latest technology, sound science, and deep experience to generate top-flight research-based advice to our clients. We offer global research capacity with a strong focus on customer service, attention to detail and exceptional value.
We were one of the most accurate pollsters conducting research during the 2019 Canadian Election.