Conservatives lead as 2015 Liberal coalition splinters
May 7, 2019
Last week, we completed a nationally representative survey of 4,015 Canadians and explored their views on Canadian politics to update our regularly tracking.
Here is what we found:
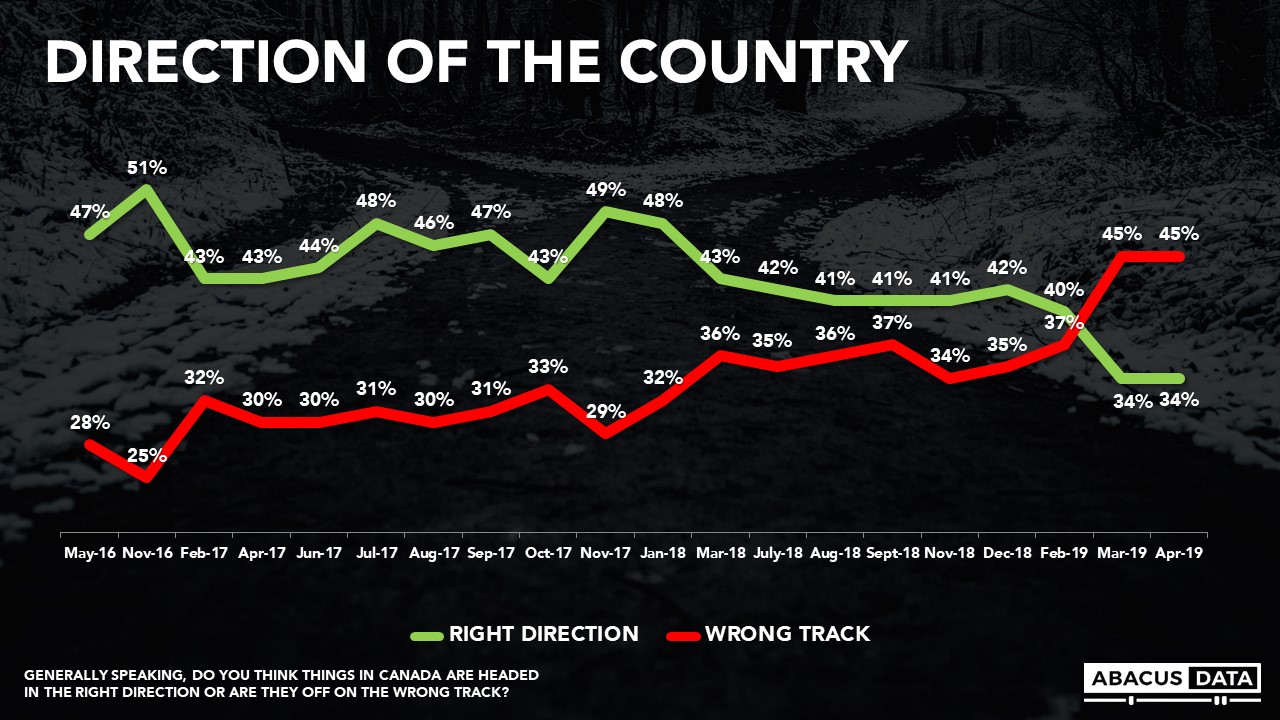
MOOD OF THE COUNTRY
One in three Canadians feels that the country is heading in the right direction while 45% who say it is on the wrong track, unchanged from March but a big downward shift from December.
Across the country, Quebecers are the most positive (43% right direction) while Albertans remain the most unhappy (20% right direction). But probably the most revealing finding under the surface of this trend, is the fact that barely half (51%) of those who say they voted Liberal in 2015 feel the country is headed in the right direction, 30% think it’s off on the right track while 19% are unsure.
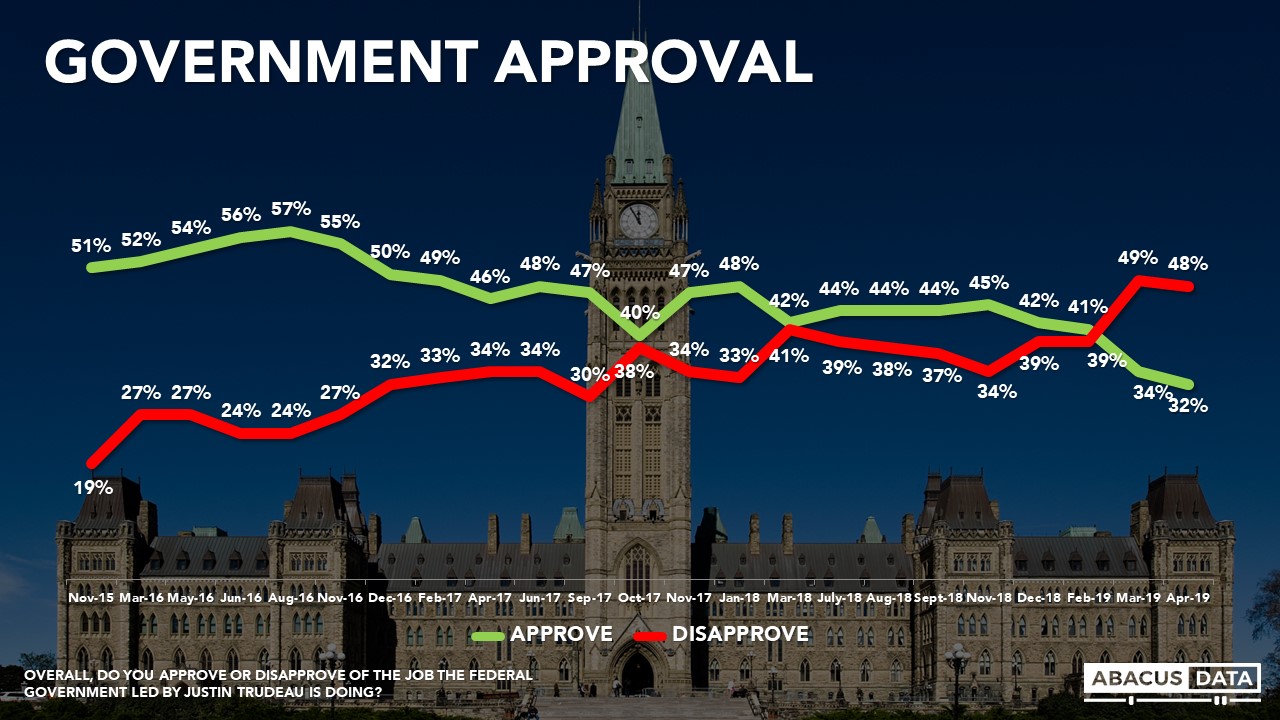
FEDERAL GOVERNMENT APPROVAL
Similarly, views of the federal government’s performance hit a new low in our latest survey. Today, 32% approve of the job the federal government is doing. For most of 2018 approval ranged between 42% and 45%.
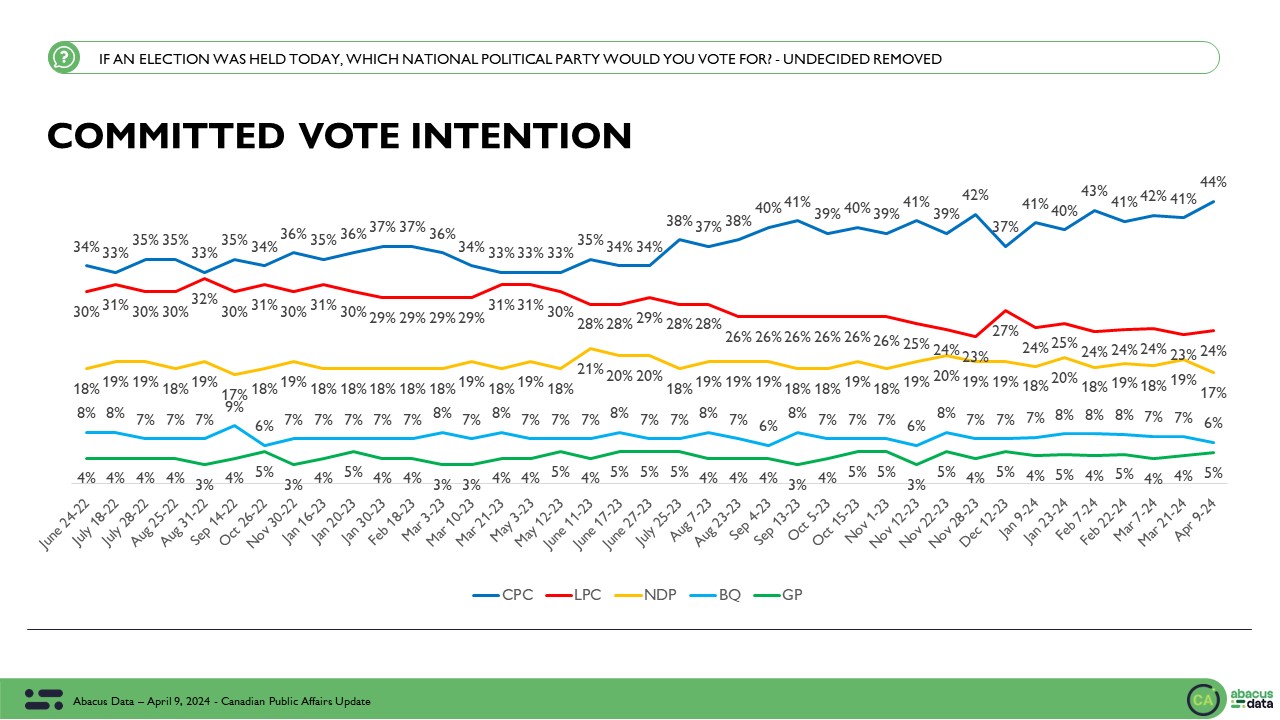
CURRENT VOTING INTENTION
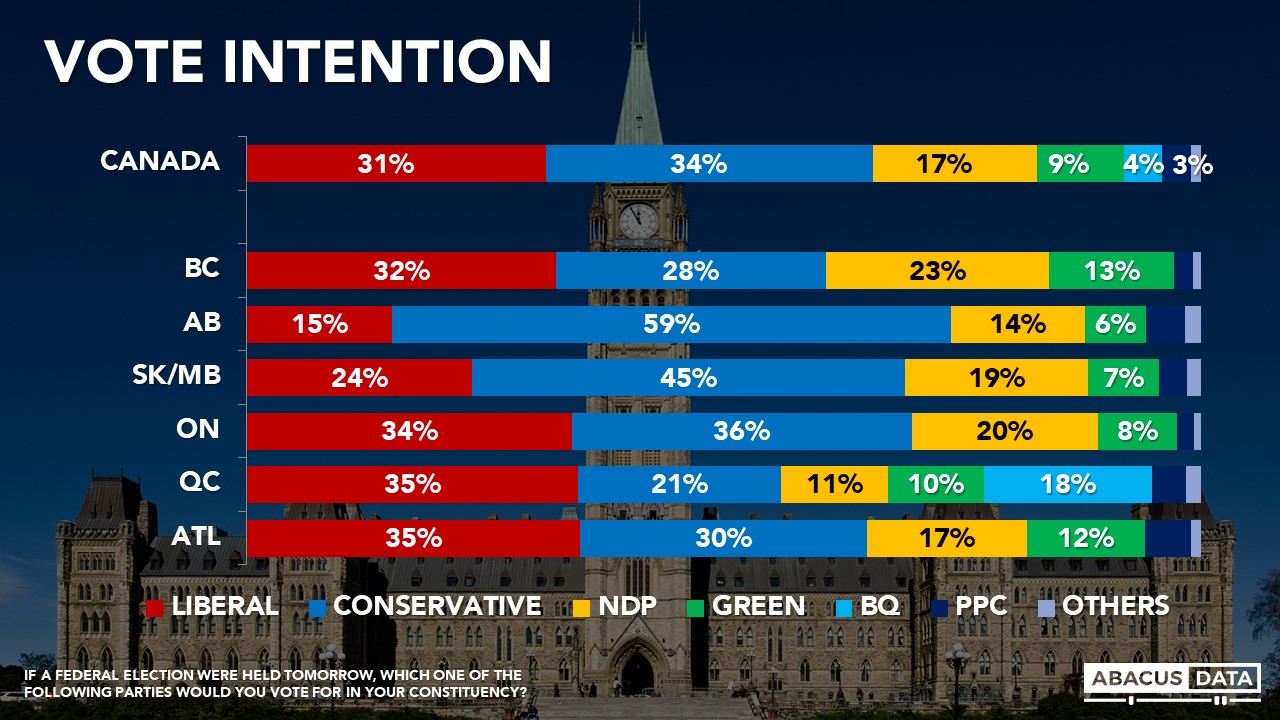
Voting intentions have been trending down from the Liberals and the Conservatives are currently ahead by three points nationally. Today, 34% would vote Conservative today compared with 31% for the Liberals. 17% would back the NDP while 9% would vote Green. For the Liberals, this represents a 7-point drop in 5 months, while the Conservatives are up slightly, but not much higher than our reading of public opinion at the end of 2018 and before the SNC-Lavalin controversy. Support for the NDP has remained very steady while the Greens have inched up from 7% in December to 9% today.

Regionally, the Conservatives hold a massive lead in the Prairies while the Liberals lead by double digits in Quebec and by four in BC. Ontario remains highly competitive while the margin between the Liberals and Conservatives in Atlantic Canada has closed from 26 points at the end of December to 5 points today.
Due to the large sample size in this study, we can also look at vote intention across different demographic and socioeconomic subgroups. Here’s what we find:
• The Conservatives lead by 7 points among men and are tied with the Liberals at 31% among women.
• The Conservatives have an 8-point lead among Baby Boomers and a 4-point lead among Gen X. The Liberals lead by just 3 among Millennials, who are more likely than other generations to support the NDP or Green Party.
• Conservatives have the largest lead among Boomer men (16 points) and Gen X men (10 points) while among Boomer women and Gen X women, the Liberals are more competitive. Among Millennial men, the Liberals lead by 3 over the Conservatives while among Millennial women, the Liberals are slightly ahead of the NDP with the Conservatives in third among this group.
• The Green Party does best among Millennial women (16%) and worst among Boomer men (6%).
But perhaps more important than demographic analysis is the question of how motivated each party’s support group is. Focusing on those voters who say they are most motivated to vote in the upcoming election (about 62% of respondents), the Conservatives have an 8-point lead.

ACCESSIBLE VOTER POOLS
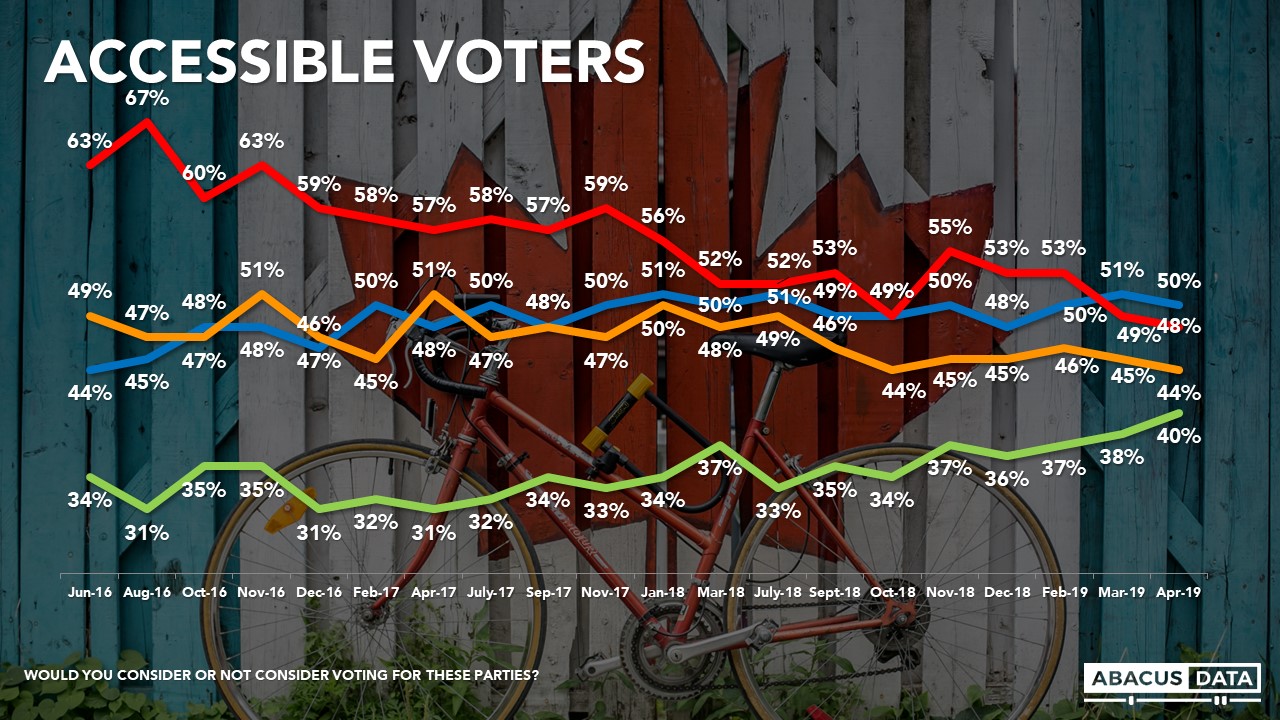
A critical factor for any party competing in an election is the size of the total accessible voter pool – how many people say they might consider supporting your candidates.
Right now the Conservative (50%) and Liberal Party (48%) have roughly equal sized accessible voter pools. The NDP has a slightly smaller pool at 44% of Canadians down significantly in Quebec over the past few months where only 35% would now consider voting NDP. The 48% number for the Liberals is the lowest we have seen since the 2015 election and down 19 points from its peak.
We’ve seen a marked rise in the number of Canadians open to voting for the Green Party. In July 2018, only 33% said they would be open to voting Green. Today, they are at 40% – the highest we have ever tracked them and only 4 points behind the NDP.
EXPLORING POTENTIAL VOLATILITY IN THE ELECTORATE
The extent to which vote intentions and accessible voter pools have shifted over the past few months demonstrates a relatively level of volatility within the electorate.
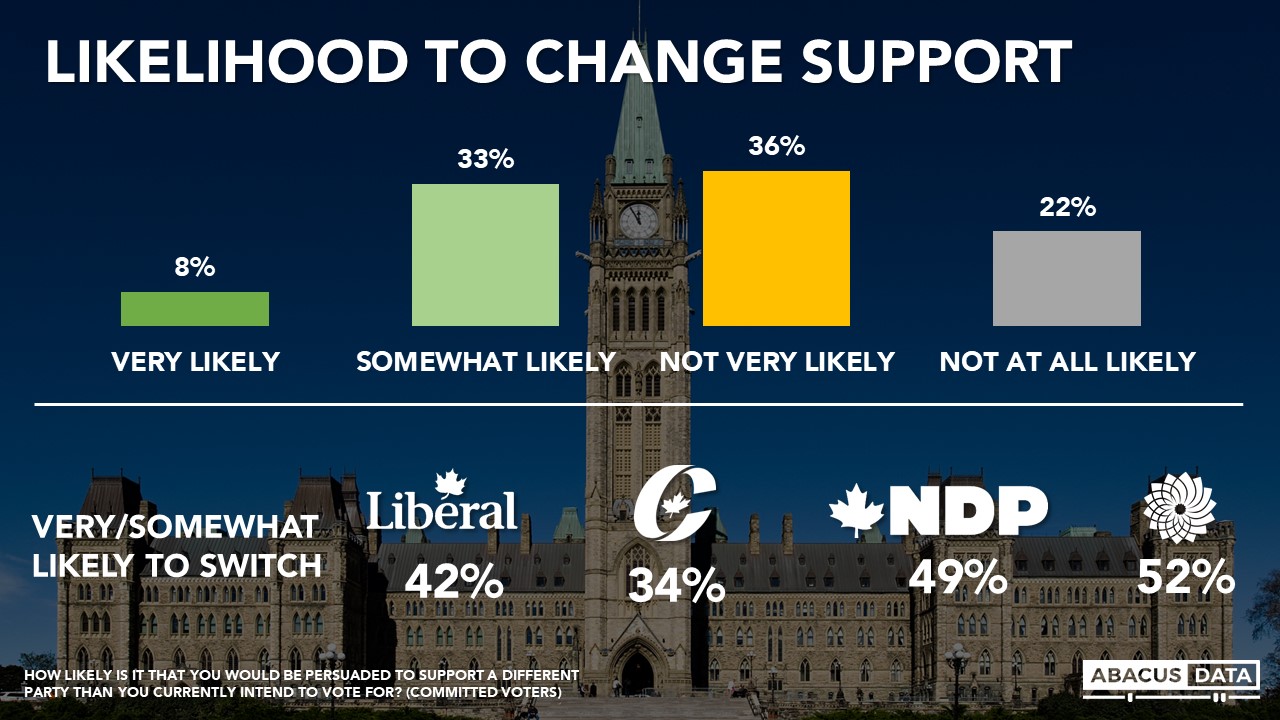
One way to measure this is to ask respondents how likely it is that they would switch their vote preference before voting in the October election. Overall, we find that 41% of respondents say they are either very (8%) or somewhat likely (33%) to be persuaded to support a different party than the one they currently intend to vote for. And a substantial portion of supporters of all parties says they could be persuaded to switch support – including half of current Green and supporters, 42% of Liberal supporters, and one in three Conservative supporters.
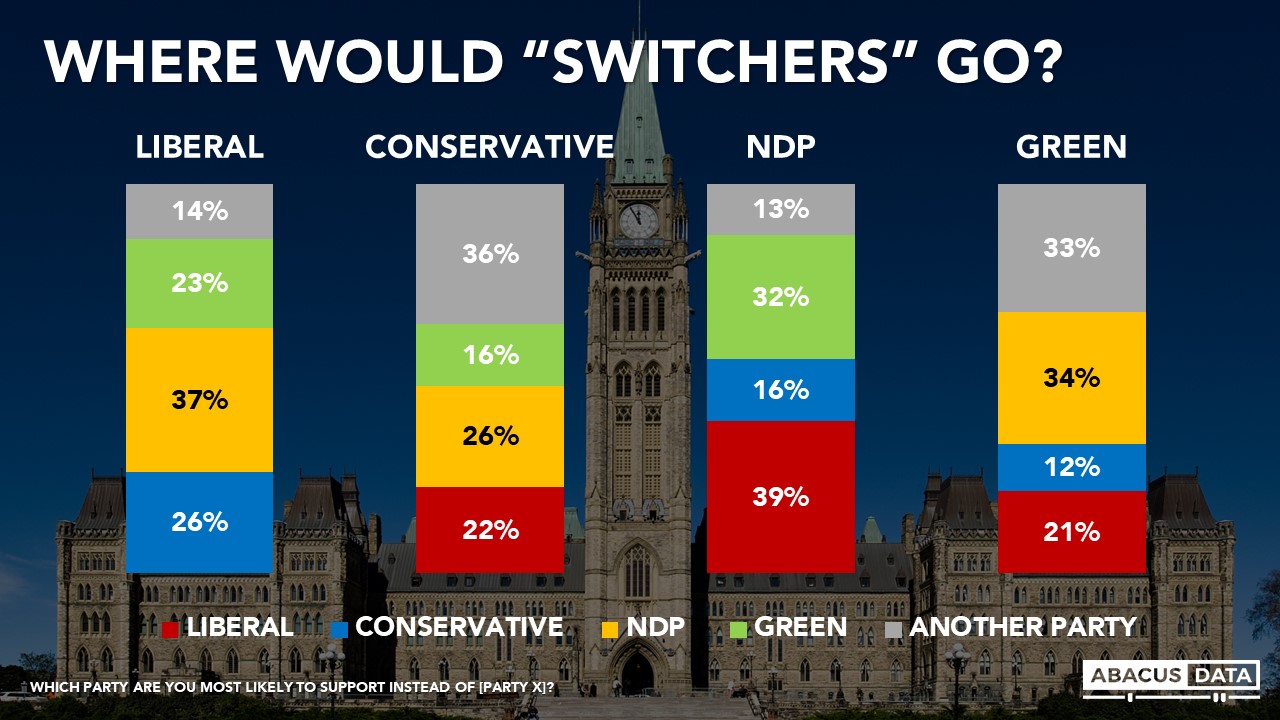
When we ask which party they might support if switched their preferences (their second choice in other words), we find:
• Disaffected Liberals would be more likely to vote NDP than Conservative, with the Green Party also seeing a lift.
• Disaffected New Democrats would tend to help the Liberals, but the Greens would also benefit.
• Disaffected Greens would be more likely to vote NDP than Liberal
• Disaffected Conservatives would, remarkably, be more likely to vote NDP than Liberal.
These patterns show is limited second choice growth potential for the Conservatives, but a more serious signal to the Liberals that they are not as competitive on the left, centre or right than they have tended to be in the past.
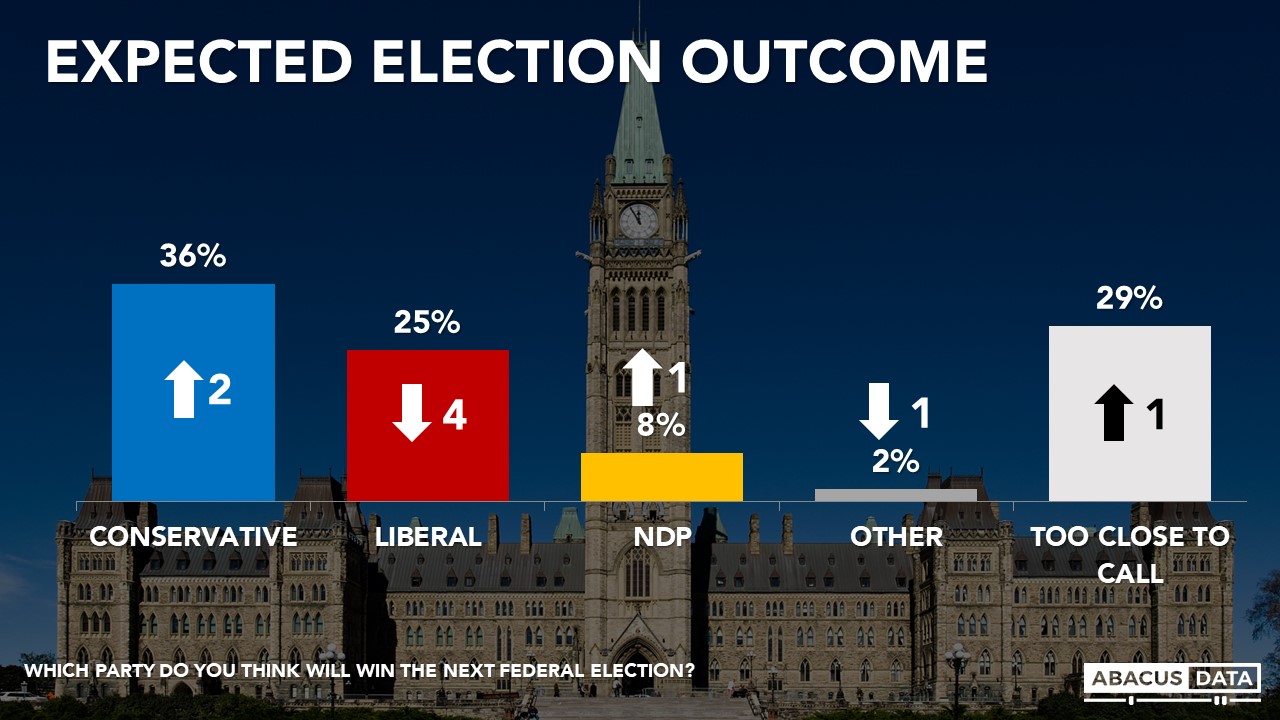
EXPECTED ELECTION WINNER
Canadians are more likely to think the Conservatives (36%) will win the next election than the Liberals (25%) while 3 in 10 think it’s too close to call. Since March, expectations of a Conservative win are up 2 while expectations of a Liberal win are down 4.
THE LEADERS
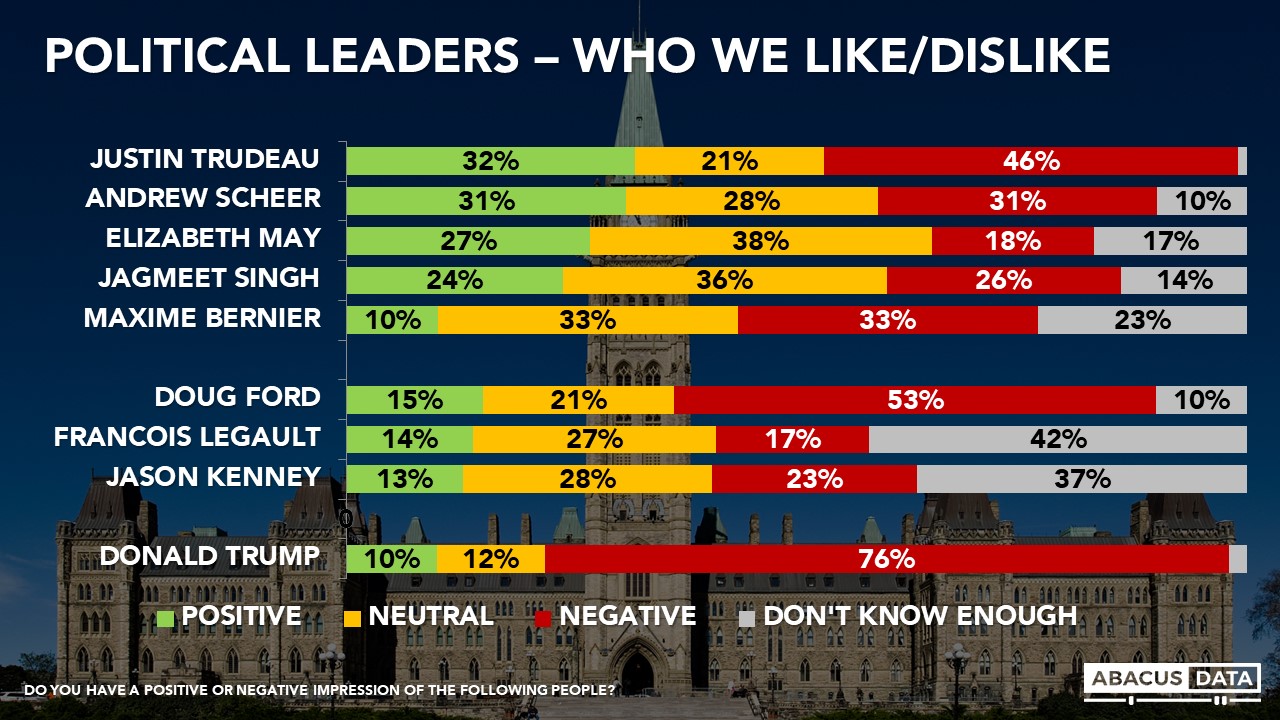
Today, almost half of Canadians have a negative view of the Prime Minister, about 10 points higher than at the end of 2018. This is also the first time in our tracking that we have seen two months in a row of net negative impressions of Mr. Trudeau.

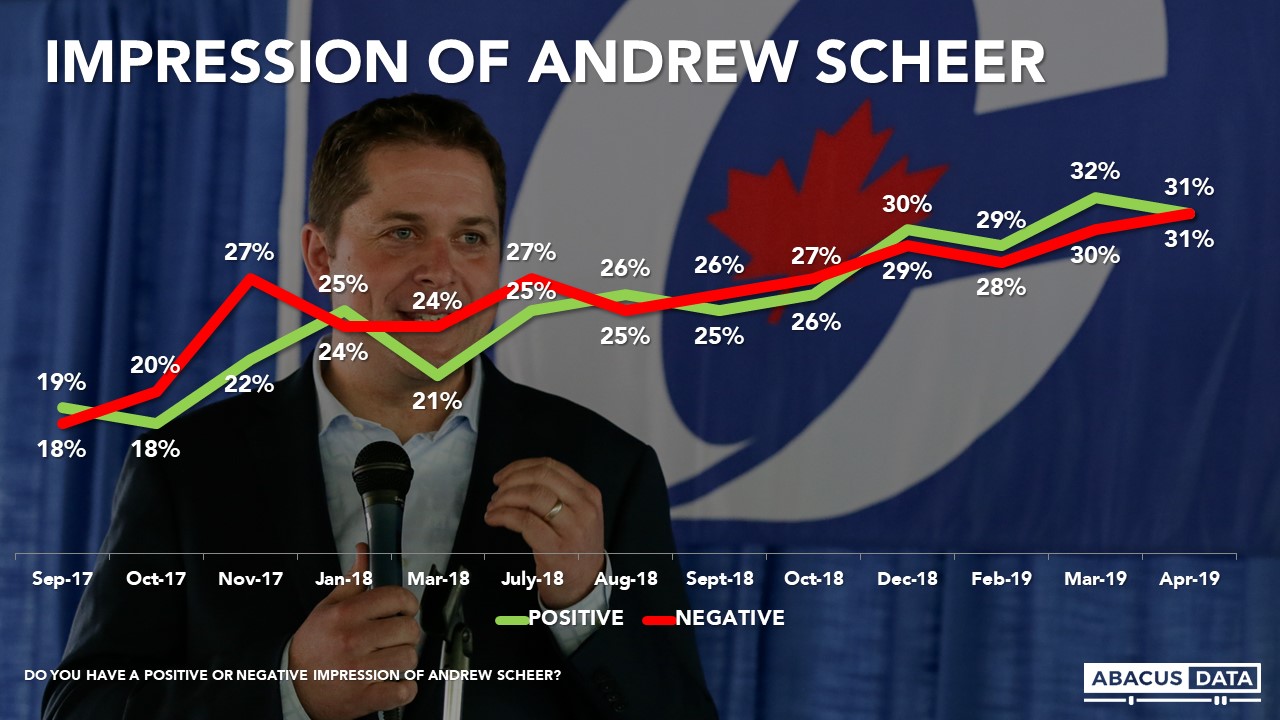
Canadians are getting to know Andrew Scheer more over time and his positive and negative impressions remain equal. Today 31% have a positive view of the Opposition Leader while 31% view him negatively.
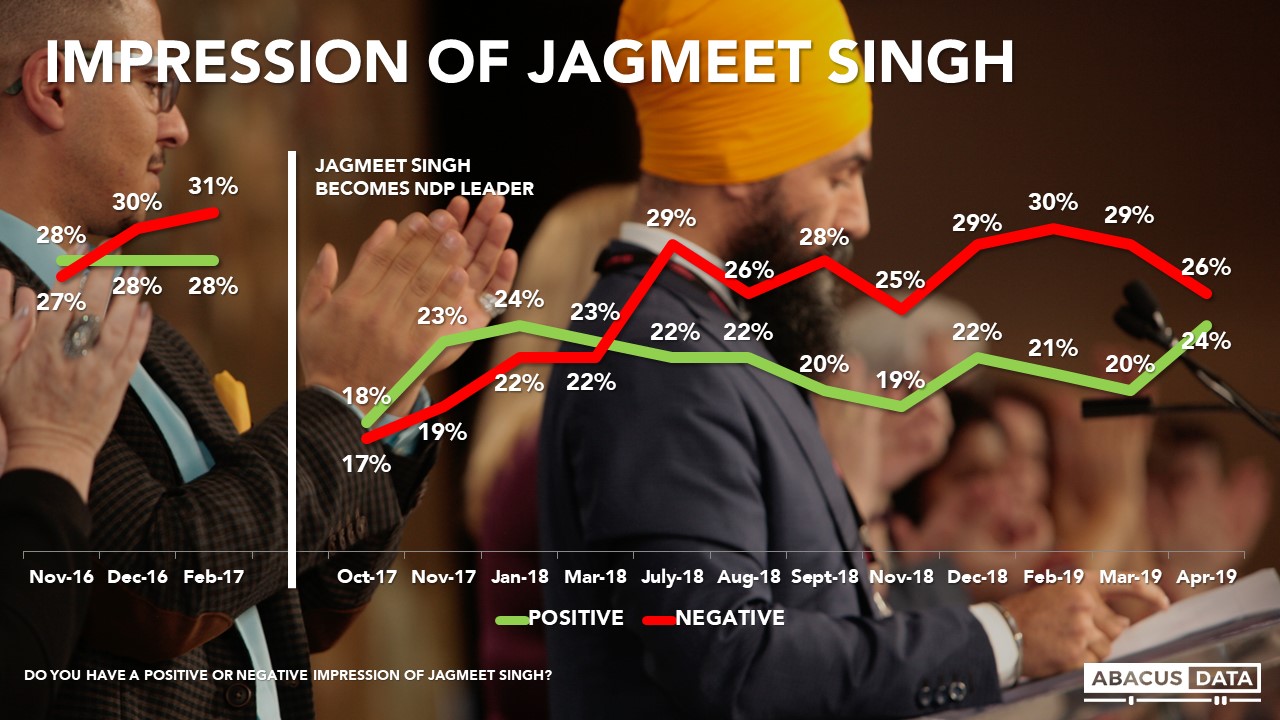
Jagmeet Singh’s and Elizabeth May’s numbers have improved. For most of 2018 and early into 2019, Canadians who knew Mr. Singh were more likely to have a negative view of him than a positive one. That’s still the case today but the gap is much smaller.
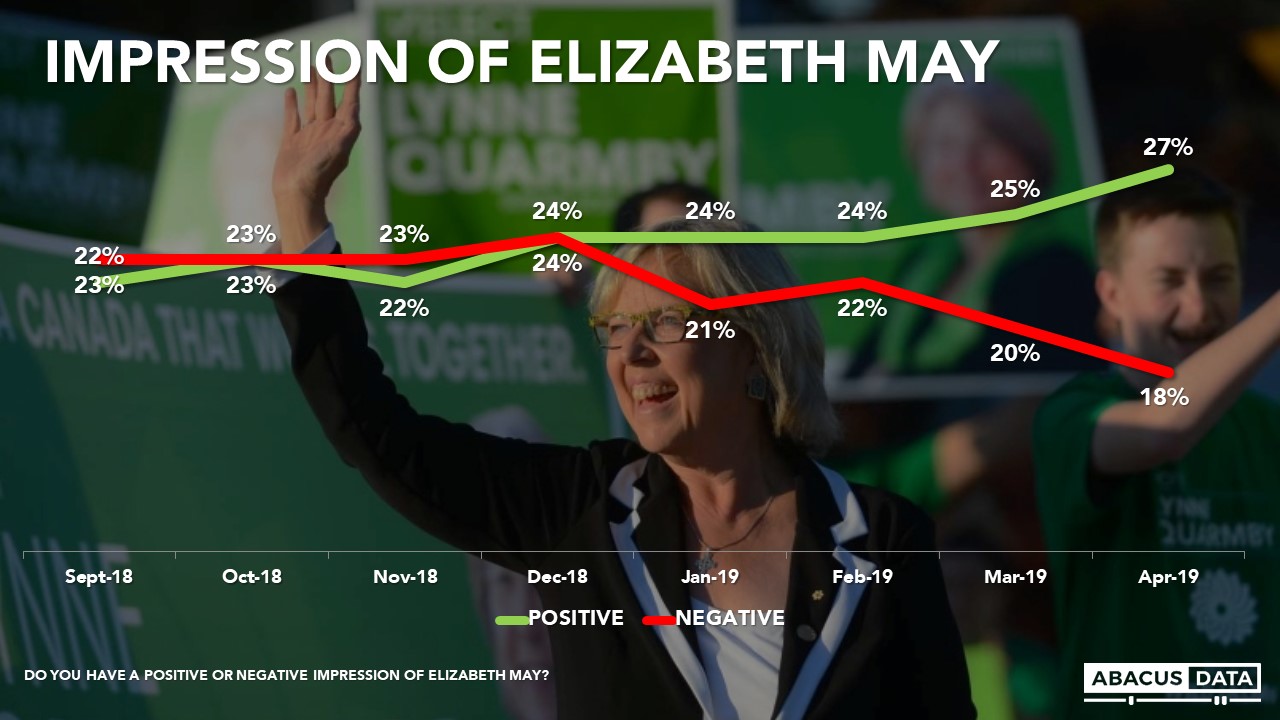
Today 27% of Canadians have a positive view of Ms. May while 18% view her negatively. Of four leaders of national parties, Ms. May has the most positive net score. In 2019, Ms. May saw growth in positives of 4 and a decline in negatives of 6.
Finally, given that a number of provincial premiers have been active in debates about federal issues and Donald Trump looms large over everything, it’s worth looking at how Canadians view some of the provincial premiers and the US President to the federal leaders.
Mr. Trump remains deeply unpopular in Canada while Ontario Premier Doug Ford is viewed negatively by 53% of Canadians compared with 15% who view him positively. Mr. Ford has a greater profile nationally than Andrew Scheer, Elizabeth May, or Jagmeet Singh. Alberta Premier Jason Kenney is less well known nationally but has a net negative impression among those with an opinion.
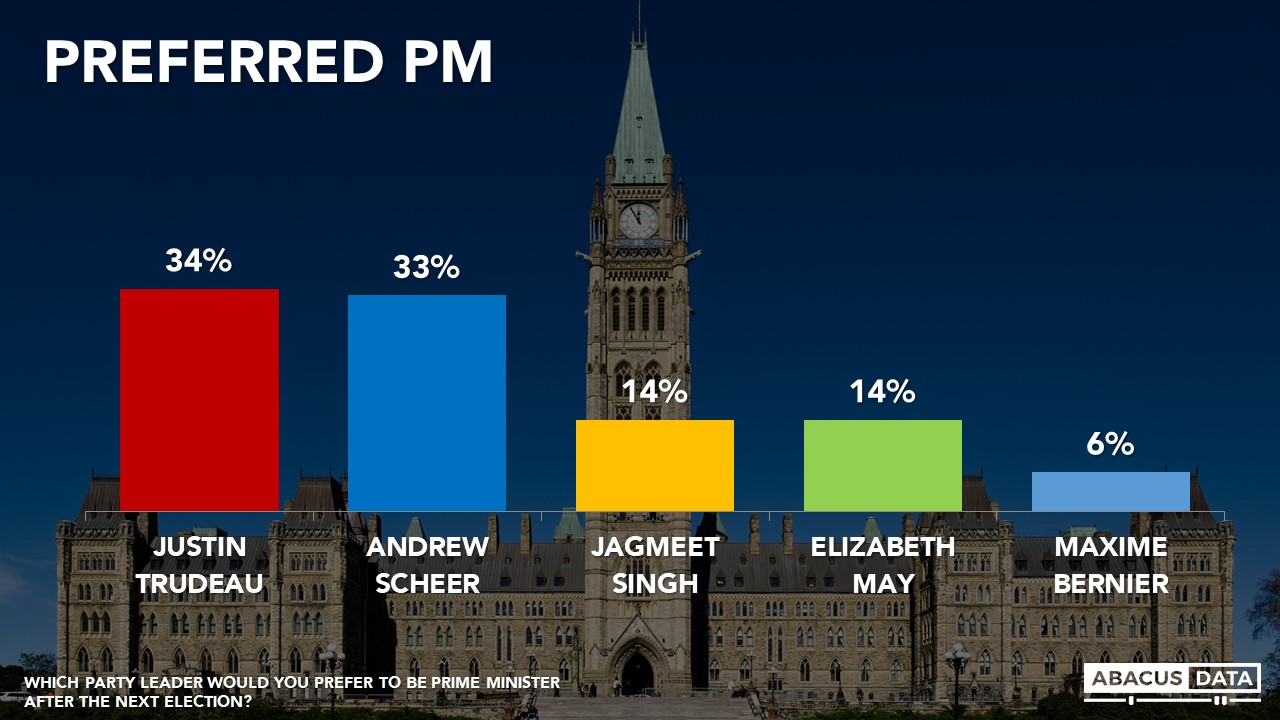
PREFERRED PRIME MINISTER
When we ask people who they would prefer to see as Prime Minister after the next election, 34% would prefer Mr. Trudeau compared with 33% who would prefer Mr. Scheer. Elizabeth May and Jagmeet Singh are tied at 14% each.
For Mr. Trudeau, this represents an 11-point drop since the end of January while Mr. Scheer, Ms. May and Mr. Singh are all up 4-points.
UNDERSTANDING THE LIBERAL SWITCHERS
The Liberal Party is trailing the Conservatives because a large portion (46%) of its past supporters are now supporting another party or are at least unwilling to commit to supporting the Liberals again this year.
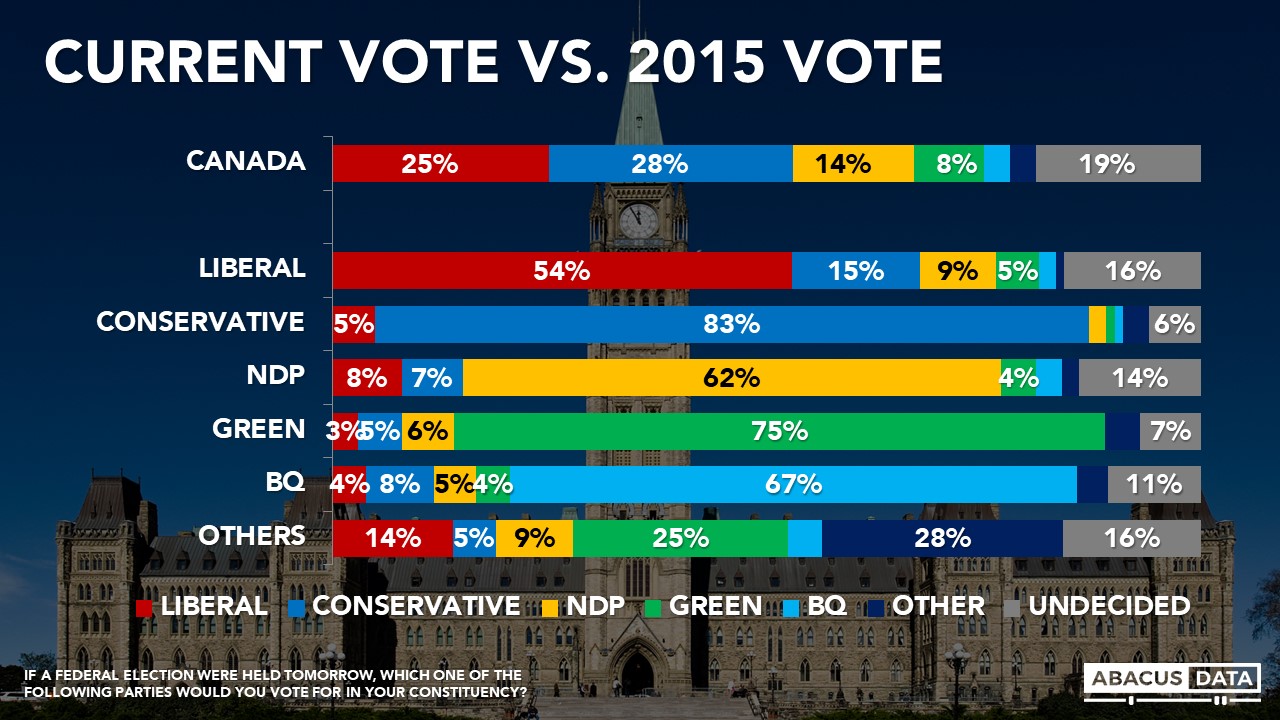
By our estimates, 5% of the electorate are past Liberal voters who are now undecided, 4% are past Liberal voters who now support the Conservatives (LPC/CPC), and 2% are past Liberal voters who now support the NDP (LPC/NDP).
Thanks to the large sample size of this study (n=4,015), we can understand the opinions of each group and what might have caused them to defect from the Liberal fold.
Liberal to Conservative Switchers (4%) of the electorate.
Almost everyone in this segment (97%) wants to see a change in government and the vast majority (82%) have a negative view of Mr. Trudeau. 87% would prefer Mr. Scheer to become Prime Minister after the next election which is 13 points higher than the number of who have a positive view of the Conservative leader. Two-thirds think the country is headed on the wrong track.
To some extent, these voters are reluctant Conservatives. Only 28% have a positive impression of Doug Ford while 42% view him negatively. Just 18% like Mr. Trump while 72% dislike the US President. Less than half of them self-identify as Conservatives.
Geographically, they are spread about proportionally to the population. 35% live in Ontario, 26% in Quebec, 12% in Atlantic Canada, 11% in Alberta, and 10% in BC. In Quebec, 54% voted for CAQ while 28% for the Quebec Liberal Party. In Ontario, 54% voted PC, 27% voted Liberal and 12% voted NDP.
52% say they are extremely or very concerned about climate change, and 72% think the Conservatives want to make progress on climate change at about the right pace.
Economically, 28% are feeling confident about their personal economic situation, 36% are worried, while 27% are somewhere in the middle.
Demographically, 57% of this group is male, 43% female. They tend to be older than the rest of the country with 66% aged 45 and over. Only 11% are under the age of 30.
Despite saying they voted Liberal in 2015, only 28% are now open to voting Liberal. In contrast, 32% are open to voting NDP, 24% are open to voting Green.
For the Conservatives, this group accounts for much of its growth from 2015 to 2019. While about one in four is open to voting Liberal still, most have closed the door to even considering the Liberals again.
Liberal to NDP Switchers (2% of the electorate)
This group represents a more modest 2% of the electorate and right now while 70% want a change in government, 30% would prefer to see the Liberals re-elected.
Only 35% have a negative view of Mr. Trudeau while 33% view him positively. 74% have a positive impression of Mr. Singh while only 13% view Mr. Scheer positively. 61% would prefer Mr. Singh to become Prime Minister after the next election compared with 20% who would prefer Mr. Trudeau. About half (52%) think the country is headed off on the wrong track compared to 31% who feel things are headed in the right direction.
Looking at how they feel about other political leaders, only 4% have a positive impression of Doug Ford while 77% view him negatively. 3% like Mr. Trump while 91% dislike the US President.
Geographically, they are concentrated more in Ontario and BC and much less likely to be living in Quebec or Atlantic Canada. In Ontario, 71% voted for the NDP in the last provincial election while 19% voted Liberal. Only 5% voted for Doug Ford and the PCs.
38% self-identify as New Democrat, 33% as Liberal, while 22% don’t identify with any party.
76% say they are extremely or very concerned about climate change and 54% would prefer to see an ambitious plan to fight climate change. Right now, 36% think the Liberals do not want to act quickly enough on climate change while 56% think they want to make progress at the right pace. 76% think the Conservative do not want to act quickly enough.
Like Liberal/Conservative switchers many say anxiety about the cost of living will drive their vote but more indicate that concerns about severe service cuts could be an important driver in whether they vote and who they vote for.
Economically, 39% are feeling confident about their personal economic situation, 32% are worried, while 29% are somewhere in the middle.
Demographically, 56% of this group is female, 44% female. They tend to be younger than the rest of the country with 59% under the age of 45. Only 13% are over 60.
Although this group says they will vote NDP today if an election was held, 68% are still open to voting Liberal. Over half (57%) would consider voting Green while 21% would consider voting Conservative.
For the Liberals, this group is critically important to re-election in 2019. Most are open to voting Liberal. Most dislike Mr. Ford and Mr. Trump and live in important battlegrounds of BC and Ontario.
For the NDP, this groups represents the type of voter they need to attract more of. Those who voted Liberal in 2015 but are mostly disappointed with the performance of the government and live in regions of the country where the NDP can make up for potential losses in Quebec.
Liberal to Undecided (5% of the electorate)
This group represents 5% of the electorate. Four in ten think the country is on the wrong track compared to 31% who feel things are headed in the right direction. Half want to see a change in government while half would prefer to see the Liberals re-elected. 29% have a negative view of Mr. Trudeau while 31% view him positively.
50% would prefer Mr. Trudeau to be Prime Minister after the next election followed, notably by 19% for Ms. May, 14% for Mr. Scheer, and 8% for Mr. Singh.
Only 5% have a positive impression of Doug Ford while 71% view him negatively. 6% like Mr. Trump while 90% dislike the US President.
Geographically, they are spread about proportionally to the population. 38% live in Ontario, 19% in Quebec, 14% in Atlantic Canada, and 14% in BC. In Ontario, 33% voted for the NDP in the last provincial election while 28% voted Liberal and 20% voted PC.
Most of this group doesn’t identify with a political party. 57% are unaligned while 31% identify as Liberal, 6% Conservative, and 3% NDP.
68% say they are extremely or very concerned about climate change and 60% would prefer to see an ambitious plan to fight climate change. Right now, 30% think the Liberals do not want to act quickly enough on climate change while 54% think they want to make progress at the right pace. 58% think the Conservatives do not want to act quickly enough while 39% think they want to make progress at the right pace.
Concerns about climate change, service cuts, and cost of living are the strongest vote drivers for this group.
Economically, 44% are feeling confident about their personal economic situation, 23% are worried, while 34% are somewhere in the middle.
Demographically, 54% of this group is female, 46% male. They tend to be younger than the rest of the country with 59% under the age of 45. Only 13% are over 60.
This group will likely be important in deciding the next election. In 2015, all of them said they voted Liberal but today they are undecided. And many are open to voting for most of the main political parties. 79% would consider voting Liberal, 61% NDP, 50% Conservative, and 50% Green. This group makes up many of the “swing voters” who are not aligned closely with one party or another but can decide close elections.
UPSHOT
According to Bruce Anderson: “The Trudeau government came to office with high hopes and high expectations, in the time of a popular progressive President, Barack Obama. Today, the world is a different place, with populist right of centre leaders in the news and winning elections.
Their challenges are partly a product of losing control of the agenda this year as self-inflicted internal disputes have dominated news about what the government is up to.
But below that surface, the challenge may be more about life in a time when politics wants to be more polarized. Picking a lane looks more necessary than ever, but is a challenge for a party that has been able to win elections by owning the centre line. Progressive voters are restless for a champion they can count on to fight the right with fire, while centre-right voters are feeling like their views matter too little to this government.
Today, the Liberals are splitting centre-left votes with the Green Party and the NDP, splitting centre votes with everyone except Max Bernier, and losing touch with centre -ight voters.
The results are promising for Conservatives, but so far their improved opportunity seems more about avoiding trouble, than building popularity or a bigger pool of potential voters. A sustained lead in the polls will mean that voters will spend more time evaluating them, which carries the potential of greater rewards but also more risk.
The sleeper story in this survey is the role of the climate issue and the interest in the Green Party. We’ll continue to watch that space closely.”
According to David Coletto: “With five months to go before the next election, the landscape has clearly shifted. The SNC-Lavalin controversy altered many Canadians perceptions and impressions of not only the Prime Minister, his government, and his party, but also the general direction of the country.
The Conservatives now have the advantage electorally. They have the largest pool of accessible voters, a three-point lead nationally among all committed voters, and a larger 8-point lead among those most motivated to vote.
The Liberals, unlikely only a few months ago, have a leader with the highest net negatives, a smaller voter pool to draw on, and only about half of their previous 2015 voters currently committed. They have gone from frontrunners to underdogs in less than half of year.
The NDP’s support in our polls has remained remarkably stable but with only 11% in Quebec, many of those seats it held onto in Quebec will likely be gone. Jagmeet Singh is still disliked by more people than the number who like him and half of its current supporters are saying they are likely could be persuaded to vote for another party.
Finally, the Greens, beyond the Conservatives, probably have the most to be optimistic about from these numbers. The accessible voter pool is the largest it has ever been in our tracking. They are polling close to double digits nationally and their leader has the highest net positive rating of any of the federal party leaders. They also pulled off a historic byelection win yesterday in BC.
But while this snapshot tells us one story, it also suggests that things can quickly change over the coming months. The Liberal brand has been damaged and more Canadians are looking for an alternative to the government they currently have. But many haven’t yet really considered the alternatives and what an alternative government and Prime Minister might mean to the issues they are most concerned about. Until that start to happen during the formal campaign period, much of the numbers from this survey could change, and change substantially.”
“There seems to be, I think, at least in the numbers, evidence that the @CanadianGreens are connecting, that people are paying, maybe, more attention and I think last night’s result will add fuel to that fire and that momentum,” said @Colettod #cdnpoli pic.twitter.com/CiAfoyGN56
— Power & Politics (@PnPCBC) May 7, 2019
“Some of the fundamentals that might help propel the Greens forward and make historic gains seem to be developing in these numbers for them,” says @AbacusDataCA’s David Coletto on tonight’s episode of @PTP_CPAC at 8PM ET.
? https://t.co/upfKZYDBbi #cpacpoli #cdnpoli @colettod pic.twitter.com/7cQ8JMmQiu
— PrimeTime Politics (@PTP_CPAC) May 7, 2019
METHODOLOGY
Our survey was conducted online with 4,015 Canadians aged 18 and over from April 23 to 30, 2018. A random sample of panelists was invited to complete the survey from a set of partner panels based on the Lucid exchange platform. These partners are double opt-in survey panels, blended to manage out potential skews in the data from a single source.
The margin of error for a comparable probability-based random sample of the same size is +/- 1.5%, 19 times out of 20. The data were weighted according to census data to ensure that the sample matched Canada’s population according to age, gender, educational attainment, and region. Totals may not add up to 100 due to rounding.

ABOUT ABACUS DATA
We are the only research and strategy firm that helps organizations respond to the disruptive risks and opportunities in a world where demographics and technology are changing more quickly than ever.
We are an innovative, fast-growing public opinion and marketing research consultancy. We use the latest technology, sound science, and deep experience to generate top-flight research-based advice to our clients. We offer global research capacity with a strong focus on customer service, attention to detail and exceptional value.
Contact us with any questions.
Find out more about how we can help your organization by downloading our corporate profile and service offering.
Don’t miss any of our releases and receive our weekly “Worth a Look” newsletter by signing up for our email list. We promise no more than 2 emails a week… unless there’s something really important we want to share.