A meatless revolution or a temporary fad?
What consumer attitudes tell us about potential shifts in consumer behaviour in Canada towards plant-based alternatives.
This past May, Beyond Meat Inc. started trading shares on the Nasdaq stock exchange. Its stock was initially priced at $25 USD and within a few months, it gained over 800% topping out at $235 before coming back and settling at around $75 USD with a market capitalization of $4.6 billion.

With all the hype and interest in this emerging market, we wanted to explore the potential for the meatless market in Canada and understand the potential for plant-based diets. At the same time, we also wanted to explore the risk to those who produce food products, and the opportunity to those in foodservice and retail. The data was used as part of today’s Sysco Canada’s Webinar Wednesday.
For the study, we interviewed 2,000 Canadian consumers aged 18 and over from November 12 to 17, 2019. The sample is representative of the Canadian population.
FOOD IS TOP OF MIND
Food and how it is made are top of mind to most Canadians. Half of Canadians today are thinking about the quality of their diets, all the time, or regularly. Add in those who think of the quality of their diets at least occasionally, and the number increases to 9 in 10 Canadians.
At the same time, Canadians are also preoccupied with climate change and wanting to know where their food comes from. And the youngest consumers, those aged 18 to 29 are the most likely to be thinking about these things (more to come shortly on the generational divides).
Food is increasingly becoming more than just sustenance. It’s about identity, belonging, and purpose. The rise of the “foodie” culture and growing interest in how food is produced and its impact on our health and environment is growing.
TO MEAT OR NOT TO MEAT
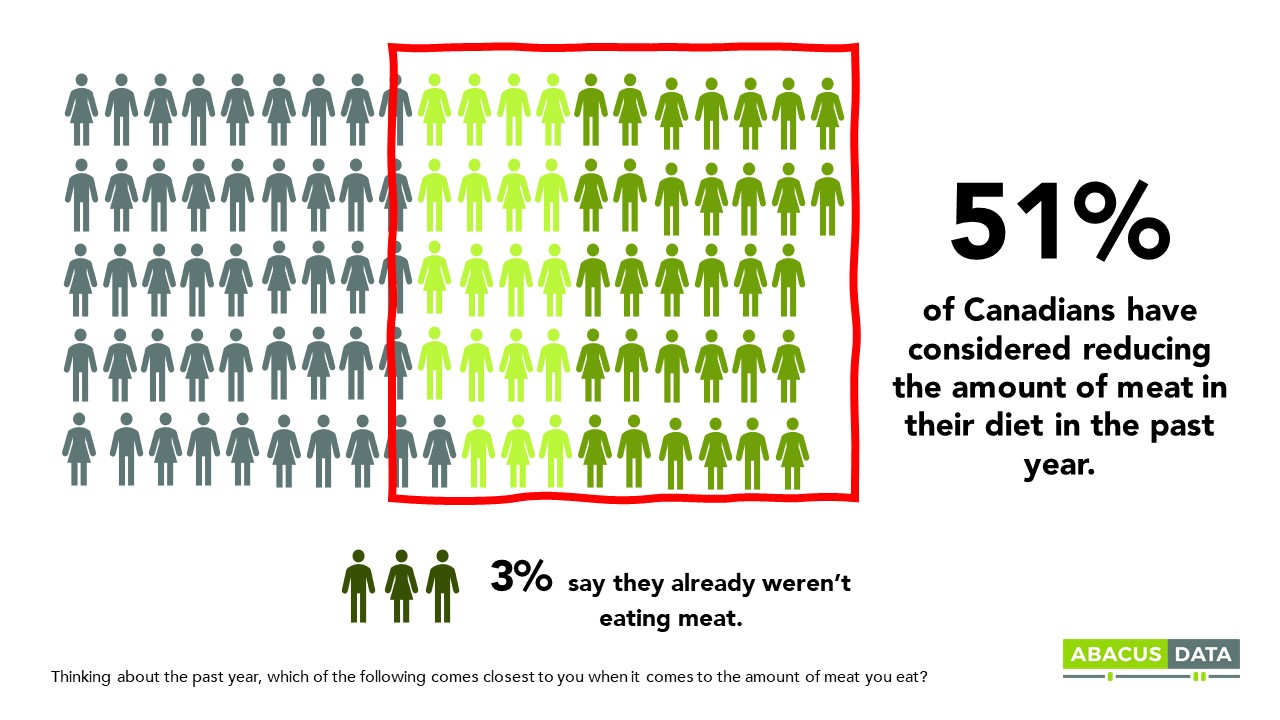
Almost all Canadians eat meat. But many Canadians report either reducing the amount they eat or are thinking about reducing the amount of meat they eat (51% total). We estimate that about 1.5 million Canadian adults have reduced the amount of meat they ate the past year, according to self-reporting.
A minority (41%) say they have not reduced the amount of meat they consume, nor have they thought about reducing the amount of meat they are eating within the past year.
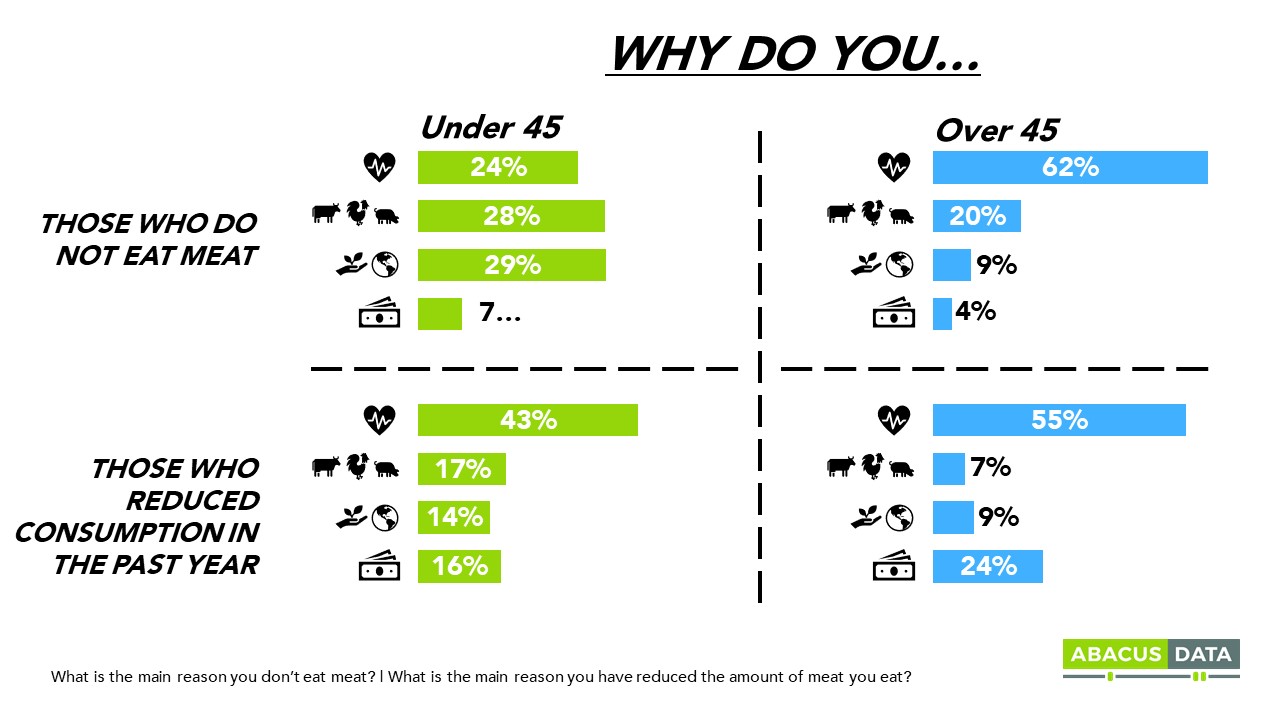
When Canadians were prompted about reasons why they either do not eat meat or have reduced their consumption, four factors were most prevalent: health considerations, concerns about the treatment of animals, climate change, and affordability. Most striking was the gap between generations – specifically under and above 45 years of age.
Health is a major factor for reducing consumption of meat or eliminating it altogether from their diet for those over 45 while climate change and the treatment of animals are more important for younger consumers.
Approaching the topic slightly differently finds similar attitudes. 44% agree they should be eating less meat (only 27% say the same about dairy though). And when asked about how their habits fit with an identity, 8% identify as a vegetarian, and 4% as a vegan.
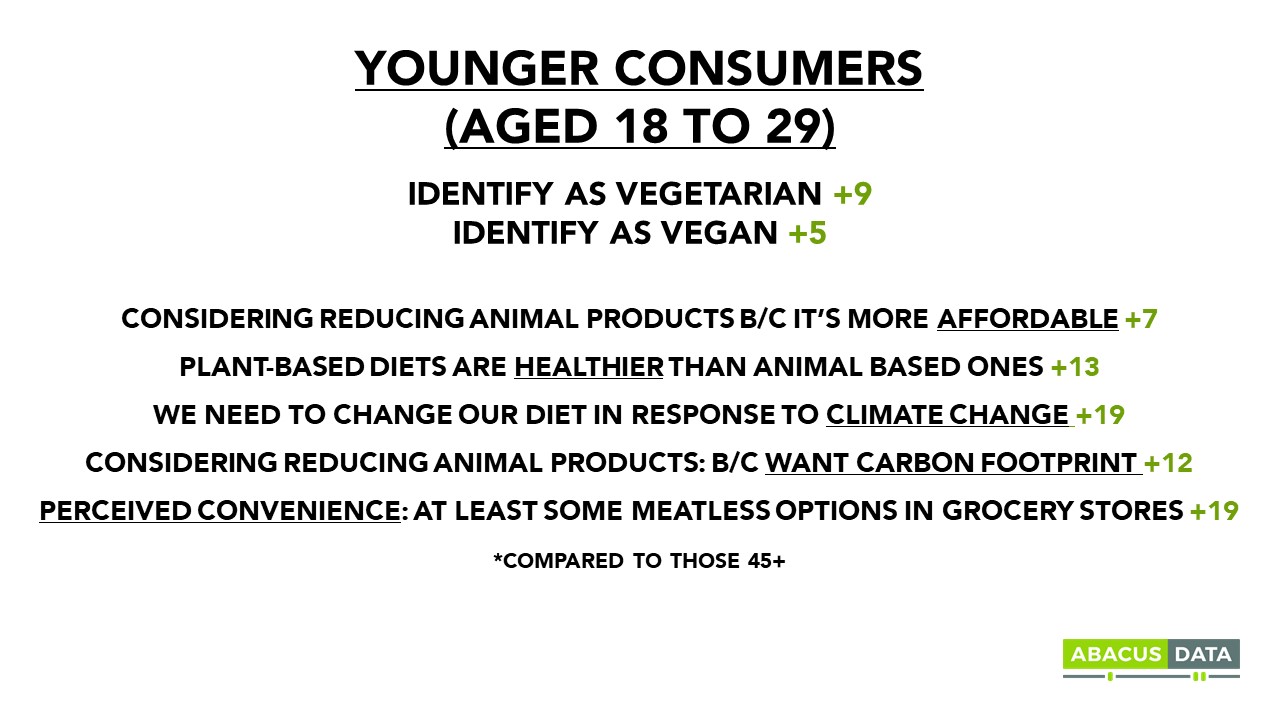
The generational differences in habits alone are steep. 7% of younger consumers (18 to 29 years) aren’t eating meat, compared to just 1% of those 60+. And for this demographic, not eating meat is more than a behaviour, it’s an identity. Those age 18 to 29 are three times more likely to identify as a vegetarian, compared to those 45+; and twice as likely to identify as a vegan.

THE MARKET FOR MEATLESS ALTERNATIVES IS BIG
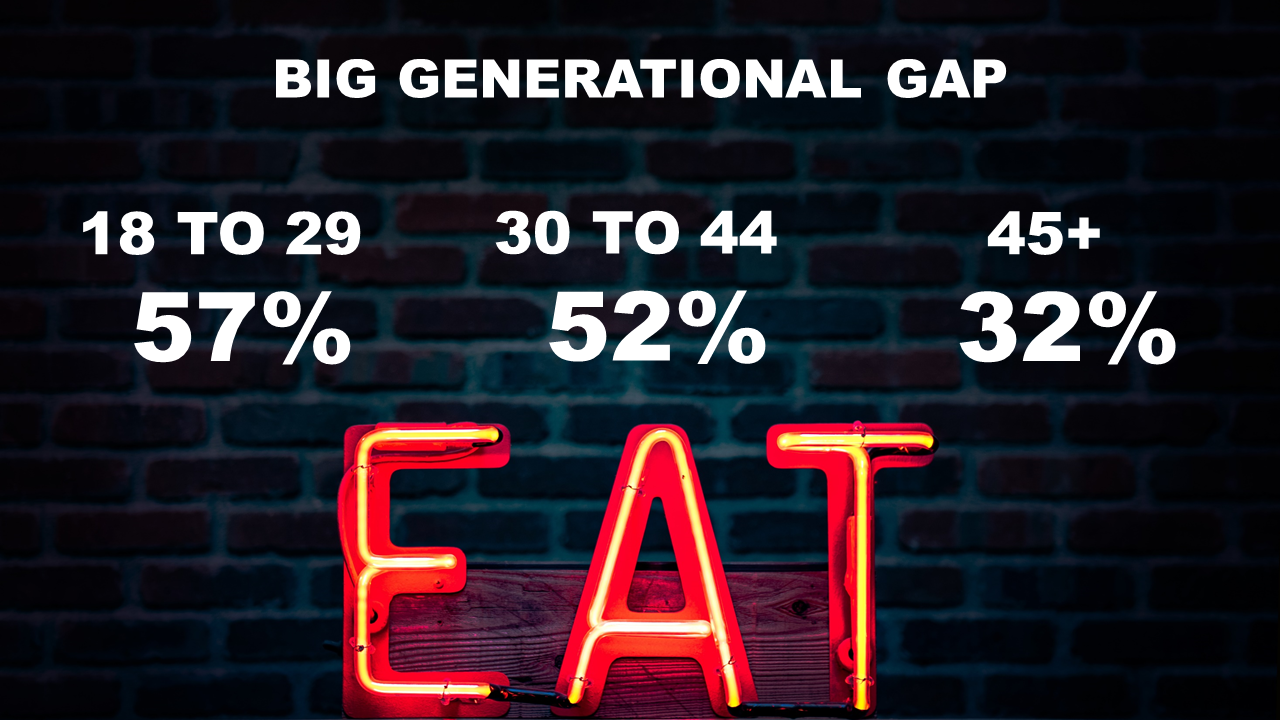
When we ask consumers how likely, if at all, they are to purchase foods that look and taste like meat, but only contain plant-based products, 42% say they are certain or likely to, representing 12.3 million adult consumers. But there’s a big generational divide. Over half of those under 45 years old say they are likely to purchase meatless alternatives compared with about a third of those aged 45 and over.
COMPARING MEAT AND MEATLESS ALTERNATIVES
Having more choices in the marketplace may not be enough to stimulate a change of behaviour. Our research finds perceived nutritional value, environmental impact, cost, social pressures and taste all play a role in a possible shift to alternatives.
Health Considerations
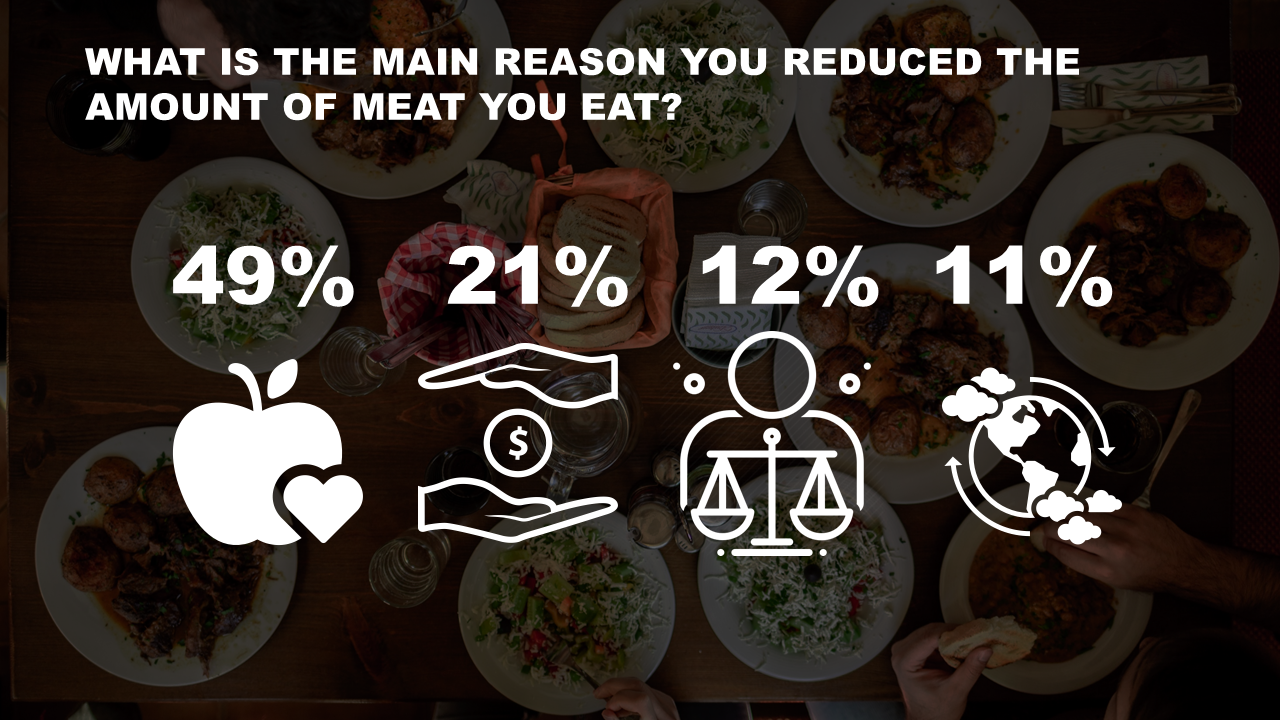
Health is the most cited reason for reducing meat/dairy intake. 47% of Canadians report that health benefits of reducing meat or dairy consumption are a consideration for changing the amount they consume. When we asked those who say they reduced meat consumption this past year what the primary reason was, unprompted, 49% cite health concerns. At the same time, 1 in 5 says instructions/advice from their doctor would be a major consideration. Health as a major consideration for reducing meat/dairy intake ranks higher than the treatment of animals, affordability, and availability of alternatives.
For the most part, when considering switching diets, Canadians have positive impressions of plant-based and vegan diets. 55% feel that plant-based diets are healthier than animal-based ones, and slightly less (41%) feel the same about vegan diets (we split the sample and the impact of language – vegan vs. plant-based – is a fascinating subplot in the data).
Millennials feel more strongly than other generations about the health benefits of vegan and plant-based diets (63% of millennials say plant-based diets are healthier than animal-based diets and 51% say vegan diets are healthier than animal-based diets).
That said, one in three have ‘no confidence’ that plant-based products are healthier for you than meat products. Although, when asked whether a dish with meat or meatless alternatives would be healthier or the same amount it’s a tie- 34% say the dish with meat, 33% dish with meatless alternative, 34% both equally. Unsurprisingly, younger Canadians are more confident that meatless alternatives are healthier (40% of those 18-29 compared to 28% of those 60+).
Environment & Climate Change
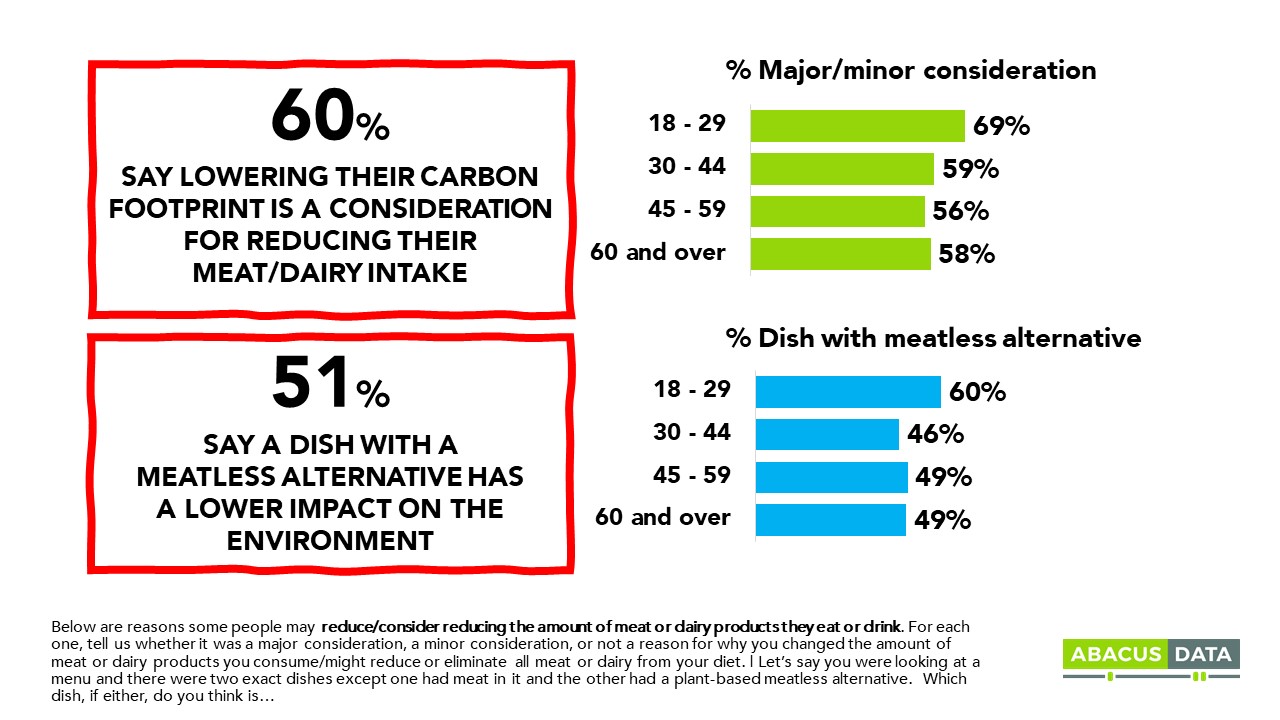
In a general sense, there’s a broad understanding that there is a link between the production of animal-based food products and climate change. About six in ten Canadians agree to some extent that we need to change our diets in response to climate change with 11% strongly agreeing with this view. For those who have already started changing their behaviour, many identify climate change as a factor. When asked why they don’t eat meat or have reduced their consumption, many mentioned the environment or climate change as their primary reason. Moreover, 60% regarded wanting to lower their carbon footprint as a consideration for reducing their meat or dairy intake.
But not everyone is convinced that plant-based meat alternatives have less of an impact on climate change. 62% have at least some confidence that plant-based products have a smaller carbon footprint than meat products but only 12% are completely confident that this is the case. Producers of these products have more work to make their case of the environmental benefits of these products.
Affordability
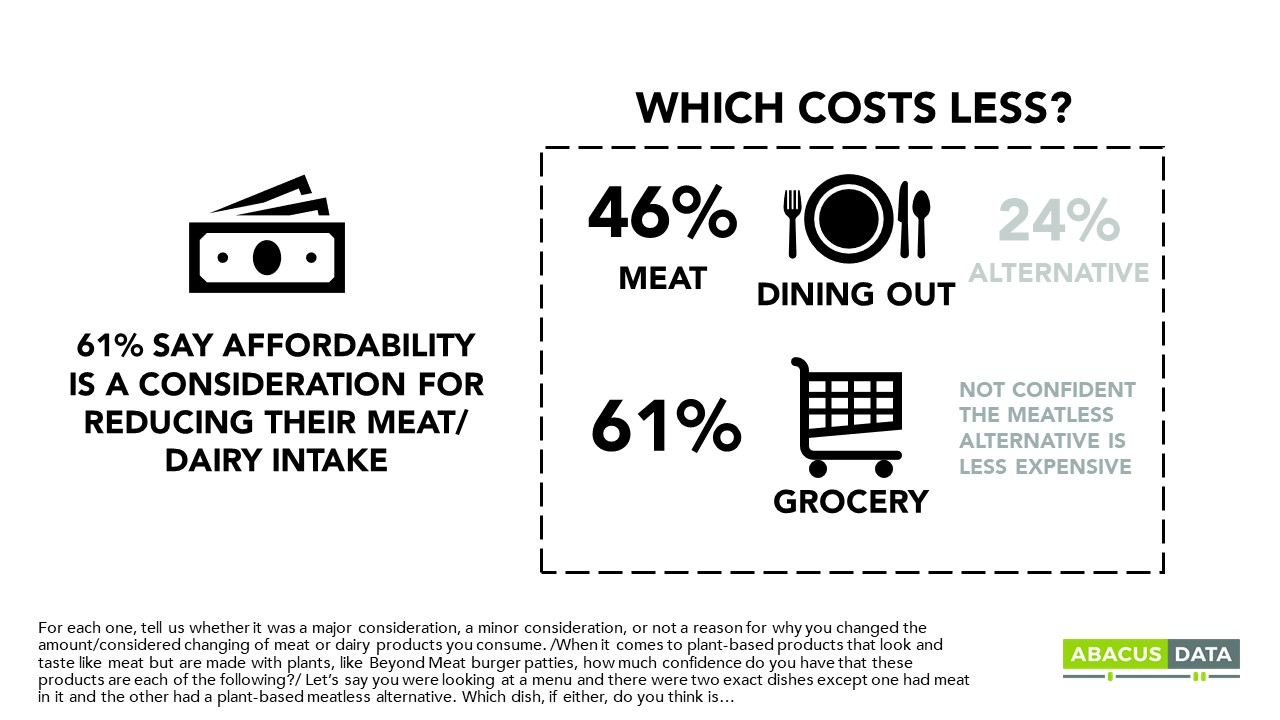
Cost is a major consideration for people thinking about making the switch to meat alternatives. 26% say affordability is a major consideration, and another 35% say it’s a minor one when making a decision to reduce meat/dairy consumption. For younger Canadians (18-29), this jumps to 35% who say it’s a major consideration.
That said, when the cost is in question, meat-based products are still more likely to be perceived as affordable when compared to meatless alternatives. 62% of Canadians have little to no confidence that the plant-based version would cost less than a meat-based product.
There is a generational divide here too. Younger Canadians are more confident choosing a meatless alternative will lead to savings at the grocery store, and 33% of younger consumers say dishes with meat alternatives are the cheaper option at a restaurant, compared to just 21% of those 45+.
Social Pressure
Beyond cost, health, and environmental considerations, a less obvious but perhaps more important factor lurks to shift consumer behaviour over time: social pressure and ethical considerations.
On one end of the spectrum, one in ten say a family member switching their diet would be a major consideration for them to change their own.
A more extreme version of social pressure is shaming or judgment and 9% of Canadians report being shamed/judged for eating meat with almost 1 in 5 younger consumers reporting being shamed by others for their food choices – eating meat.
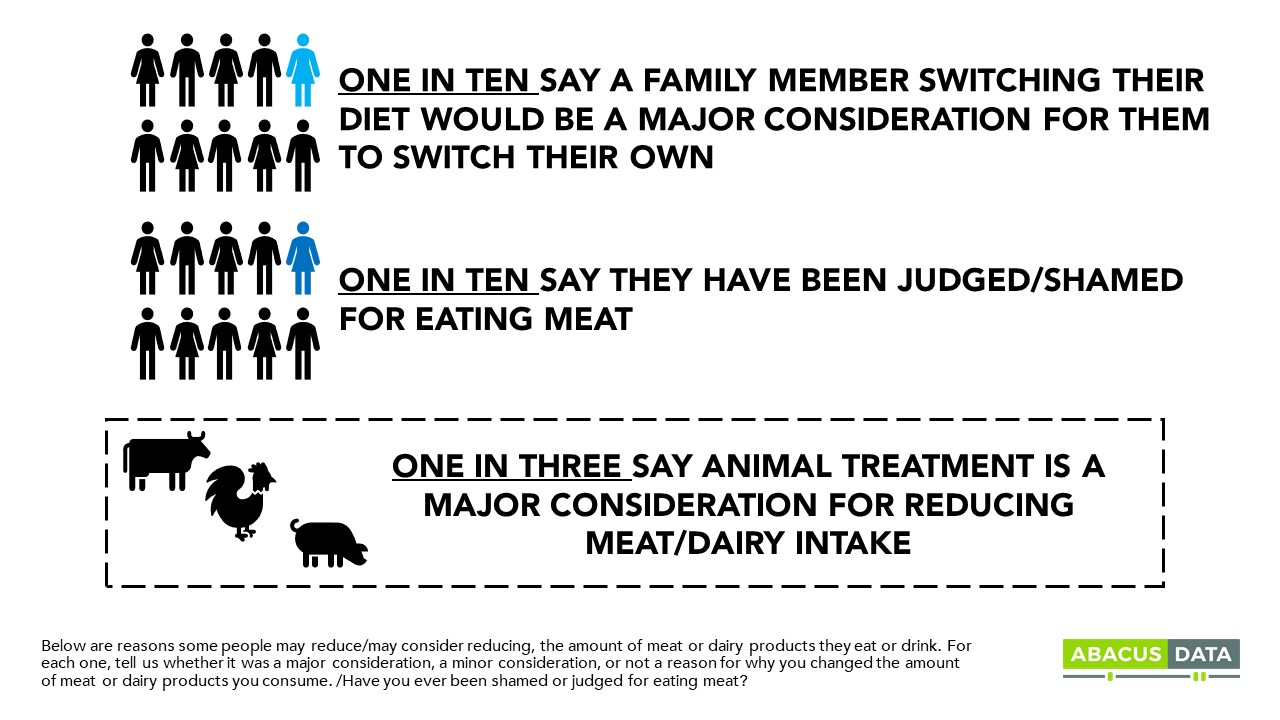
The ethical pressures (no doubt in part due to the abundance of Netflix specials about the topic) are also pushing people to reconsider what they eat. One in three says the treatment of animals is a major consideration for them to reduce the amount of meat they eat.
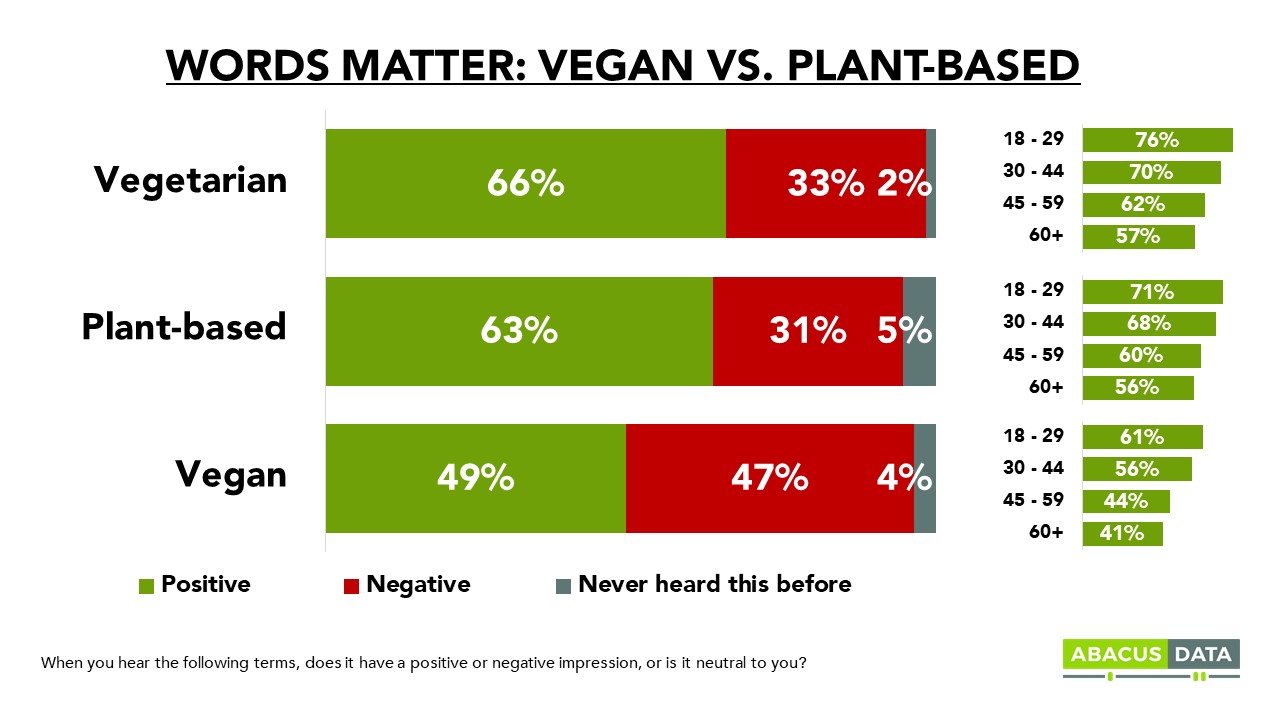
That doesn’t mean that those who do eliminate these products are free from scrutiny. The word ‘vegan’ carries a negative impression for half (47%) of consumers, 16-points higher than the term “plant-based”. Describing products and dishes as plant-based may find a wider audience than those described as vegan.
Younger Canadians are much more likely to view these terms with a positive view, compared to their older counterparts. Interestingly, the term ‘plant-based’ has a much more tepid response from Canadians. Only 31% of Canadians have a negative impression of ‘plant-based’.
But meat tastes good right?
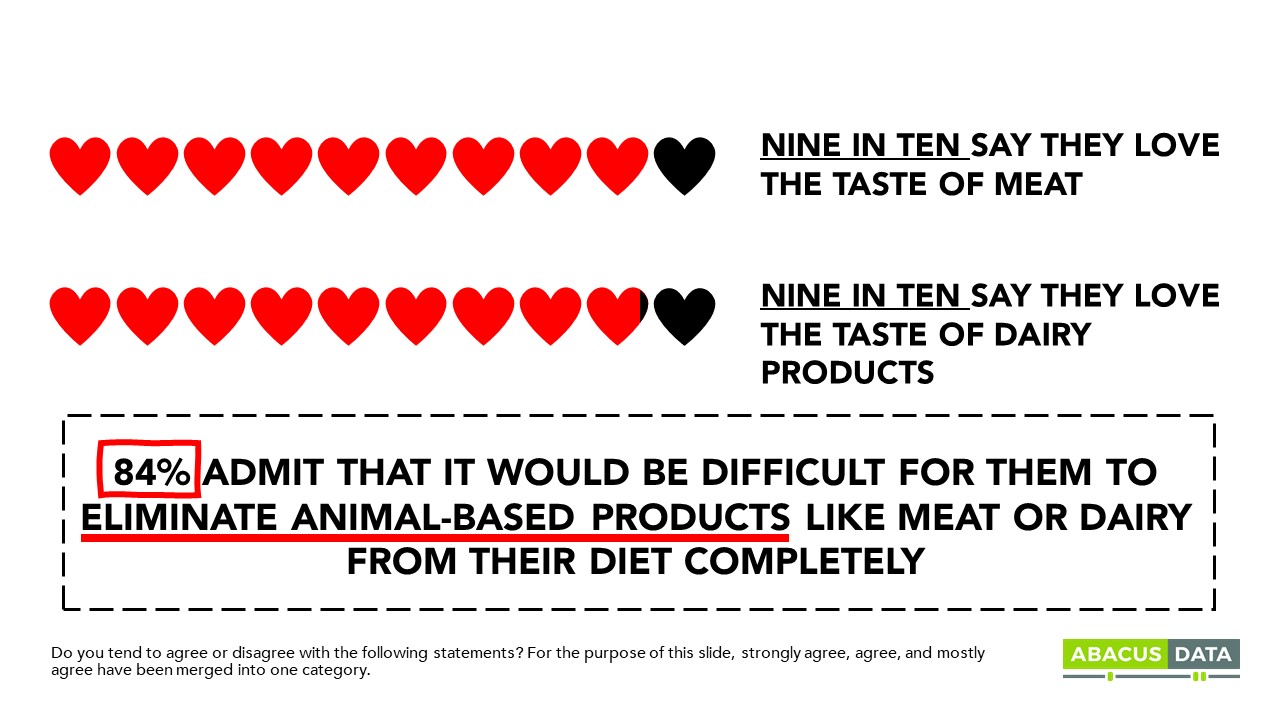
Despite a large number of consumers reducing the amount of meat they are consuming or many more considering a switch, taste is not a factor in that decision. Almost all Canadians (90%) agree they love the taste of meat and the taste of dairy products. When we ask consumers to consider two meals, one with meat and one with alternatives, far more say they meal with meat will taste better. Even young Canadians admit they love the taste of meat and dairy products. So a shift in preferences is not a shift in taste, but a response to both health considerations (for older consumers) and environmental and ethical ones (for younger consumers).
KEY TAKEAWAYS
The results of this study raise several points worth considering for those in the foodservice, retail, and agri-food sectors.
1- A large number of consumers are aware of the impact of the food choices they make – both on climate change and on animal welfare. Those concerns are likely to become more intense over time, especially as generational change continues to transform the market.
2- Health considerations are most important for older consumers who are looking to reduce the amount of meat they consume and find more balance in their diets.
3- Social pressure is an area to watch closely. The reaction to single-use plastics (straws) and the feeling of being “judged” for carrying around a drink container with a straw has forced consumers to be more sensitive to that issue. The same can happen to diet choices and a tipping point can develop that causes a rapid shift in consumption.
4- Ultimately, most Canadian consumers love the taste of meat and animal-based food products. They find comfort in them. They make them feel good and are perceived to be more satisfying that meatless or plant-based alternatives.
5- All this points to a potentially large and growing market for these plant-based alternatives. About 12.3 million Canadians (42%) say they are likely to purchase a meatless alternative meat product.
6- It also suggests a clear consumer demand for products that are more “hybrid” in nature. Think burgers that are half meat, half plant-based products. Consumers seeking to reduce their meat consumption may not want to eliminate those products completely from their diets but they may seek alternatives that allow them to get the enjoyment of meat without the health considerations and ethical/environmental judgement that might come with consuming them. Most feel it will be very difficult to eliminate all meat or animal-based products from their diets, but there’s an intent and willingness to reduce. Most Canadians already say they have or have considered reducing the amount of meat they eat.
7 – Most important in this data, in our opinion, is the deep generational divides on many of the attitudes and intentions. Millennials and Generation Z will not only force the market to react, but they may apply subtle or more aggressive pressure on their parents and loved ones to change their behaviour as well. The potential for generational contagion is real and could further accelerate shifts in consumer preferences.
Our sense is that the shift towards meatless alternatives is not a fad but a developing trend. As concern about climate change grows, so too will demand for food products that generate less carbon. That could mean growth in meatless/plant-based products and also increased expectations that those producing meat and animal-based food products will reduce their carbon footprints.
METHODOLOGY
Our survey was conducted online with 2,000 Canadians aged 18 and over from November 25 to 29, 2019. A random sample of panellists was invited to complete the survey from a set of partner panels based on the Lucid exchange platform. These partners are double opt-in survey panels, blended to manage out potential skews in the data from a single source.
The margin of error for a comparable probability-based random sample of the same size is +/- 2%, 19 times out of 20. The data were weighted according to census data to ensure that the sample matched Canada’s population according to age, gender, educational attainment, and region. Totals may not add up to 100 due to rounding.
ABOUT ABACUS DATA
We are the only research and strategy firm that helps organizations respond to the disruptive risks and opportunities in a world where demographics and technology are changing more quickly than ever.
We are an innovative, fast-growing public opinion and marketing research consultancy. We use the latest technology, sound science, and deep experience to generate top-flight research-based advice to our clients. We offer global research capacity with a strong focus on customer service, attention to detail and exceptional value.
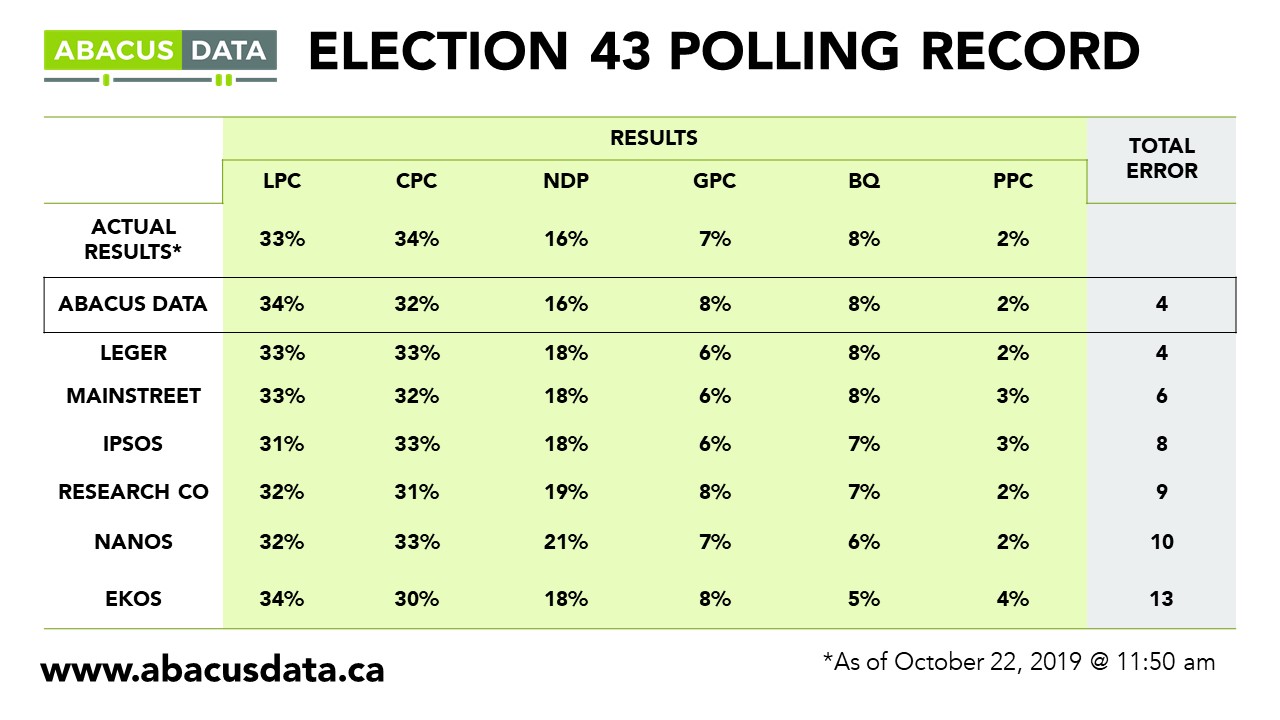
We were one of the most accurate pollsters conducting research during the 2019 Canadian Election.
Contact us with any questions.
Find out more about how we can help your organization by downloading our corporate profile and service offering.