Canadians recognize that regional wireless competitors have helped to reduce prices and believe further competition will reduce prices even more.
Téléchargez la version française
Earlier this month, we conducted a national public opinion survey commissioned by Shaw Communications on public perceptions and impressions about the wireless market in Canada.
Here’s what we found:
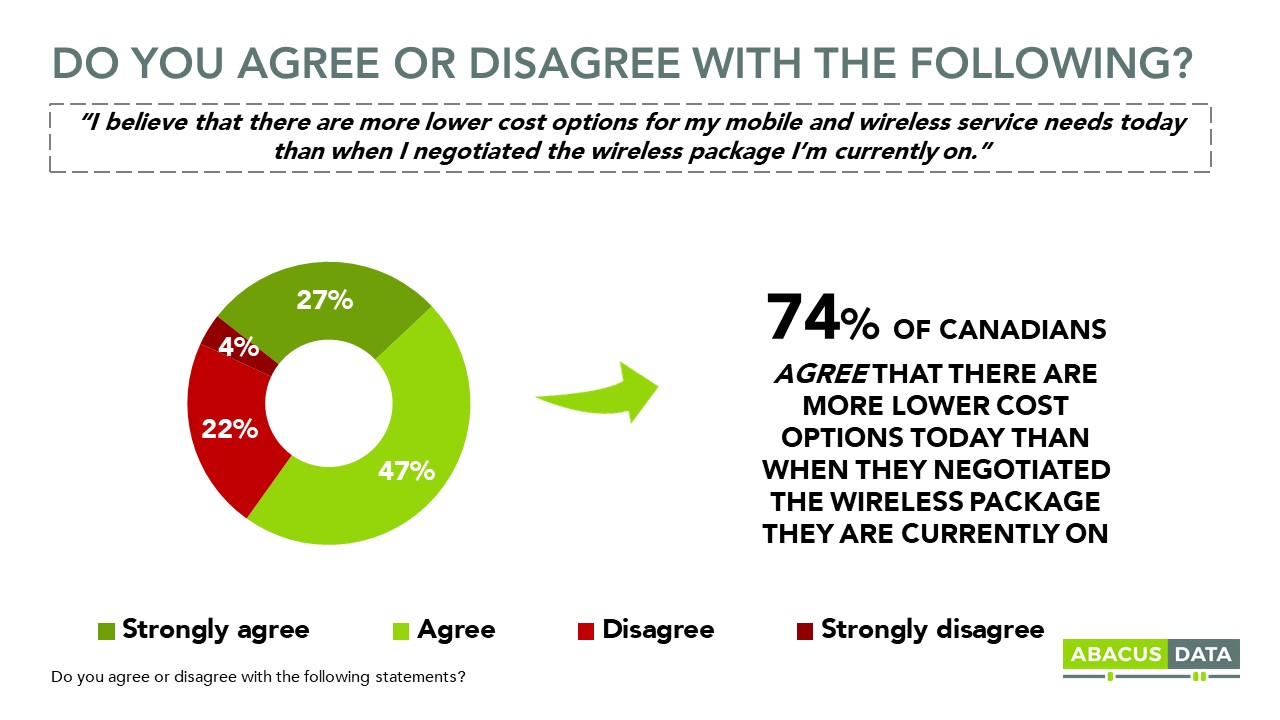
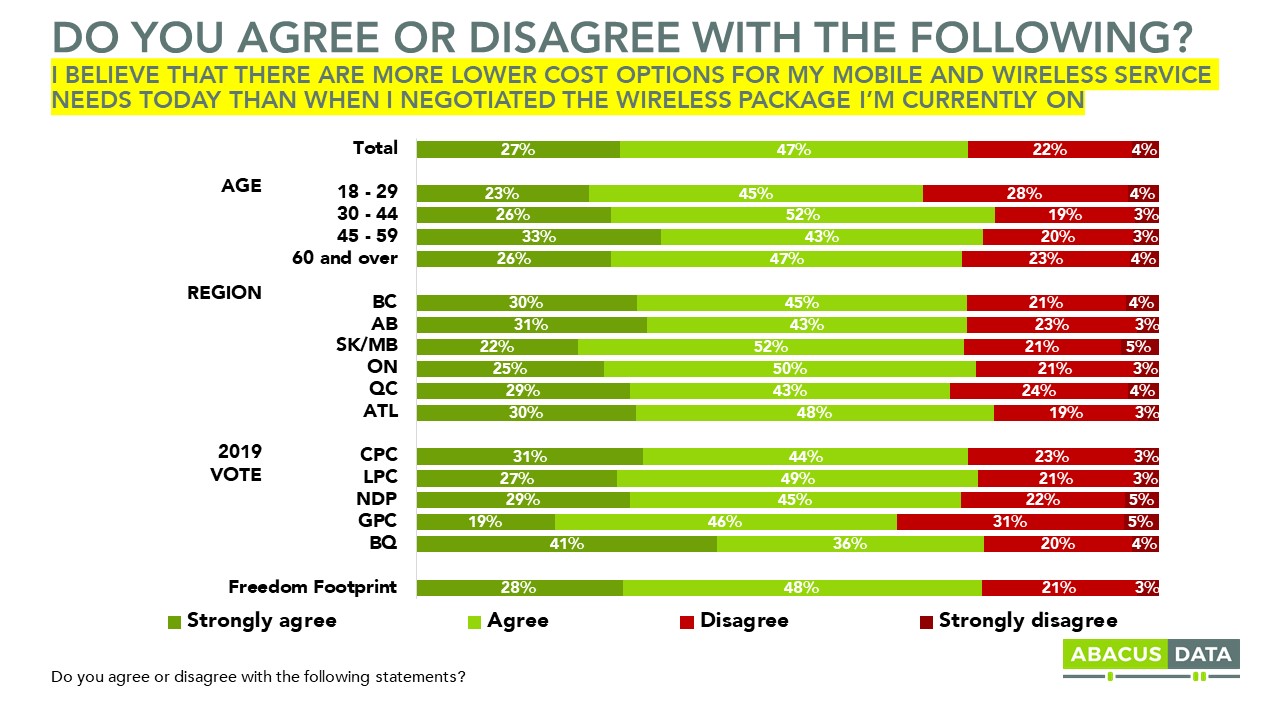
3 IN 4 CANADIANS BELIEVE THAT THEY CAN FIND LOWER COST OPTIONS FOR THEIR WIRELESS SERVICE THAN THE CONTRACT THEY ARE CURRENTLY ON.
This may seem counter-intuitive given other data that suggests consumers feel they pay too much for their wireless plans, but this is evidence that most consumers recognize that there are more affordable plans available in the marketplace. Canadians recognize that being a consumer in the market today would give them lower prices and more choice than the last time they were looking for a wireless plan.
If they were to look for a new plan, most feel they could find a lower cost option for their wireless service than their current plan.
This view is held consistently across the country, among all age groups, and by voters of all the major federal political parties.
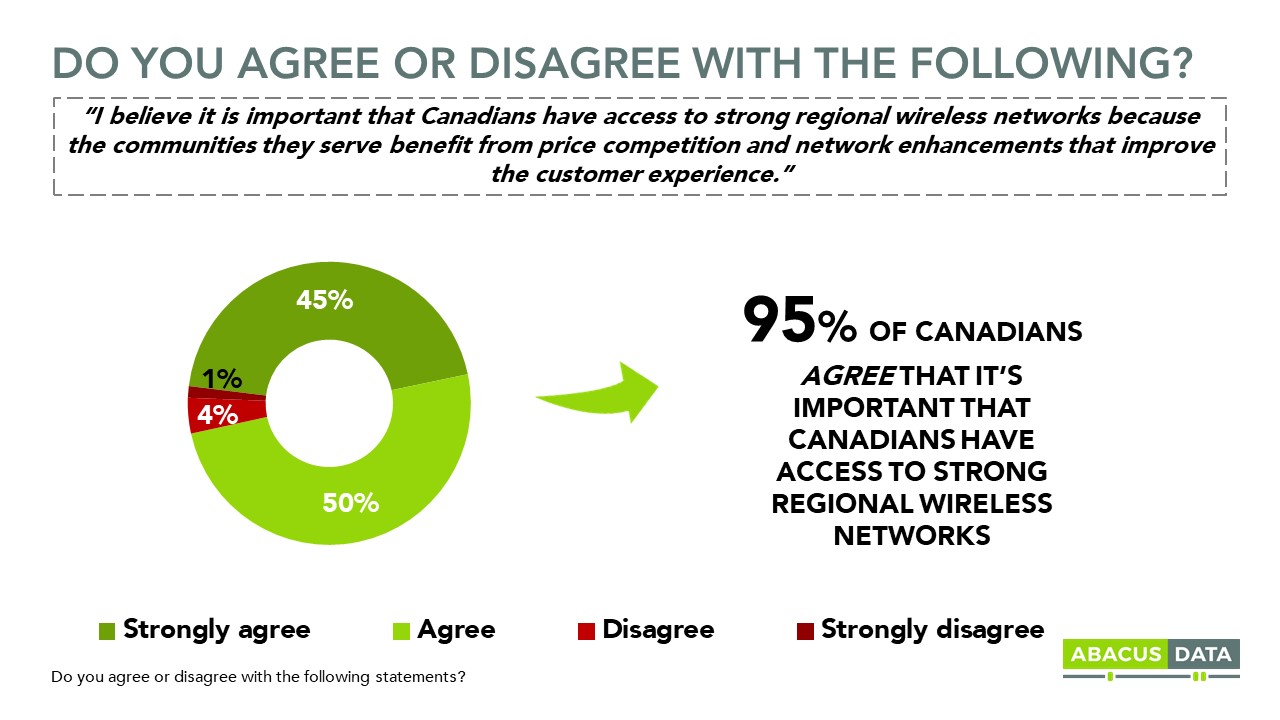
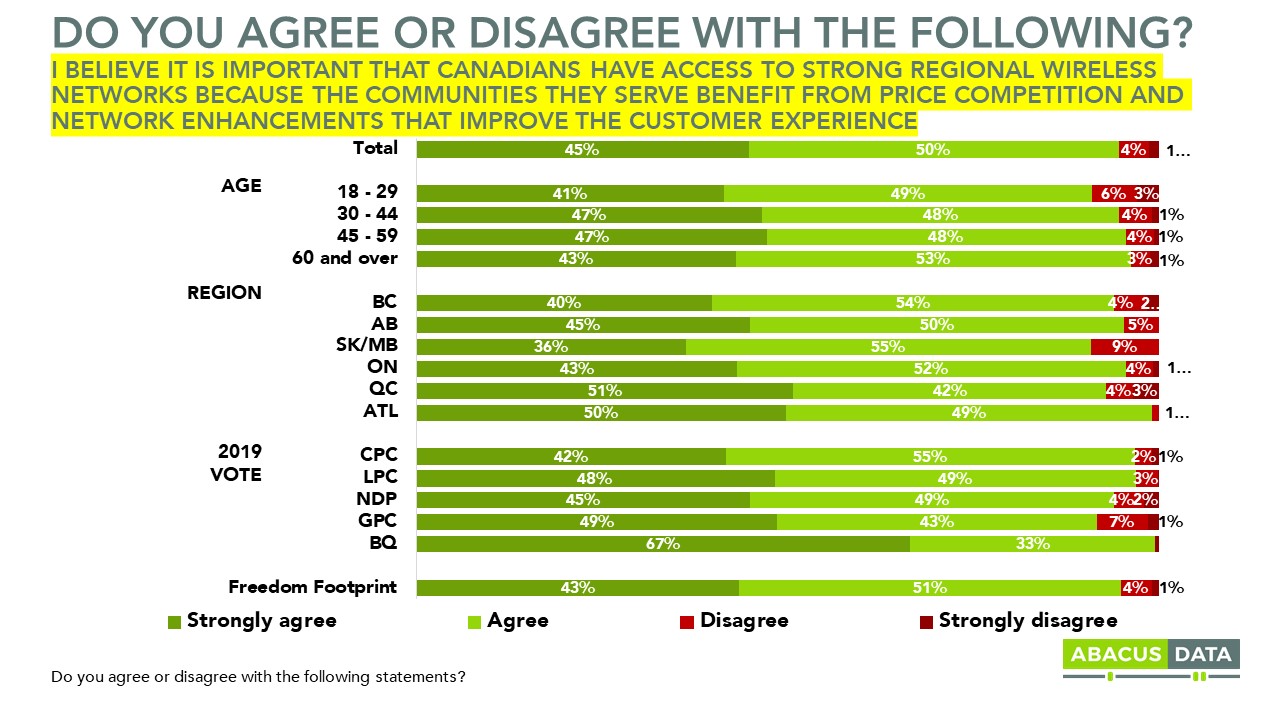
ALMOST ALL CANADIANS AGREE THAT IT’S IMPORTANT TO HAVE ACCESS TO STRONG REGIONAL WIRELESS SERVICES BECAUSE THEY INCREASE COMPETITION AND DELIVER BETTER CUSTOMER SERVICE.
Having access to strong regional wireless networks is important to Canadians across the country. Almost all agree that it is important for strong regional wireless networks to be available. There’s almost no variation in opinion on this point and is as likely to be seen as important by Albertans as it is by Quebecers.
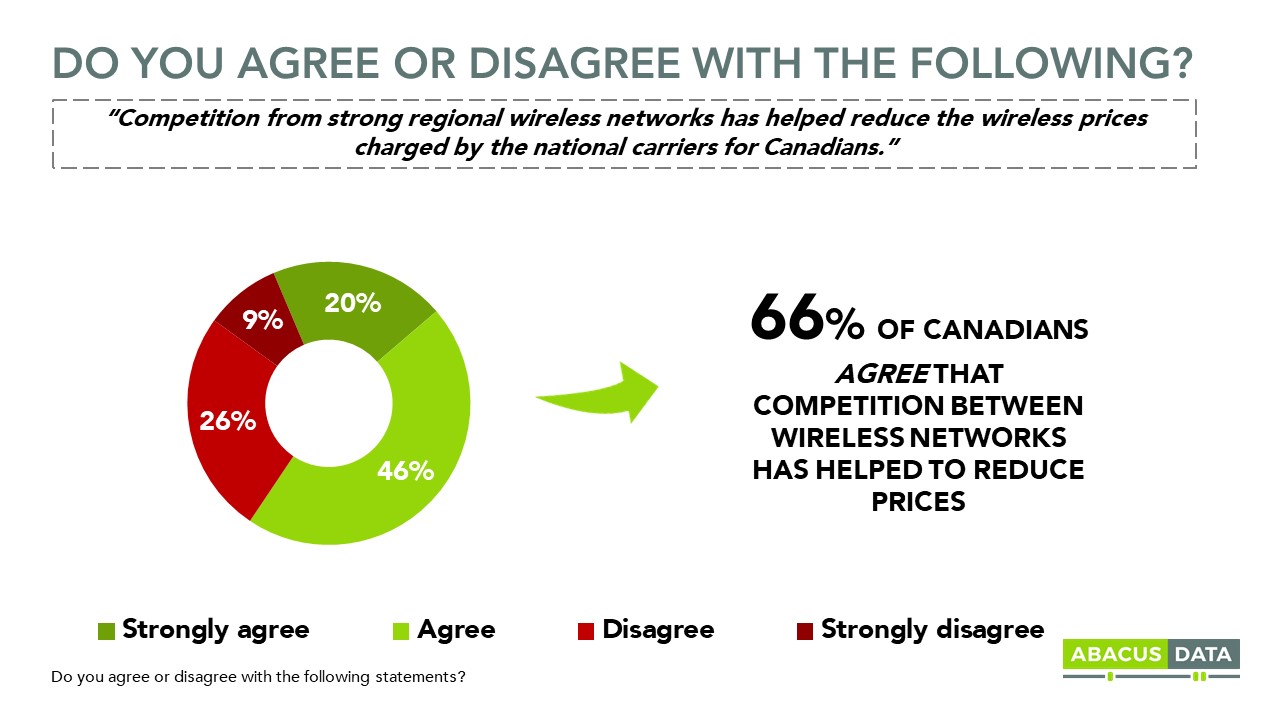
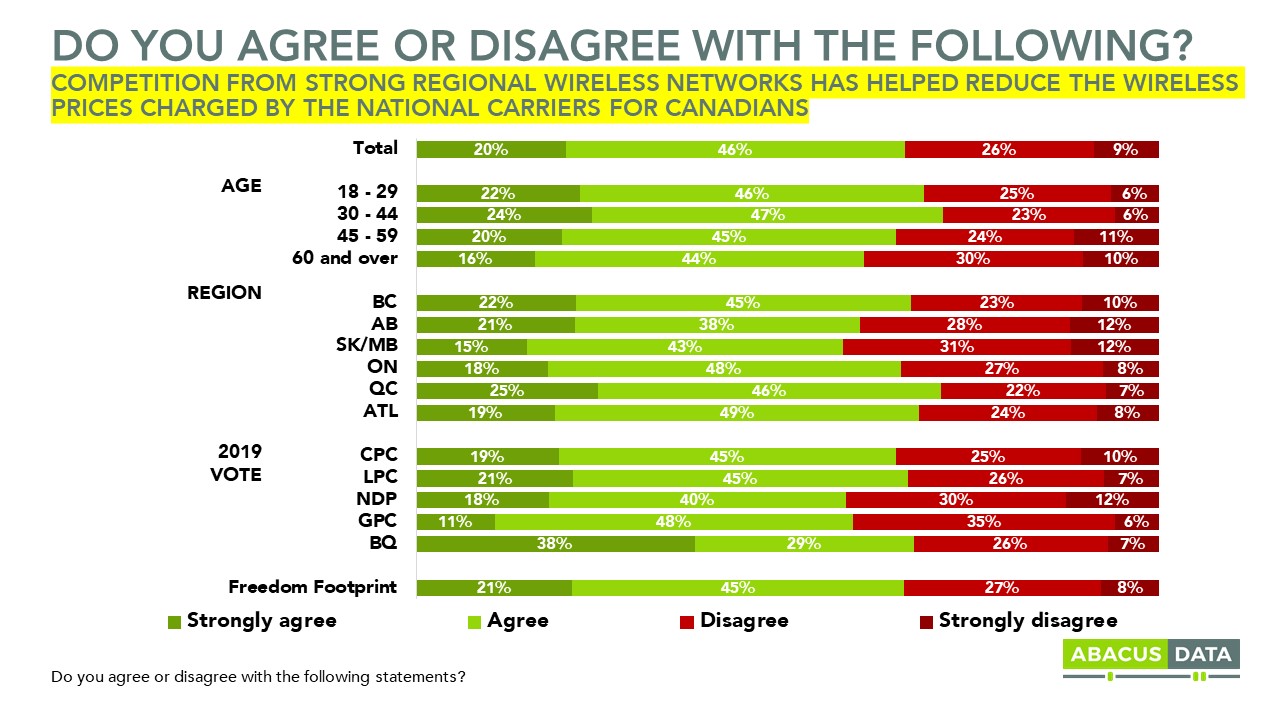
2 IN 3 CANADIANS AGREE THAT COMPETITION FROM REGIONAL WIRELESS COMPANIES HAS REDUCED PRICES CHARGED BY THE NATIONAL CARRIERS.
One reason that Canadians value having strong regional wireless network options is because most see a direct connection between reduced prices charged by the national carriers and increased regional competition by regional companies. More striking, those that strongly agree with this idea outnumber those who strongly disagree by a 2 to 1 margin.
Once again, these views are held fairly consistently across the country. Quebec consumers are the most likely to strongly agree similar to those in British Columbia and Alberta, while those in Saskatchewan and Manitoba are the least likely to agree.
Politically, Liberal, Conservative, and NDP supporters, and especially BQ supporters, agree with the premise that regional competition has helped drive wireless prices down.
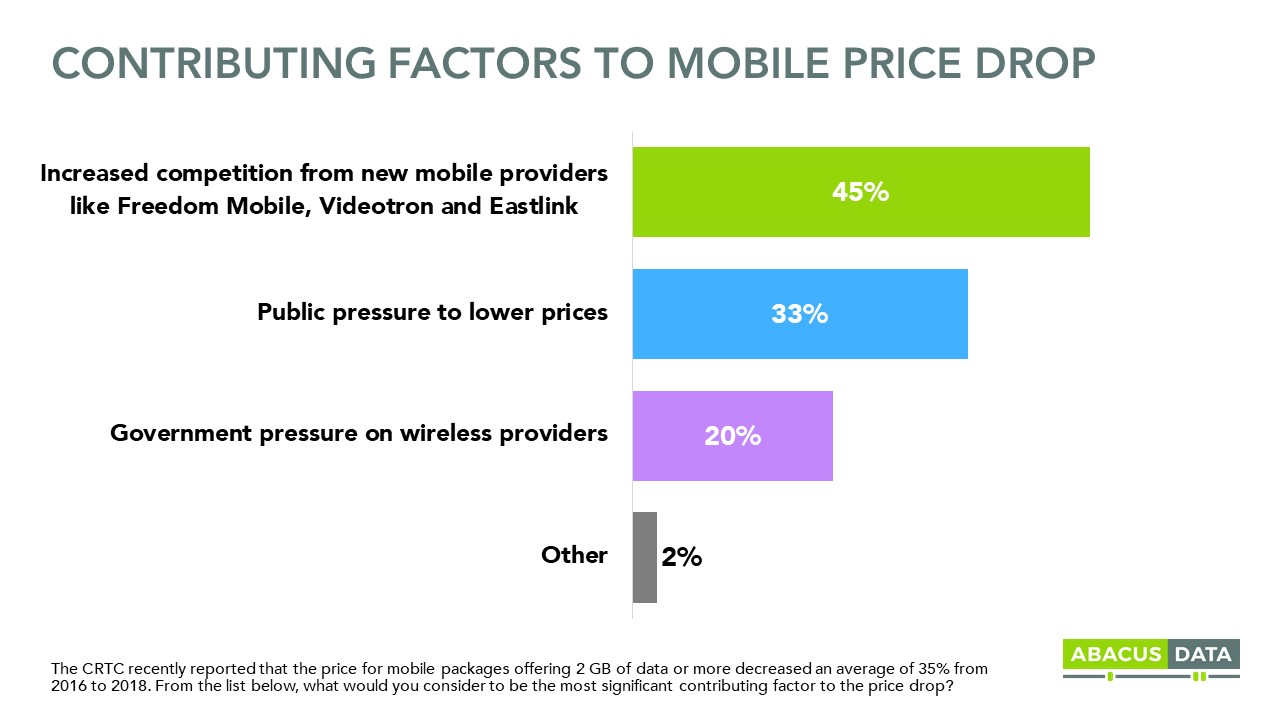
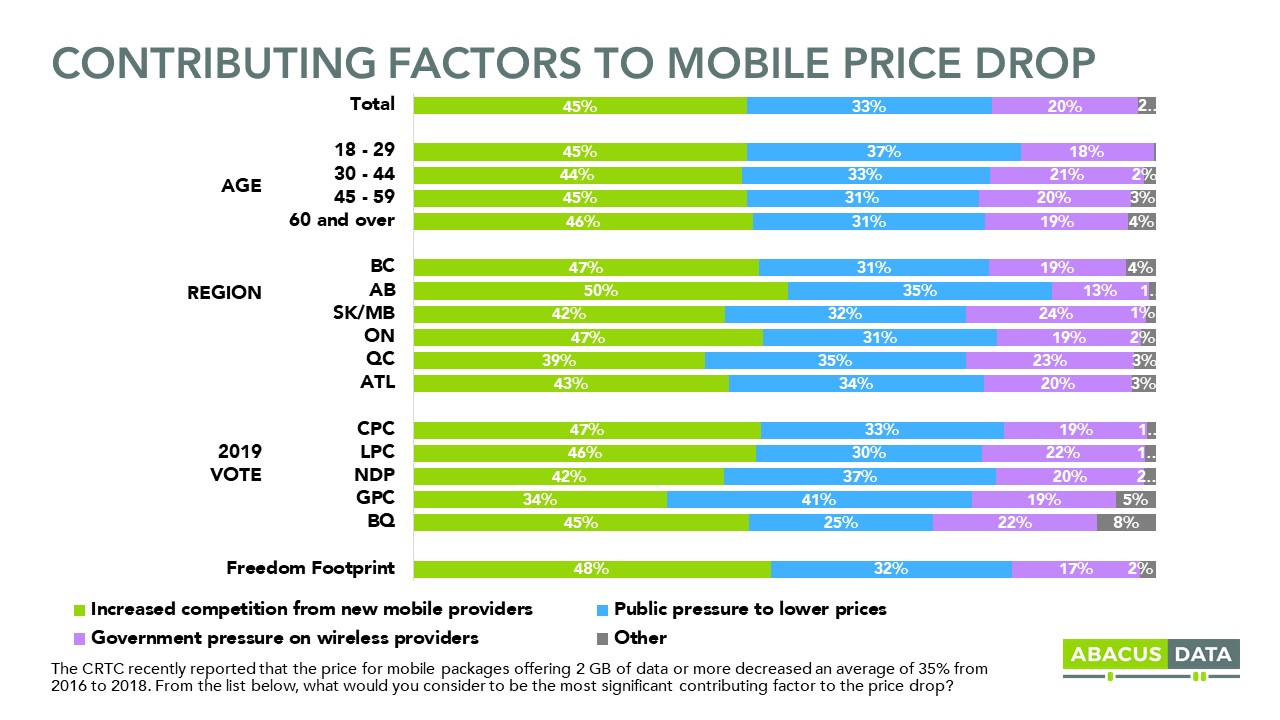
ALMOST HALF OF CANADIANS CREDIT REGIONAL COMPETITION FOR THE 35% REDUCTION IN WIRELESS PRICES REPORTED BY THE CRTC SINCE FROM 2016 TO 2018. THIS IS MORE THAN SAY PUBLIC OR GOVERNMENT PRESSURE WAS THE PRIMARY CAUSE.
When we tell respondents that the CRTC’s own report finds that wireless prices have reduced by 35% from 2016 to 2018, and then ask what they feel is most responsible for this, 45% credit increased competition from new mobile or wireless providers like Freedom Mobile, Videotron, and Eastlink. One in three believes public pressure to lower prices has reduced rates, while 20% think government pressure on wireless providers has been the primary factor in the mobile price drop over the three years.
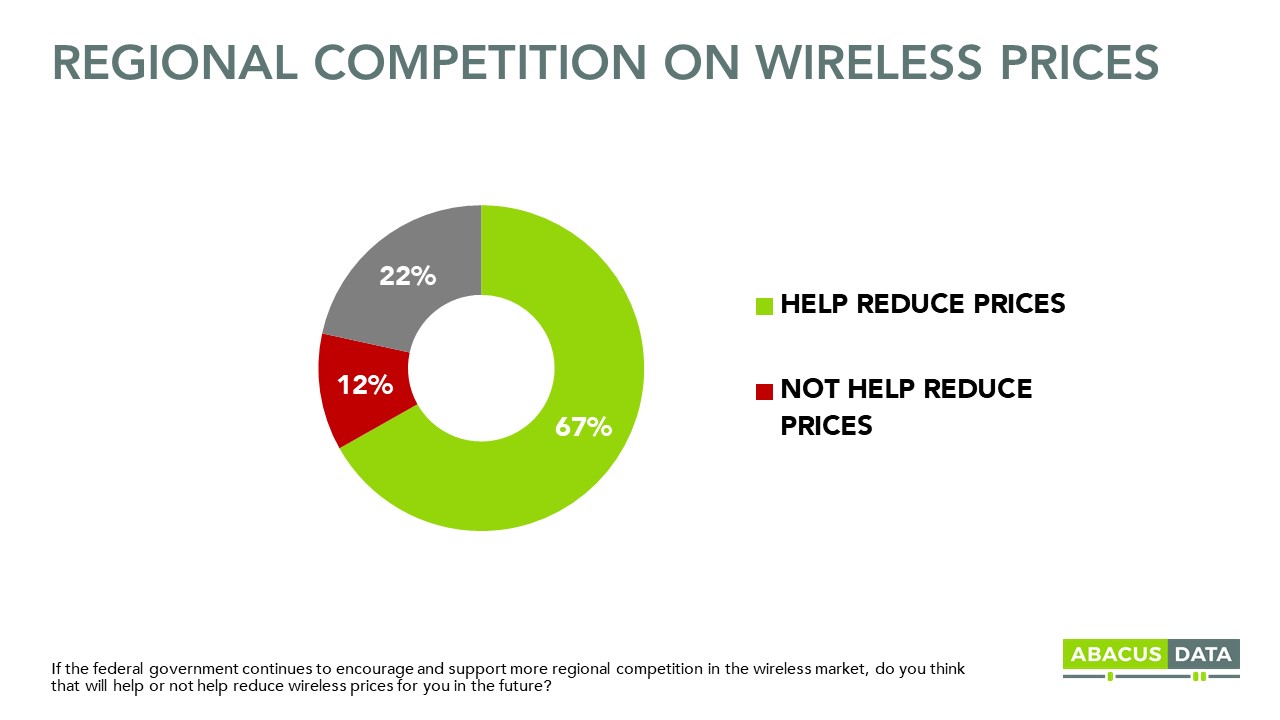
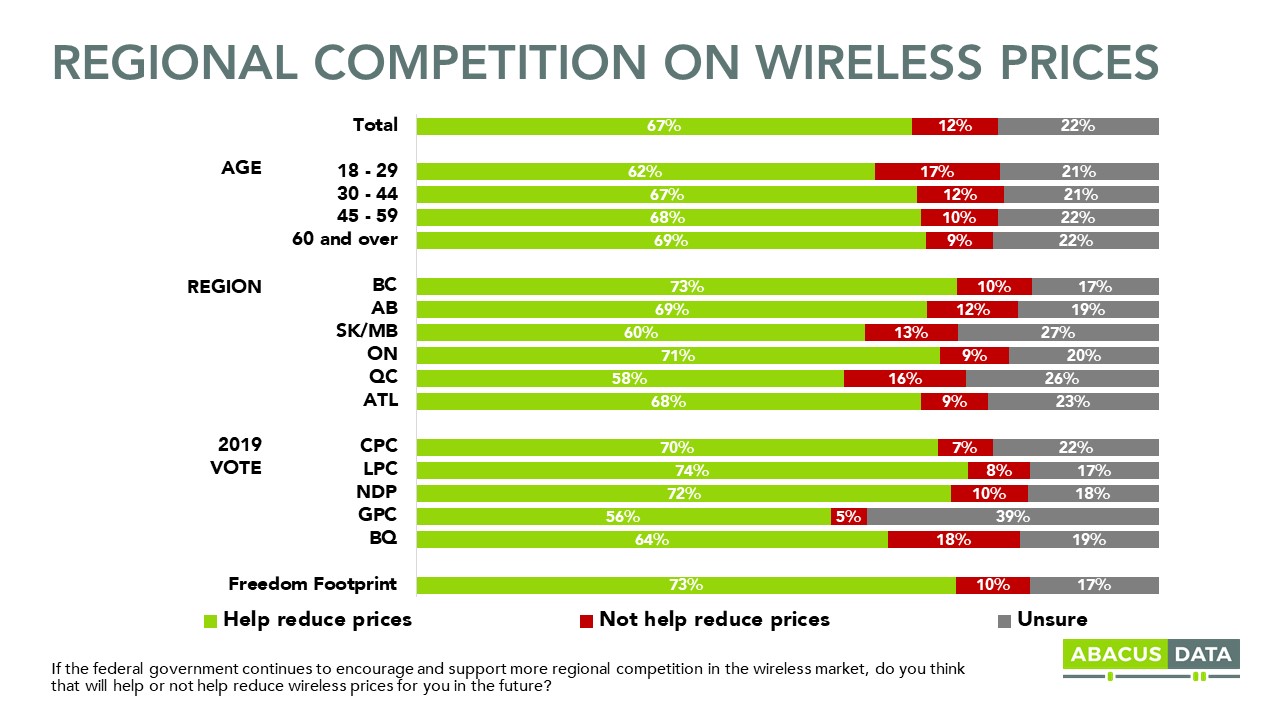
MORE REGIONAL COMPETITION = LOWER PRICES: 2 IN 3 THINK IF THE FEDERAL GOVERNMENT ENCOURAGES AND SUPPORTS MORE REGIONAL COMPETITION, PRICES WILL DROP FURTHER.
At the same time that most Canadians see a link between increased regional competition and price decreases over the past few years, there’s also a widespread belief that if the government continues to encourage and support more regional competition in the wireless market, prices will continue to fall.
Two in three think that federal government encouragement and support of regional competitors will help to reduce prices. Only 12% feel that kind of action will not help to reduce prices.
This view, between government support for regional competition and reduced prices, is shared by Canadians across the country. 73% in BC, 69% in Alberta, 71% in Ontario, 68% in Atlantic Canada, and 58% in Quebec share this view. There is also wide agreement across political lines – 74% of Liberal voters, 72% of NDP voters, 70% of Conservative voters, and 64% of Bloc voters all believe that government support for more regional competition will help prices drop in the wireless market.
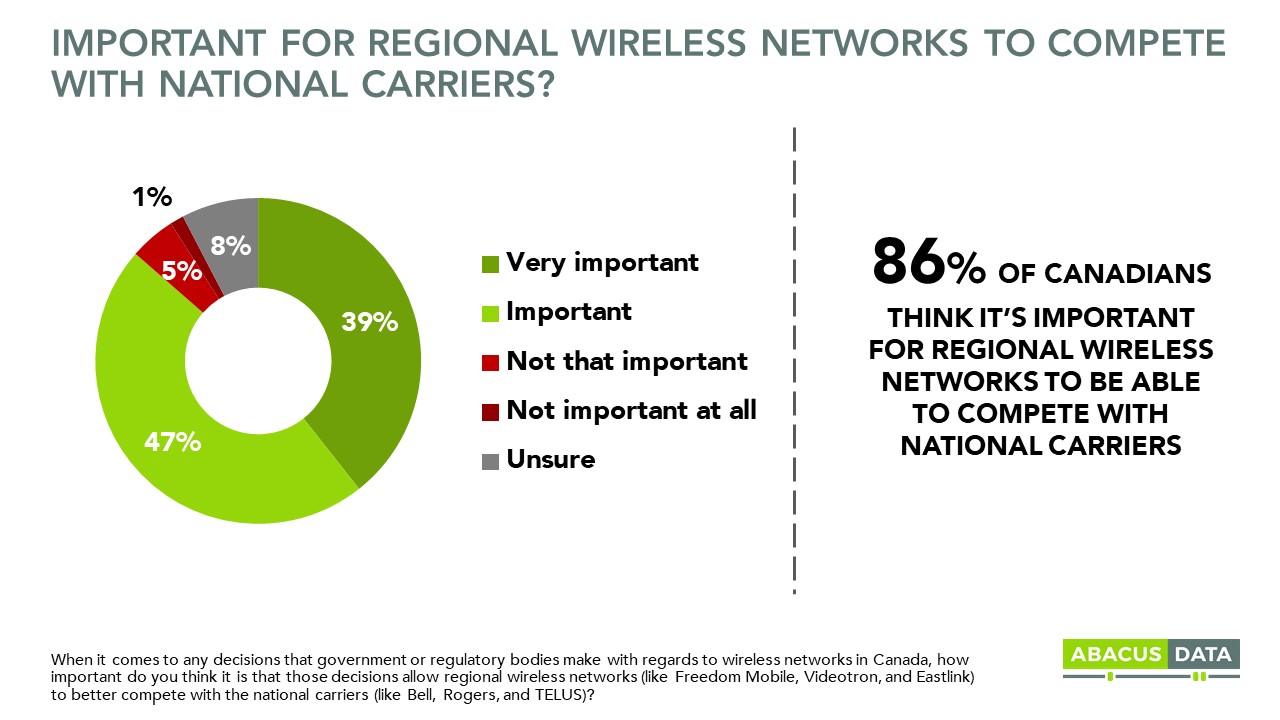
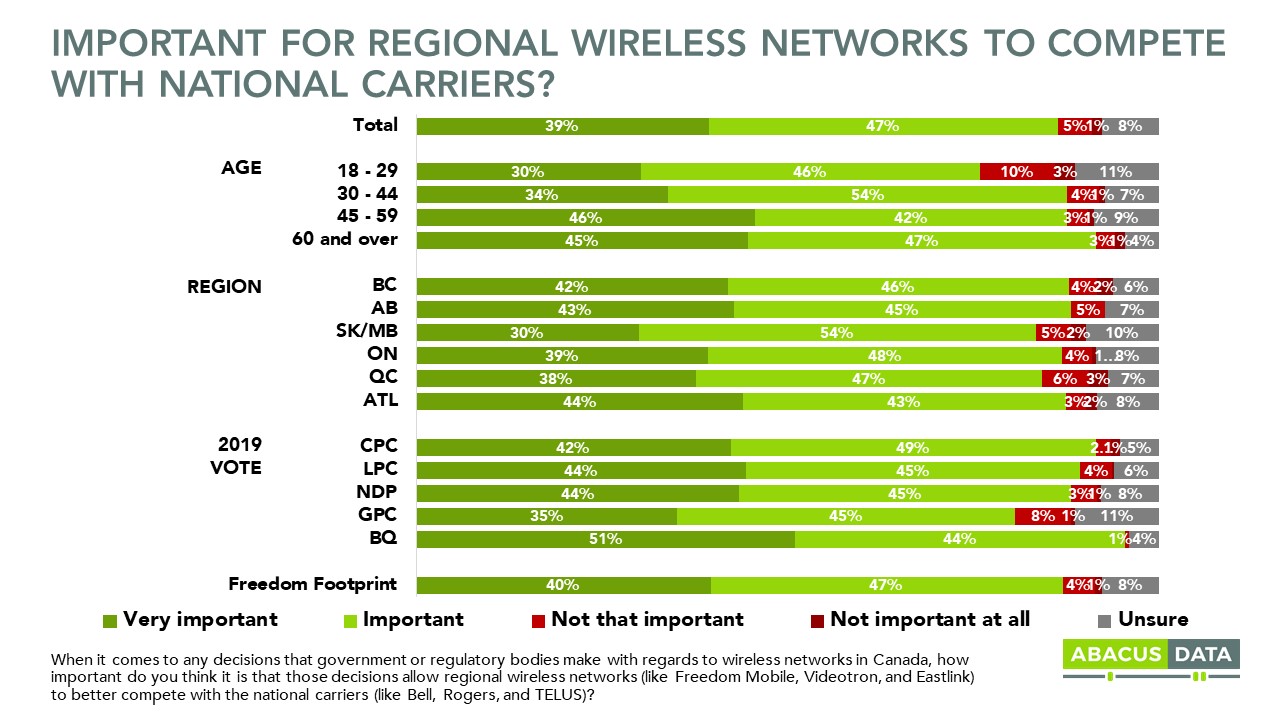
CANADIANS OVERWHELMINGLY WANT GOVERNMENT TO ALLOW REGIONAL CARRIERS TO COMPETE AGAINST THE NATIONAL COMPANIES.
When it comes to any decisions that government or regulatory bodies make with regards to wireless networks in Canada, 86% of Canadians think it is important that those decisions allow regional wireless networks (like Freedom Mobile, Videotron, and Eastlink) to better compete with the national carriers (like Bell, Rogers, and TELUS).
Views are consistent across the country but are more intense in Atlantic Canada, Alberta, and British Columbia.
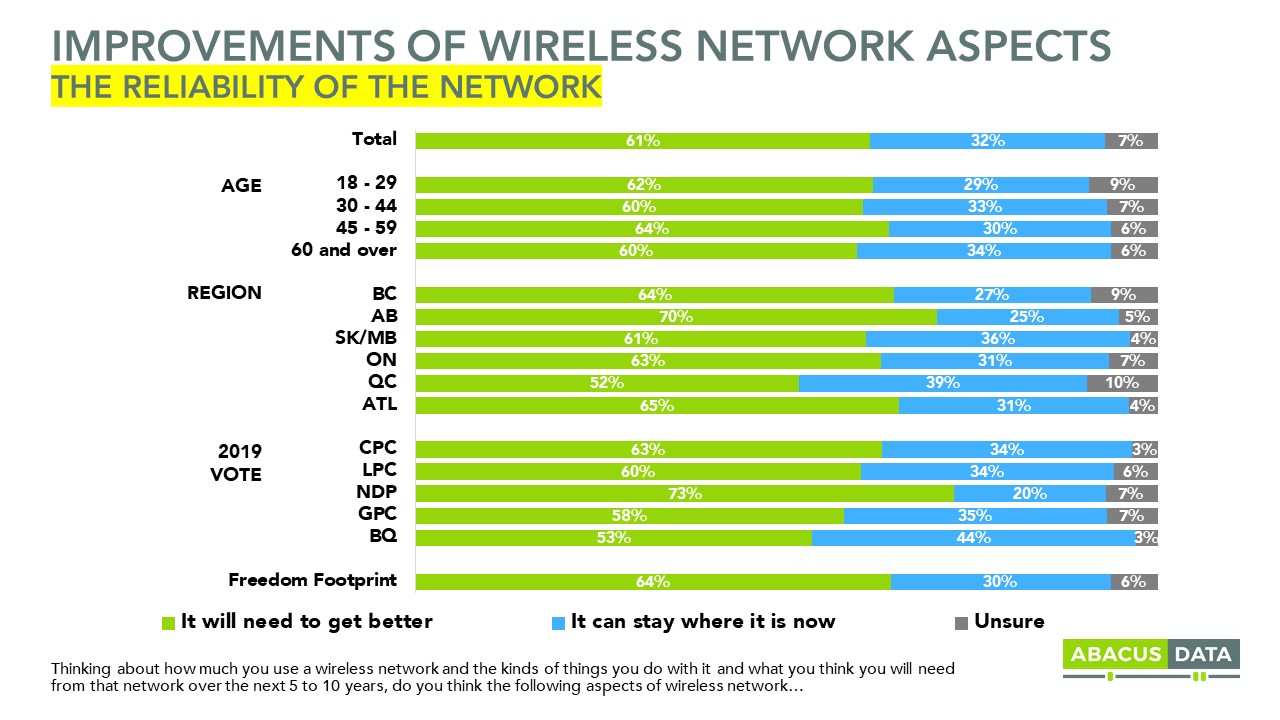
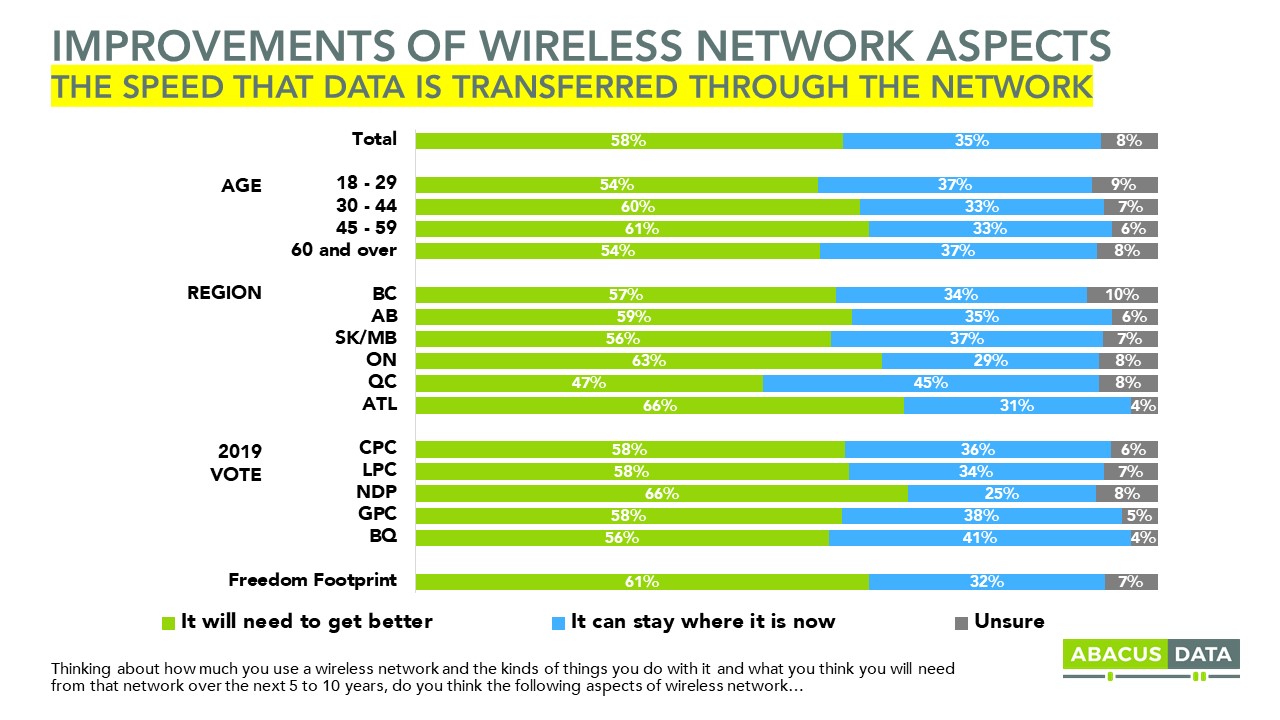
KEEP INVESTING IN WIRELESS NETWORKS: MOST CANADIANS BELIEVE THAT WIRELESS NETWORKS WILL NEED TO BE FASTER, MORE RELIABLE, AND HAVE WIDER COVERAGE IN THE FUTURE THAN THEY DO NOW.
At the same time that Canadian consumers believe regional competition has and will continue to reduce prices for wireless or mobile services, there is also a broad recognition that the quality of the wireless networks over time will need to improve, given how people expect their use of the network to change over time.
65% of Canadian consumers believe that the geographic coverage of the wireless network will need to get better over the next 5 to 10 years. 61% feel the same way about the reliability of the network. And 58% think that the speed that data is transferred through the network will have to improve.
And so while Canadians want both affordable prices through competition, they also want public policy choices that allow for the wireless networks they rely on to be improved because they believe they will need more reliable and faster networks with broader coverage in the future.

UPSHOT
We often hear that Canadians are frustrated with the price they pay for wireless services that they depend on. And past research we have done confirms that. But that frustration isn’t isolated only to wireless; they are also frustrated with the amount they have to pay for most of the things they need in their lives including housing, food, utilities, and financial service fees.
Shopping for a cell phone plan today is very different than even a year ago. Consumers say they see today prices that are lower than the last time there were in the market
Despite this, Canadians consumers are feeling an affordability crunch, and so it’s important for both government and industry to respond and find a way to alleviate this pressure.
What our research finds is that consumers see the benefits of increased regional competition. Most feel they could find a lower price for wireless services than they pay now if they could get out of their current contract. Most believe that strong regional competition is important to improving service quality, customer service, and lowering prices. Most believe that increased regional competition has worked to reduce prices by putting pressure on the national carriers to reduce their own prices in response to regional competition.
More important, 2 in 3 Canadians believe that if the federal government focuses on encouraging regional competition and supporting regional carriers, prices will continue to drop.
The fact that more consumers believe regional competition is the primary factor in the 35% wireless price drop reported by the CRTC between 2016 and 2018 than either public or government pressure confirms these other perspectives. Canadians instinctively understand that when you increase competition, prices will drop.
But at the same time, public policy choices need to reflect the fact that consumers expect their use of wireless networks to increase over time and so investment in those networks will be an important guide in how they respond to those policy choices. Finding a balancing between helping to make wireless more affordable while delivering the network quality consumers expect and need is the objective for federal policymakers today.
METHODOLOGY
Our survey was conducted online with 1,850 Canadians aged 18 and over from January 30 to February 2, 2020. A random sample of panellists was invited to complete the survey from a set of partner panels based on the Lucid exchange platform. These partners are double opt-in survey panels, blended to manage out potential skews in the data from a single source.
The margin of error for a comparable probability-based random sample of the same size is +/- 2.3%, 19 times out of 20. The data were weighted according to census data to ensure that the sample matched Canada’s population according to age, gender, educational attainment, and region. Totals may not add up to 100 due to rounding.
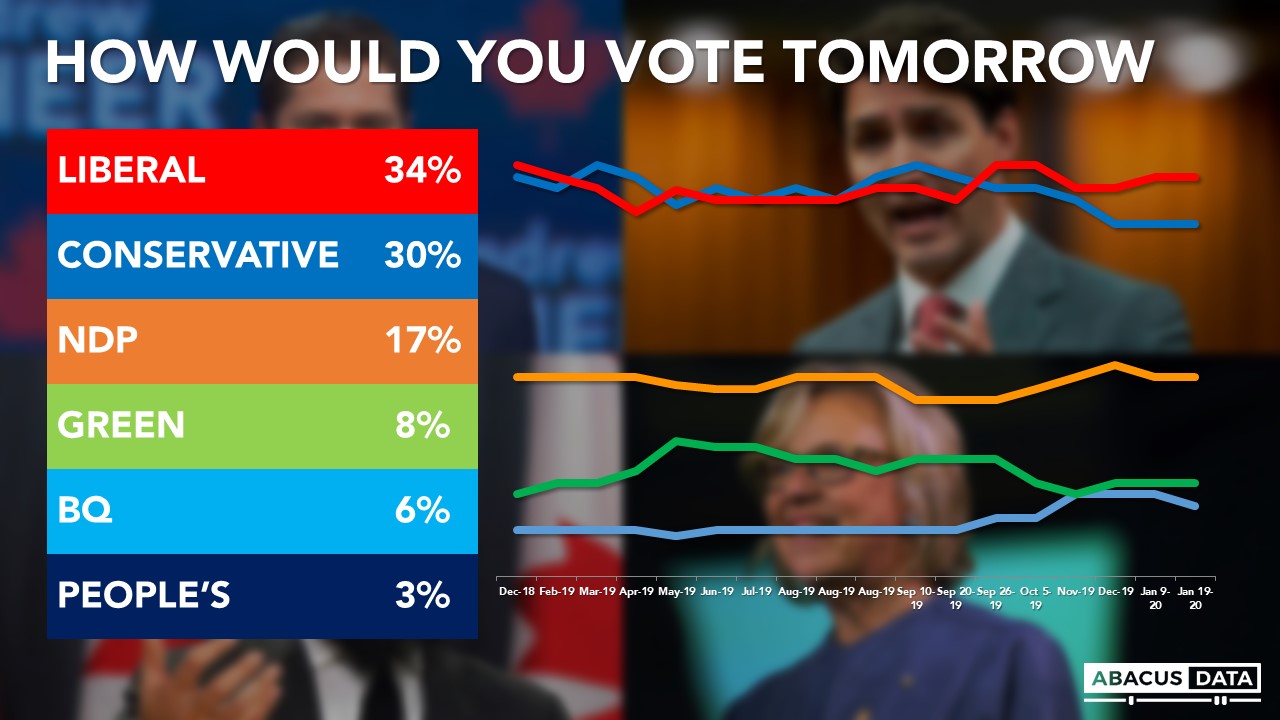
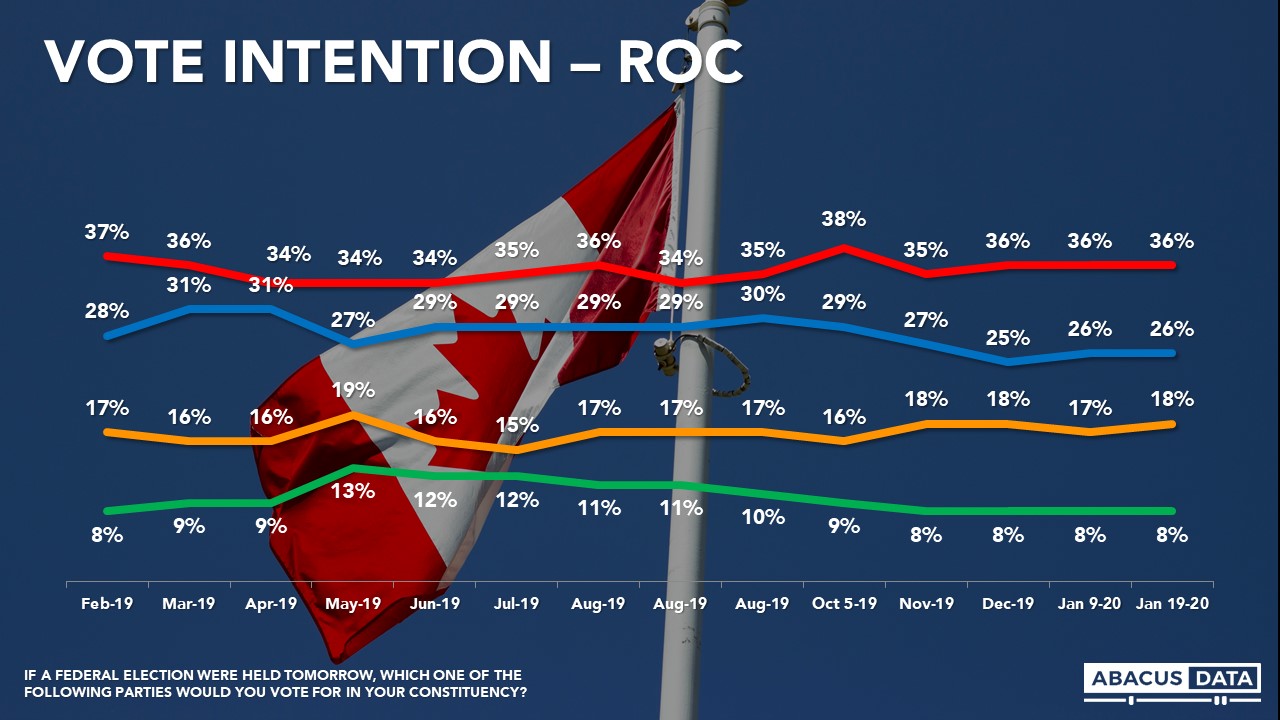
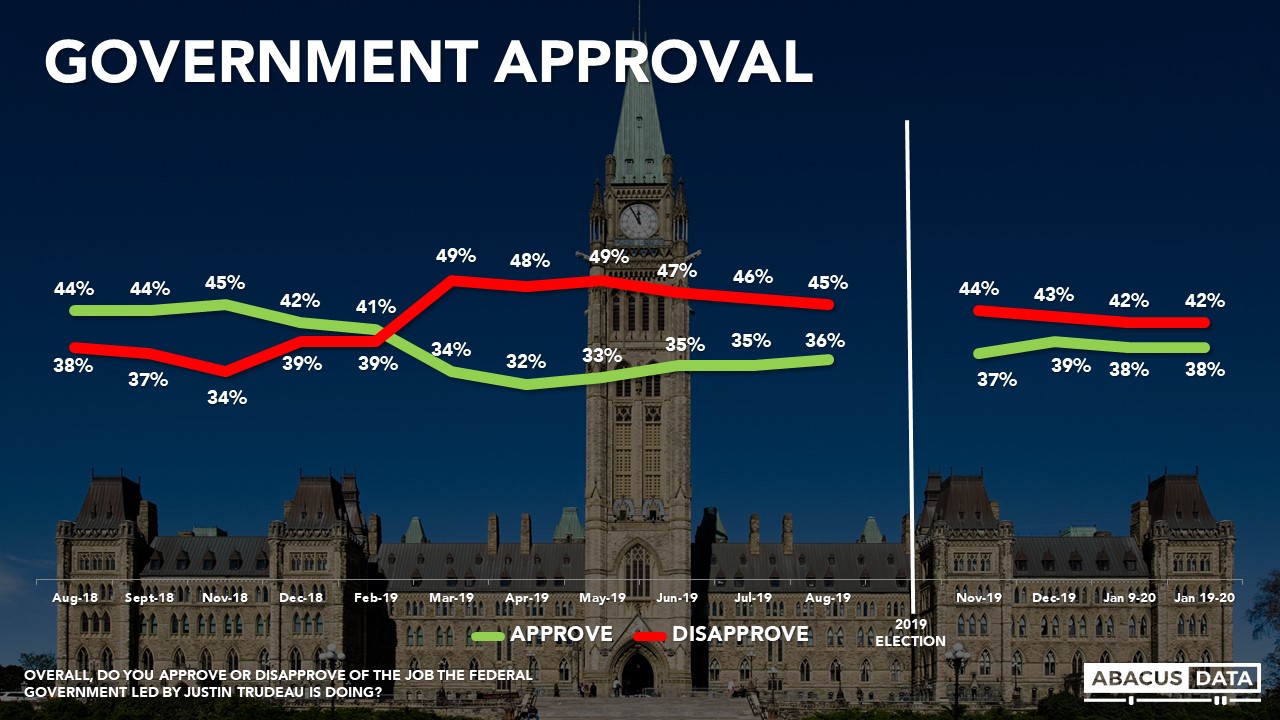
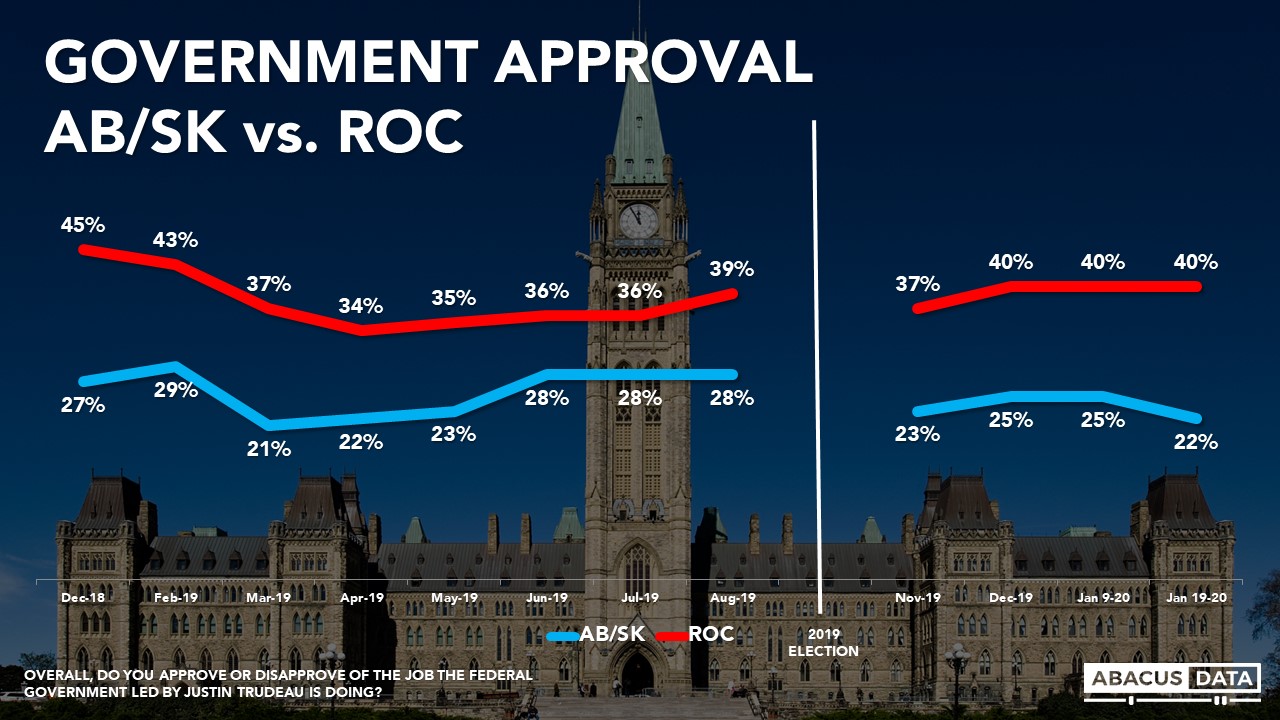
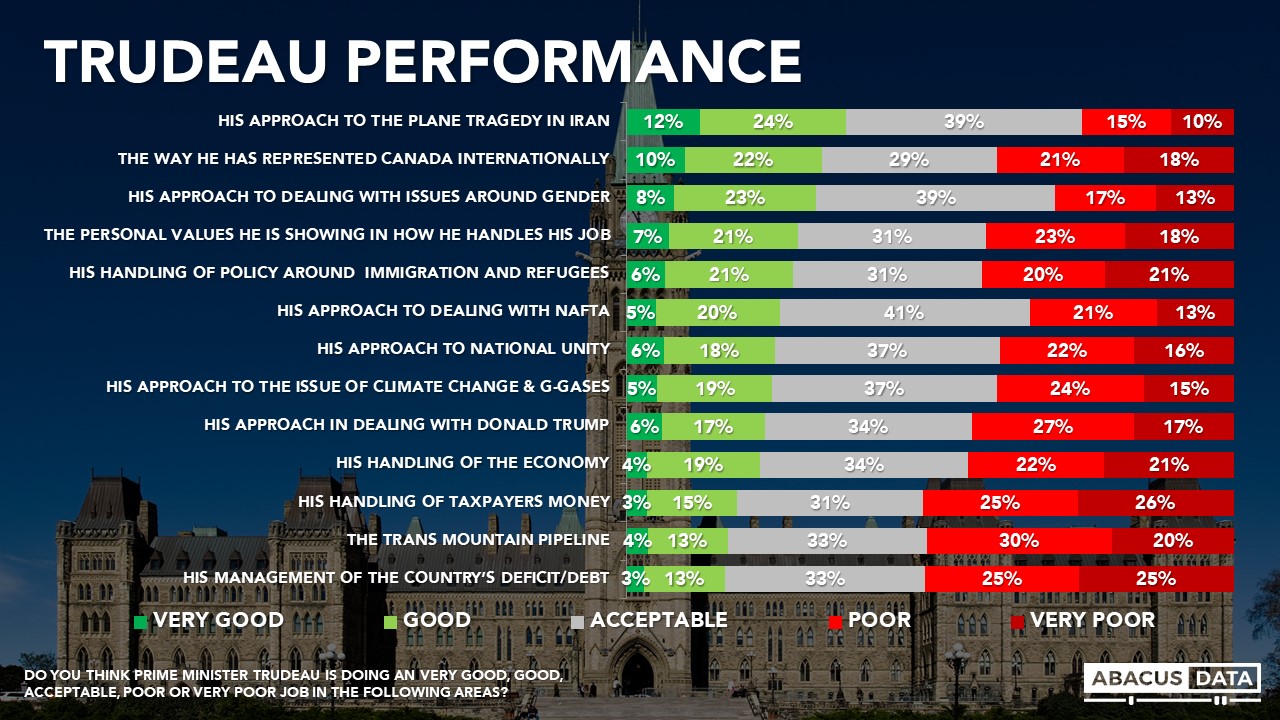
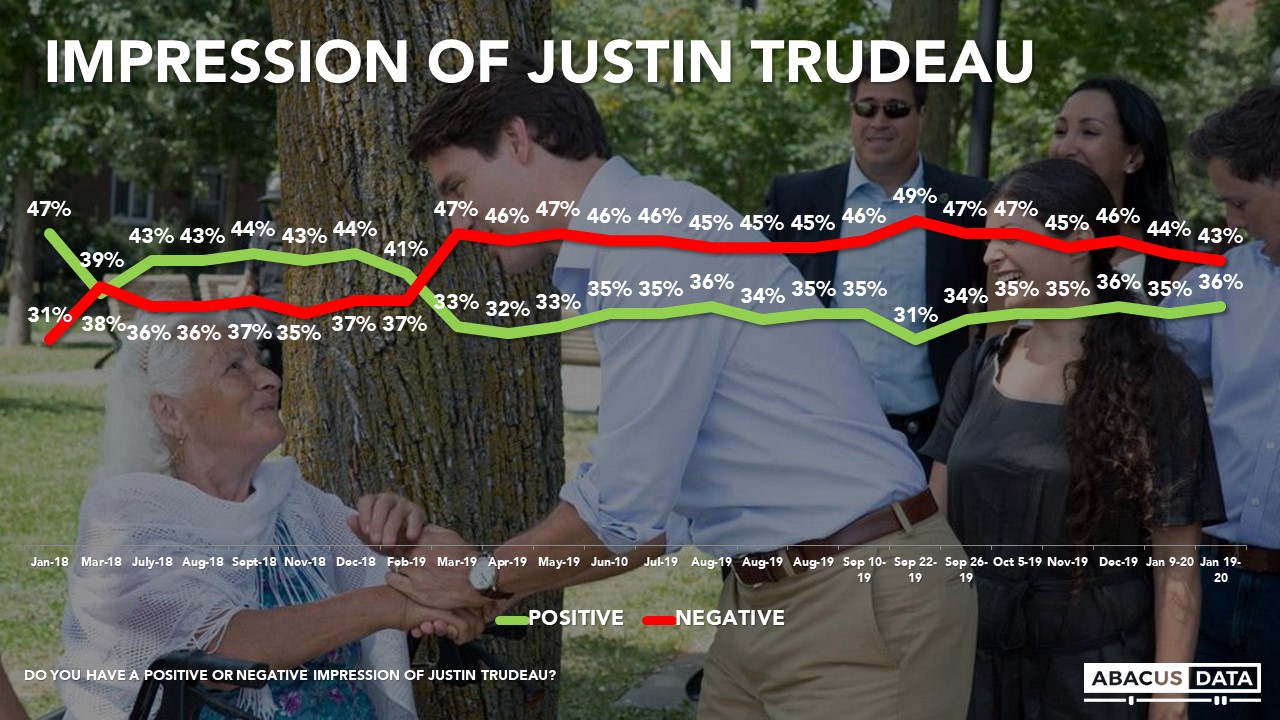
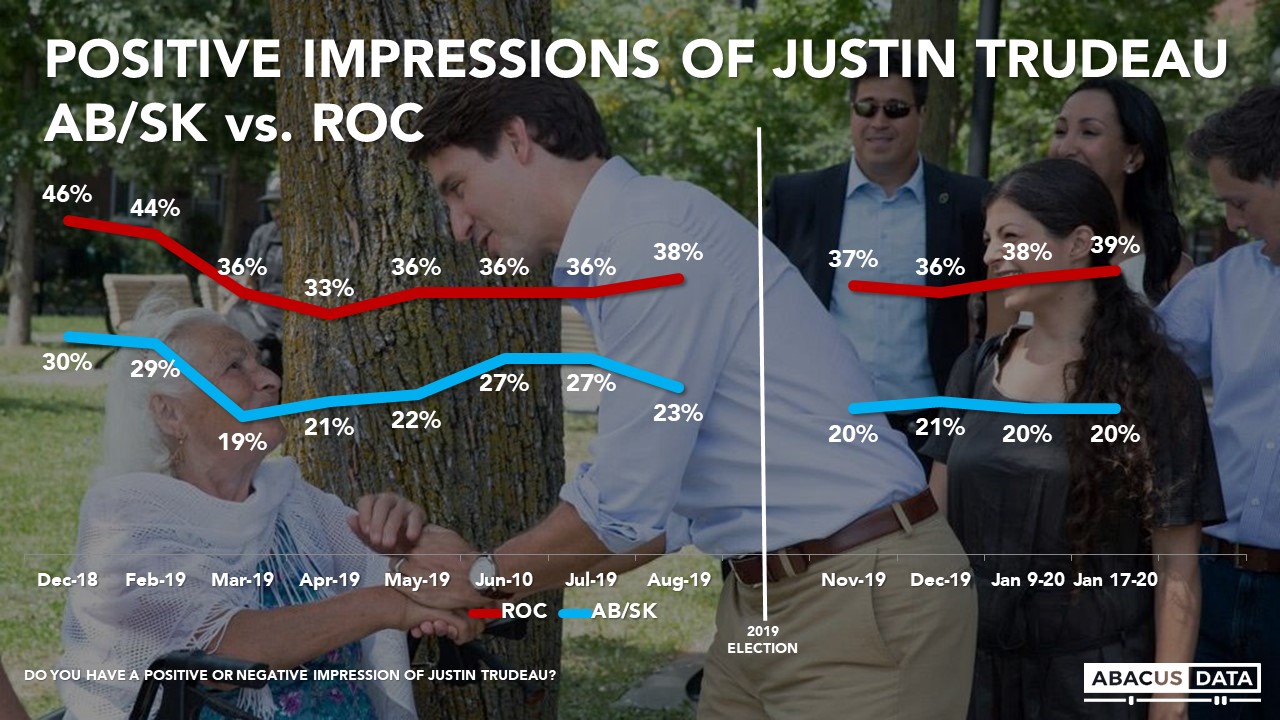
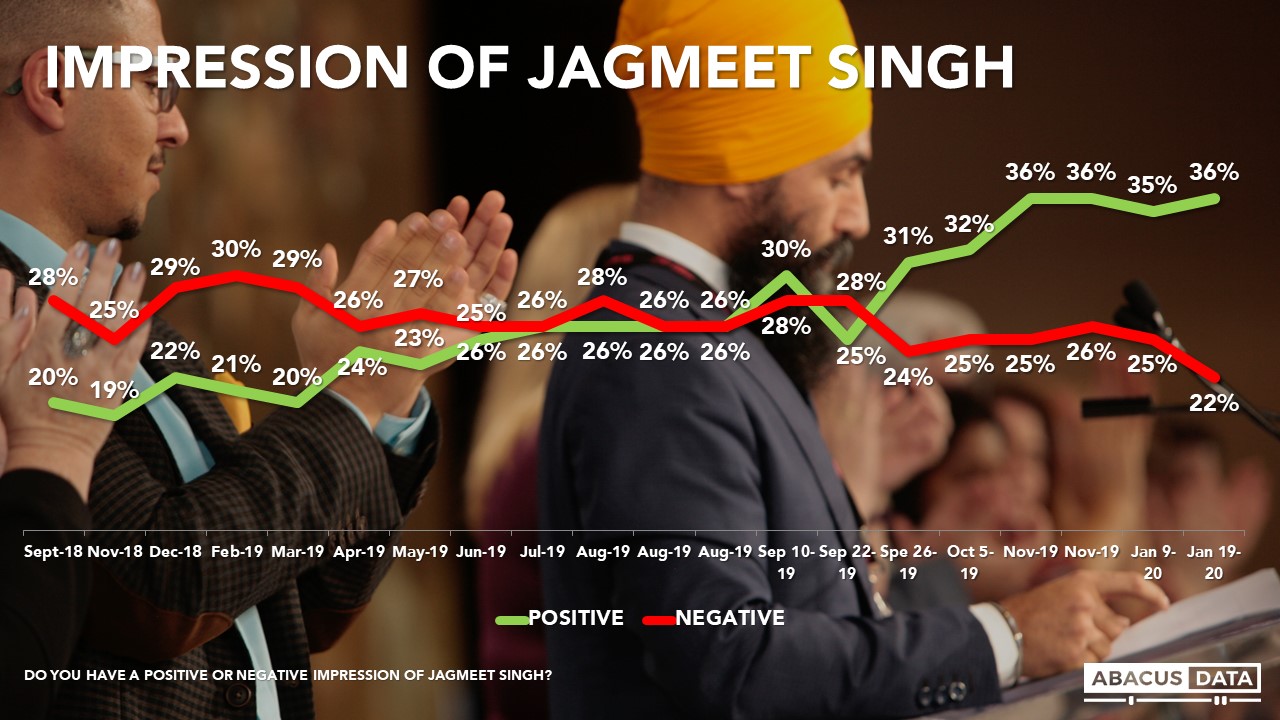
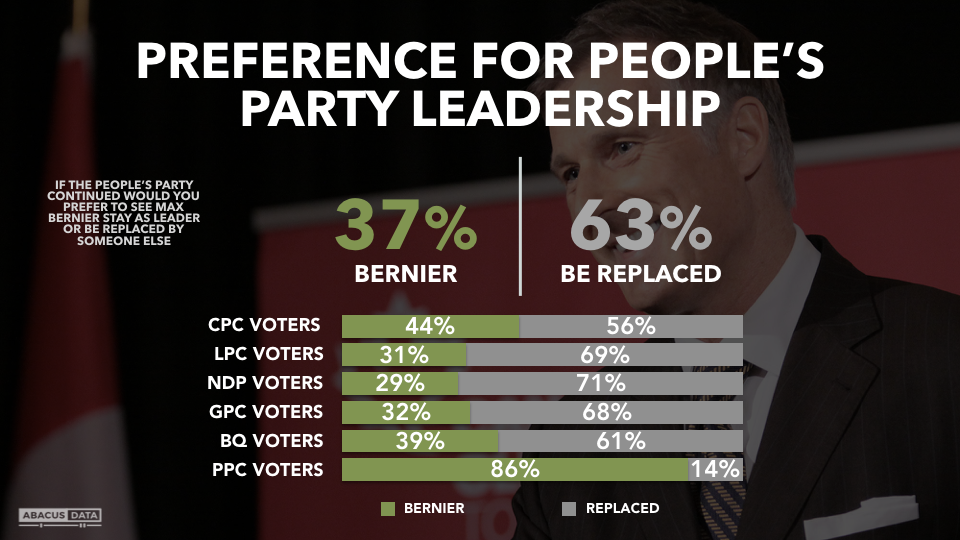
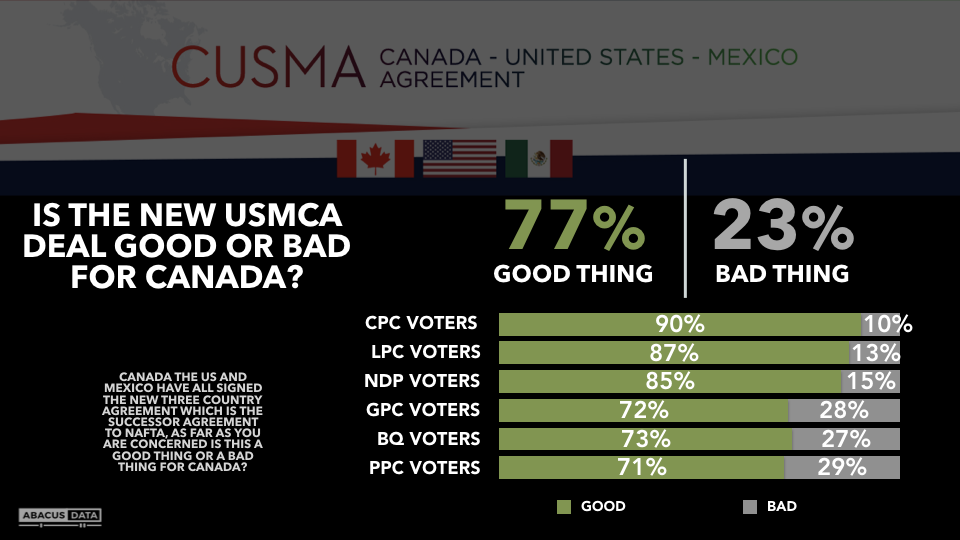
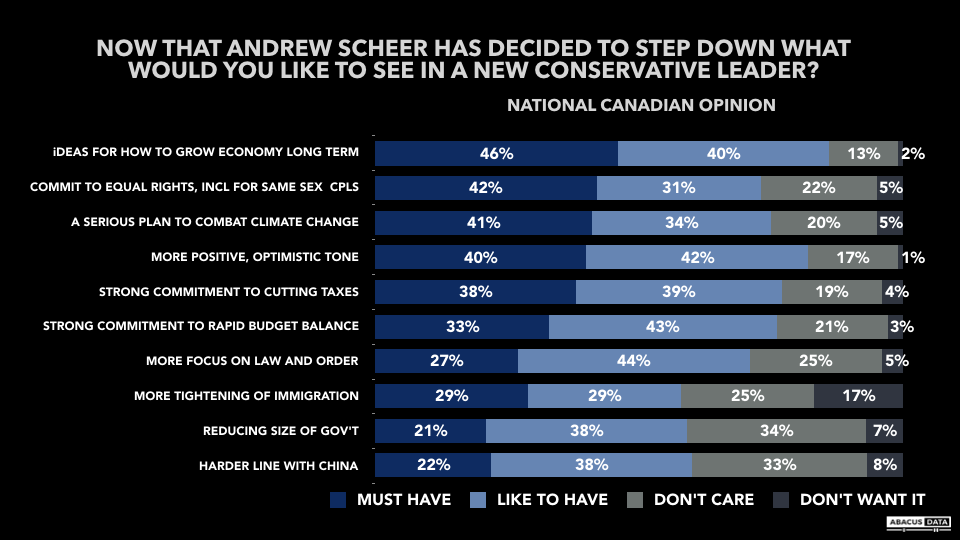
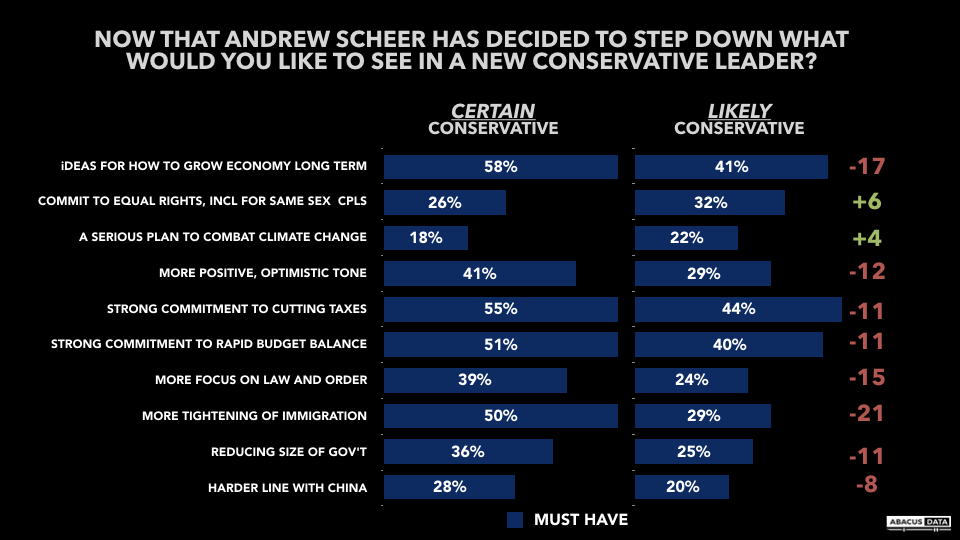
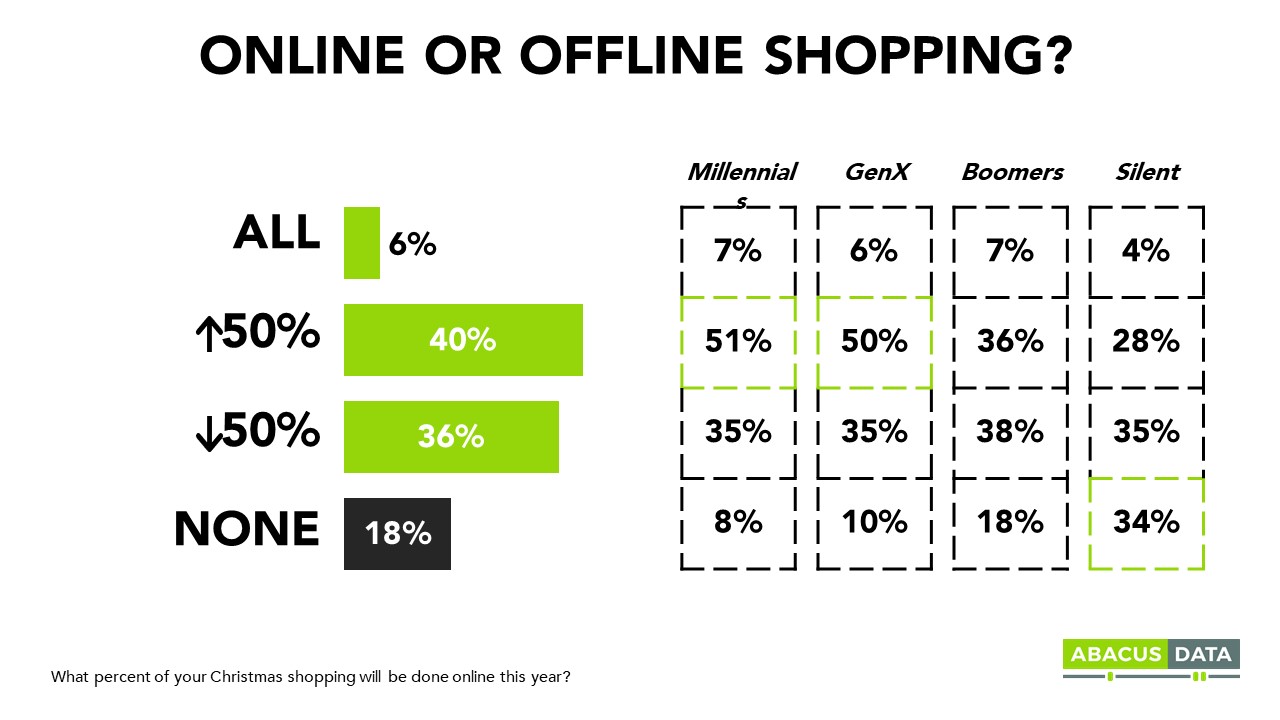
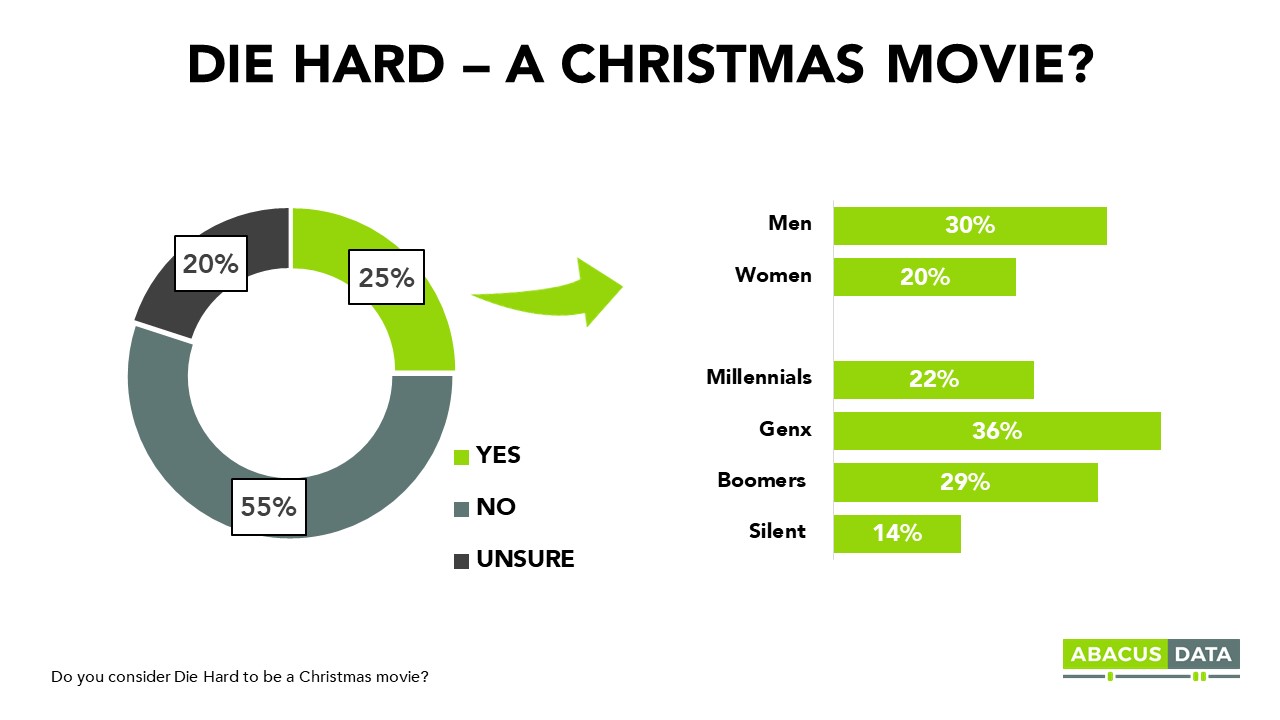
ADDITIONAL CHARTS
ABOUT ABACUS DATA
We are the only research and strategy firm that helps organizations respond to the disruptive risks and opportunities in a world where demographics and technology are changing more quickly than ever.
We are an innovative, fast-growing public opinion and marketing research consultancy. We use the latest technology, sound science, and deep experience to generate top-flight research-based advice to our clients. We offer global research capacity with a strong focus on customer service, attention to detail and exceptional value.
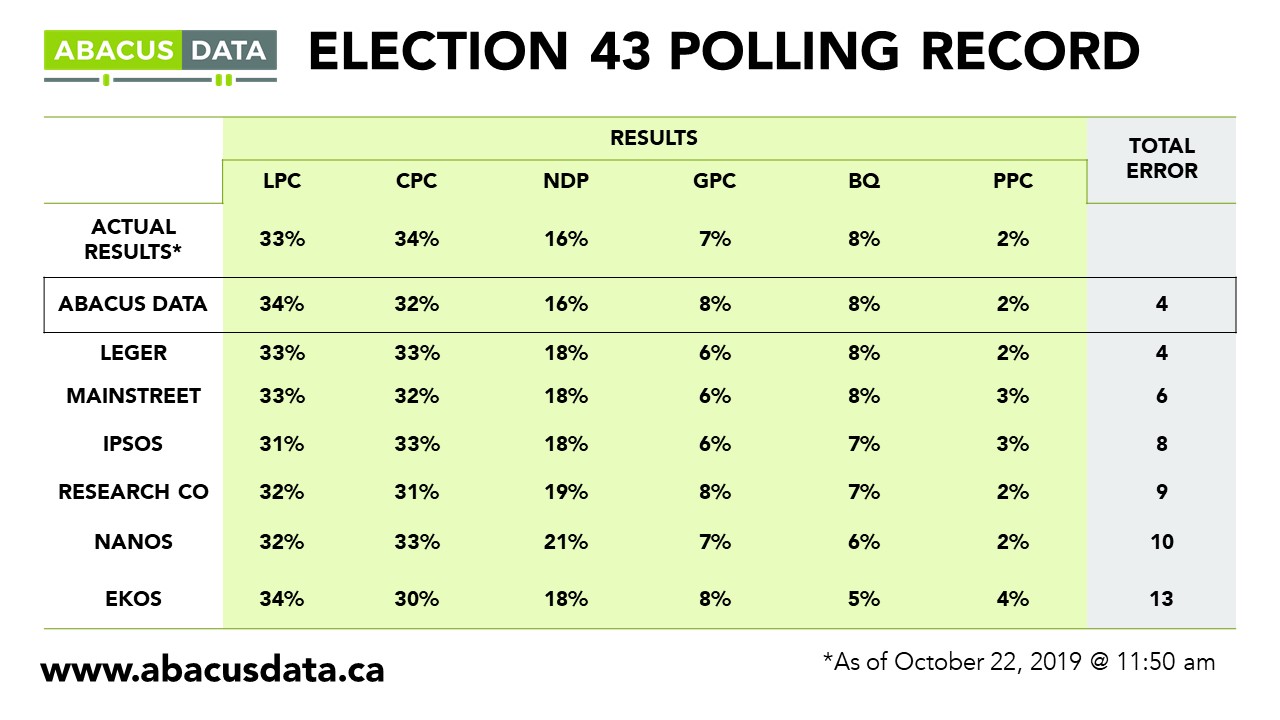
We were one of the most accurate pollsters conducting research during the 2019 Canadian Election.
Contact us with any questions.
Find out more about how we can help your organization by downloading our corporate profile and service offering.