Election Poll: A better week for Trudeau’s Liberals

By Bruce Anderson & David Coletto

We’ve completed another election survey this week. Here’s a snapshot of what we are seeing:

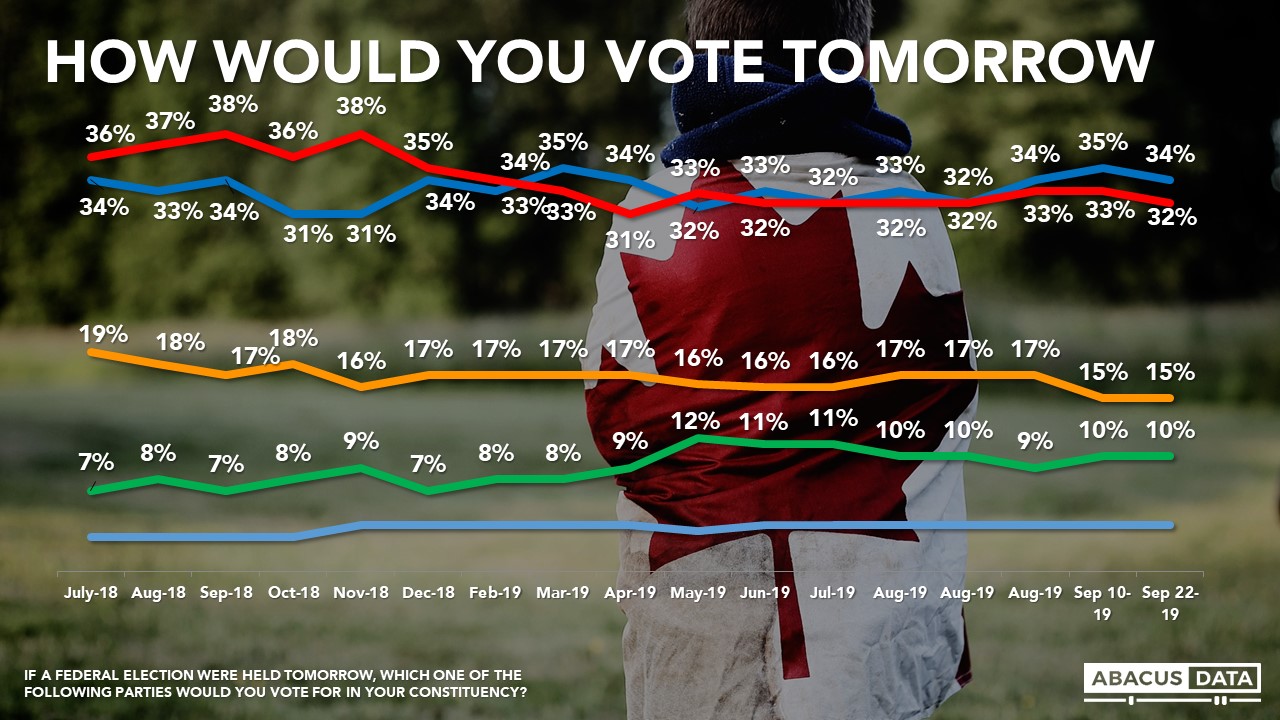
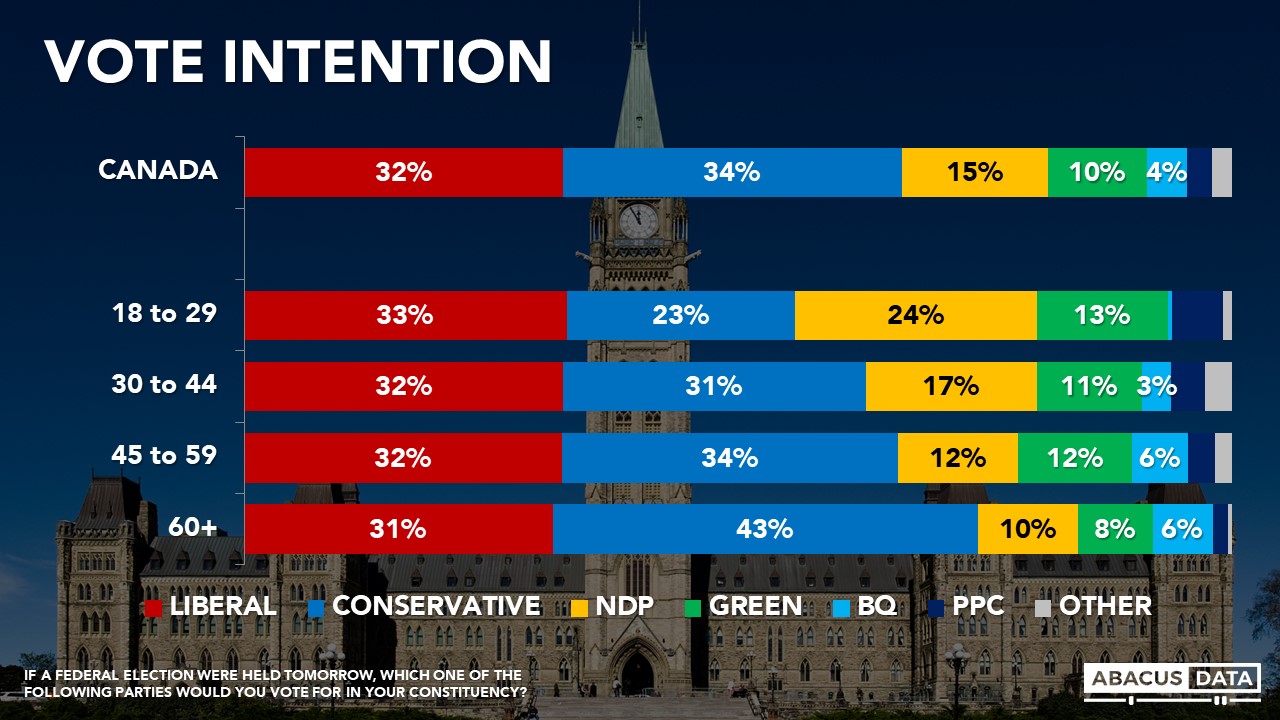
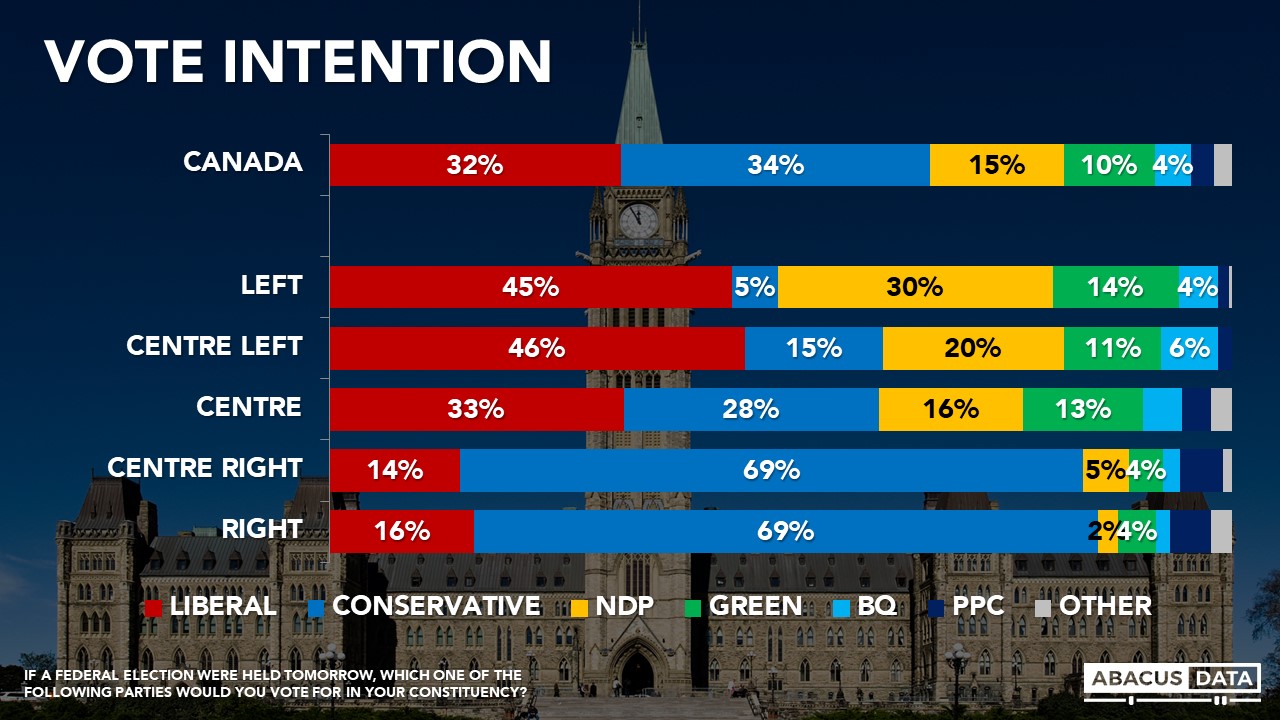
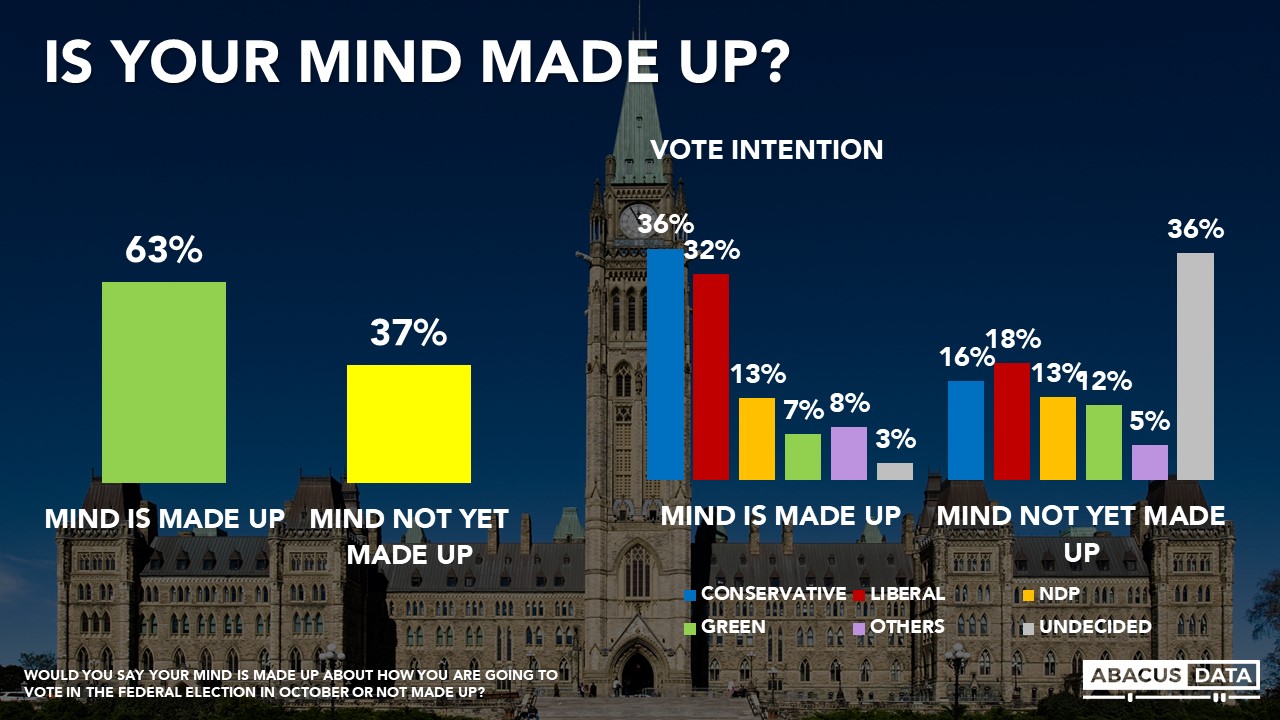
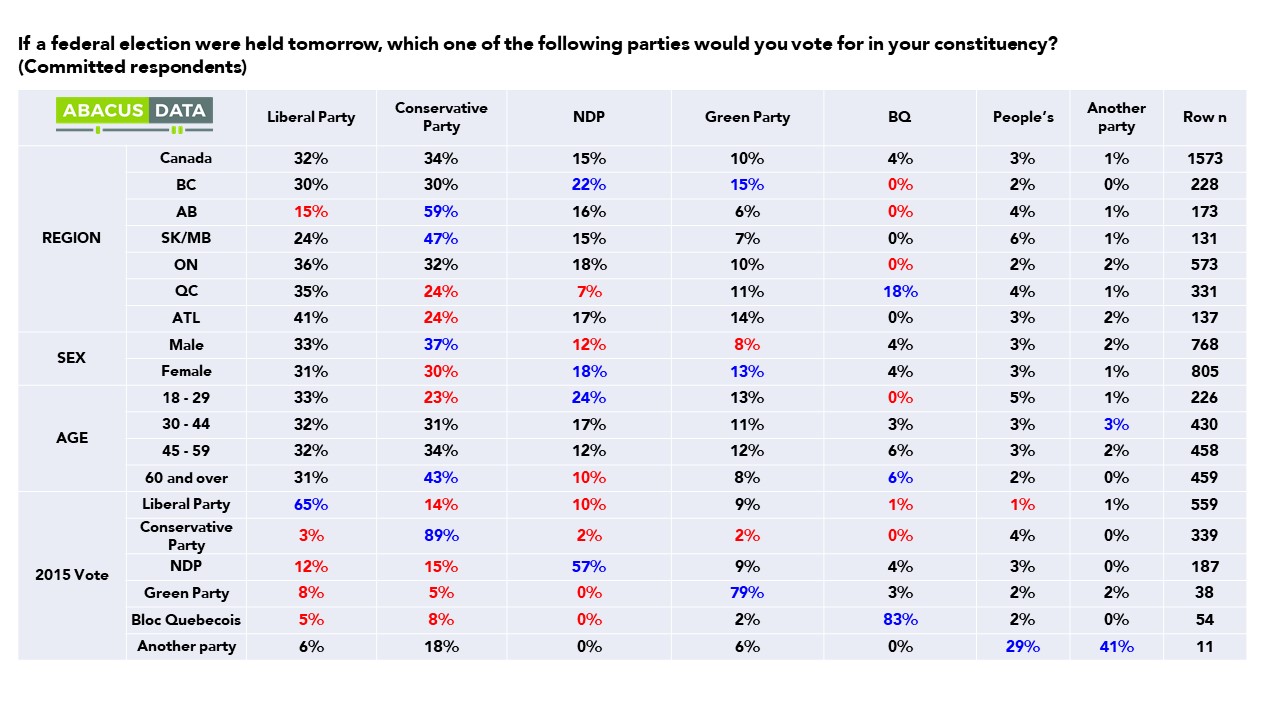
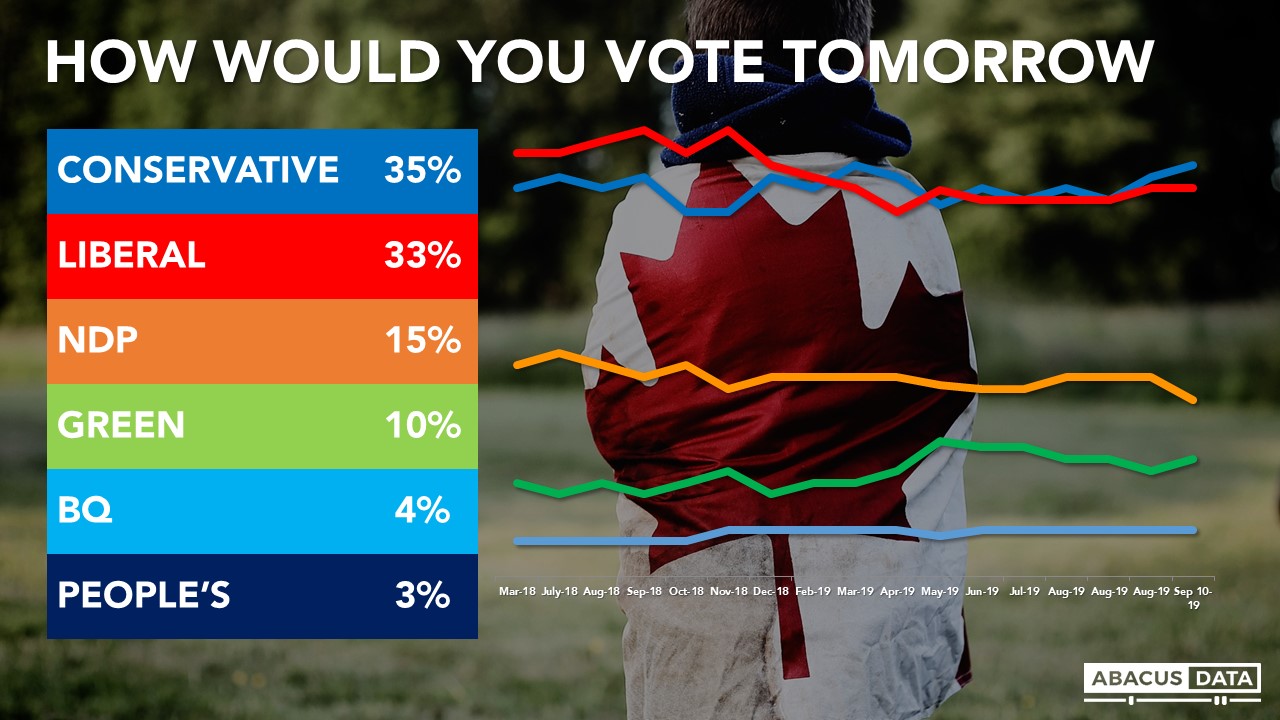
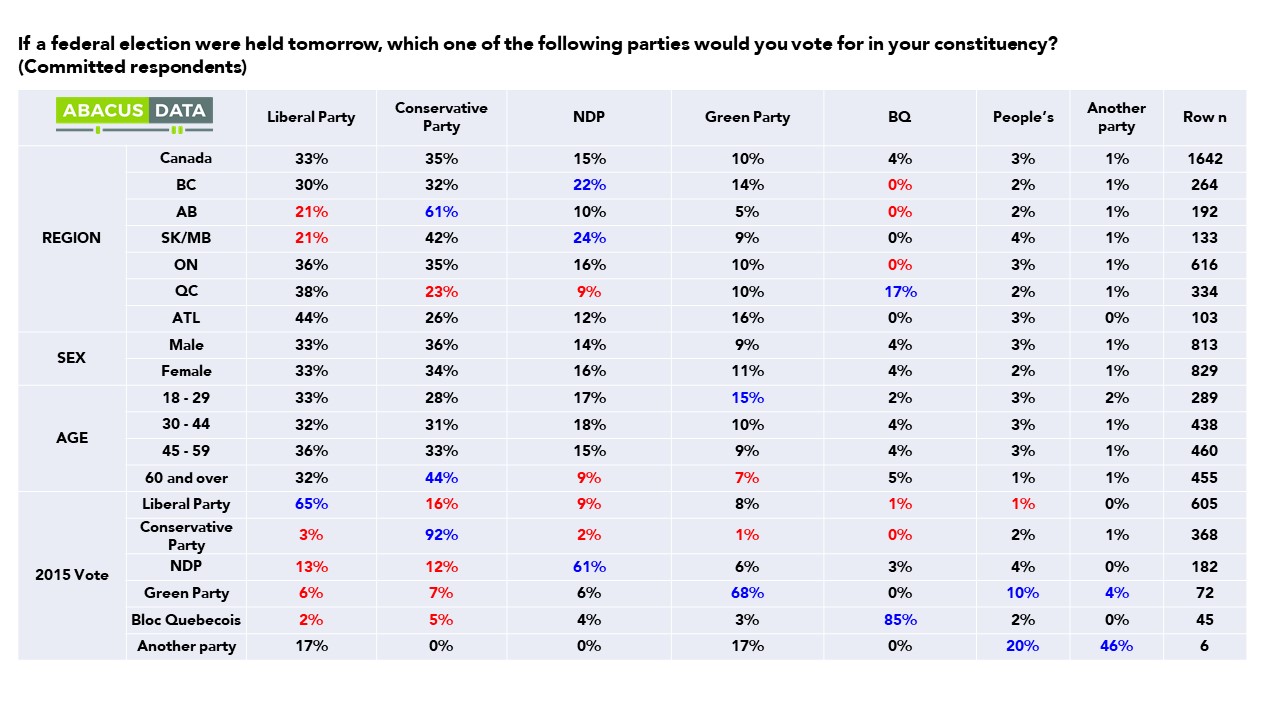
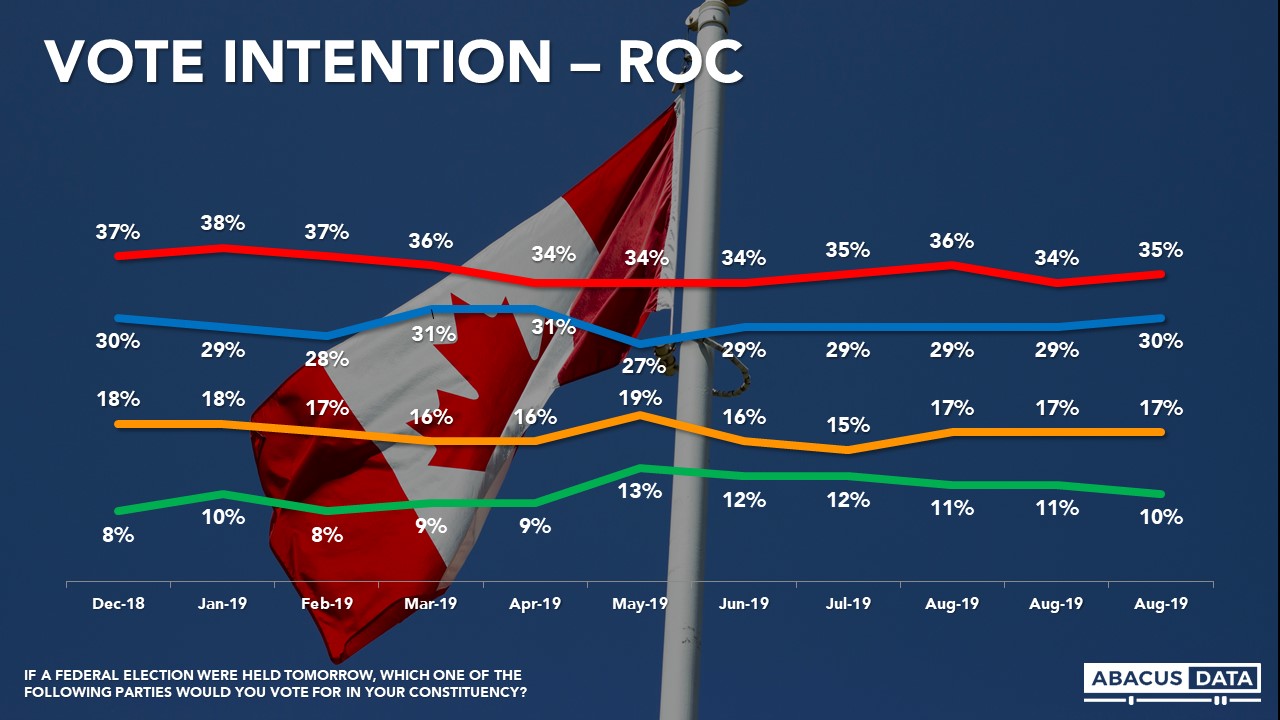
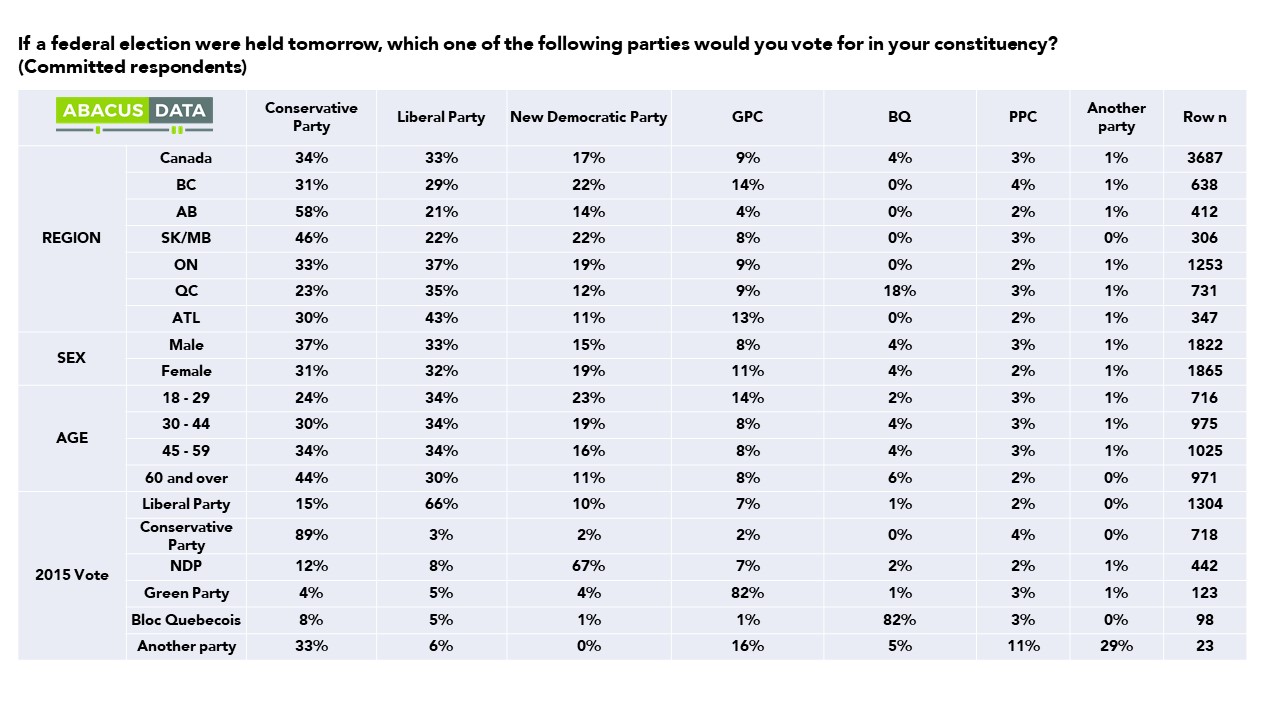
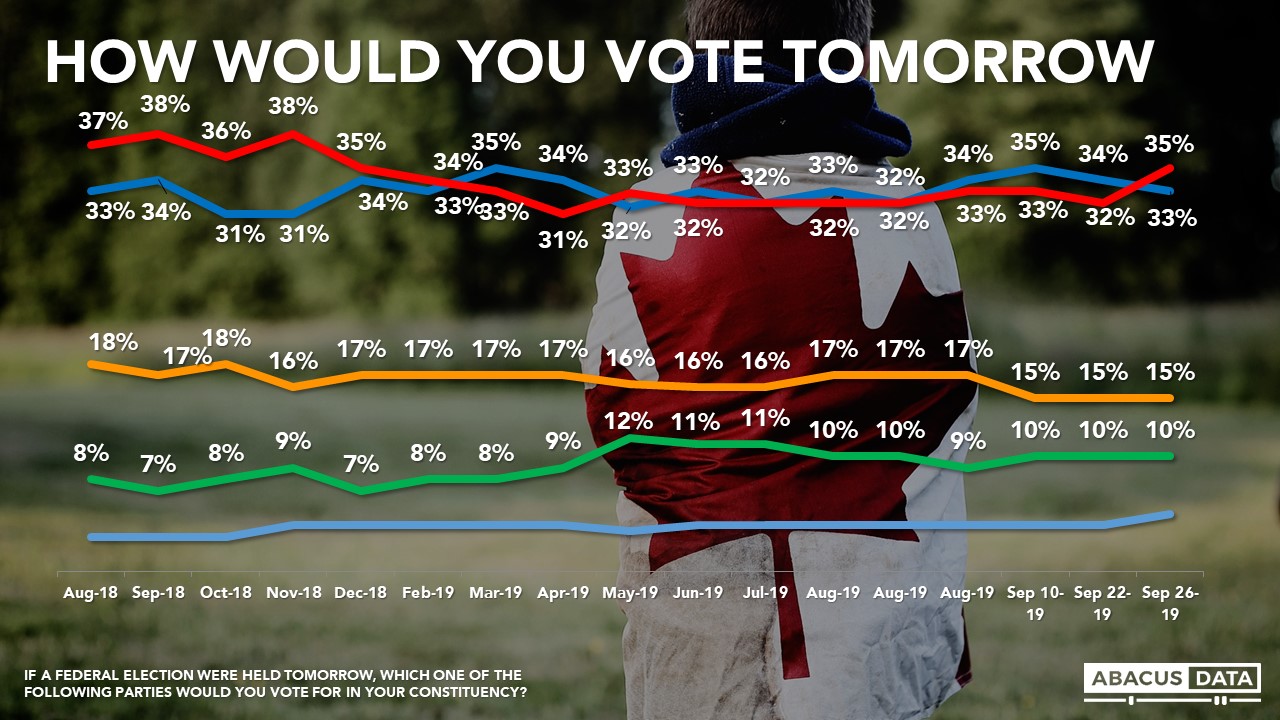
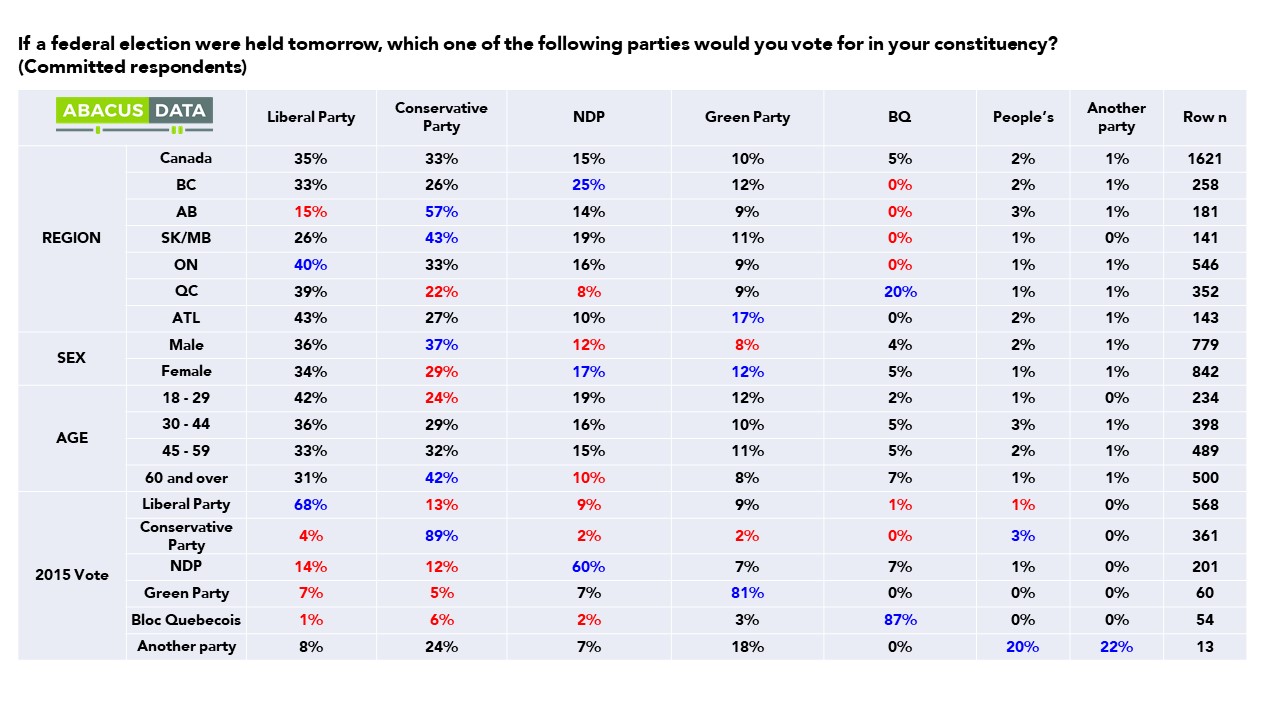
1. The national race remains tight, but the Liberals are 3-points better positioned than last week, with 35% support, while the Conservatives have dropped a point to 33% (that shift is within the margin of error). The NDP at 15% (unchanged) and the Green Party 10% (unchanged).

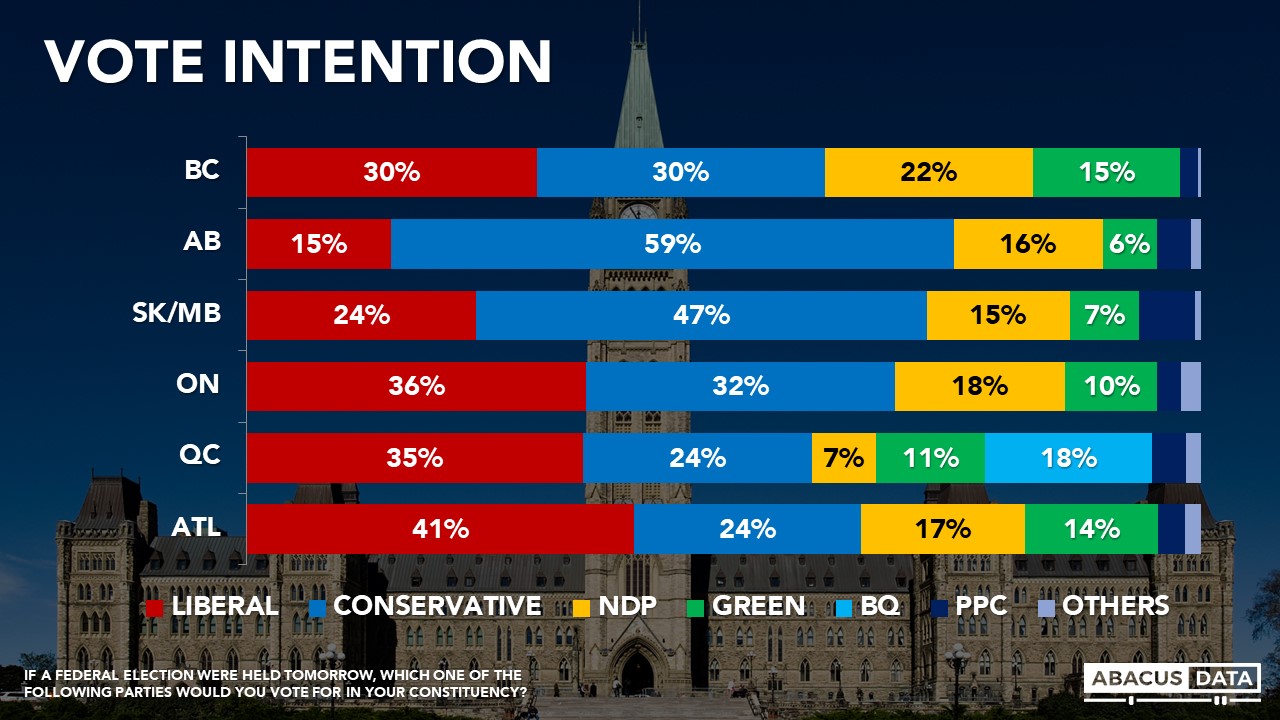
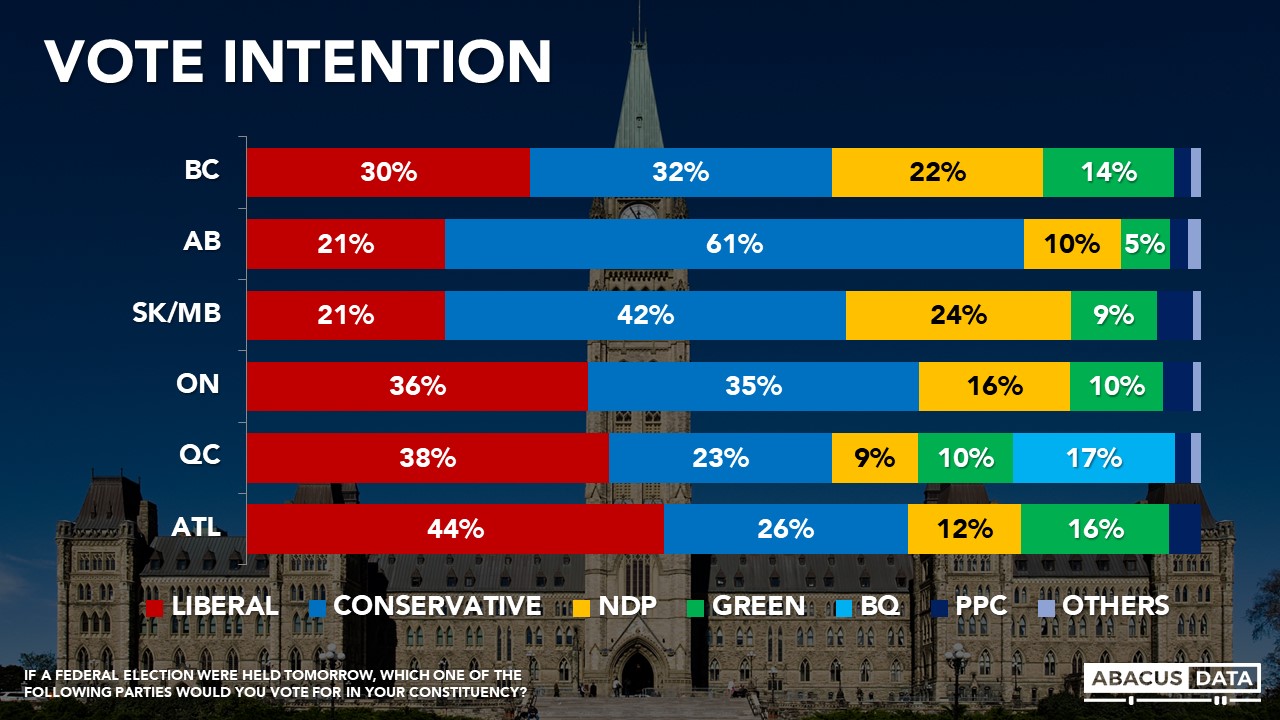
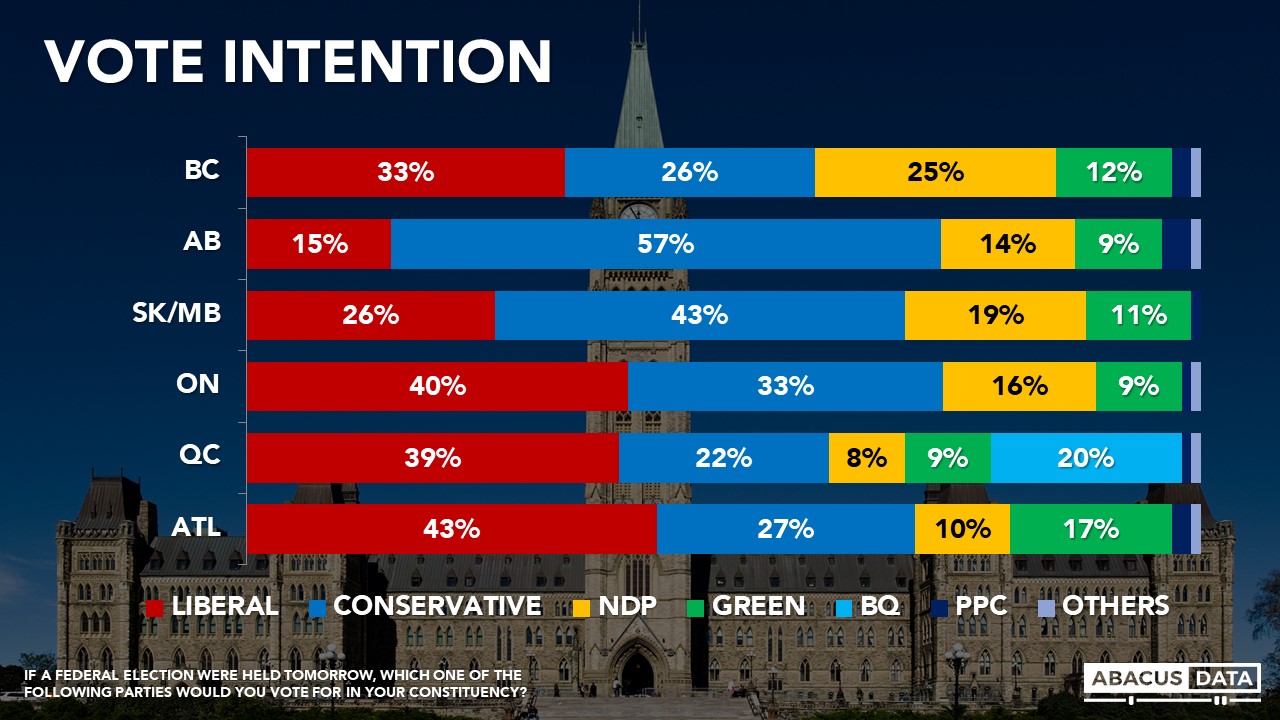
2. Regionally, the Liberals have a 16-point lead in Atlantic Canada, a 17-point lead in Quebec, a 7-point lead in Ontario, and trail by wide margins in the Prairies. In BC, the Liberals have opened up a 7-point lead with 33% support followed by the Conservatives at 26% and the NDP at 25%, the Greens further back at 12%. In Quebec, the Bloc Quebecois is polling at 20%, 2-points back of the Conservatives at 22%.

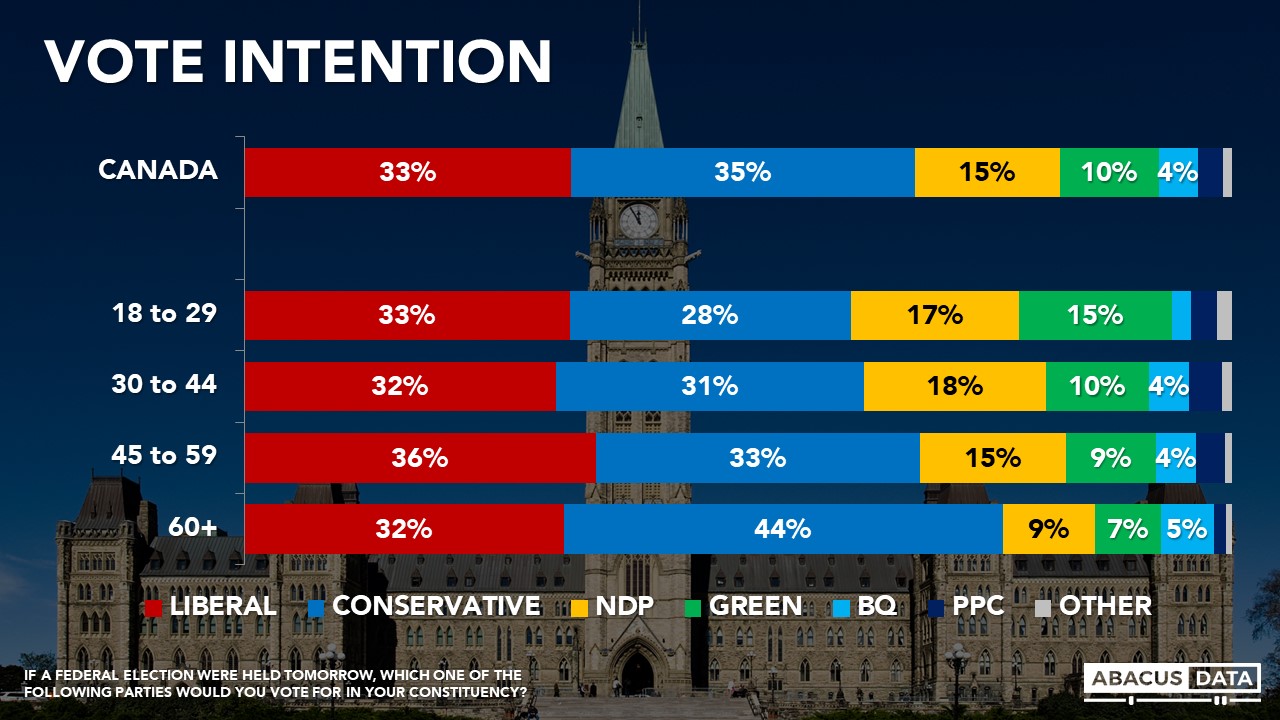
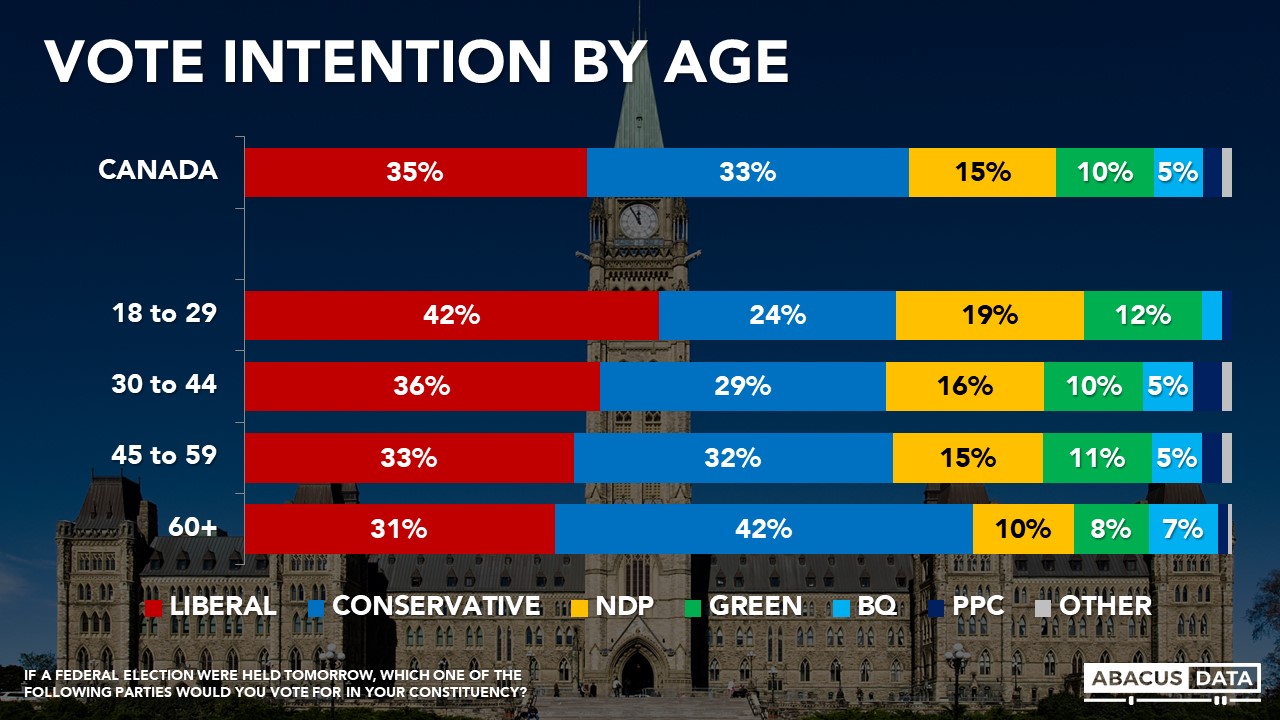
3. The Liberals lead among those aged 18 to 29 (by 18 over the Conservatives) and by 7 among those aged 30 to 44. The Liberals and Conservatives are tied among those aged 45 to 59 while the Conservatives lead by 11 among those aged 60 and over. Over the past week, the Liberal vote share among younger voters has surged to 42%, a 9-point increase.

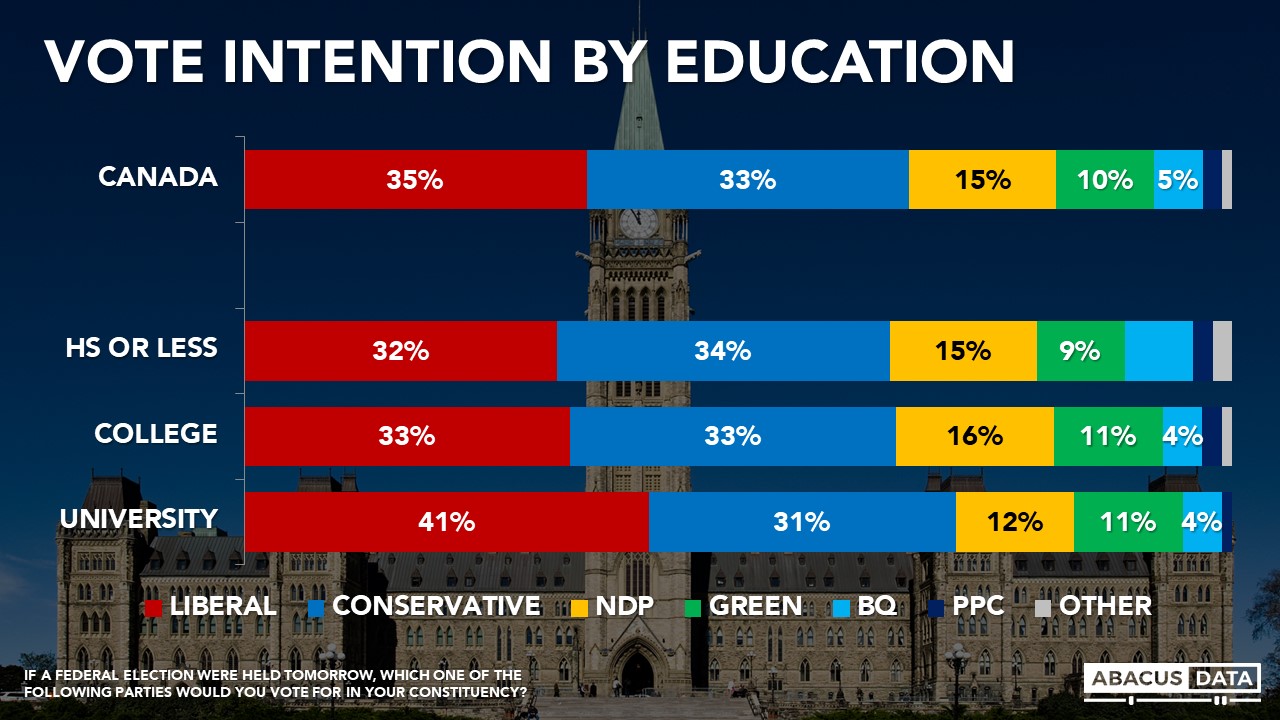
4. In the past, educational attainment was a key driver in vote intentions, but our latest survey finds less division. The Liberals and Conservatives are tied among those with high school or less and among those with college education. Among those with a university degree, the Liberals lead by 10 points. In the past, the Conservatives could count on more support among those with high school or less. That gap appears to have closed over the past few weeks.

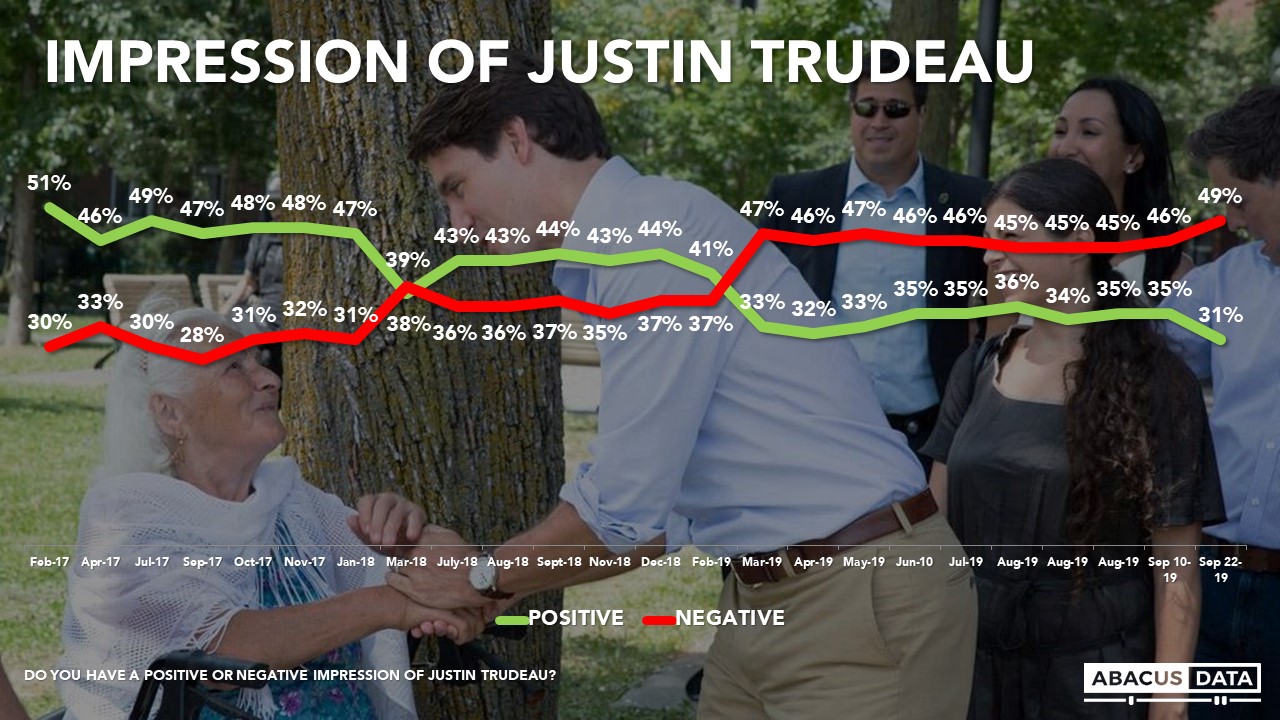
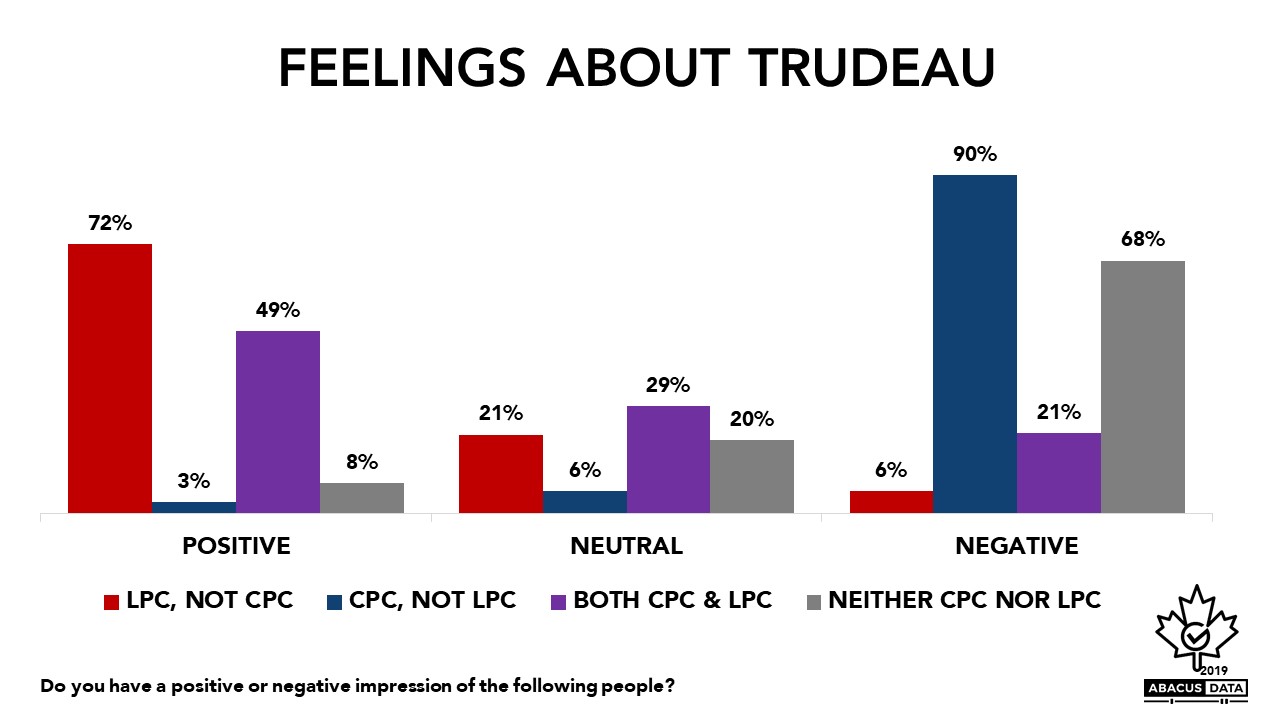
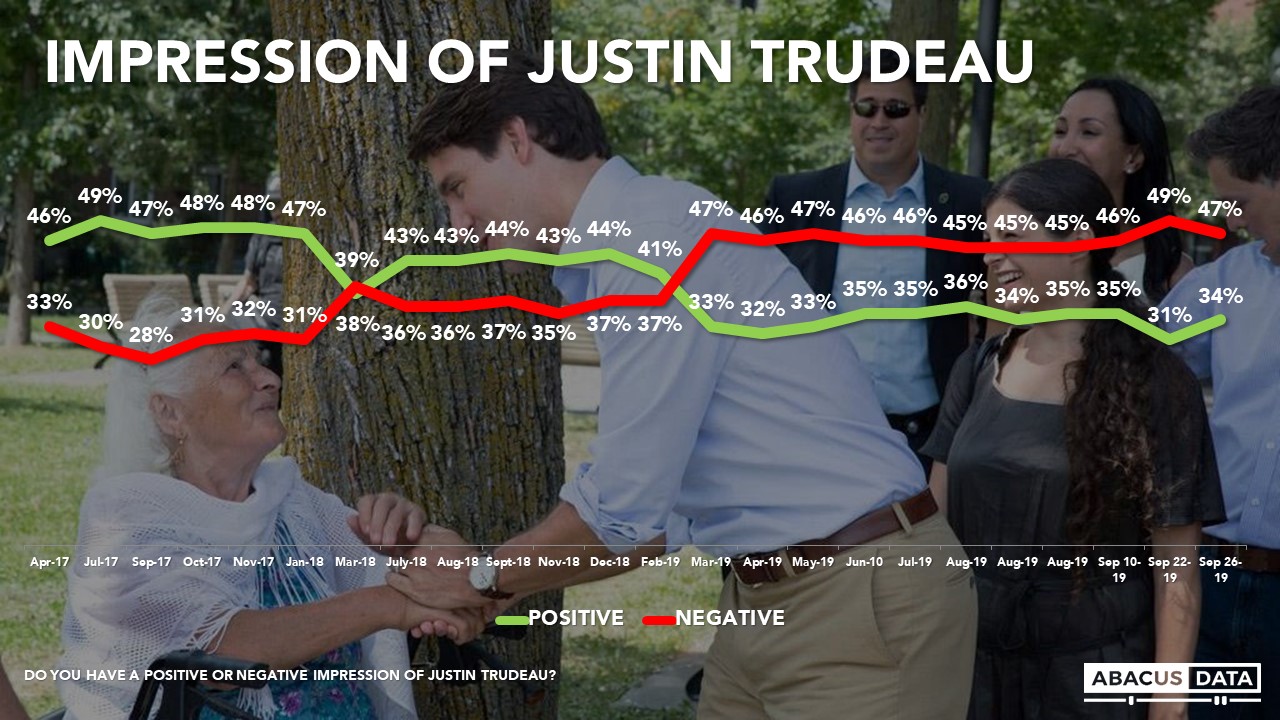
5. Justin Trudeau’s personal ratings have recovered a bit. His positives are up 3-points to 34%, and his negatives are down 2 to 47% for an overall net -13 image score. Mr. Trudeau’s net favourability is -11 in BC, -13 in Ontario, +1 in Quebec. He is -13 among women and +5 among voters under 30.

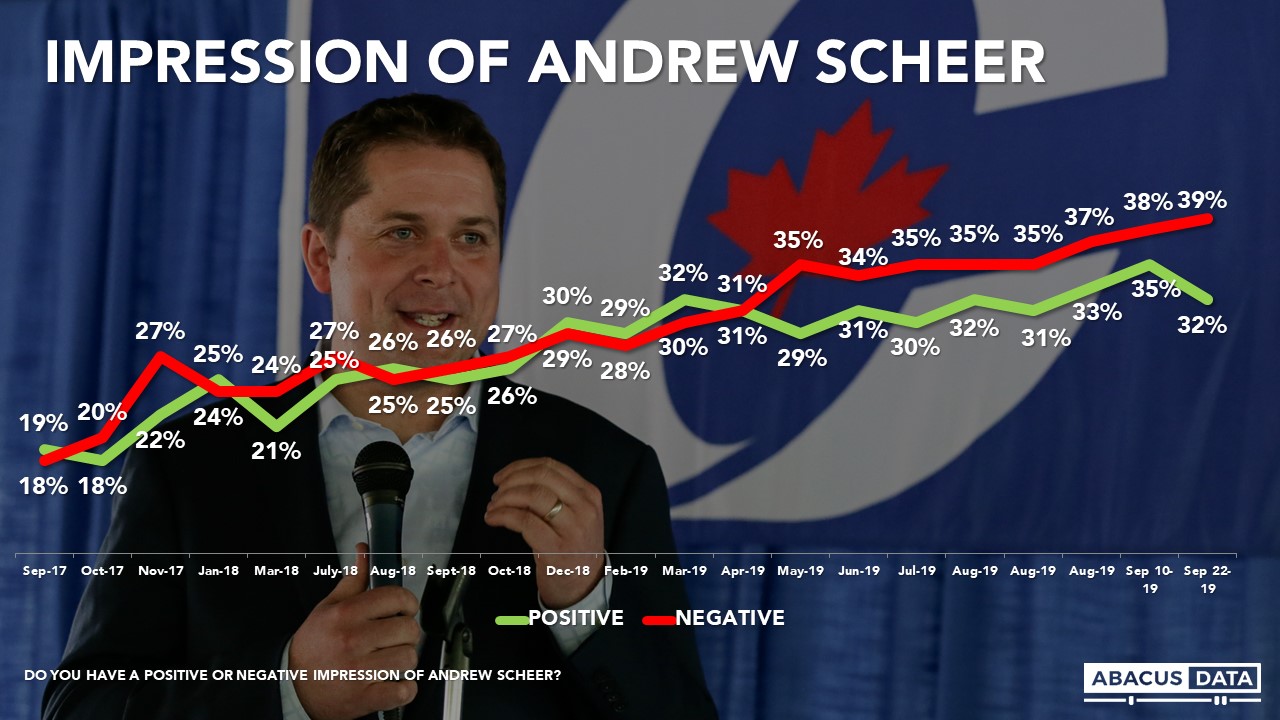
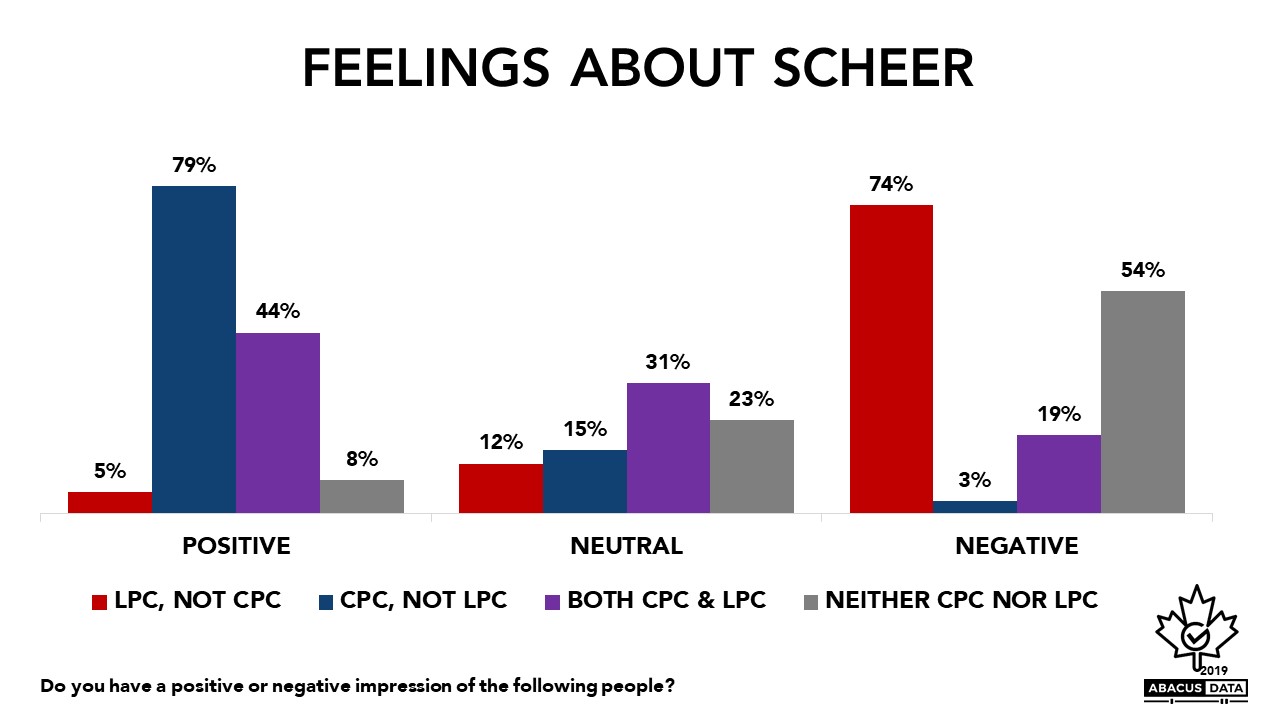
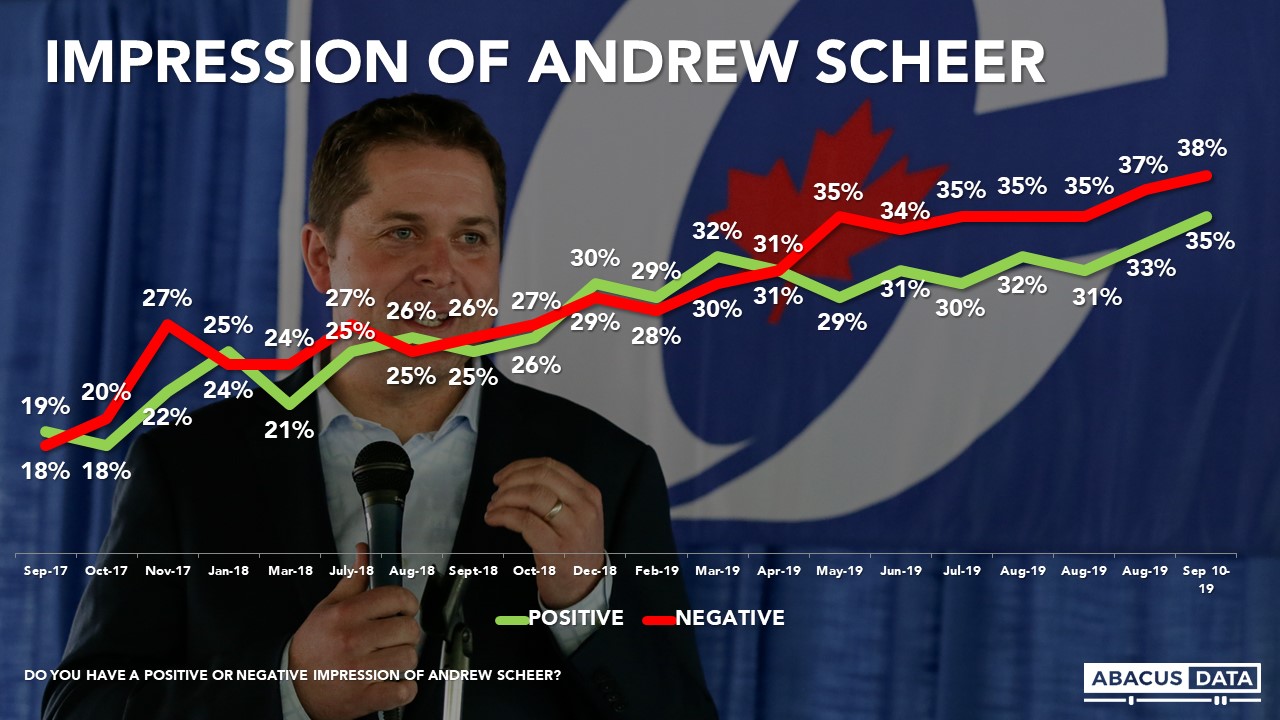
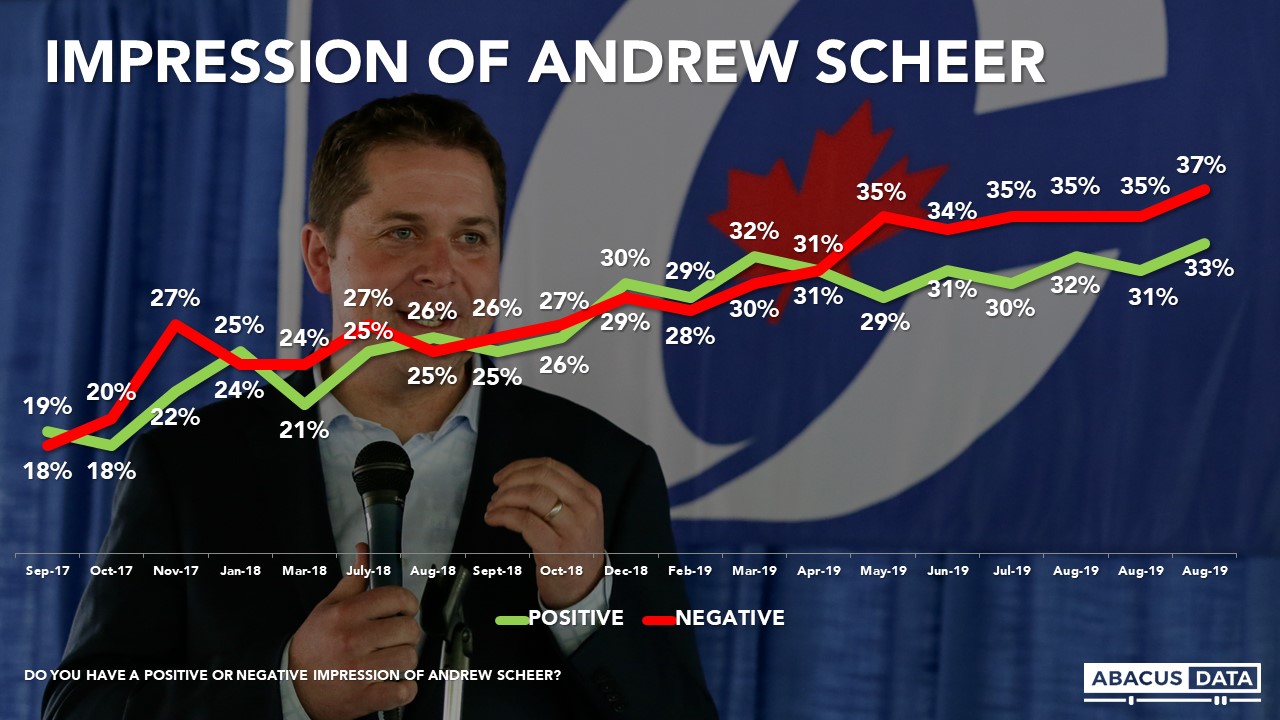
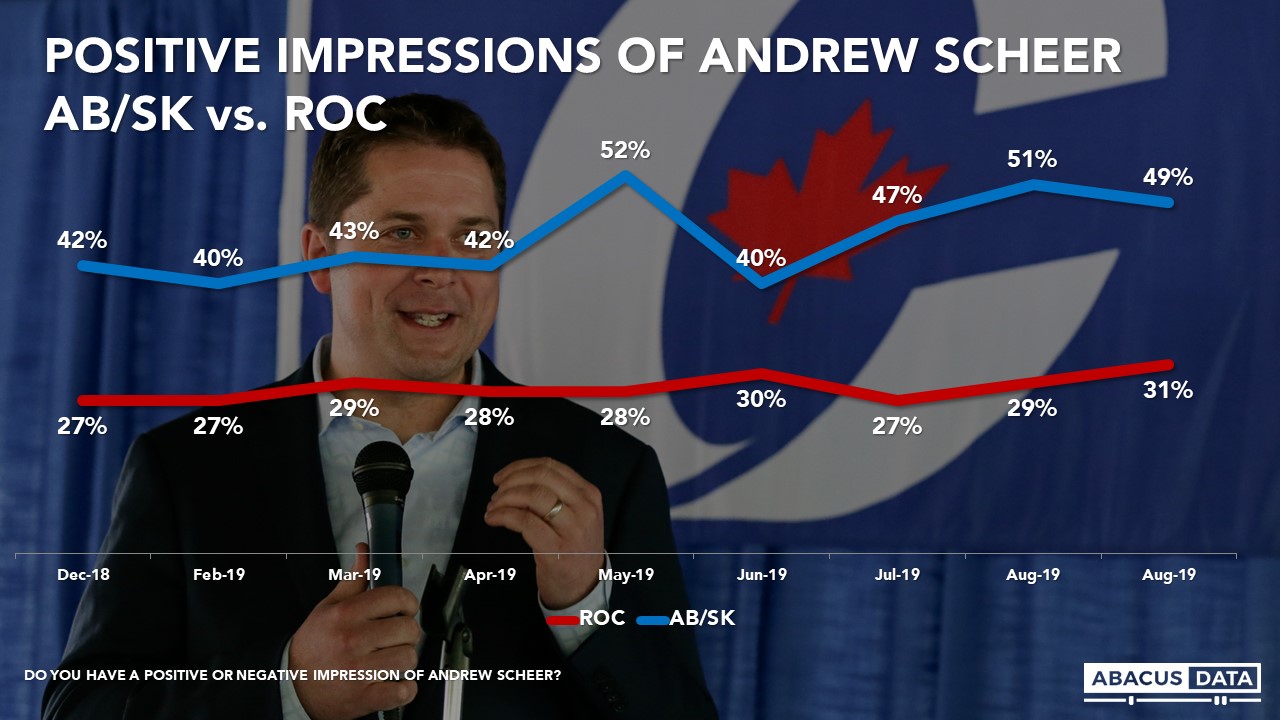
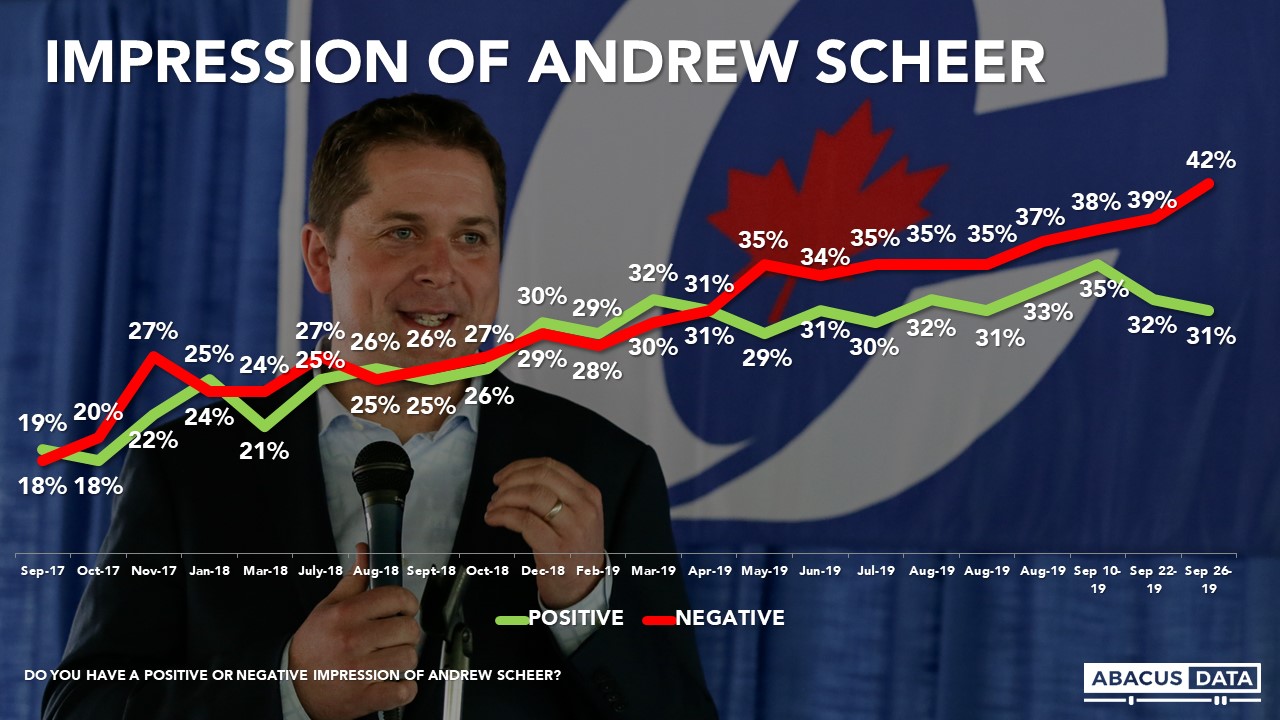
6. Andrew Scheer saw his numbers go in the opposite direction this week. His positives dropped a point to 31%, and his negatives are up 3-points to 42% for an overall image score of -11. His approval rating is -12 in BC, -15 in Ontario and -15 in Quebec. It is -20 with under 30 voters and -18 among women.

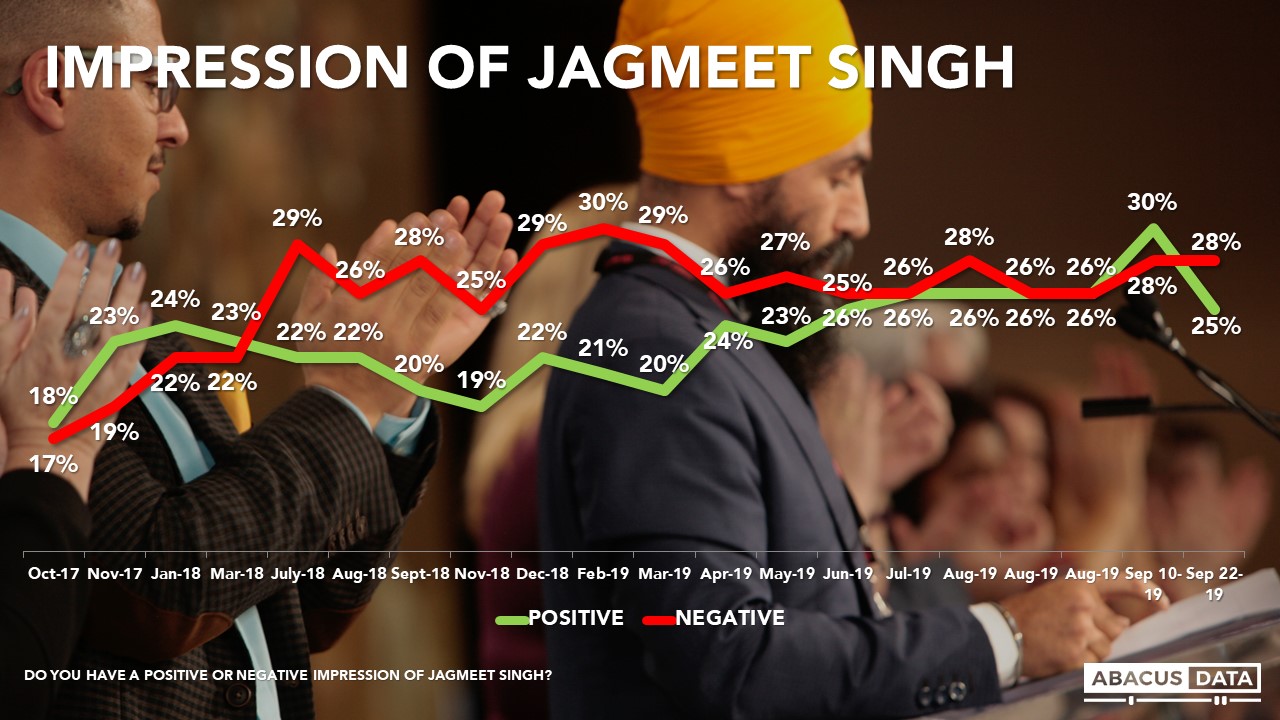
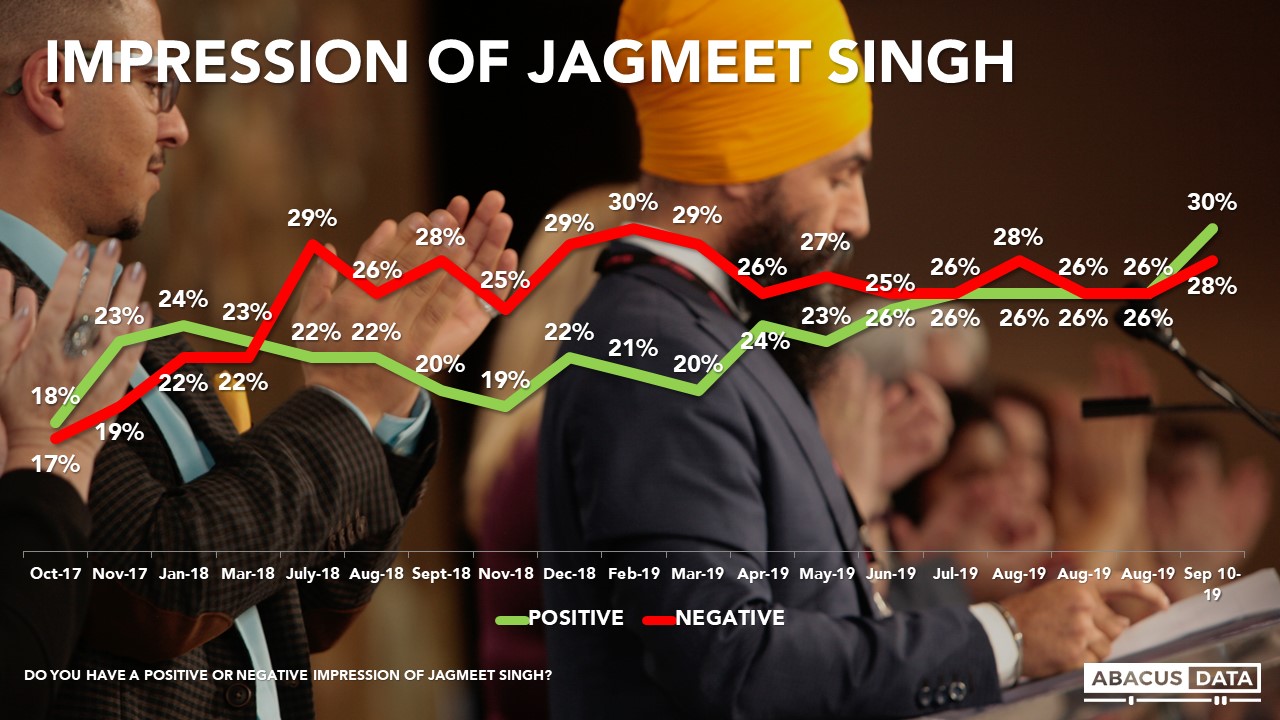
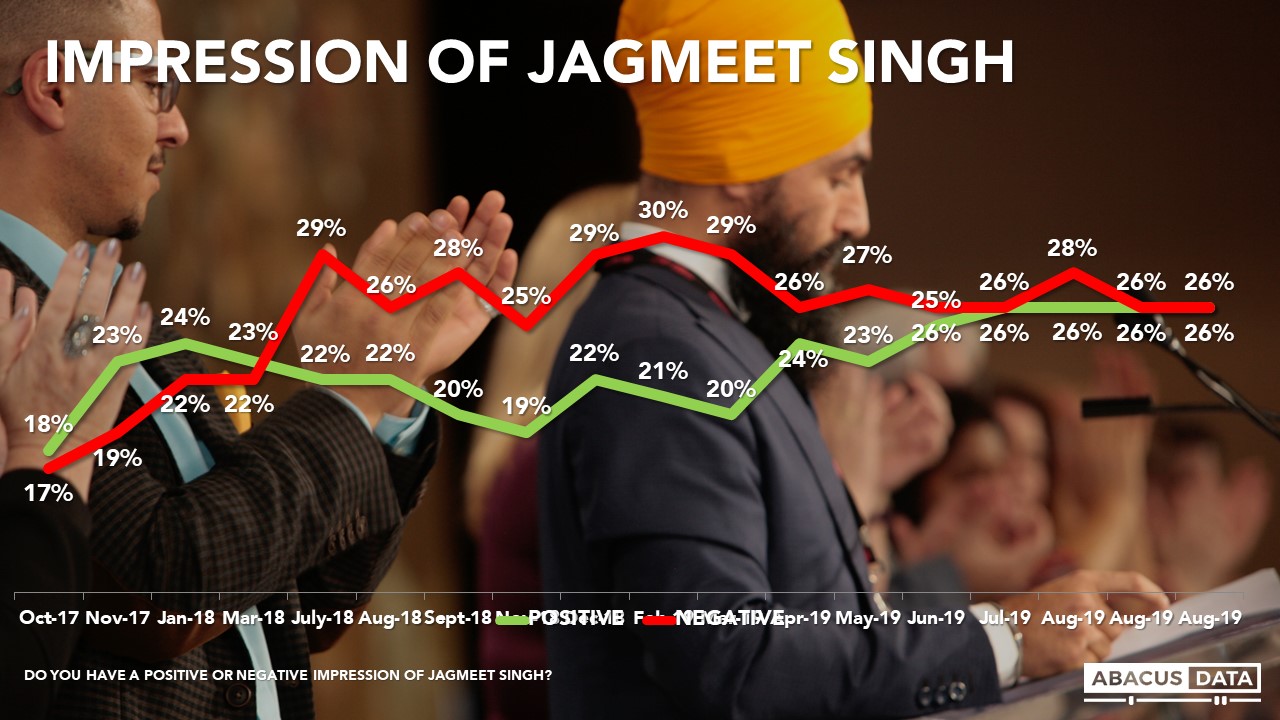
7. Jagmeet Singh had a better week this week, with his positives rising 6-points to 31% and his negatives dropping 4-points to 24% for a +7 overall. He is +10 in BC, +9 in Ontario, +9 in Quebec, +12 among women and +31 among voters under 30.

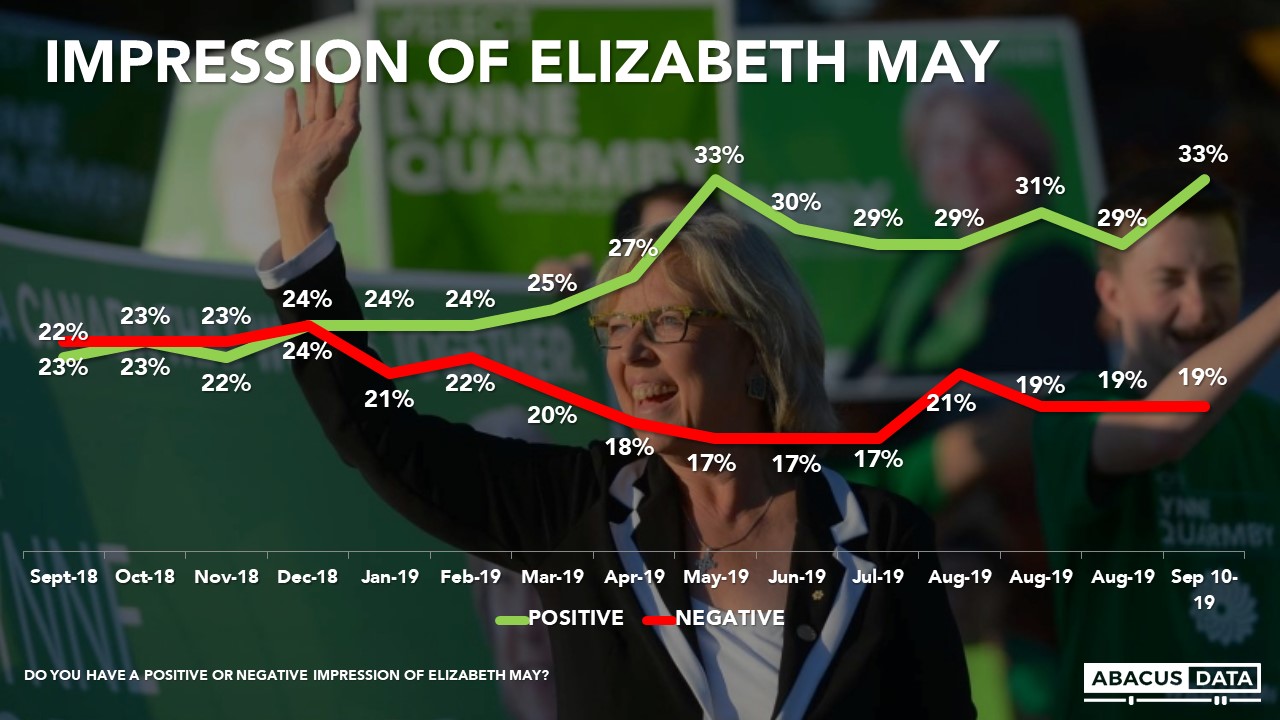
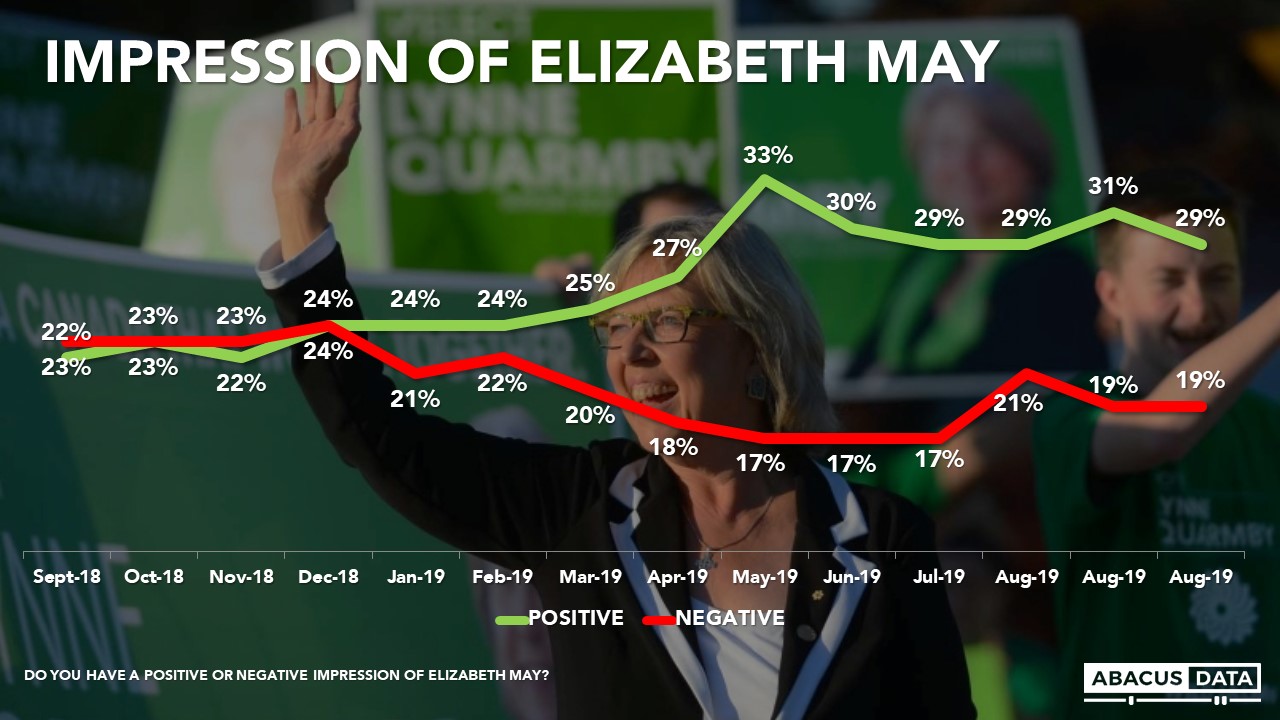
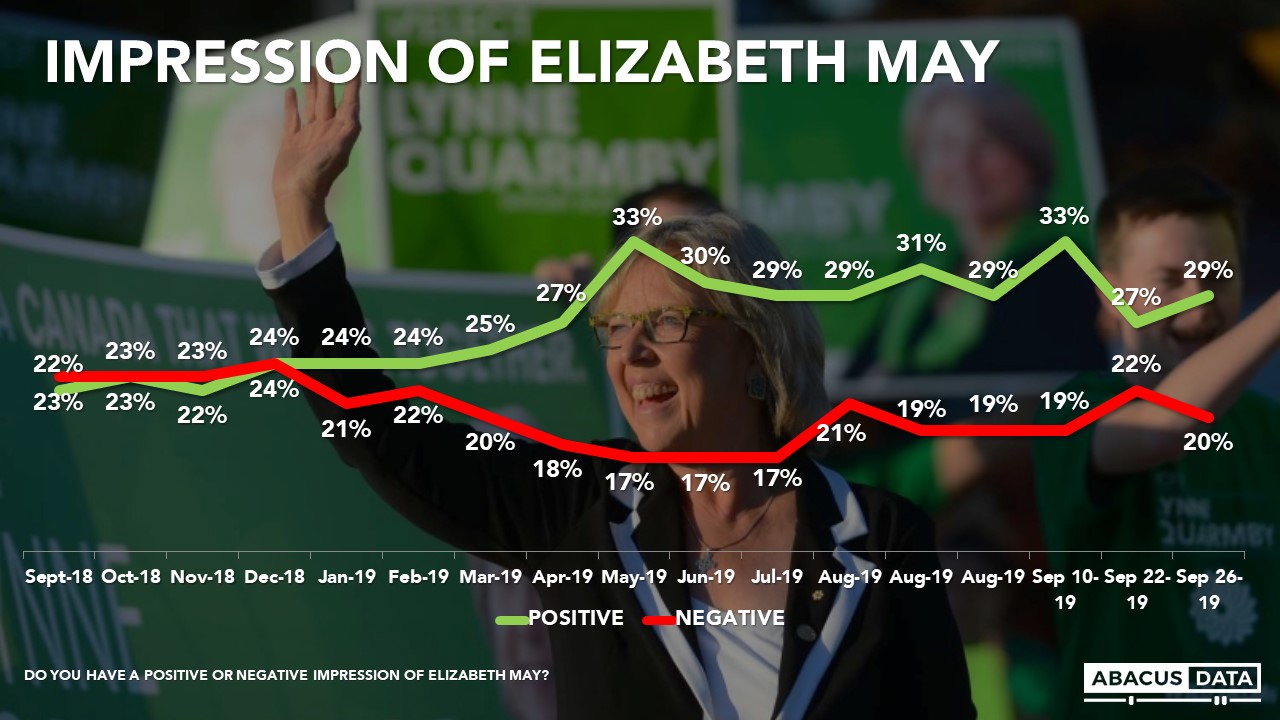
8. Elizabeth May had a slightly improved week with her positives up 2 and her negatives down 2 for an overall net image score of +9. She is +12 in BC, +10 in Ontario, +9 in Quebec, and +21 in Atlantic Canada.

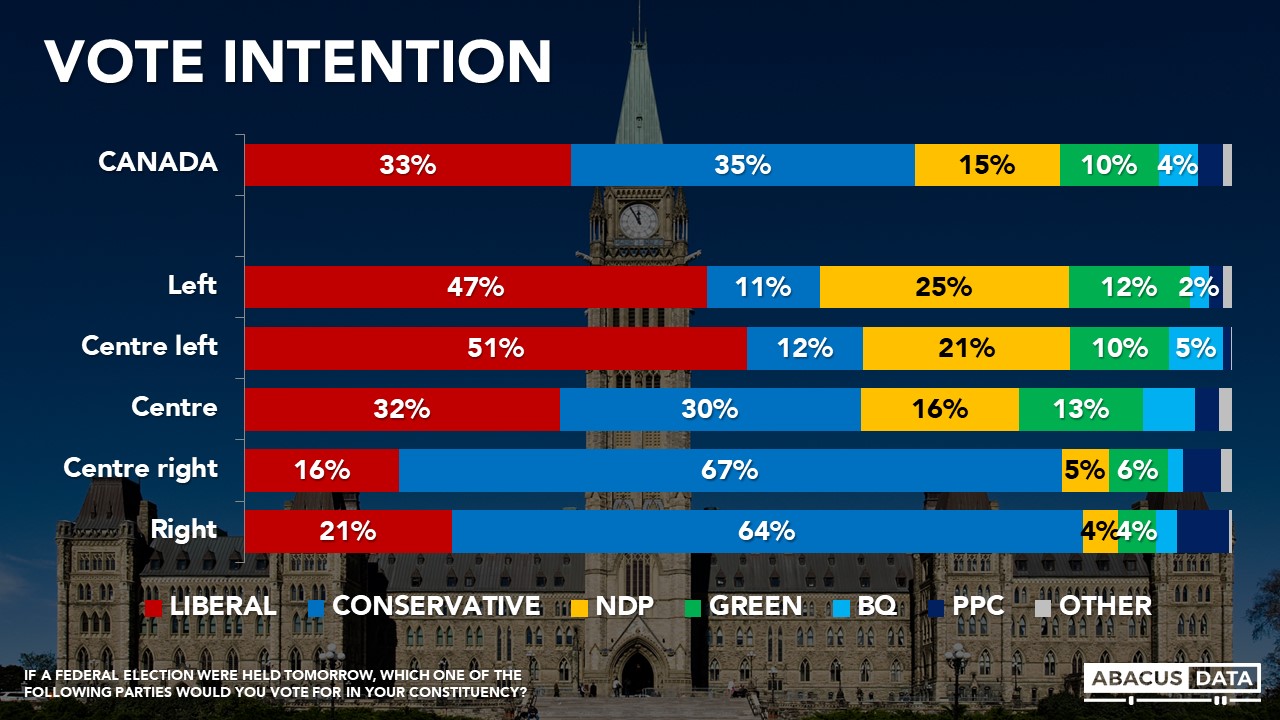
9. Maxime Bernier is underwater everywhere at -32 nationally, -29 in BC, -29 in Ontario, -38 in Quebec, and – 4 among self-described right of centre voters. He is -21 among centre-right voters.

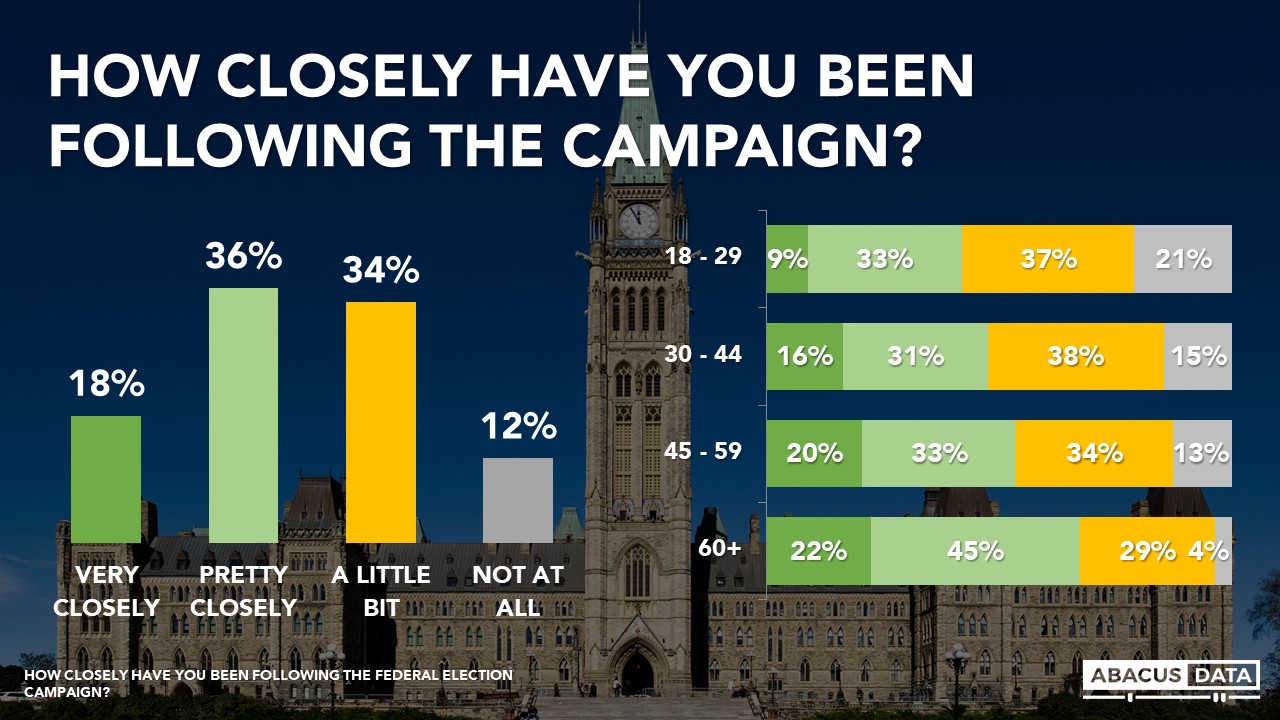
10. Interest in the campaign is largely unchanged from the start of the campaign. In our survey completed before the campaign started, 55% reported high interest in the campaign, the same as today.

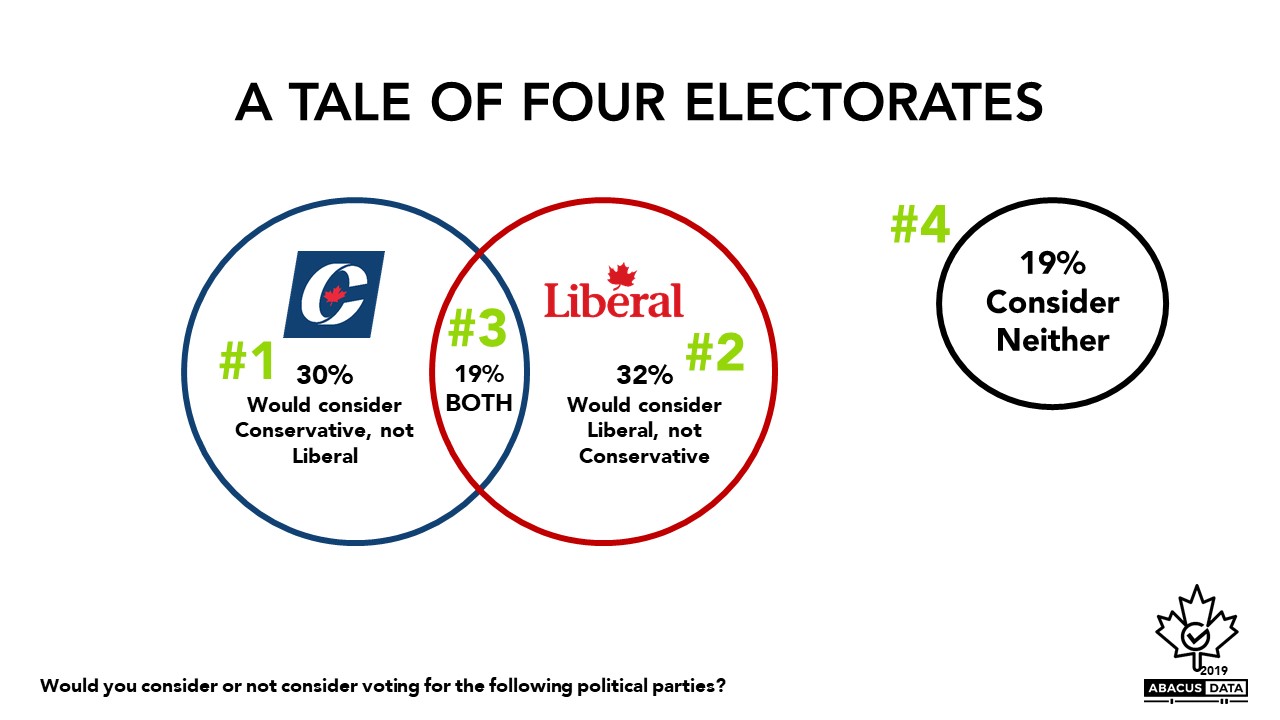
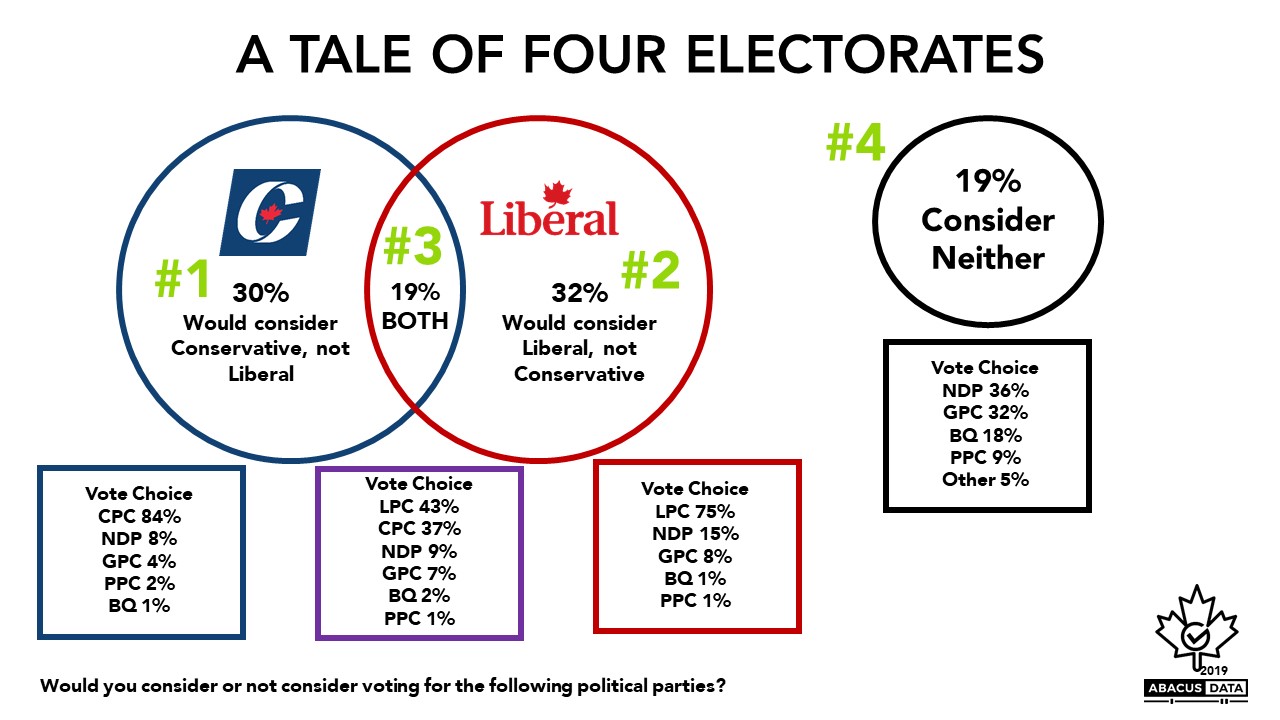
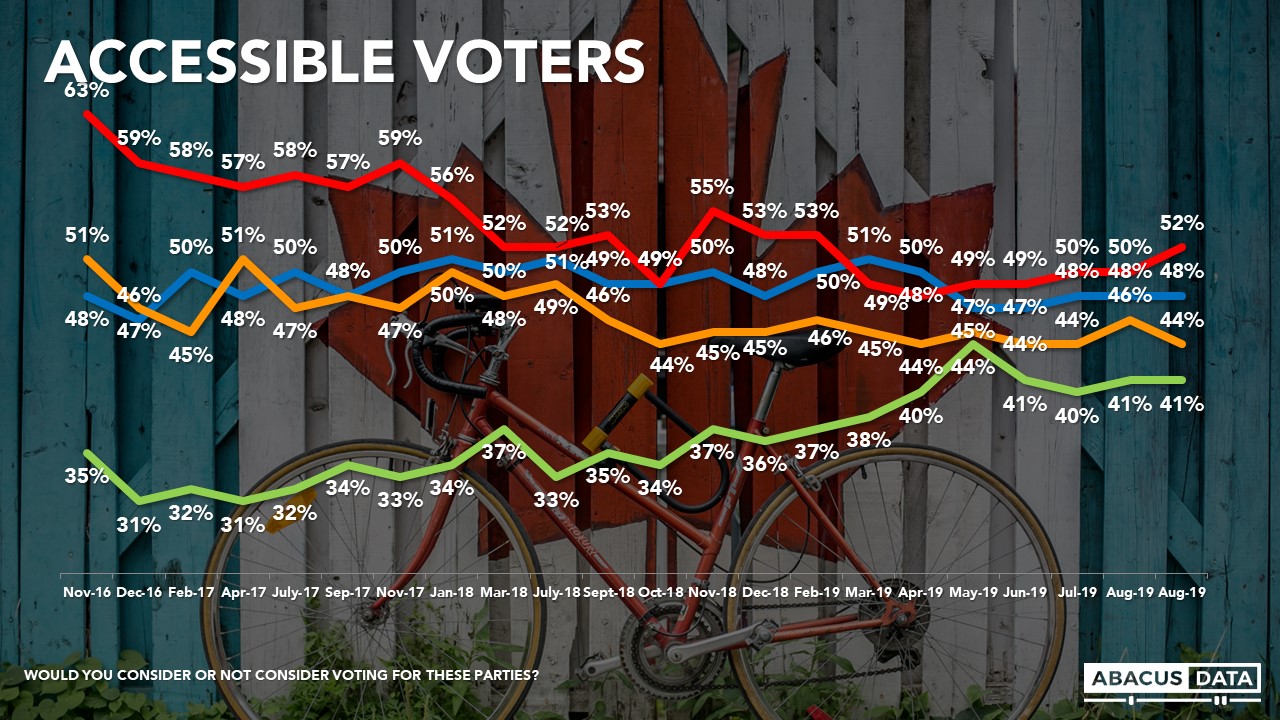
11. The Liberals now have the largest pool of accessible voters, up 3 points over the past week to 52%. The Conservatives have 46%, followed by the NDP at 44%. 40% of people would consider voting Green. In Quebec, 36% say they are open to voting for the BQ, unchanged from last week when it was 35%.

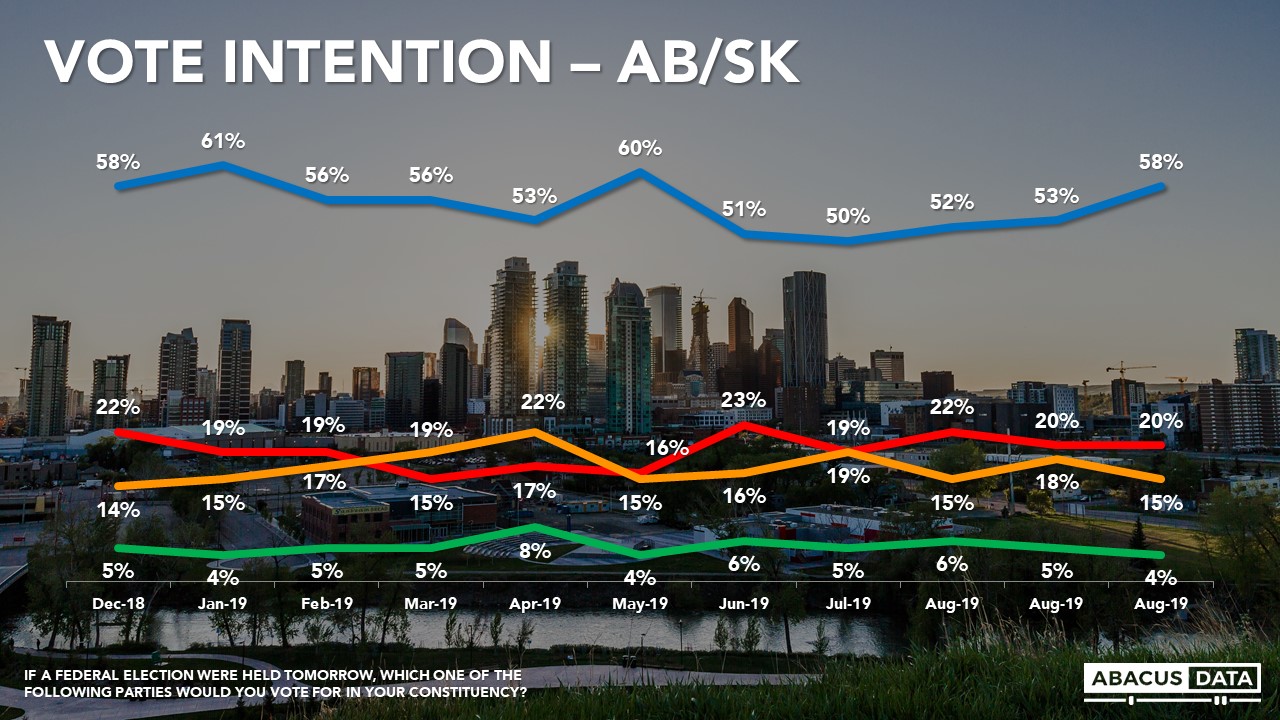
12. Asked if it came down to a choice between Mr. Trudeau and Mr. Scheer as Prime Minister, 54% would prefer Mr. Trudeau while 46% would prefer Mr. Scheer. Among younger voters under 30, the split is 65% Trudeau to 35% Scheer. Among women, Trudeau leads Scheer by 14-points while Trudeau has a 1-point lead among men. Regionally, Trudeau leads in BC (+14), Ontario (+8), Quebec (+20), and Atlantic Canada (+28) while Mr. Scheer leads in Alberta (+26) and SK/MB (+8).

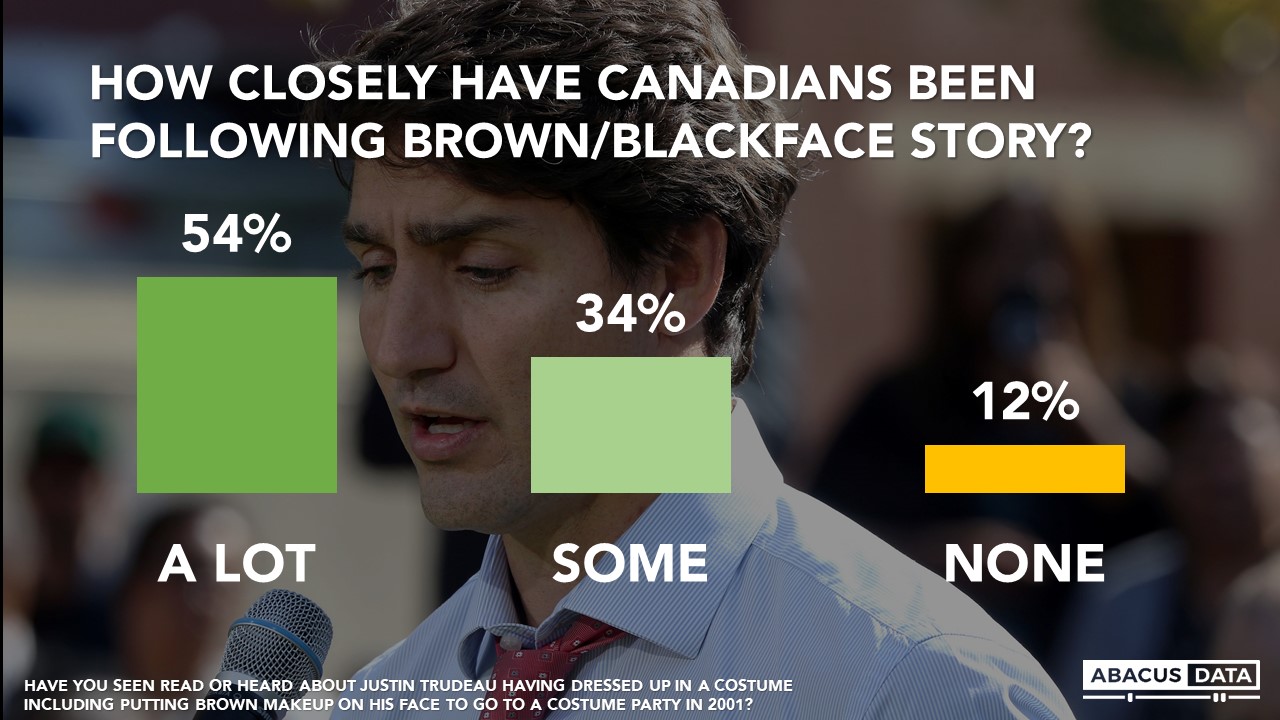
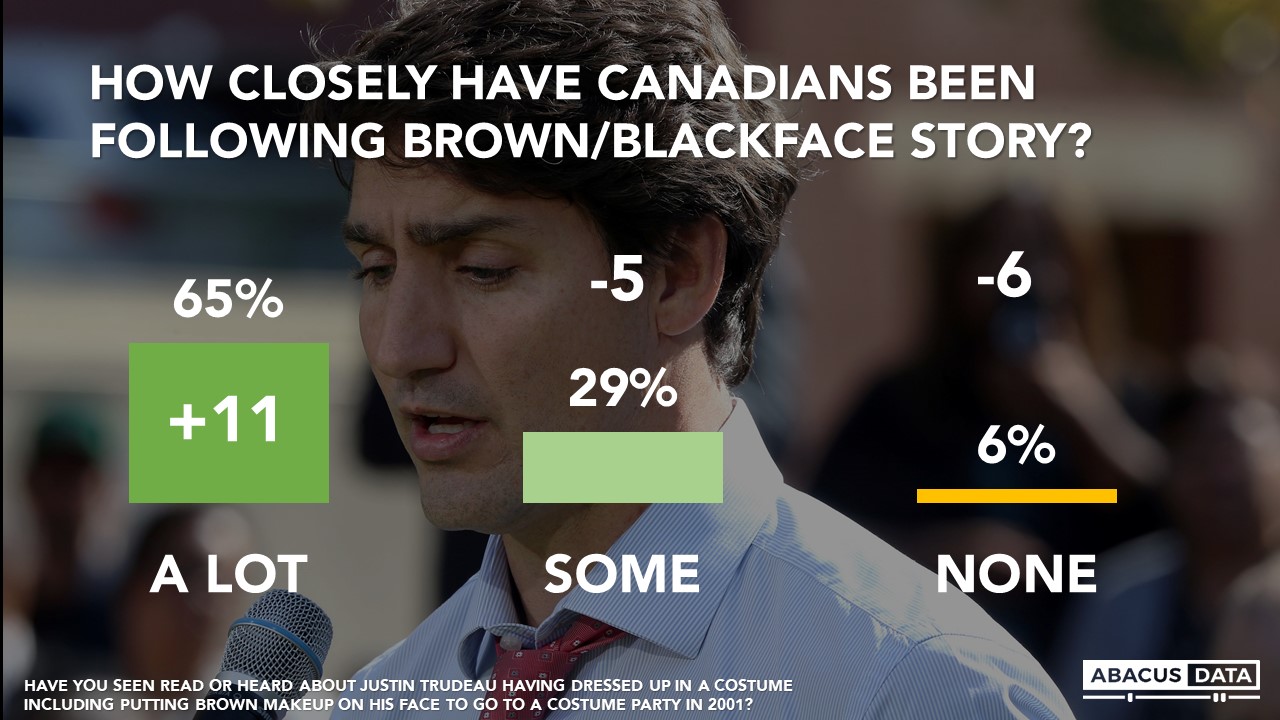
13. When we look at attention to the blackface photo story, 65% (54% last week) said they heard a lot about the blackface story, another 29% have heard some. 6% had not heard of it at all, down 6 from Sunday.

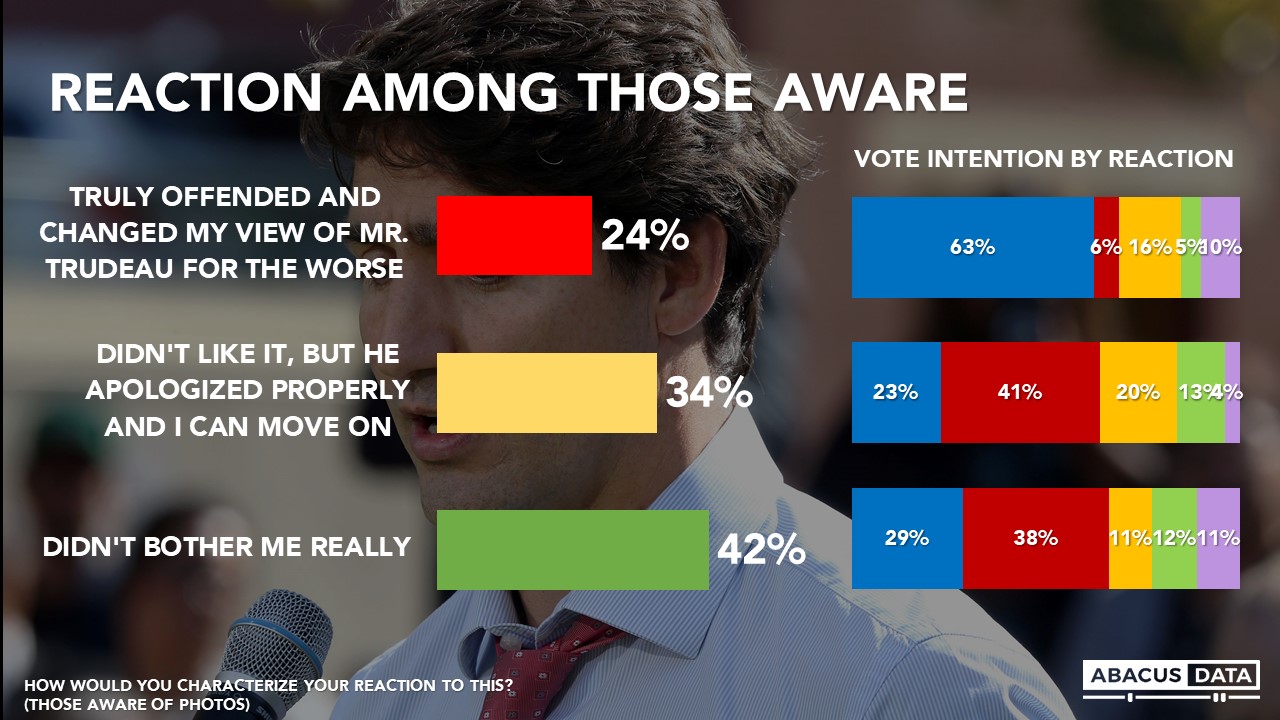
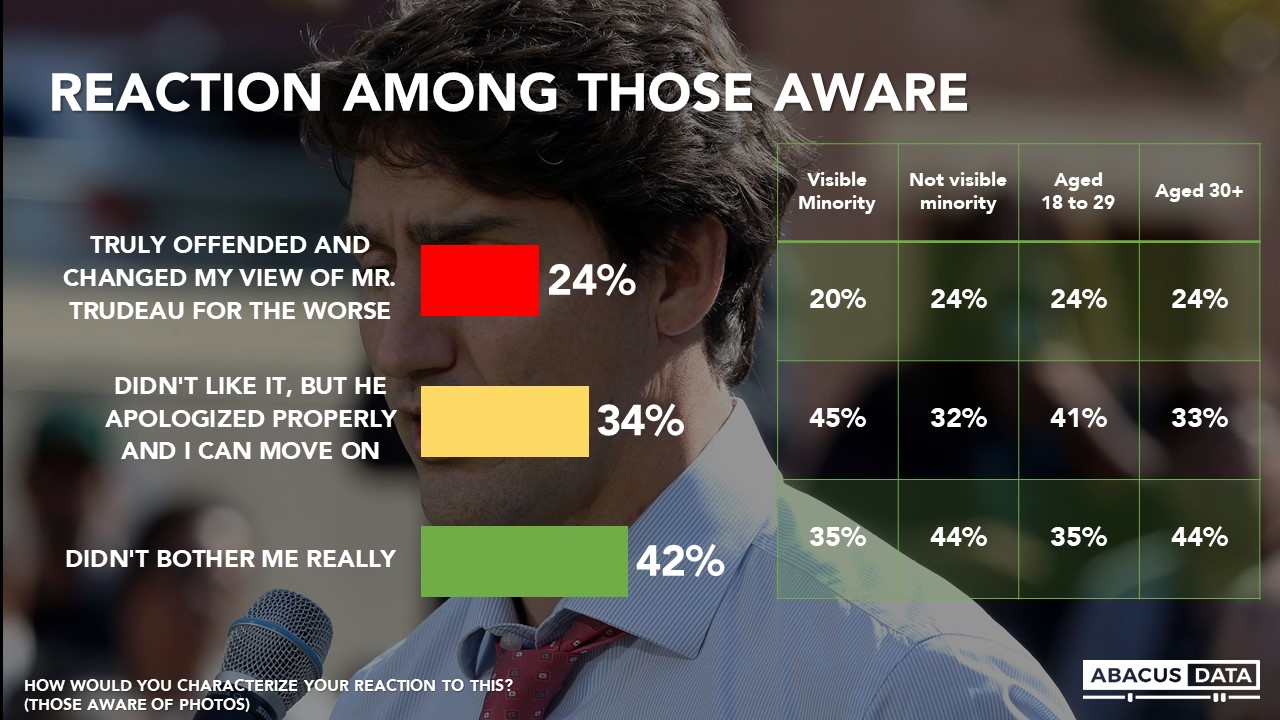
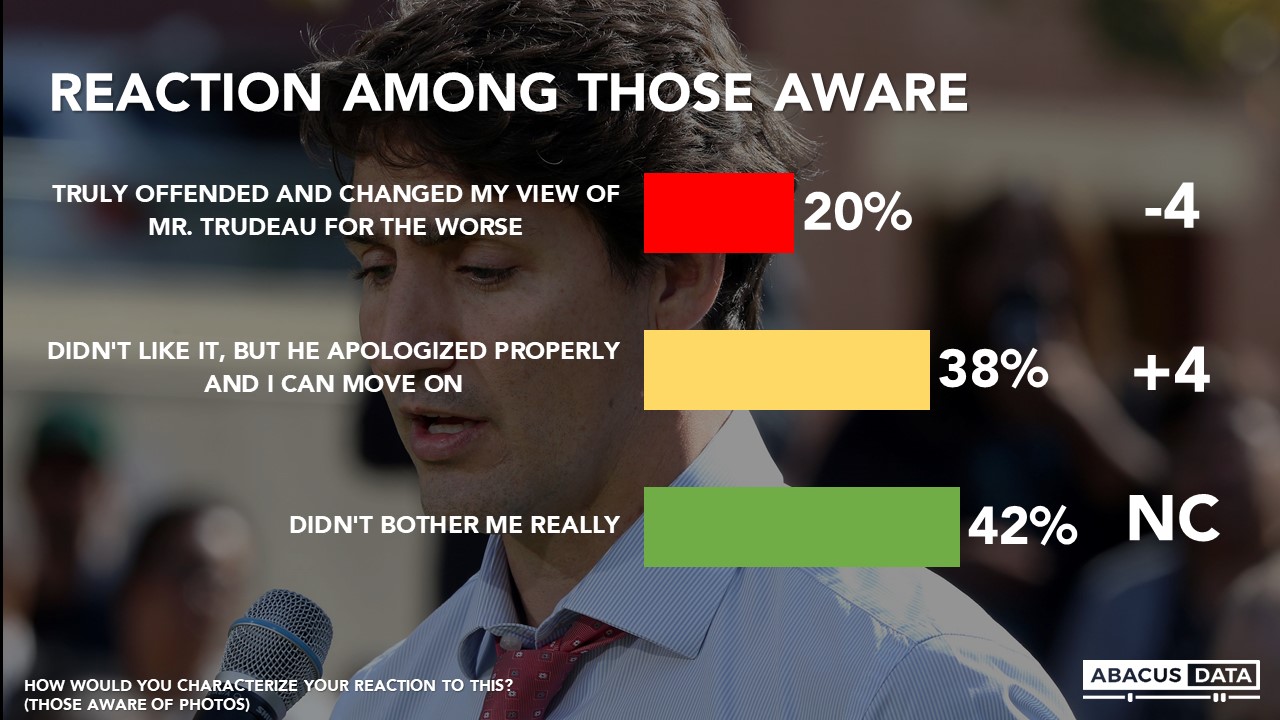
14. Asked how they reacted to the story, 42% (42% last week) said it didn’t really bother them, 38% (34% last week) said they didn’t like it but felt Mr. Trudeau apologized properly and felt they could move on, and 20% (24% last week) said it truly offended them and their view of Mr. Trudeau changed for the worse.

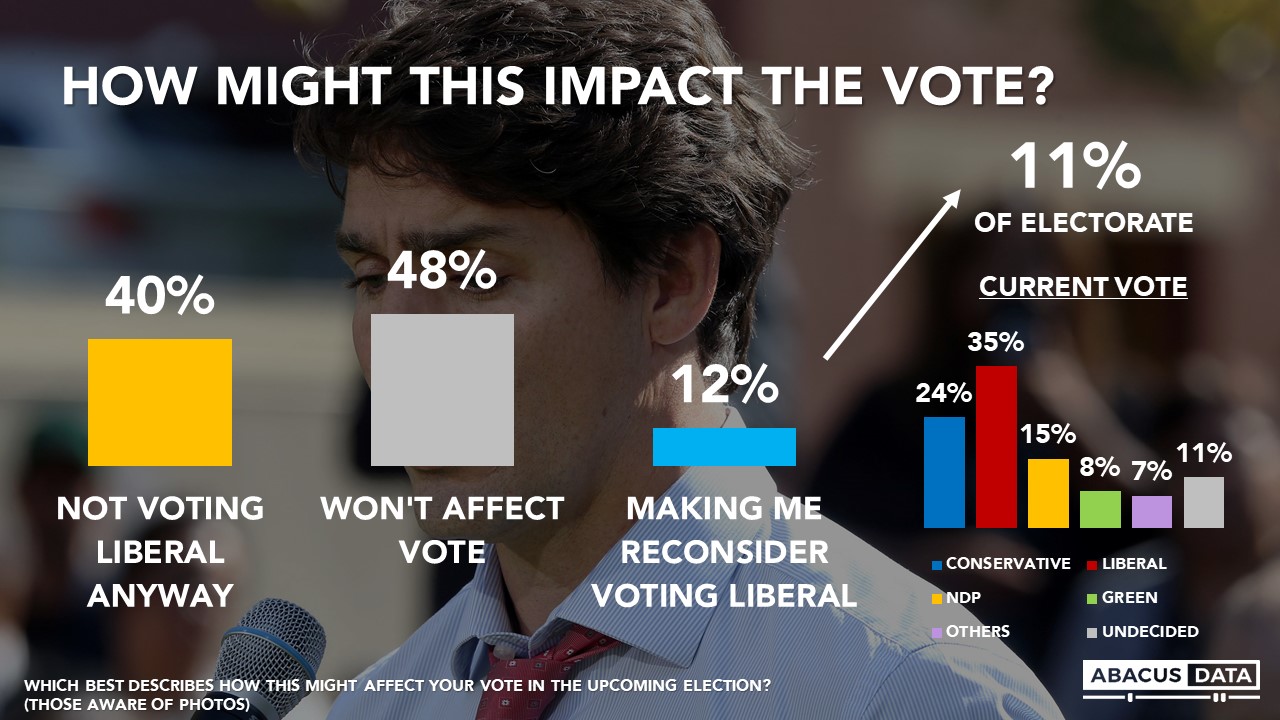
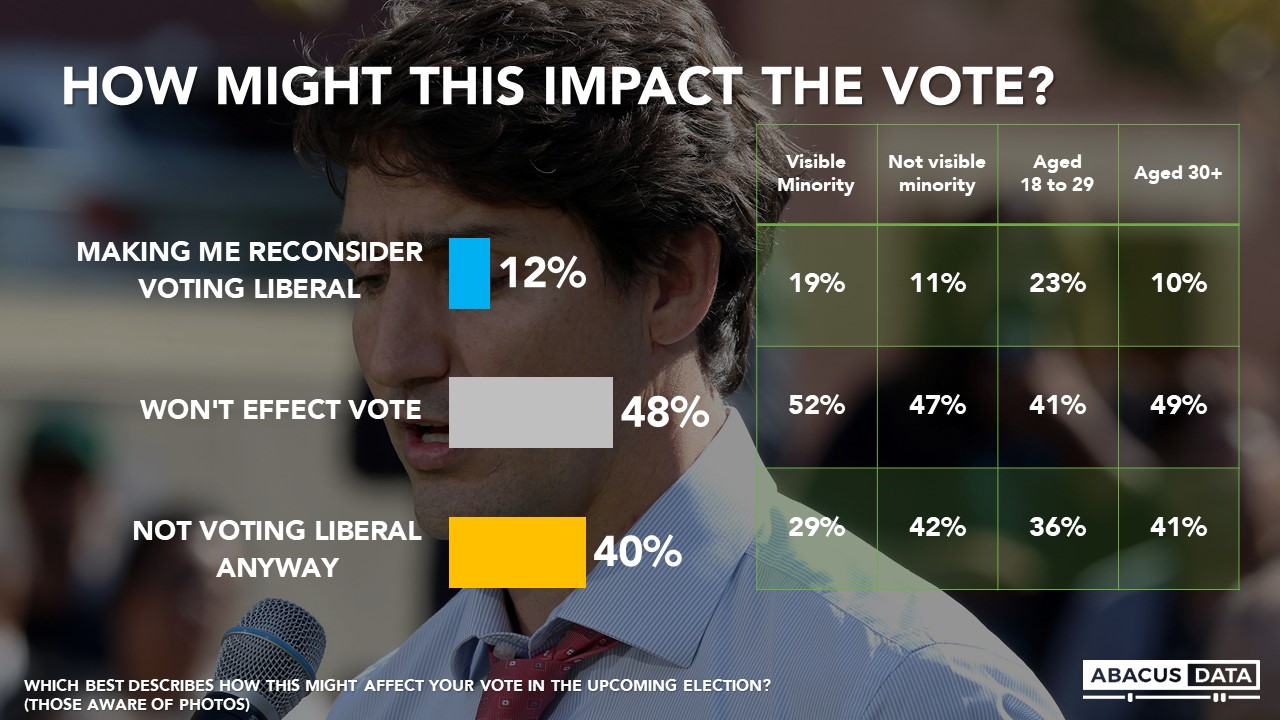
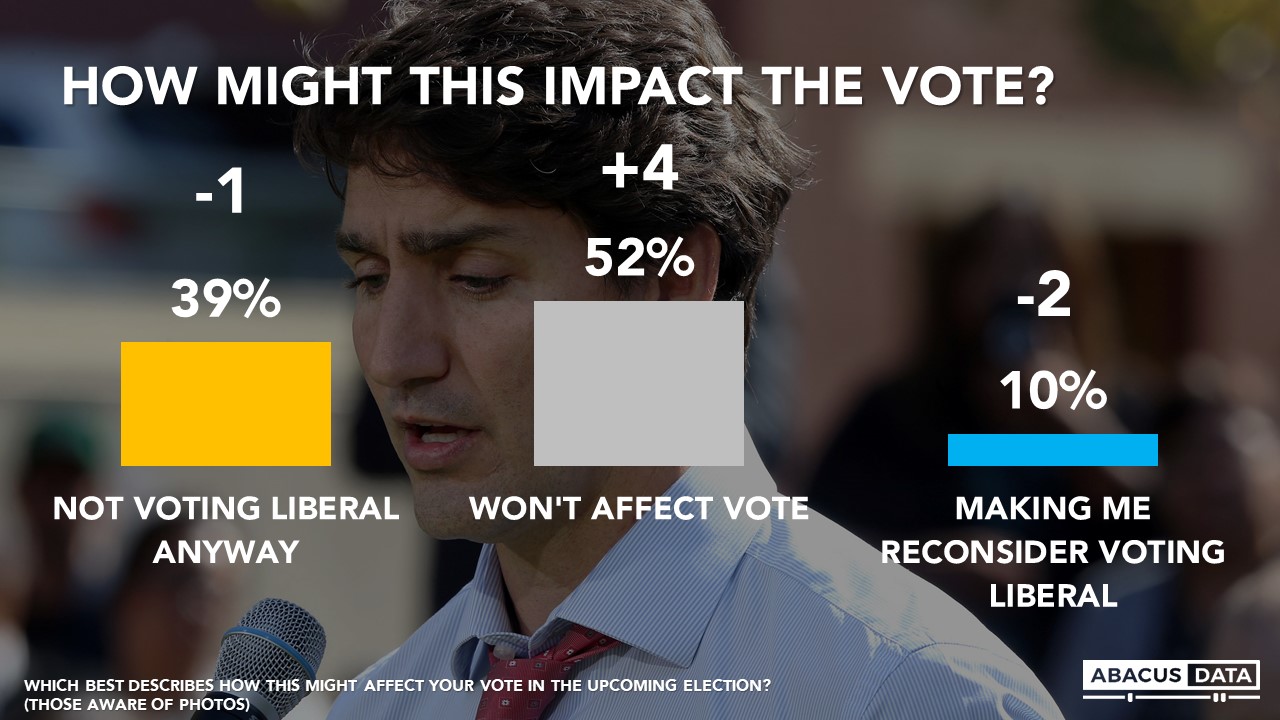
15. Among those aware of the photos, asked how this might affect their vote on Election Day, 39% (40% last week) said they were not planning to vote Liberal anyway, 52 % (48% last week) said it would not affect their vote and that they would decide on other issues. 10% said it was negatively affecting their inclination to support the Liberals (12% last week).

UPSHOT

According to Bruce Anderson: “The race is far too close for either of the leading parties to feel confident of a victory, but if the last week seemed like it doomed the Liberals’ hopes of a second mandate, these numbers say the Liberal Party is, if anything, more competitive than it was. This may have to do with the fact that the large majority saw Mr. Trudeau as having made a foolish mistake, and owning his apology in a forthright and unqualified way – something voters appreciate and seldom see.

It is notable that despite circumstances that might have worked to his advantage (dramatic trouble faced by the Liberal leader, strong Conservative financial and organizational resources and without the burden of accountability that comes with being in government) Andrew Scheer does not seem to be winning a lot of hearts and minds to this point in time.

It may be that fiscal conservatives are wondering about whether his platform feels as fiscally cautious as they expected, centrists may be disappointed in his climate change position, or worried about Ford-style cuts, and progressive voters may feel doubtful of his personal commitment to equal rights for women and same-sex couples. We may explore in more detail some of the hypotheses for the fact that the Conservative have not capitalized on the opportunities, in an upcoming release.”

According to David Coletto: “For the first time since May 2019, we have the Liberals numerically ahead of the Conservatives nationally in our horserace numbers. Built on growing support among younger Canadians and Ontarians, the Liberals are in a much stronger position today than even a few days ago.

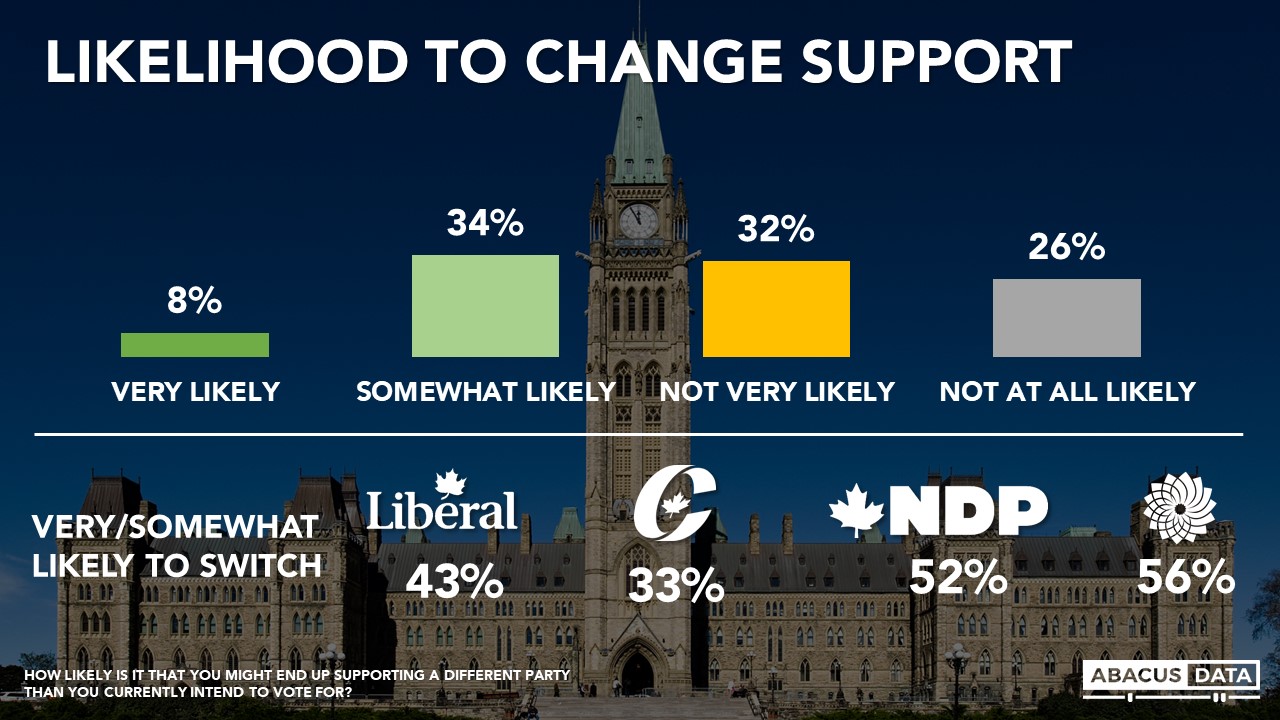
But it’s also worth remembering that while the campaign has been on for two weeks, interest in the campaign hasn’t moved and many people are still saying they could change their mind about their party preference.”

By the way, Abacus Data is growing and looking for an analyst to be based in Ottawa. Find out more here.

pic.twitter.com/h8RDjXeYMh

— David Coletto (@Colettod) September 22, 2019

DATA GRAPHICS

METHODOLOGY

Our survey was conducted online with 1,975 Canadians aged 18 and over from September 23 to 26, 2019. A random sample of panellists was invited to complete the survey from a set of partner panels based on the Lucid exchange platform. These partners are double opt-in survey panels, blended to manage out potential skews in the data from a single source.

The margin of error for a comparable probability-based random sample of the same size is +/- 2.3%, 19 times out of 20.  The data were weighted according to census data to ensure that the sample matched Canada’s population according to age, gender, educational attainment, and region. Totals may not add up to 100 due to rounding.

ABOUT ABACUS DATA

We are the only research and strategy firm that helps organizations respond to the disruptive risks and opportunities in a world where demographics and technology are changing more quickly than ever.

We are an innovative, fast-growing public opinion and marketing research consultancy. We use the latest technology, sound science, and deep experience to generate top-flight research-based advice to our clients. We offer global research capacity with a strong focus on customer service, attention to detail and exceptional value.

Contact us with any questions.

Find out more about how we can help your organization by downloading our corporate profile and service offering.

3 in 4 Canadians welcome student marches for climate change

87% would allow their child to march.

In the wake of several recent marches for climate action and with mass marches approaching on Friday (September 27), including one in Montreal with climate activist Greta Thunberg, the latest Abacus Data-Clean Energy Canada poll reveals:

  • Across the country, 74% say that marches of students in different parts of the world calling for more action on climate change are a good idea. Women (78%), parents (79%) and those under 30 (82%) are especially likely to feel this way. It bears noting that a healthy majority of people over age 60 (68%) also support these marches.
  • A narrow majority of voters on the right of the spectrum (55%) express support for the marches, while 76% of voters on the centre and 85% of voters on the left feel they are a good idea.
  • Belief in the value of these marches is the majority view in every region of the country as well, including Alberta (63%).
  • Asked if they were or are a parent how they would feel about their child participating in such a march, 87% say they would support their child marching, including 48% who say they would do so happily, and 39% with some hesitation. Just 13% would refuse to let their children march, including 20% in Alberta and 24% of voters on the right.
  • One in five people (20%) say the student marches make them a lot more inclined to support climate action, and another 54% say “quite a bit” or “somewhat” more likely to support climate action. Another 14% say they already fully support climate action.  Just 12% say the marches have the opposite effect on their opinion, including 28% of voters on the right of the spectrum.

QUOTES

“Greta Thunberg has helped create a new and compelling form of advocacy on the climate issue by drawing sharp attention to intergenerational responsibility. A sense of moral obligation is felt by a very broad majority of Canadians, and many people feel more compelled to support urgent climate action because of the power of this youth movement.”

—Bruce Anderson, Chairman, Abacus Data

“It’s our kids who will be most impacted by climate change. And they are making it clear today how the leaders of tomorrow will look back on us. Canada has one of the largest carbon footprints of any country in the world. We must now act responsibly considering our direct contribution to climate change, our position of influence on the world stage, and our capacity to develop and deliver clean energy solutions.”

—Dan Woynillowicz, Policy Director, Clean Energy Canada

METHODOLOGY

The survey was conducted online using a random sample of 1,929 panelists invited to complete the survey from a set of partner panels based on the Lucid exchange platform. These partners are typically double opt-in survey panels, blended to manage out potential skews in the data from a single source.

The margin of error for a comparable probability-based random sample of the same size is +/- 2.2%, 19 times out of 20.  The data were weighted according to census data to ensure that the sample matched Canada’s population according to age, gender, educational attainment, and region. Totals may not add up to 100 due to rounding.

Dan Woynillowicz and Bruce Anderson are available for interviews.

Clean Energy Canada (cleanenergycanada.org) is a climate and energy think tank housed at the Centre for Dialogue at Simon Fraser University. We work to accelerate our nation’s transition to a clean and renewable energy system.

ABOUT ABACUS DATA

We are the only research and strategy firm that helps organizations respond to the disruptive risks and opportunities in a world where demographics and technology are changing more quickly than ever.

We are an innovative, fast-growing public opinion and marketing research consultancy. We use the latest technology, sound science, and deep experience to generate top-flight research-based advice to our clients. We offer global research capacity with a strong focus on customer service, attention to detail and exceptional value.

Contact us with any questions.

Find out more about how we can help your organization by downloading our corporate profile and service offering.

CONTACT

Keri McNamara
Communications Specialist
778-951-8060

Bruce Anderson
Chairman
Abacus Data
613-882-0929

Election Poll: A sensational week, yet a tight race remains

In the days following the bombshell revelations of photographs of Justin Trudeau in blackface we have been polling Canadians on the election and specifically on their reaction to that development.

Here’s what our data show.

1. The national race remains very tight, with the Conservatives holding 34% support, the Liberals 32%, the NDP at 15%, and the Green Party 11%. Each of these numbers is within a percentage point of the result we found in our last survey, which took place before the election campaign began.

2. Regionally, the Liberals have a wide lead in Atlantic Canada and Quebec, a 4-point lead in Ontario, and trail by wide margins in the Prairie provinces. In BC, the Liberals and Conservatives are tied at 30% with the NDP at 22% and the Greens at 15%.

3. Justin Trudeau’s personal ratings have slipped. His positives are down 4-points, and his negatives are up 3. At the same time, Andrew Scheer, Jagmeet Singh and Elizabeth May have all seen deterioration in their ratings as well. Ms. May’s numbers are the worst we have seen for her since March of this year. Mr.Scheer’s positives have dropped 3-points, and his negatives have hit a new high at 39%.

4. 63% of voters say they have made up their minds how they are going to vote, and 54% say they have been following the campaign very or pretty closely. Just under half say they have been paying only a little or no attention and 37% say they haven’t yet made up their mind about how they will vote.

5. 41% think the Conservatives will win, 40% think the Liberals will. Regionally, most in the Prairies think the Conservatives will win with about one in four thinking the Liberals will win. In BC, 39% think the Liberals will win, 35% Conservative, and 14% NDP. In Ontario, 43% feel the Conservatives will win with 39% predicting a Liberal win. Only 9% in Ontario feel the NDP will win. In Quebec, half think the Liberals will win with 27% saying the Conservatives and 5% NDP.

6. Asked what party they would like to see victorious, 32% say the Conservatives, 30% the Liberals, 16% the NDP and 11% the Green Party.

7. Asked if it came down to a choice between a Liberal and a Conservative government, 53% would prefer a Liberal government, 47% a Conservative government. In BC 58% would prefer the Liberals, in Ontario 55%, in Quebec 56%.

8. 53% said they heard a lot about the blackface story, another 34% have heard some. 13% had not heard of it at all.

9. Asked how they reacted to the story, 42% said it didn’t really bother them, 34% said they didn’t like it but felt Mr. Trudeau apologized properly and felt they could move on, and 24% said they were truly offended and it changed their view of Mr. Trudeau for the worse. Worth noting is that of that 24%, two-thirds are Conservative voters.

10. Among those aware of the photos, asked how this might affect their vote on Election Day, 40% said they were not planning to vote Liberal anyway, 48% said it would not affect their vote and that they would decide on other issues. Of the 12% who said it was affecting their thinking, half said they were considering the Liberals but leaning away from them because of the incident and half said they were considering the Liberals but cannot support them now.

11. That 12% tend to be younger with 71% under the age of 45. 62% voted Liberal in 2015 while 23% voted Conservative. 27% identified as a member of a visible minority or racialized community, 9-points higher than the national average in our sample. 57% of this group would still prefer the Liberals to win compared with 43% who prefer the Conservatives.

12. Those who identify as members of a visible minority community and voters under 30 were both 9 points more likely to say they were bothered by the photographs compared to non-visible minorities and older voters. However, both groups were also 12 points more likely to say that they accepted the apology and could move on. Both groups also more likely than average to say this has caused them to reconsider whether they will support the Liberals, suggesting that the ultimate impact on their voting intention is somewhat uncertain.

UPSHOT

According to Bruce Anderson: “This election may feel to combatants as though it has been going on for a long time, but many Canadians have not yet been following it very closely.  Still, last week Mr. Trudeau’s reputation was damaged, albeit perhaps less than might have been surmised or expected.

Other leaders have not gained at Mr. Trudeau’s expense through this period, and the relative standing of the parties is largely unchanged.

It’s clear that Mr. Trudeau wearing blackface has affected many people, and the impact on their final decision can’t really be predicted. The race is close enough that it could make the difference and cause the Liberals to lose office – but the results also show that Mr. Trudeau’s apology was accepted by many people and that the plurality is inclined to say other issues will have a bigger impact on their choice.

According to David Coletto: “The photos and video released late last week was a shock that changed the focus and conversation of the election campaign. But so far, evidence that they have fundamentally changed people’s impressions or intended voting behaviour is quite limited.

The race remains very close, all the party leaders are viewed less favourably than at the start of the campaign, and most people say that so far, the events of the past few days won’t change their vote. But two key voter groups for the Liberals are more likely to say it might impact their choice.

Perhaps most important, among those who are aware of the story and say it has them reconsidering their support for the Liberals, 57% would prefer the Liberals to win, and 43% would prefer the Conservatives. The campaign has been, to a large degree, about this choice and will continue to be so.

Ultimately, the blackface photos may be the campaign moment that prevents the Liberals from being re-elected. But the initial reaction and how voters are reacting so far suggests there’s way too much campaign left to make that conclusion today.”

By the way, Abacus Data is growing and looking for an analyst to be based in Ottawa. Find out more here.

DATA GRAPHICS

METHODOLOGY

Our survey was conducted online with 1,929 Canadians aged 18 and over from September 18 to 22, 2019. A random sample of panellists was invited to complete the survey from a set of partner panels based on the Lucid exchange platform. These partners are double opt-in survey panels, blended to manage out potential skews in the data from a single source.

The margin of error for a comparable probability-based random sample of the same size is +/- 2.3%, 19 times out of 20.  The data were weighted according to census data to ensure that the sample matched Canada’s population according to age, gender, educational attainment, and region. Totals may not add up to 100 due to rounding.

ABOUT ABACUS DATA

We are the only research and strategy firm that helps organizations respond to the disruptive risks and opportunities in a world where demographics and technology are changing more quickly than ever.

We are an innovative, fast-growing public opinion and marketing research consultancy. We use the latest technology, sound science, and deep experience to generate top-flight research-based advice to our clients. We offer global research capacity with a strong focus on customer service, attention to detail and exceptional value.

Contact us with any questions.

Find out more about how we can help your organization by downloading our corporate profile and service offering.

Introducing the 19% of voters who could decide this election

In Abacus Data’s last political update, I noted that we should not assume that NDP or Green Party voters will vote strategically for the Liberals if it appears the Conservatives and Andrew Scheer appear likely to win the election.

To explore this idea in more depth, I returned to the dataset to see what else we can learn from our latest survey. Specifically, I used responses to our vote consideration questions to create four distinct voter segments: those who would consider voting Liberal but not Conservative (32% of the electorate), those who would consider voting Conservative, but not Liberal (30% of the electorate), those open to voting for both the Liberals and Conservatives (19% of the electorate), and those who would not consider voting for either (19% of the electorate).

The Liberals and Conservatives have access to half the electorate, but only a portion of it overlaps. Both have accessible voter pools sufficiently large enough to win the election but if we assume the parties need about 37% to 40% of the vote to win a majority, they will need to convert about 3 in 4 of their accessible voters to pull this off. This framing of the electorate also shows that about 1 in 5 potential voters is out of bounds to both parties.

When we look at how each of these groups would vote at the time of the survey, 84% of the Conservative, not Liberal group would vote Conservative. 8% would go NDP while 7% would split between the Greens, People’s Party and BQ. 75% of the Liberal, not Conservative group would vote Liberal with 15% voting NDP and 8% voting Green. 2% would split between the People’s Party and BQ. Among the group who would consider both the Liberals and Conservatives, the Liberals have a slight lead, 43% to 37% over the Conservatives. Another 9% would vote NDP, 7% Green, and 3% to other parties.

Based on this, what are some paths to victory for the Conservatives and Liberals? Let’s control for voter turnout as it’s a variable harder to estimate right now (although a really important one). I will also assume that those not open to voting either the Liberals or Conservatives will stay that way. They will either vote for another party or not vote at all (they are the least likely to say they will vote of the four groups).

A Conservative Path to Victory

Let’s assume that the Conservatives convert the 84% of those who would consider voting Conservative, but not Liberal as our poll says they have now. In order to win at least 37% of the popular vote, they would have to win about half of those open to voting for both the Liberals and Conservatives, 13-points more than they have now.

The challenge for the Conservatives in doing this is that only 25% of this group believe the country is headed off on the wrong track, only 33% definitely want a change in government, and 21% have a negative impression of Mr. Trudeau. Only 19% have a negative of Mr. Scheer but 31% have a neutral view meaning their view of the Conservative Leader can be shaped either positively or negatively. Unless the campaign shifts these views, this may difficult to achieve.

A Liberal Path to Victory

Let’s assume that the Liberals convert the 75% of those who would consider voting Liberal, but not Liberal as our poll says they have now. In order to win at least 37% of the popular vote (although they might be able to win a majority with less than this), they would have to win about two thirds of the group open to both parties, or 23-points more of this group.

This is a tall order for sure, but not impossible. Among this group, 61% think the country is headed in the right direction (another 14% aren’t sure), 79% have either a positive or neutral impression of Mr. Trudeau, and only 24% would react negatively to a Liberal majority. All these numbers suggest it’s possible. The challenge for the Liberals is that 76% of this group would prefer a change in government (33% definitely want change while 43% think change would be good but it’s not important).

So the Liberal campaign needs to convince these voters that they have accomplished a lot, deserve to be re-elected and convert the general positive mood and good will towards Trudeau into votes.

The Upshot

These two scenarios demonstrate that both parties can win this election. But my sense is that the Liberals likely have the easier path than the Conservatives. Even if 1 in 5 voters vote for neither the Liberals nor Conservatives, there are enough left for both parties to win. Focusing on those swing voters that straddle their two universes is what the 2019 election will be about for both the Liberals and Conservatives.

Supporting Data Charts

METHODOLOGY

Our survey was conducted online with 2,000 Canadians aged 18 and over from September 6 to 10, 2019 . A random sample of panellists was invited to complete the survey from a set of partner panels based on the Lucid exchange platform. These partners are double opt-in survey panels, blended to manage out potential skews in the data from a single source.

The margin of error for a comparable probability-based random sample of the same size is +/- 2.2%, 19 times out of 20.  The data were weighted according to census data to ensure that the sample matched Canada’s population according to age, gender, educational attainment, and region. Totals may not add up to 100 due to rounding.

ABOUT ABACUS DATA

We are the only research and strategy firm that helps organizations respond to the disruptive risks and opportunities in a world where demographics and technology are changing more quickly than ever.

We are an innovative, fast-growing public opinion and marketing research consultancy. We use the latest technology, sound science, and deep experience to generate top-flight research-based advice to our clients. We offer global research capacity with a strong focus on customer service, attention to detail and exceptional value.

Contact us with any questions.

Find out more about how we can help your organization by downloading our corporate profile and service offering.

Elections begins with a tie but high potential for shifts during the campaign

 We completed our latest national survey the day before the official election campaign began.

Here’s where things stand at the start of the campaign:

 LIBERALS LEAD IN ATLANTIC AND QUEBEC, CONSERVATIVES ON THE PRAIRIES. BC AND ONTARIO ARE TWO HORSE RACES.

If an election were held at the time of the survey, the Conservatives (35%) and Liberals (33%) would capture roughly the same amount of popular support, followed by the NDP at 15%, the Greens at 10%, and the BQ at 4% (17% in Quebec).  Maxime Bernier’s People’s Party registers 3% support nationally.

The Conservatives lead among those over 60. The Liberals lead among those under 30. And among voters in between those age groups, the two parties are in a statistical dead heat.

The Liberals lead in the Atlantic provinces and Quebec, while the Conservatives are well ahead in the Prairies. Ontario and British Columbia are close in our latest survey.

Conservatives have a massive lead among voters who self identify as right of centre, including a 49-point lead among “centre-right” voters.  Liberals have substantial leads among left of centre voters, but still split a significant proportion of that vote with the NDP and Green Party, and even with the Conservatives.  Among centre-left voters, the Liberals have a 30-point lead over the NDP.  Worth noting is that among self-described right-wingers, the People’s Party has only 4-5% of the vote.

Because affordability and cost of living issues have featured prominently in the issues that concern Canadians, it is also worth noting that among the 20% of Canadians who say that they can’t afford the things they need, voting intentions are pretty diffuse: 34% would vote Conservative tomorrow, 23% NDP, 19% Liberal and 15% Green.

THE POTENTIAL FOR VOTE SWITCHING

Across the country, 42% say it is very or somewhat likely that they will end up supporting a different party than the one they think they would vote for today.  Quebecers are the most open to possibly switching (49%) while Albertans least so (32%).

Fully 62% of voters under 30 and 51% among those aged 30-44 say they might switch, compared to just 24% among those over 60.

The Conservative vote is most stable, with 33% of current Conservative voters saying them are very or somewhat likely to switch, compared to 43% among Liberal supporters. The Green and NDP voters are most vulnerable, with 56% of Green voters and 52% of NDP voters saying they might look elsewhere on election day.  42% of those who say they are left-wing might switch, compared to just 27% of those who say they are right-wing.

Conservative switchers would scatter 31% to the Liberals, 22% to the NDP, 21% to the Greens and 27% to other parties.

Liberal switchers would also scatter with 37% going to the NDP, 26% going Conservative, and 22% to the Greens.

NDP switchers would be more likely to go Liberal (42%) or Green (33%) than Conservative (16%)

Green Party switchers would go to the NDP (30%) and the Liberals (27%) followed by the Conservatives at 16%. Another quarter would choose another party, split mostly between the BQ and People’s Party.

PREFERRED PRIME MINISTER

Today, 35% would prefer to see Justin Trudeau remain Prime Minister, compared to 33% for Andrew Scheer, 15% for Elizabeth May, and 13% for Jagmeet Singh.  Just 5% would like to see Max Bernier become Prime Minister.

Mr. Trudeau has a 28-point lead in Atlantic Canada on this question and a 16-point lead in Quebec. Mr. Scheer leads Mr. Trudeau by a wide margin in the Prairie provinces while the two are within 3 points of each other in Ontario and British Columbia.

IMPRESSIONS OF THE LEADERS

Mr. Trudeau has 35% positive and 46% negative opinion across the country unchanged from our last survey at the end of August. He is well regarded by those on the left, poorly regarded by those on the right. Among voters in the centre of the spectrum, 31% view him positively, 47% negatively.

Among NDP voters he is -21, among Green Party voters his net favourable/unfavourable score is -34, and among Conservatives, he is -75.

Andrew Scheer has 35% positive and 38% negative opinion nationally both up marginally since the end of August.  He is broadly liked on the right, disliked on the left. Among those on the centre his net score is -5, substantially better than for Mr. Trudeau (-16).

Among NDP voters, Scheer is -40, among Green Party voters he is -46, and among Liberal Party voters he is -46.  He is -43 among BQ voters (Trudeau is -28).

Jagmeet Singh is 30% positive and 28% negative, the first moment in some time that the NDP leader has been into net positive territory as his positives are up 4 since the end of August.  He is +16 among Liberal voters, +2 among Green Party voters, but -33 among Conservatives and -20 among BQ voters.

Elizabeth May has the most favourable image among Canadians with 33% positive and 19% negative (+14).  Among Liberal voters, her image is +17, -11 among Conservatives, +29 among NDP supporters, and +85 among Green supporters.

THE ECONOMY AND STATE OF THE COUNTRY

As the election starts, 43% say the economy is in excellent or good shape and another 31% all the current economy “acceptable”.  Only 27% nationally say the economy is in poor/pretty poor or terrible shape, but that number rises to 51% in Alberta.

Despite this positive assessment of the country, more continue to believe the country is headed off on the wrong track than in the right direction.

UPSHOT

According to Bruce Anderson: “Barring something quite unexpected, this is a race that will go to the Liberals or the Conservatives.  Whether those two parties win from or lose votes to each other is the dynamic that could have the biggest impact on seat counts, but if they mostly hold their ground against each other, the outcome will be decided by how the NDP and Green Parties do at holding or increasing their support levels.

With just over half of Green/NDP votes indicating they could move around, that amounts to about 12% of the electorate.  If the Liberals can pull some of this vote by raising fears of conservative social and environmental values, they will be in a good position to win.  If they can’t, and if the Conservatives can shake loose some Liberal and BQ votes, the outcome could well be a Scheer government. If campaigns always matter – this one may matter even more than usual, given how close things are at the outset.“

According to David Coletto: “The 2019 election begins with a deadlocked national vote and a lot of uncertainty. Voters appear open to persuasion and not fully dialled into politics nor have seriously considered their choices.

A few things stand out to me from our first election poll.

Although we might assume that NDP or Green supporters would prefer Mr. Trudeau over Mr. Scheer as Prime Minister, our data suggests otherwise. If the election becomes polarized, we can’t assume that Mr. Trudeau would be the primary beneficiary of voters who switch their preferences away from the NDP or Greens. While more potential NDP or Green switchers would choose the Liberals over the Conservatives, many say they would go NDP or Green explaining the recent tussle between the NDP and Green Party.

While the NDP has struggled to nominate candidates and will have less money to campaign this time, early signals point to some positive movement for Mr. Singh. For the first time in a while, more view him positively than negatively. This hasn’t translated into more support yet, but it’s some good news for a party that hasn’t had very much over the past few months.

Right now, polling is telling us what voters’ first impressions are. Many haven’t considered their choices or know the leaders all that well. The campaign can either confirm or change them but would be wrong to consider them static. Either way, the electorate is in a more defensive posture than in 2015, despite feeling relatively good about the economy. They don’t seem that excited about their choices and many are likely looking for cues about where the election is going. My sense is that this election begins in uncertain waters and where things end up is quite difficult to predict.”

Check out this additional content:

See what Canadians are searching for online with a quick look at our Google Search trends tracking.

By the way, Abacus Data is growing and looking for an analyst to be based in Ottawa. Find out more here.

And in case you missed it, yesterday we released this new poll with Clean Energy Canada.

METHODOLOGY

Our survey was conducted online with 2,000 Canadians aged 18 and over from September 6 to 10, 2019. A random sample of panellists was invited to complete the survey from a set of partner panels based on the Lucid exchange platform. These partners are double opt-in survey panels, blended to manage out potential skews in the data from a single source.

The margin of error for a comparable probability-based random sample of the same size is +/- 2.2%, 19 times out of 20.  The data were weighted according to census data to ensure that the sample matched Canada’s population according to age, gender, educational attainment, and region. Totals may not add up to 100 due to rounding.

ABOUT ABACUS DATA

We are the only research and strategy firm that helps organizations respond to the disruptive risks and opportunities in a world where demographics and technology are changing more quickly than ever.

We are an innovative, fast-growing public opinion and marketing research consultancy. We use the latest technology, sound science, and deep experience to generate top-flight research-based advice to our clients. We offer global research capacity with a strong focus on customer service, attention to detail and exceptional value.

Contact us with any questions.

Find out more about how we can help your organization by downloading our corporate profile and service offering.

1 in 2 Canadians say action to reduce emissions is “urgent”

Most say they can and should do more personally.

As the country enters an election campaign, the latest Abacus Data – Clean Energy Canada poll reveals that 9 in 10 voters see climate action as important or urgent.  And most people think they both can and should do more personally to help combat the threat.

  • Across the country, 50% say action to reduce emissions is urgent, 40% important. These views are quite consistent across the country. They differ in Alberta, where 35% say urgent and 49% say important.
  • Fully 88% say they personally can do a little bit (30%), a fair bit (38%) or a lot more (20%) to reduce their impact in terms of greenhouse gas emissions. And 88% say they should do more, including 25% who say they should do a lot more, 36% a fair bit more, and 27% a little more.  Regional differences on these questions are pretty mild, but generational differences are notable: younger Canadians are more likely to say they can and should do more to reduce emissions compared to older people.
  • Most people want to see government policy of some sort to encourage emissions reduction. Given a choice between taxes, incentives, both or neither – 37% prefer incentives, followed by 35% who say both tools should be used. Ten percent prefer using only taxes, not incentives. And 18% reject the use of either policy approach. Once again, on this question, regional differences are mild.

QUOTES

“Worry for the future of the planet is on the mind of voters as they consider the direction they choose for the country this fall.  People want government policies to deal with the problem, and they also see themselves as having a personal responsibility to do more.  The market for climate denial is small, and the willingness to go along with using tax measures along with incentives is broader than some might think.”

Bruce Anderson, Chairman, Abacus Data

“It’s encouraging to see how many Canadians believe they both can and should do more. Enabling citizens to do more requires sustained federal policies and programs, both taxes and incentives. Building on the federal policies we already have—from pricing pollution and providing rebates to making electric cars more affordable and accessible—can help the large majority of Canadians who want to do more, do just that.”

Dan Woynillowicz, Policy Director, Clean Energy Canada

METHODOLOGY

The survey was conducted online with 1,500 Canadian residents aged 18 and over, from August 23 to 28, 2019.

A random sample of panellist were invited to complete the survey from a set of partner panels based on the Lucid exchange platform. These partners are typically double opt-in survey panels, blended to manage out potential skews in the data from a single source.

The margin of error for a comparable probability-based random sample of the same size is +/- 2.6%, 19 times out of 20.  The data were weighted according to census data to ensure that the sample matched Canada’s population according to age, gender, educational attainment, and region. Totals may not add up to 100 due to rounding.

Dan Woynillowicz and Bruce Anderson are available for interviews.

Clean Energy Canada (cleanenergycanada.org) is a climate and energy think tank housed at the Centre for Dialogue at Simon Fraser University. We work to accelerate our nation’s transition to a clean and renewable energy system.

ABOUT ABACUS DATA

We are the only research and strategy firm that helps organizations respond to the disruptive risks and opportunities in a world where demographics and technology are changing more quickly than ever.

We are an innovative, fast-growing public opinion and marketing research consultancy. We use the latest technology, sound science, and deep experience to generate top-flight research-based advice to our clients. We offer global research capacity with a strong focus on customer service, attention to detail and exceptional value.

Contact us with any questions.

Find out more about how we can help your organization by downloading our corporate profile and service offering.

CONTACT

Trevor Melanson
Communications Manager
604-341-5091

Bruce Anderson
Chairman
Abacus Data
613-882-0929

Extreme weather spurs demand for climate action

GREENLAND MELTING, AMAZON BURNING LATEST SIGNS

From hurricanes to melting ice in Greenland, the large majority of Canadians believe that these situations are linked to human- and industrial- caused climate change, and it’s causing them to expect more policy action from governments according to a new poll conducted by Abacus Data with Clean Energy Canada.

  • Across the country, more than 3 in 4 Canadians believe climate change is probably, almost certainly, or certainly caused by human and industrial activity. Only 8% nationally and 15% in Alberta believe this is unlikely, probably not happening, or certainly not happening.
  • More than 75% of those surveyed say they think a series of events, from floods and fires in Canada to record heats in Alaska and melting ice in Greenland, are likely to be certainly caused by human- and industrial-influenced climate change. Atop the list of things that people are most convinced are linked are melting ice in Greenland, record heat in Alaska and record heat waves in Europe.
  • Roughly 3 in 4 or more voters say each of the situations tested have a big to huge impact in their desire to see action taken to combat climate change. Melting in Greenland and fires in the Amazon are at the top of the list of drivers of demand for action, but all of the items tested had a strong impact on public expectations for action.

QUOTES

“Climate change is no longer just an inconvenient truth—it’s an inconvenient experience for millions of Canadians. From the record-setting fires out west to the floods and heatwaves out east, we are experiencing the consequences of climate change firsthand. As demonstrated by these poll results, a strong majority of Canadians are connecting the dots between climate change and the catastrophic weather events they’re seeing on the news or increasingly experiencing in their own backyard.”

—Dan Woynillowicz, Policy Director, Clean Energy Canada

“Hurricane Dorian, the 4th Category 5 hurricane in the last two years, was not really on the horizon when this survey was completed.  But Canadians were already broadly convinced that storms, floods, worrying warming in the North, fatal heatwaves in Europe and devastating fires in the Amazon are all part of a broad phenomenon that society should be doing more to arrest. There may be an active political debate about carbon pricing but there is a sweeping consensus that climate action should be a priority, as signs of Earth’s duress dominate the news.”

—Bruce Anderson, Chairman, Abacus Data

METHODOLOGY

The survey was conducted online with 1,500 Canadian residents aged 18 and over, from August 23 to 28, 2019.

A random sample of panellist were invited to complete the survey from a set of partner panels based on the Lucid exchange platform. These partners are typically double opt-in survey panels, blended to manage out potential skews in the data from a single source.

The margin of error for a comparable probability-based random sample of the same size is +/- 2.6%, 19 times out of 20.  The data were weighted according to census data to ensure that the sample matched Canada’s population according to age, gender, educational attainment, and region. Totals may not add up to 100 due to rounding.

Dan Woynillowicz and Bruce Anderson are available for interviews.

Clean Energy Canada (cleanenergycanada.org) is a climate and energy think tank housed at the Centre for Dialogue at Simon Fraser University. We work to accelerate our nation’s transition to a clean and renewable energy system.

ABOUT ABACUS DATA

We are the only research and strategy firm that helps organizations respond to the disruptive risks and opportunities in a world where demographics and technology are changing more quickly than ever.

We are an innovative, fast-growing public opinion and marketing research consultancy. We use the latest technology, sound science, and deep experience to generate top-flight research-based advice to our clients. We offer global research capacity with a strong focus on customer service, attention to detail and exceptional value.

Contact us with any questions.

Find out more about how we can help your organization by downloading our corporate profile and service offering.

CONTACT

Keri McNamara
Communications Specialist
778-951-8060
keri@cleanenergycanada.org

Bruce Anderson
Chairman
Abacus Data
613-882-0929
banderson@abacusdata.ca

Election 2019: A tale of two (or more) races

 In our recent national survey of 4,549 Canadians, completed on August 28, we asked our usual political tracking questions.  Here’s what we found:

 LIBERALS AND CONSERVATIVES DEADLOCKED IN POPULAR VOTE

 If an election were held at the time of the survey, the Conservatives (34%) and Liberals (33%) would capture the same amount of popular support, followed by the NDP at 17%, the Greens at 9%, and the BQ at 4%.

However, over time it’s become more challenging to understand the flow of the campaign without looking separately at the two provinces where the Conservatives enjoy very strong support and the rest of the country where more parties are involved in a tighter race.

In Alberta and Saskatchewan, the Conservatives have a massive 38-point lead over the Liberals.  Over the year, the Conservatives have never been above 61% or below 50% in this part of the country, and the Liberals have never been above 23% or below 15%.

In contrast, in the rest of the country, the Liberals hold a five-point lead.  Since the start of the year, they have never been above 38% or below 34%. The Conservatives have traded in the range of 27% to 31% through the year.  The gap between the two parties narrowed to 3 points in April but has been 5 points or more since then.

The NDP has had a range of 15%-19%. The Green Party rose from a low of 8% to a high of 13% but more recently have been tracking a couple of points below that high.

Our latest numbers show the Liberals with a substantial lead (13 points) in Atlantic Canada, a 12 point lead in Quebec and a 4 point lead in Ontario.  BC is a tie between the Liberals and Conservatives with the NDP and the Green parties together corralling 36% of the vote, considerably higher than their combined impact in any other region.

ACCESSIBLE VOTERS: LIBERAL POOL GROWING A BIT, CPC STEADY.

When we asked people whether they would consider voting for each of the main political parties, 52% would consider voting Liberal, up 4 points from April lows. 48% would consider voting Conservative unchanged since earlier this month. 44% would consider voting NDP, while 41% would consider the Greens.  Comparing those living in Alberta and Saskatchewan and those living in other provinces, we find big differences in the voter pools.

In Alberta and Saskatchewan, 69% are open to voting Conservative, which is 29-35 points ahead of the other three parties. Elsewhere in the country, the Liberals have a 9-point advantage over the Conservatives and NDP. Since June, the Liberal accessible voter pool has recovered somewhat, almost to the levels seen before the SNC Lavalin issue emerged.

FEDERAL GOVERNMENT APPROVAL: REMAINS MORE NEGATIVE THAN POSITIVE; HOWEVER, APPROVAL UP 5-POINTS SINCE APRIL

37% approve of the job the federal government is doing, compared to 46% who disapprove.  Approval is up five points from a low point in April.

In Alberta and Saskatchewan, approval has never been above 30% since the end of 2018, while disapproval has ranged from 56% to 65%, and stands at 61% today.

Outside of Alberta and Saskatchewan, 38% currently approve of the federal government’s performance while 43% disapprove. The government’s approval hit a low of 34% in April but has improved by 4-points since then.

LEADER IMAGES SHOW LITTLE MOVEMENT

Preferred Prime Minister results show 35% preferring Mr. Trudeau and 32% for Mr. Scheer. Both Ms. May and Mr. Singh are preferred by 14%.  In Alberta and Saskatchewan, Mr. Scheer has a 29-point lead over Mr. Trudeau. In other parts of the country, Mr. Trudeau leads by 12 points. Preference for Mr. Scheer’s as PM among Alberta and Saskatchewan residents are below his party’s vote share.  Mr. Trudeau’s number fairly closely parallels his party’s level of support in the rest of the country.

Personal approval of Mr. Trudeau shows 35% positive, 45% negative, slightly improved over his 32-46 split in April. Ratings for Mr. Scheer are 33% positive, 37% negative. The trajectory for the Conservative leader has been to see his positives grow 14 points in two years and his negatives grow by 17.  Over most of the last two years, the Opposition Leader’s negatives have been higher than his positives.

Ratings for NDP leader Jagmeet Singh are 26% positive, 26% negative, and have barely moved in months. Ratings for Green Party leader Elizabeth May are 29% positive, 19% negative, which is the best net rating of any of the leaders, but off the peak Ms. May saw in May of this year.

Positive impressions of Mr. Trudeau and Mr. Scheer also differ sharply regionally.

UPSHOT

According to Bruce Anderson: “The election of 2019 isn’t one race, and won’t turn on one issue. It will involve a mix of factors including the feelings about party leaders, and fears, anxieties and hopes about the cost of living, taxes, the environment, health and education, and economic opportunity.  It might well be different depending on your generation, or gender, but it almost certainly will be different in different parts of the country.

The Conservative lead in Alberta and Saskatchewan is an important asset for Mr. Scheer but comes with risk. Opinions among conservative-inclined voters in those two provinces can be so different from those found among other Canadians (on issues such as climate change or in terms of feelings about Mr. Trudeau), that it may be tempting to campaign on messages and policies that turn out to limit opportunity elsewhere, where a great number of seats are in play. The Liberal voter pool is widening, while the Conservative tent is not.

For the Liberals, the picture in Alberta and Saskatchewan is obviously very challenging, but perhaps also reinforces the need to win key, and tight, battleground situations in Ontario and BC, and to nurture and strengthen their leads in Quebec and Atlantic Canada.  At this moment, the challenge for the NDP and the Green Party may be to gain a bigger share of voice – which is never easy, but might be getting harder than ever given the disruptions in how people gather news that shapes their opinions.“

According to David Coletto: “Our latest read of the political landscape indicates a very close race nationally but one that is more nuanced and regionally based. While the Conservatives have a massive advantage in Alberta and Saskatchewan, the Liberals have been trending positively in other regions of the country.

We split out Alberta and Saskatchewan from the rest of the country because the election is so different in those areas. The Liberals, NDP, or Greens will be hard-pressed to win much in those two provinces. This election will ultimately turn on how the rest of the country feels and the polarization between Alberta and Saskatchewan and the rest of the country muddies the water in terms of anticipating how the public is reacting to the pre-campaign period.”

METHODOLOGY

Our survey was conducted online with 4,549 Canadians aged 18 and over from August 23 to 29, 2019. A random sample of panellists was invited to complete the survey from a set of partner panels based on the Lucid exchange platform. These partners are double opt-in survey panels, blended to manage out potential skews in the data from a single source.

The margin of error for a comparable probability-based random sample of the same size is +/- 1.5%, 19 times out of 20.  The data were weighted according to census data to ensure that the sample matched Canada’s population according to age, gender, educational attainment, and region. Totals may not add up to 100 due to rounding.

ABOUT ABACUS DATA

We are the only research and strategy firm that helps organizations respond to the disruptive risks and opportunities in a world where demographics and technology are changing more quickly than ever.

We are an innovative, fast-growing public opinion and marketing research consultancy. We use the latest technology, sound science, and deep experience to generate top-flight research-based advice to our clients. We offer global research capacity with a strong focus on customer service, attention to detail and exceptional value.

Contact us with any questions.

Find out more about how we can help your organization by downloading our corporate profile and service offering.

Would you rather work in a unionized or non-unionized job? We asked Canadians.

In our most recent national survey of 2,903 Canadian adults, we asked:

“If you had the choice between working in a job that was unionized or not unionized, which would you choose?”

Overall, slightly more Canadians would prefer to have a unionized job than one that is not unionized. 42% preferred a unionized workplace versus 39% who would want a non-unionized workplace. 19% were unsure.

When we compare results across different subgroups, some interesting differences (or not) emerge including:

  • There’s no gender gap on the question. The same proportion of men as women would prefer to be unionized, although women are 5-points more likely to say they are unsure.
  • There’s a slight relationship across age groups. Younger Canadians (18 to 29) are more likely to prefer to work in a unionized environment than older Canadians.
  • Those with a university degree are most likely to prefer working in a unionized workplace (46%) than those with college or those with high school or less. The difference those is more related to higher incidences of “unsure” responses among high school and college educated respondents.
  • Household income doesn’t seem to play much role either. Those in households making $50,000 or less are about as likely to want to work in a unionized environment as those living in a household earning $100,000 or more. In fact, those in the middle income bracket (earning between $50K and $100K) were the most likely to want to work in a unionized environment.

MOST UNION MEMBERS WOULD PREFER TO BE UNIONIZED.

We also find that a clear majority of those who are currently members of a union say they would prefer to work in a unionized workplace. 77% of those who say they are members of a public sector union and 67% of those in a private sector would rather be unionized than not, if given the choice.

Among those currently in the workforce and not in a unionized workplace, 27% would prefer to be unionized versus 53% who would rather not. 20% are unsure.

POLITICAL ORIENTATION DRIVES PREFERENCE FOR UNIONIZED EMPLOYMENT.

When we compare responses across federal party identification, we see more variation than across demographics or socio-economic status.

NDP partisans, not surprisingly, are the most likely to prefer working in a unionized workplace (51% vs. 31%). Although, noteworthy that about one in three NDP partisans would prefer a job that was not unionized. Liberal partisans are not far behind at 46%. Conservative partisans are the least likely to want to work in a unionized workplace, but a sizable minority (39%) would.

UPSHOT

We only have one question to analyze and no follow up questions, but the results point to a desire by many Canadians to work in a unionized workplace. Despite the fact that about 16% to 20% of Canadians are unionized, more would choose to be if they could.

Unfortunately, I don’t have any longitudinal data to assess whether this is higher or lower than in the past. But the lack of clear demographic or socio-economic drivers, but clearer political ones points to the politicized nature of union membership and the labour movement more broadly.

But with rising concerns about job security, precarious work, and the disruption in the economy, labour unions may have an opportunity to expand membership and reintroduce themselves to a new generation or workers who more than any other generation seem interested in unionizing.

METHODOLOGY

Our survey was conducted online with 2,903 Canadians aged 18 and over from August 14 to 20, 2019. A random sample of panelists was invited to complete the survey from a set of partner panels based on the Lucid exchange platform. These partners are double opt-in survey panels, blended to manage out potential skews in the data from a single source.

The margin of error for a comparable probability-based random sample of the same size is +/- 1.9%, 19 times out of 20.  The data were weighted according to census data to ensure that the sample matched Canada’s population according to age, gender, educational attainment, and region. Totals may not add up to 100 due to rounding.

ABOUT ABACUS DATA

We are the only research and strategy firm that helps organizations respond to the disruptive risks and opportunities in a world where demographics and technology are changing more quickly than ever.

We are an innovative, fast-growing public opinion and marketing research consultancy. We use the latest technology, sound science, and deep experience to generate top-flight research-based advice to our clients. We offer global research capacity with a strong focus on customer service, attention to detail and exceptional value.

Contact us with any questions.

Find out more about how we can help your organization by downloading our corporate profile and service offering.

Google Search Trends and the 2019 Canadian Election

Along with polling data, there are other data sources that can offer some insight into the dynamics of the election campaign.

Looking at what Canadians are searching for on Google is of particular interest. Not only because Google provides real-time, comparable data, but search behaviour can tell us what Canadians are interested in and looking for more information on. There’s some evidence in other domains that search data can be used to anticipate changes in public opinion.

We have create a few queries that we think you’ll find interesting.

These charts are automatically updated in real-time so check back often to see if, and how, things change over the course of the election.

PARTY LEADERS (Past 3o Days)

PARTY LEADERS – QUEBEC (Past 30 Days)

PARTY LEADERS (Past 7 Days)

TRUDEAU VS. SCHEER VS. DOUG FORD IN ONTARIO (Past 30 Days)

POLITICAL PARTIES (Past 30 Days)

TRUMP VS. TRUDEAU (Past 30 Days)

CANADIAN VS. AMERICAN ELECTION (Past 30 Days)

ABOUT ABACUS DATA

We are the only research and strategy firm that helps organizations respond to the disruptive risks and opportunities in a world where demographics and technology are changing more quickly than ever.

We are an innovative, fast-growing public opinion and marketing research consultancy. We use the latest technology, sound science, and deep experience to generate top-flight research-based advice to our clients. We offer global research capacity with a strong focus on customer service, attention to detail and exceptional value.

Contact us with any questions.

Find out more about how we can help your organization by downloading our corporate profile and service offering.