9 in 10 Canadians Say It’s Important to Them that the Dairy, Eggs, Chicken and Turkey They Buy Come From Canada.
On behalf of Chicken Farmers of Canada, Egg Farmers of Canada, Dairy Farmers of Canada, Turkey Farmers of Canada and the Canadian Hatching Egg Producers, Abacus Data conducted an online nationwide survey of Canadians’ views on the food system and supply management of dairy, eggs, chicken, and turkey in Canada. The sample size of the survey is n=2,000 adult Canadians, fielded November 9th to 11th, 2023. Totals may not add up to 100 due to rounding.
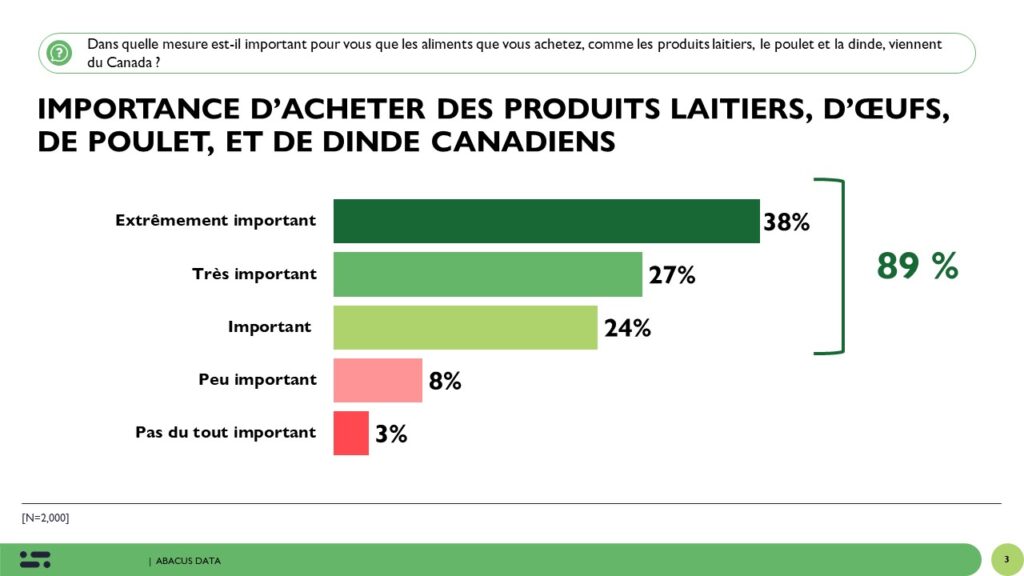
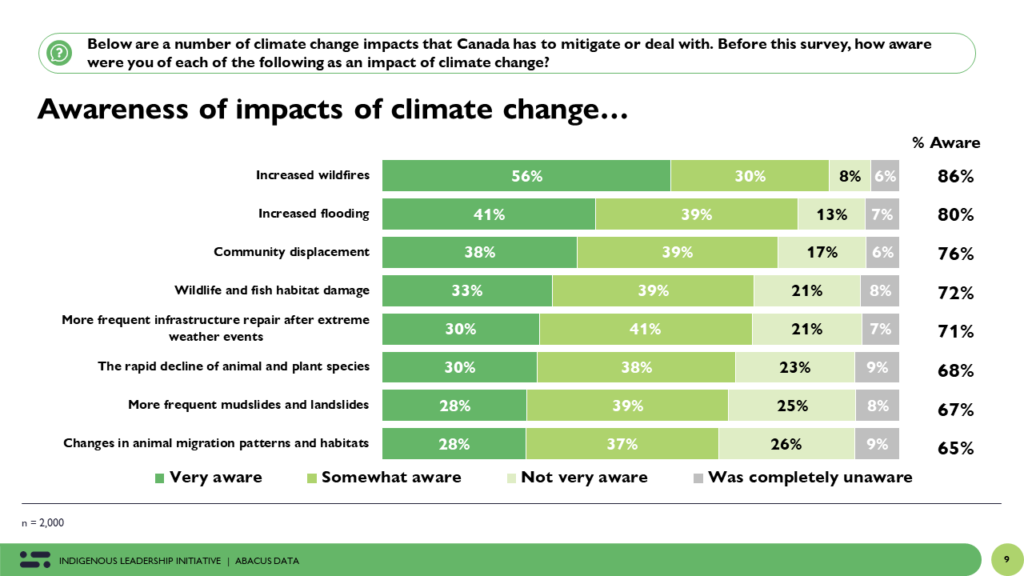
Canadians place a great deal of importance on maintaining a strong, stable domestic supply of dairy, eggs, chicken and turkey. 9 in 10 Canadians say it’s important to them the dairy, eggs, chicken and turkey they buy come from Canada.
89% of Canadians say it’s important to them to purchase dairy, eggs, chicken and turkey products from Canada, including 38% who say it is extremely important. This value is held across demographics throughout the country and supported by a strong majority of voters from all major political parties. Buying Canadian is of greater importance to Canadians from lower income households.
Canadians place even greater importance on having a made-in-Canada system that can support the demand for domestic products.
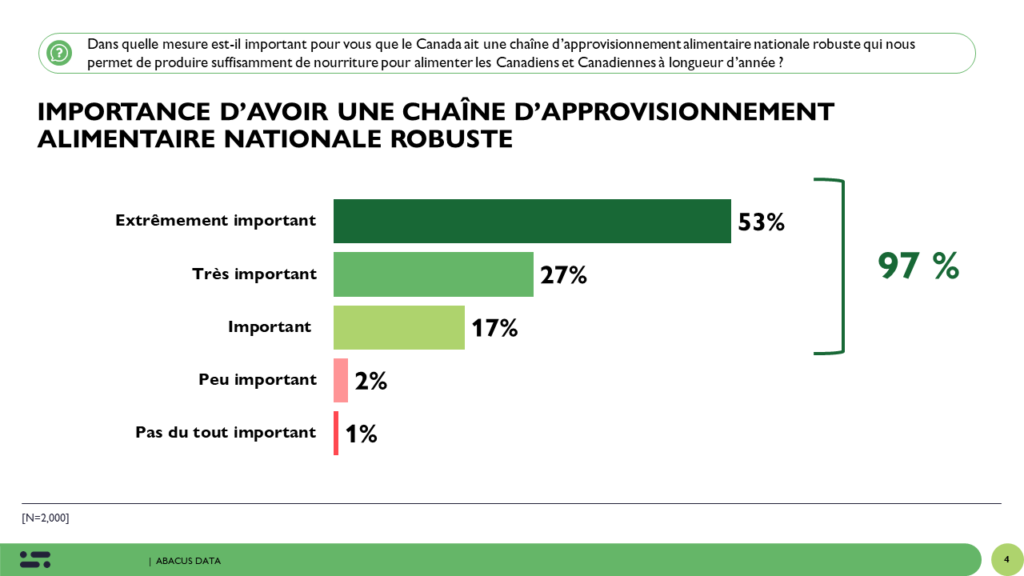
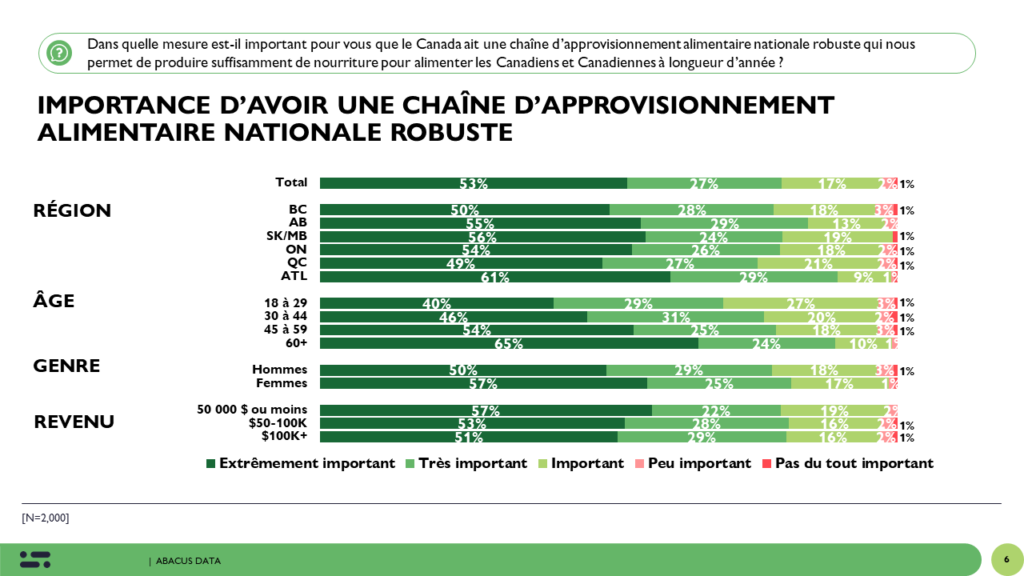
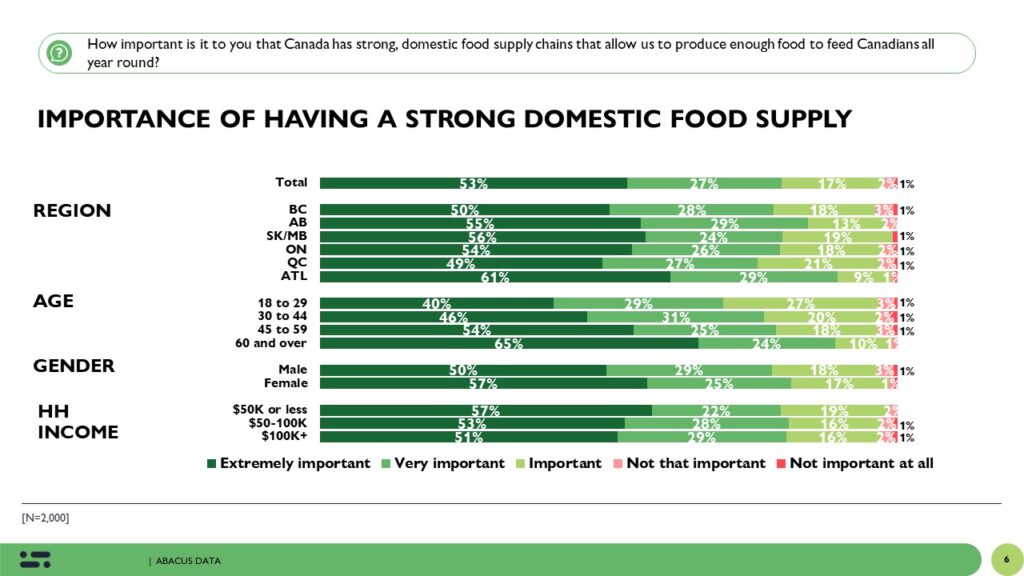
97% feel it is important Canada has strong, domestic food supply chains that allow us to produce enough food to feed Canadians all year round.
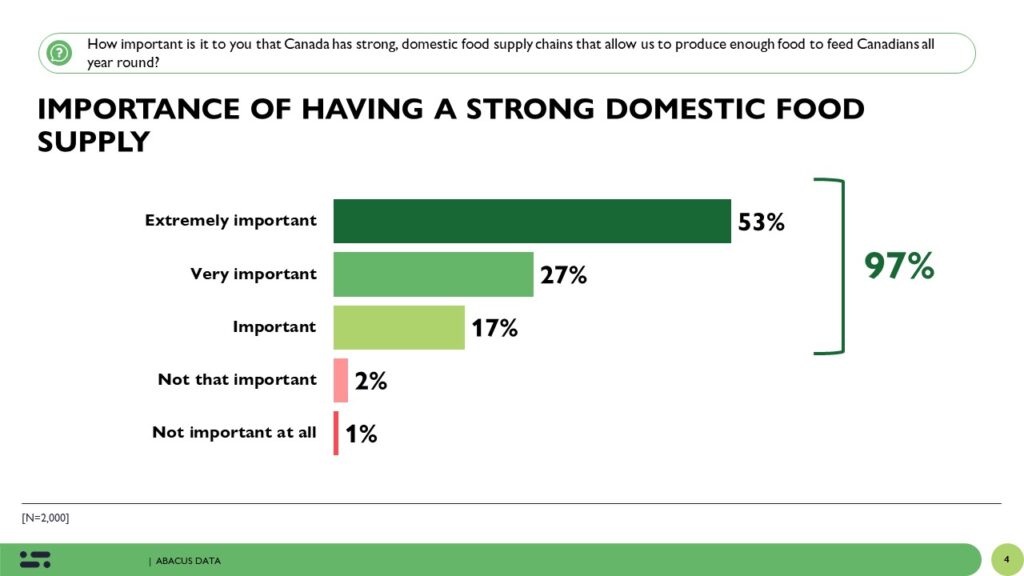
Over half (53%) say this is extremely important. Support is strong across demographics (strongest among older Canadians) and across the country. This is also of greater importance to Canadians from lower income households.
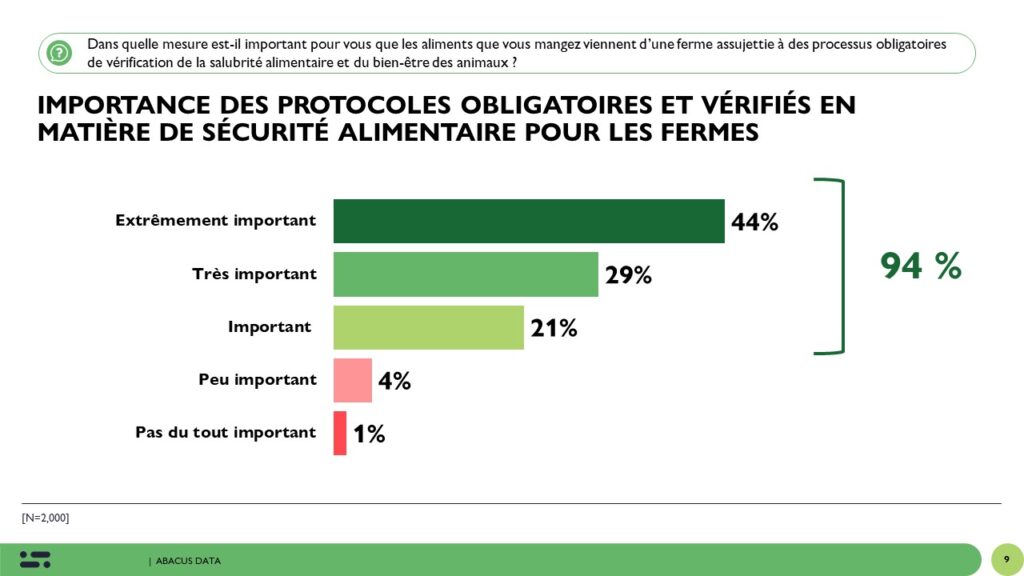
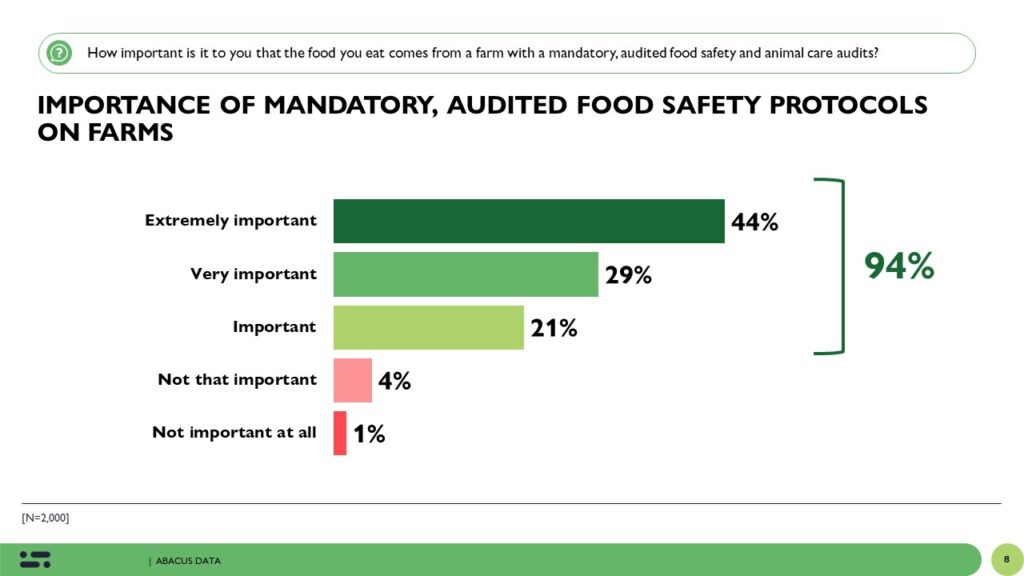
Similarly, Canadians feel strongly about a food system that has rigorous standards and procedures for health and safety. 94% of Canadians say it’s important to them that the food they eat comes from a farm with a mandatory, audited food safety and animal care programs- 44% say this is extremely important to them. This is similarly important for Canadians across the country, and across the political spectrum.
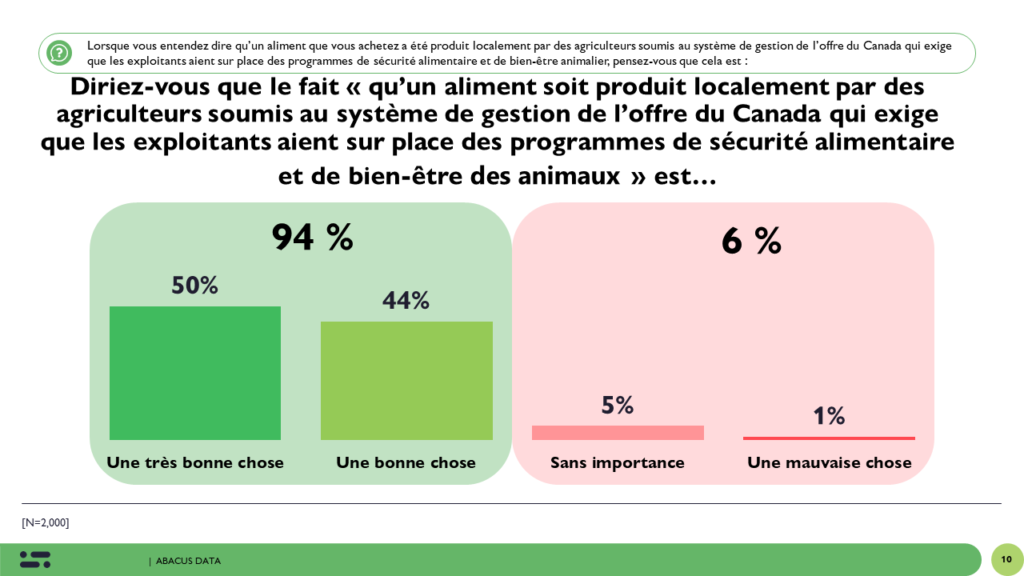
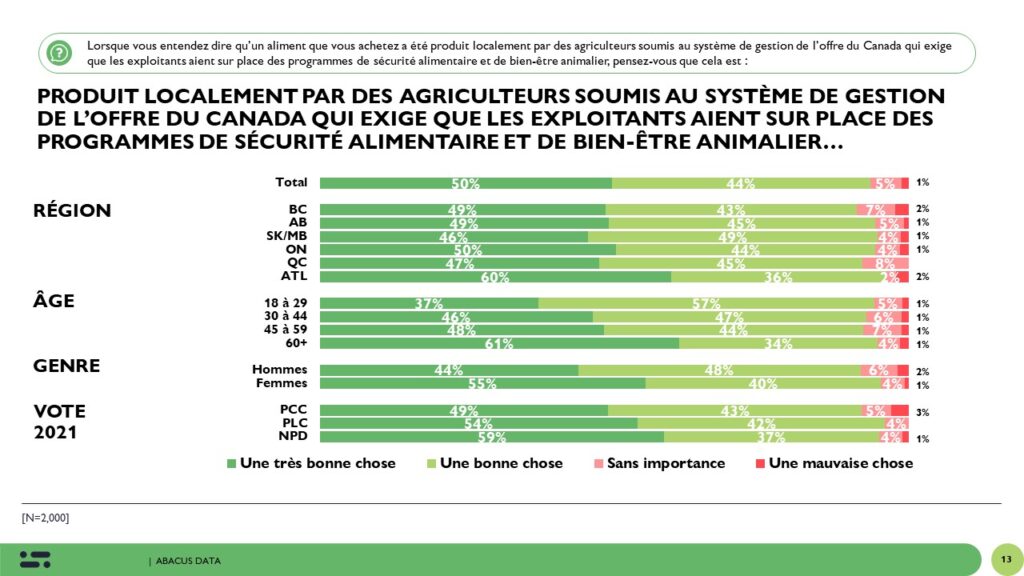
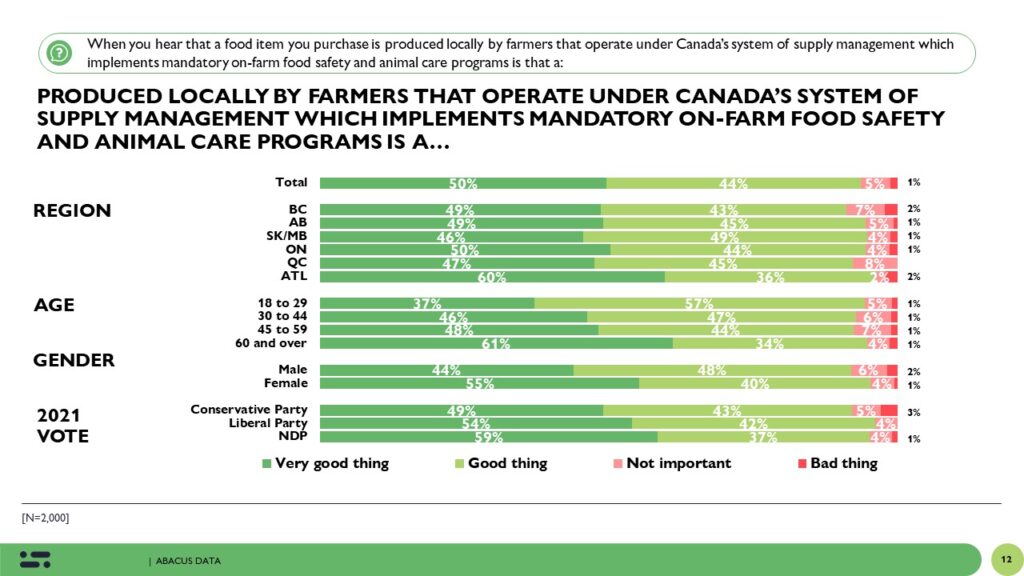
94% of Canadians also consider it a good thing when they hear that a food is produced by a farmer that operates under Canada’s system of supply management, which includes mandatory food safety and animal welfare standards.
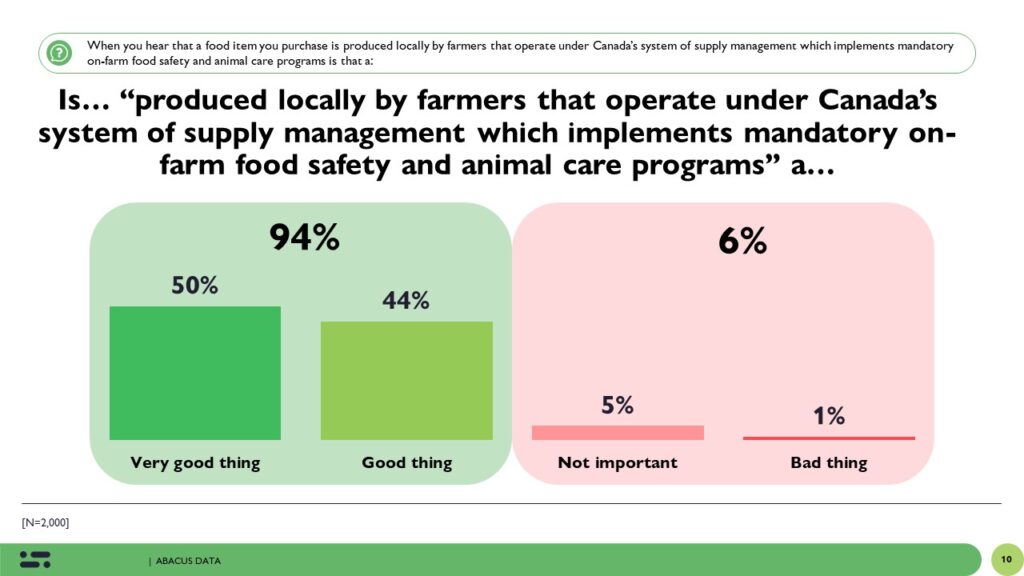
Strongest among women, older Canadians, and those in Atlantic Canada, a majority of Canadians across demographics hold this view. Among Liberal, Conservative and NDP supporters a majority consider this to be a ‘very good thing’.
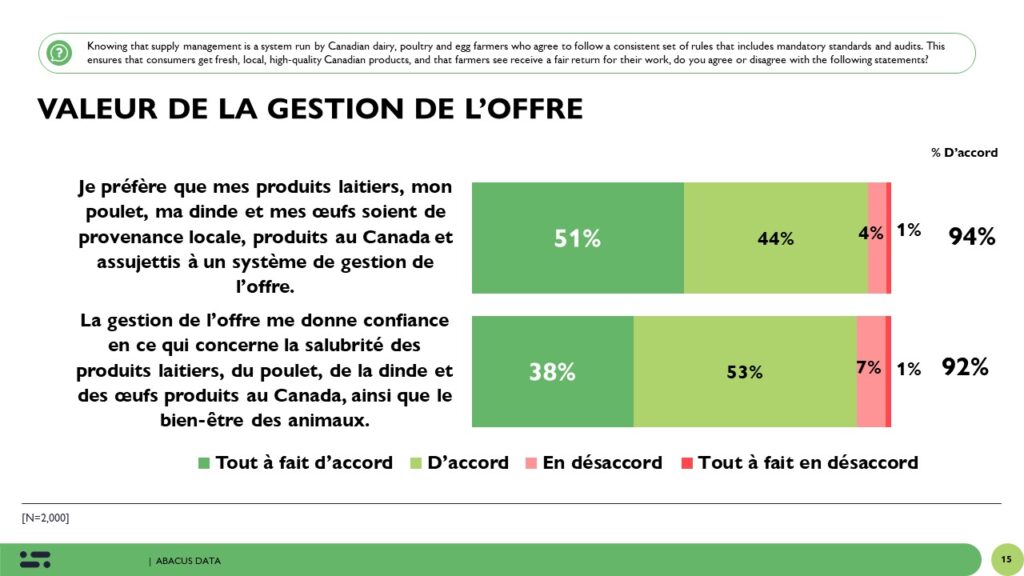
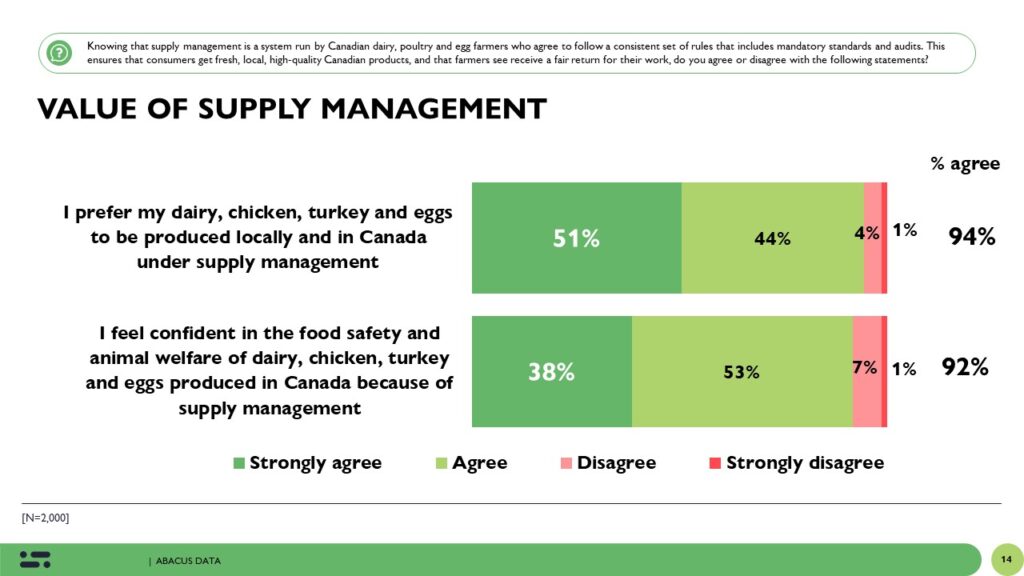
Supply management instills Canadian consumers’ trust in our farmers.
92% of Canadians agree they feel confident in the food safety and animal welfare standards used in dairy, chicken, turkey and egg farming in Canada because of supply management. 94% of Canadians also prefer their dairy, eggs, chicken, and turkey products to be produced locally and in Canada under supply management. Sentiment is strongest among older Canadians but a clear majority of Canadians across the country, age groups, and political support feel the same way.
UPSHOT
Domestic food security and fostering a safe supply of staple food products are of utmost importance to Canadians- especially those who may experience food security challenges. The vast majority of Canadians feel it is important to have a strong domestic food supply chain and have mandatory audits and food safety protocols on farms. 9 in 10 Canadians say it’s important for them to purchase made-in-Canada chicken, turkey, eggs and dairy products.
We also find strong support for Canada’s supply management system- across the country and across party lines a majority of Canadians consider supply management to be a good thing and instills trust in Canadian farmers.
Methodology
The survey was conducted with 2,000 Canadian adults from November 9 to 12, 2023. A random sample of panelists were invited to complete the survey from a set of partner panels based on the Lucid exchange platform. These partners are typically double opt-in survey panels, blended to manage out potential skews in the data from a single source.
The margin of error for a comparable probability-based random sample of the same size is +/- 2.19%, 19 times out of 20.
The data were weighted according to census data to ensure that the sample matched Canada’s population according to age, gender, educational attainment, and region.
Abacus Data follows the CRIC Public Opinion Research Standards and Disclosure Requirements that can be found here: https://canadianresearchinsightscouncil.ca/standards/
This survey was paid for by Chicken Farmers of Canada, Egg Farmers of Canada, Dairy Farmers of Canada, Turkey Farmers of Canada and the Canadian Hatching Egg Producers.
ABOUT ABACUS DATA
We are the only research and strategy firm that helps organizations respond to the disruptive risks and opportunities in a world where demographics and technology are changing more quickly than ever.
We are an innovative, fast-growing public opinion and marketing research consultancy. We use the latest technology, sound science, and deep experience to generate top-flight research-based advice to our clients. We offer global research capacity with a strong focus on customer service, attention to detail, and exceptional value.
We were one of the most accurate pollsters conducting research during the 2021 Canadian election following up on our outstanding record in 2019.
Contact us with any questions.
Find out more about how we can help your organization by downloading our corporate profile and service offering.