Final NL Poll: Liberals heading for a big win.

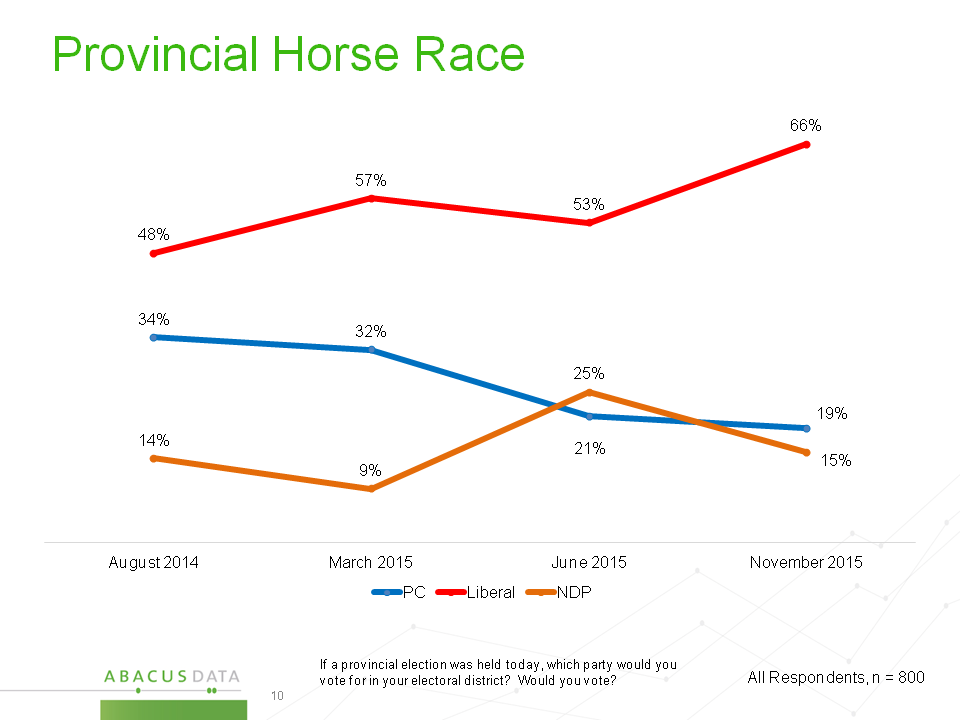
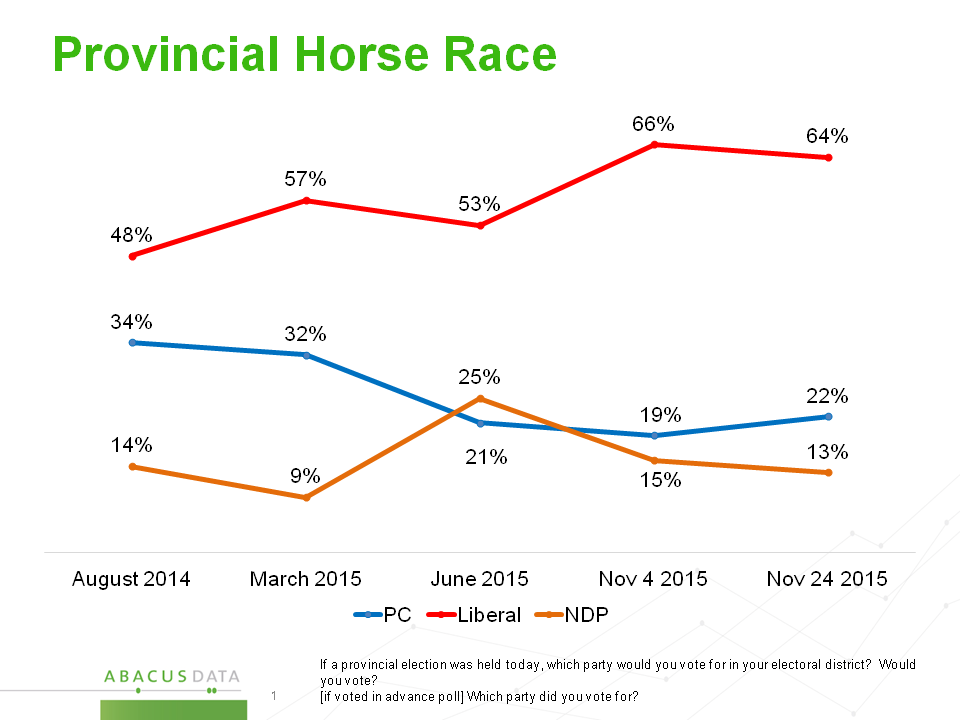
The Newfoundland and Labrador Liberal Party would win big if the election were held today, according to our new survey of 700 eligible voters in the province. Although down slightly, the Liberals have maintained their large lead over the incumbent PCs. Currently they lead by 42-points, down from the 47-point lead we measured at the start of the election campaign.
Liberal support is at 64% (down two since the start of the campaign) compared with 22% for the PCs (up three) and 13% for the NDP (down 2). Twelve percent of respondents say they are undecided.
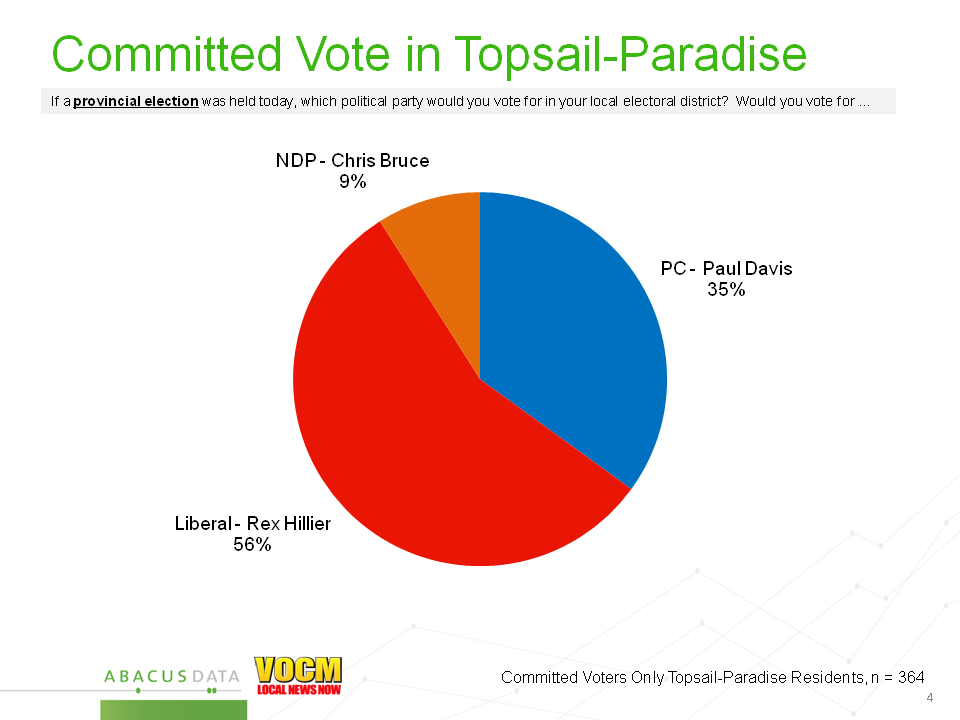
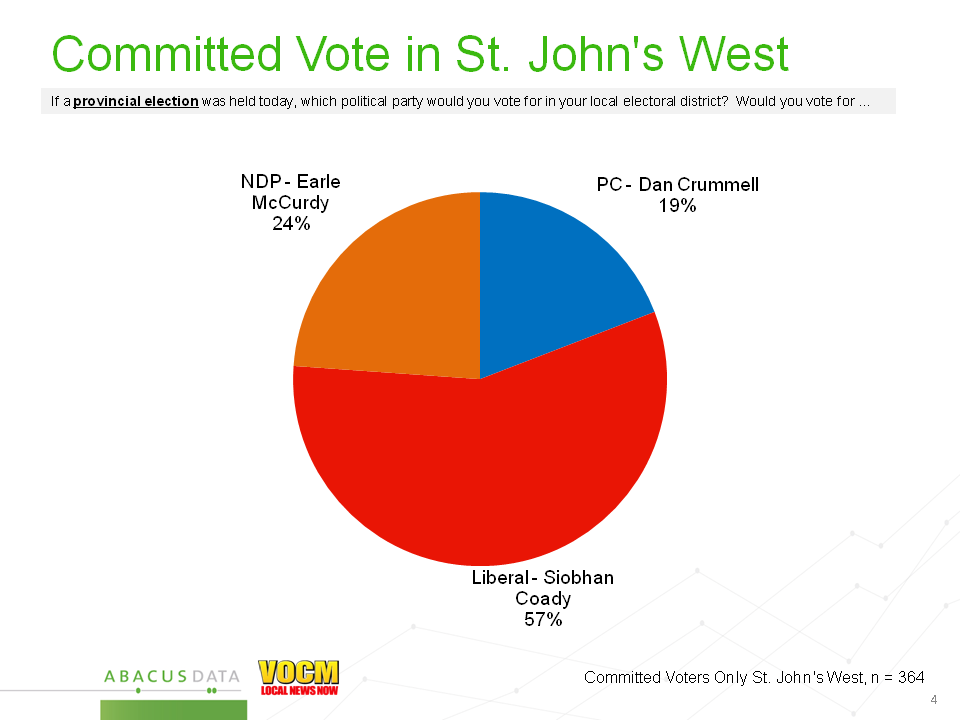
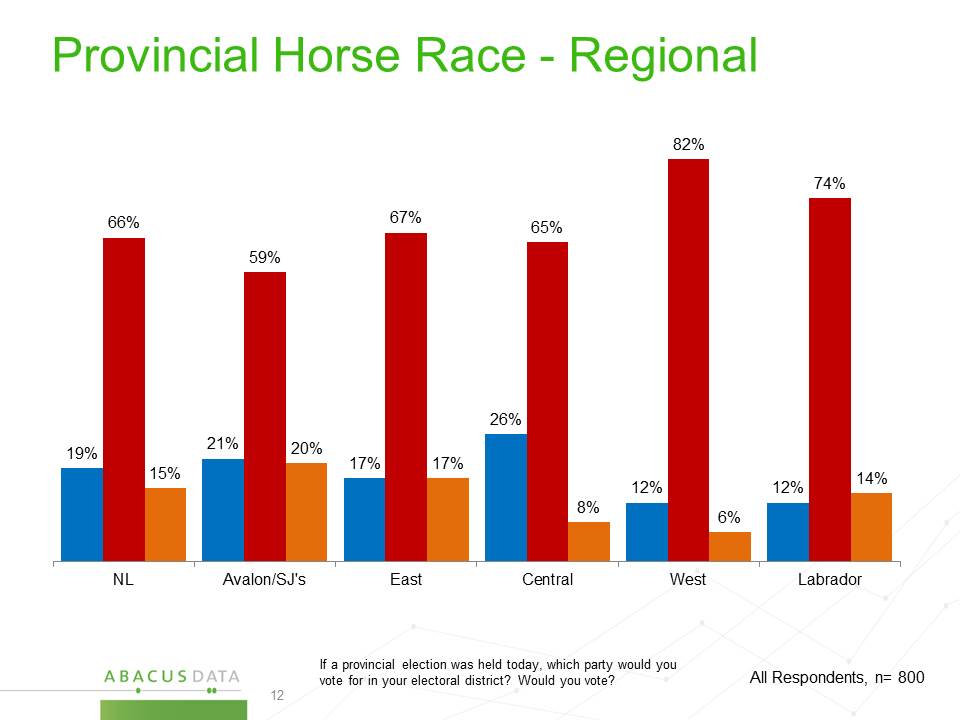
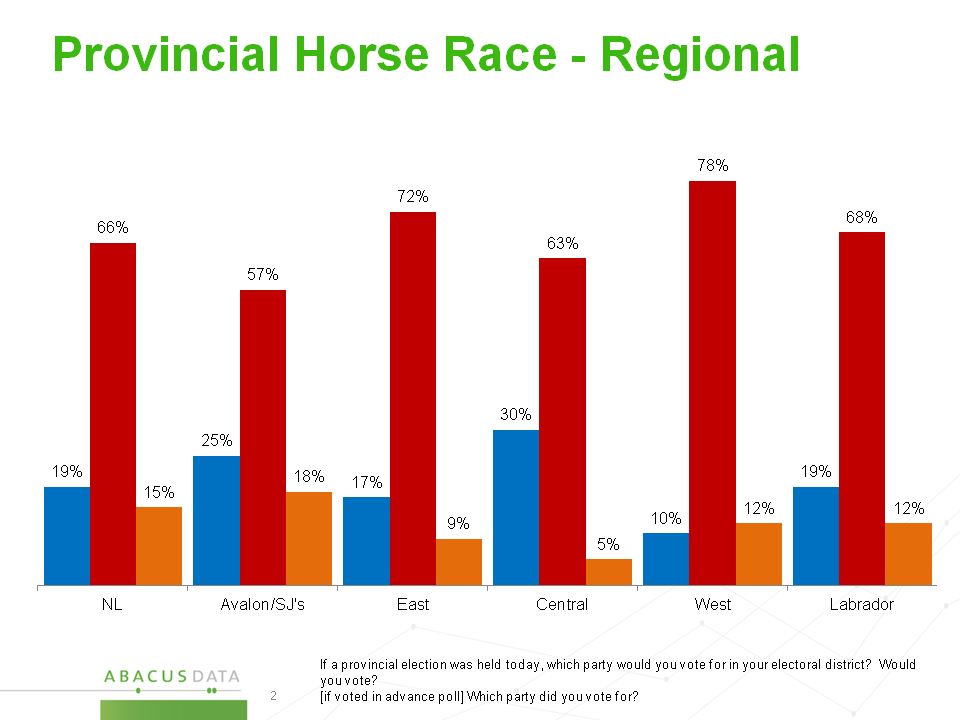
The NL Liberals lead by a wide margin in every region of the province although the race is somewhat closer in St. John’s and on the Avalon Peninsula.
To put these results in context, in the last provincial election, the Conservatives won a large majority of 37 seats with 56% of the vote. The provincial Liberal support also continues to mirror the support received by the federal Liberals (65%) on October 19 during the federal election.
Accessible Voters
The Liberals not only have a large lead among committed supporters but they also continue to have the largest pool of potential or accessible voters. 72% of eligible voters (unchanged, marginally down by 1) we surveyed said they would consider voting Liberal compared with 36% for the PCs (up 4 since the start of the campaign) and 32% for the NDP (down 5 since our last wave).

These results indicate that although the PC accessible vote is up slightly, their campaign has not had much impact on its support or potential support. The Liberals remain in a commanding position with only 5 days left before most eligible voters cast a ballot.
Direction of the Province
One of the remarkable things about public opinion during this election, from both our province wide surveys and those of individual districts with VOCM, is the contradictory perceptions of eligible voters when it comes to their feelings about the direction of the province and their intense desire for change.
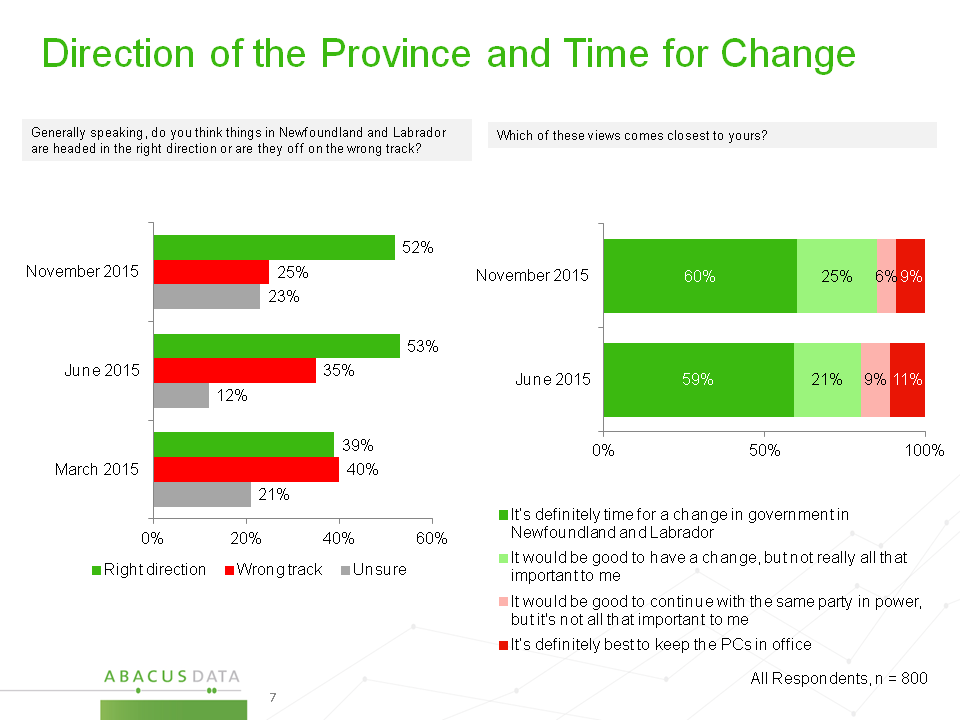
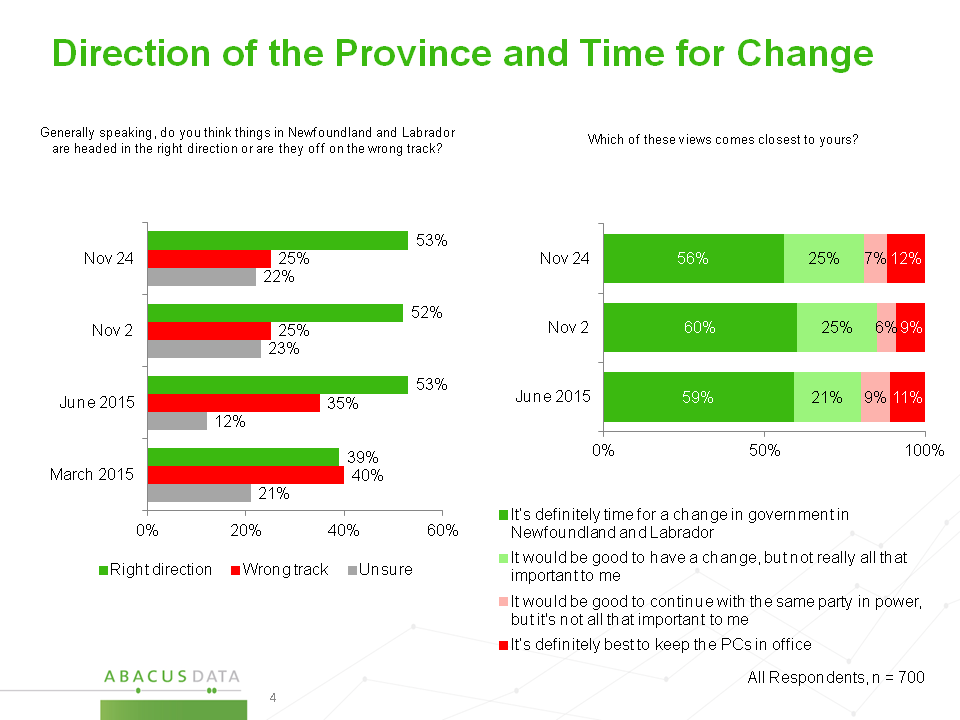
In our current survey, 53% of eligible voters felt that the province was headed in the right direction (marginally up 1) while 25% feel the provinces is off on the wrong track.
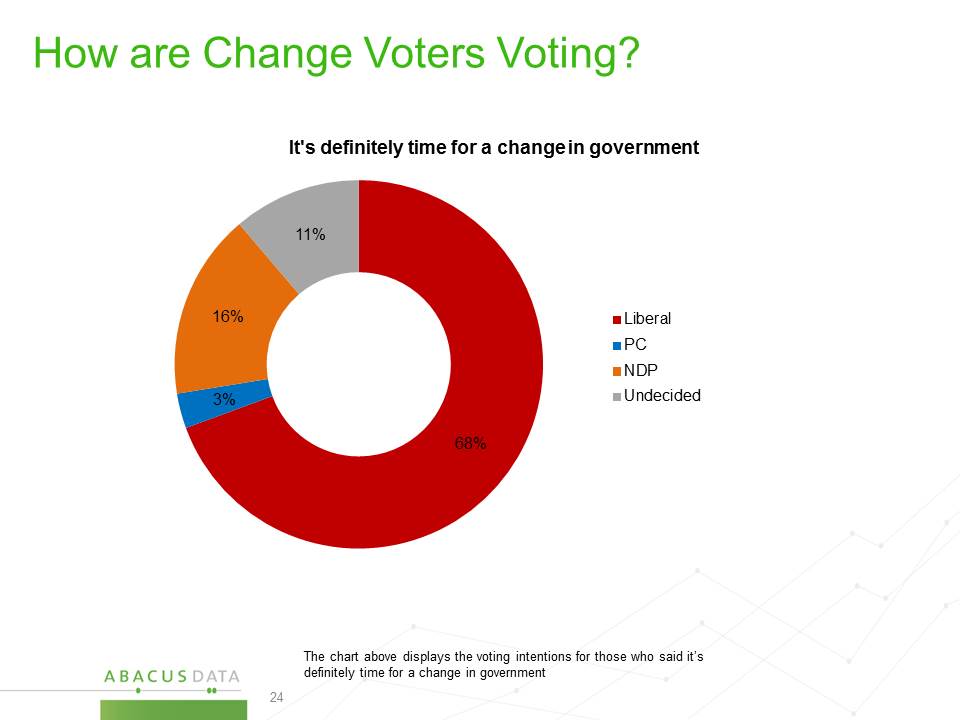
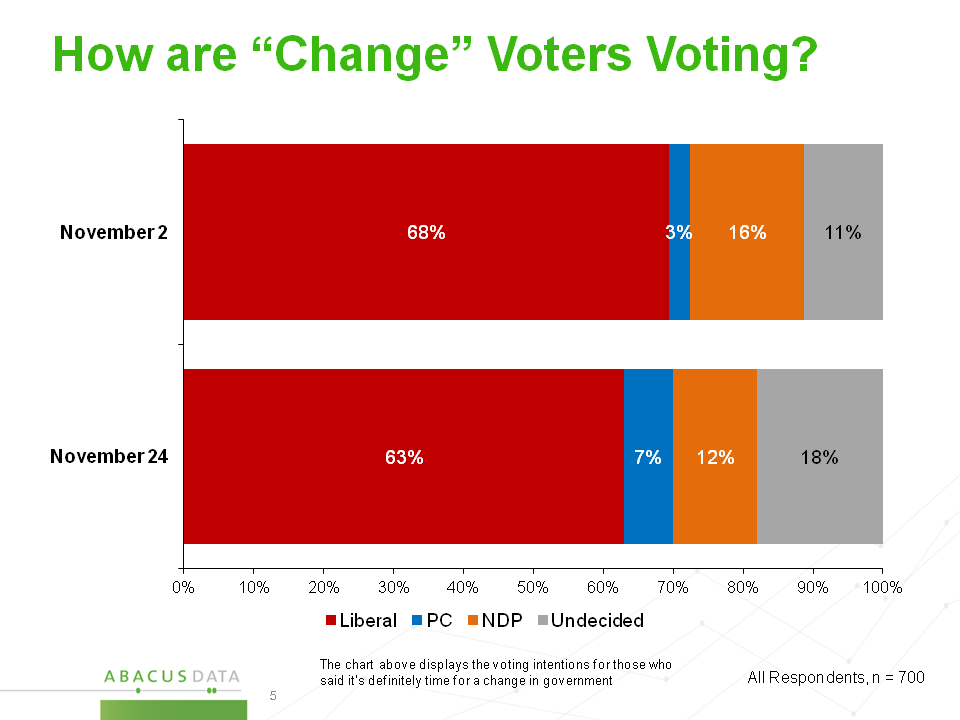
Despite the positive mood about the province as a whole, the desire for a change of government remains high, with 81% wanting change and 56% saying they definitely want a change in government. Although the intensity for change is down somewhat from the start of the campaign (60% said they definitely wanted change in our first survey of the campaign), it remains persistent.
Among those who definitely want a change in government, 63% are voting Liberal (down 5), 12% are voting NDP (down 4), and 18% are undecided at this point (up 7). The commanding Liberal lead continues to be built on the fact that it has maintained the support of those who want change.
Top Issues
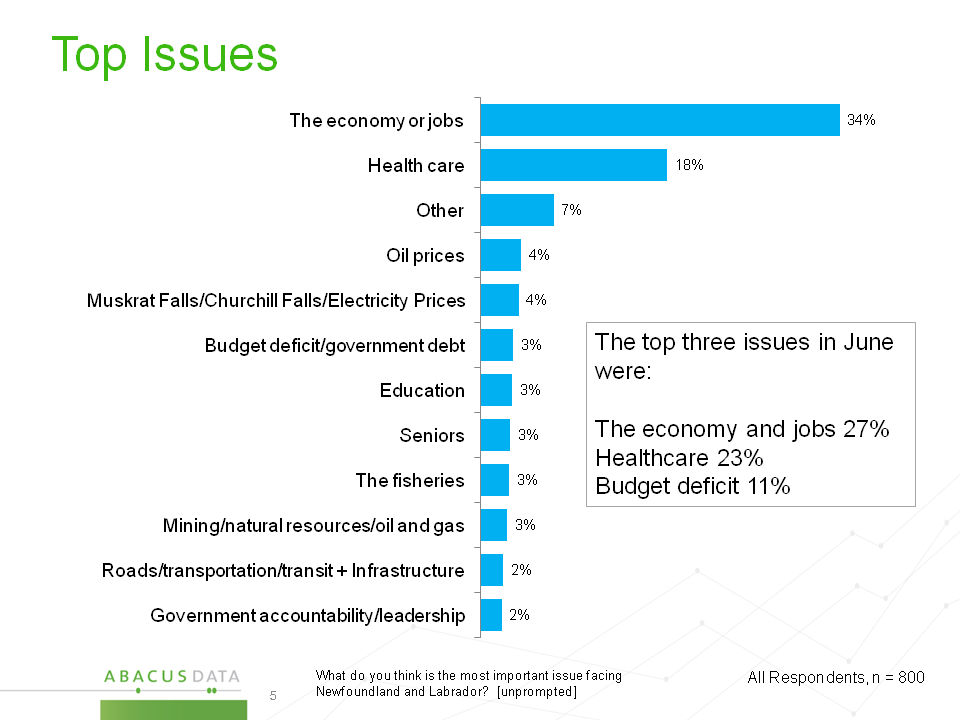
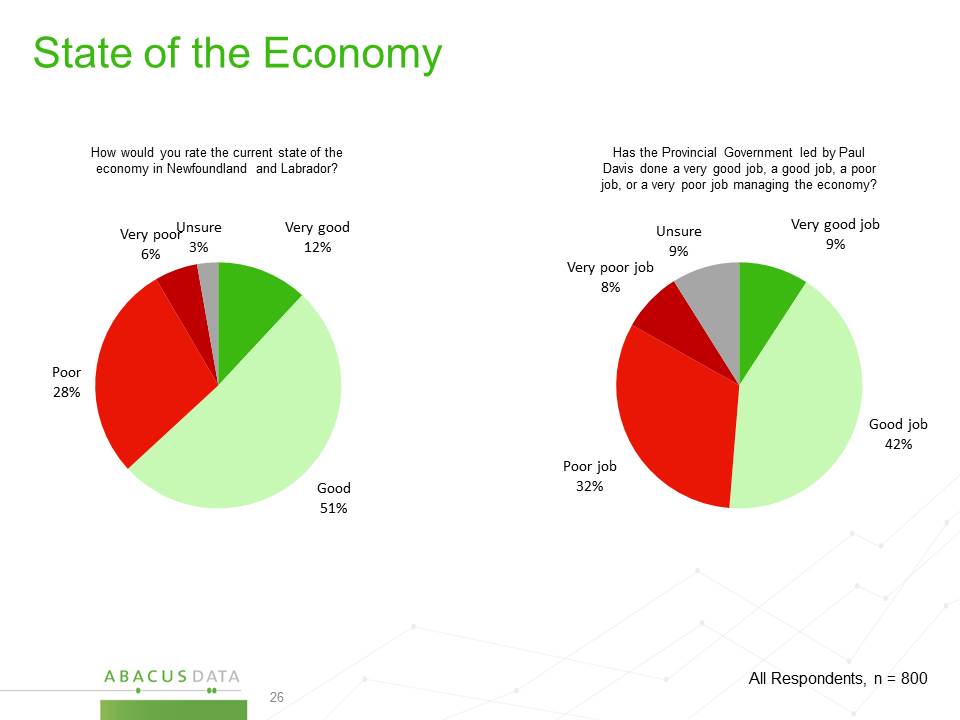
Respondents were asked, unprompted, to name the most important issue facing Newfoundland and Labrador. The economy and health care continue to be the top issue of the campaign, largely unchanged since the beginning of the campaign. No other issue has moved up significantly since the start of the campaign.

Leadership: Ball still most popular; Davis improves
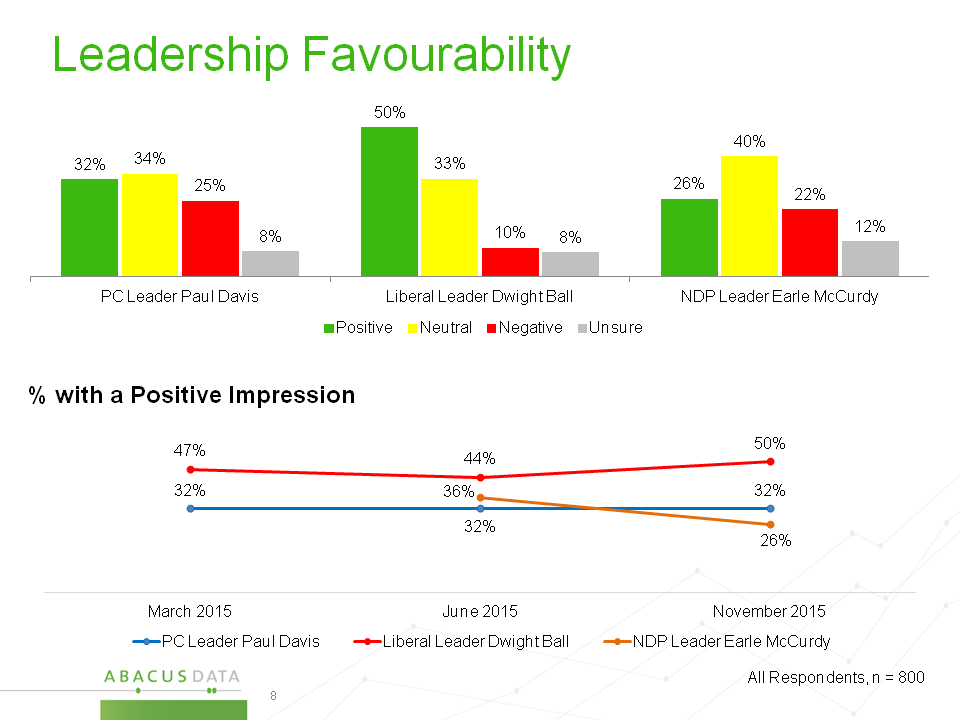
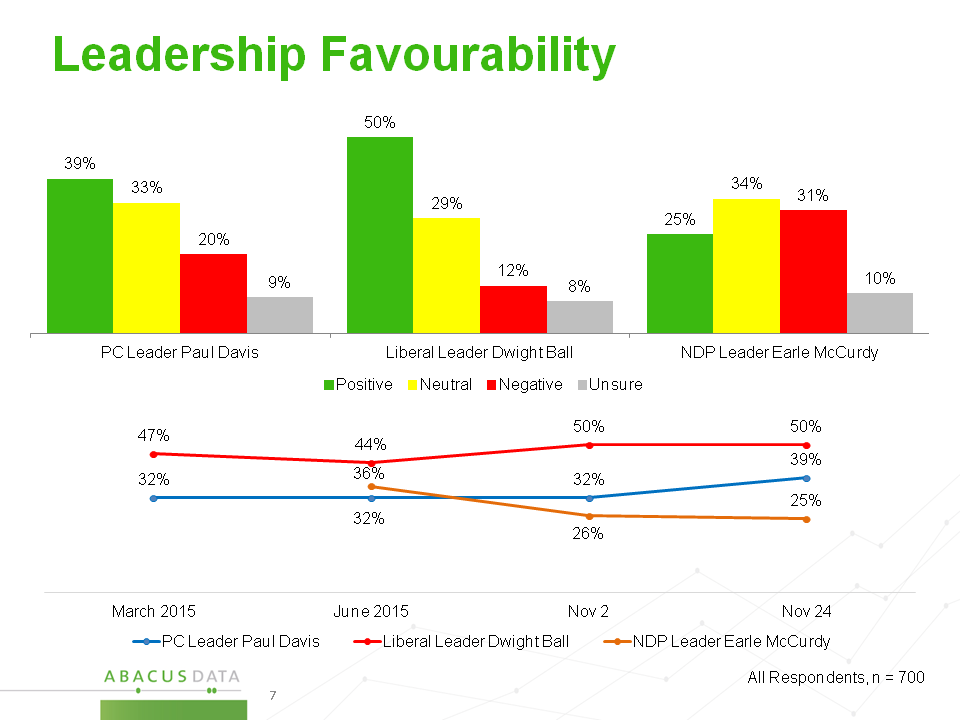
Dwight Ball remains the most popular political leader in the province with 50% having a positive impression of the Liberal leader (unchanged since the start of the campaign) and only 12% saying they have a negative impression of him (up 2 since the first wave). Although he continues to trail Mr. Ball, Premier Davis’ personal ratings have improved from the start of the campaign with 39% of eligible voters now saying they have a positive impression of the PC Leader (up 7) while his negatives have remained steady at 20%. NDP Leader Earle McCurdy is viewed positively by 25% of respondents and negatively by 31% (an increase since the start of the campaign).
Who Voters Think Will Win
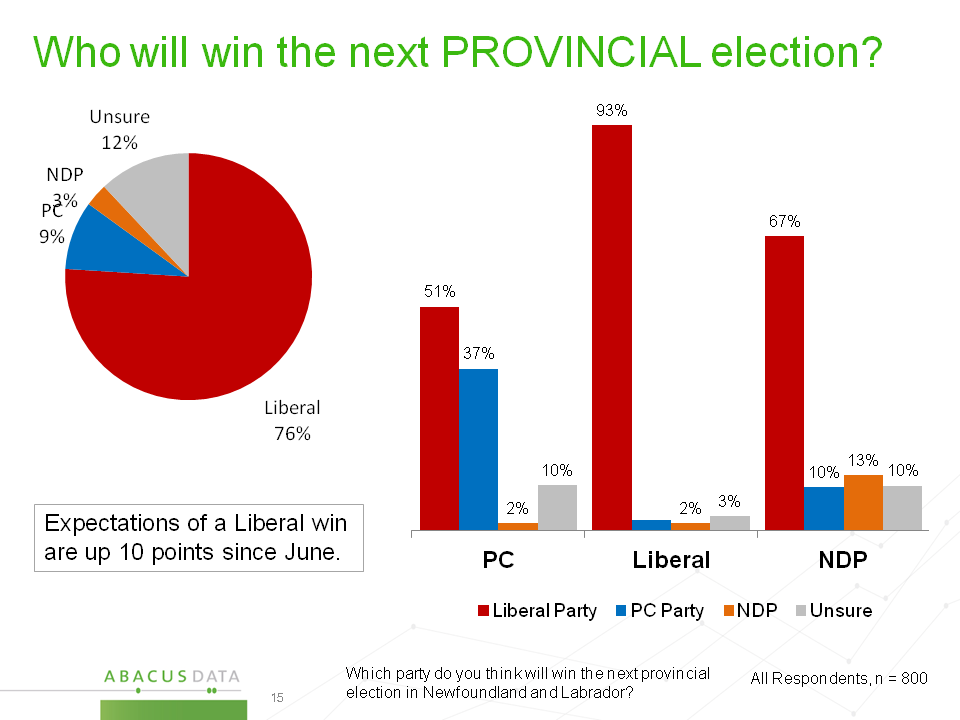
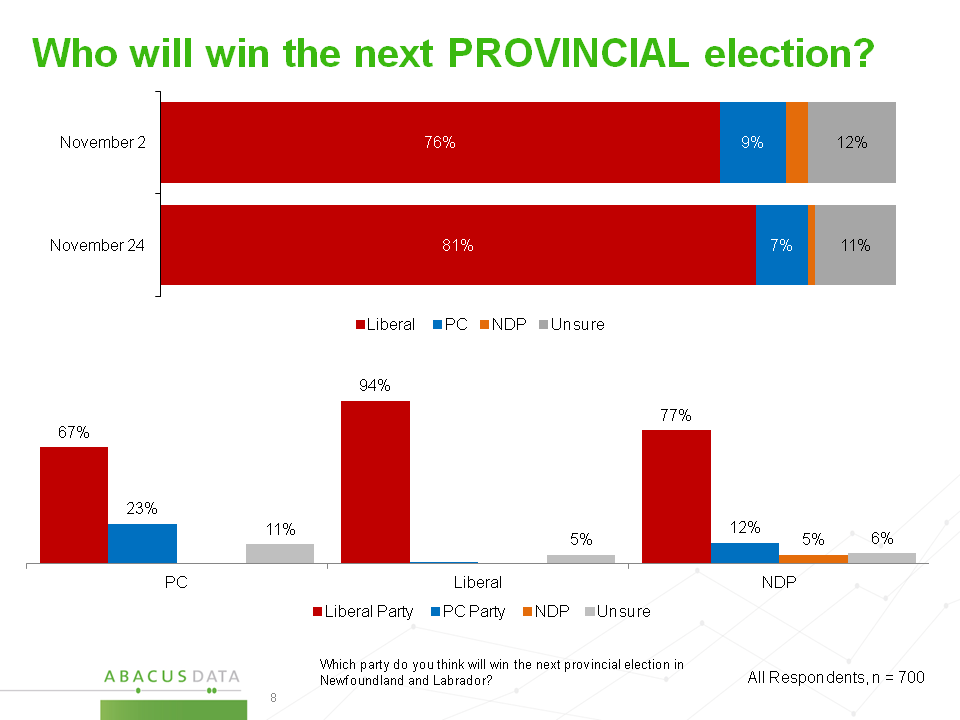
Most eligible voters in the province still believe the Liberal Party will win the election on November 30. 81% said they thought the Liberals would win, up 5 since the start of the campaign. Seven percent picked the PCs while only 1% believed the NDP would win the election.
This view is now overwhelmingly shared among all party voters. 67% of PC supporters think the Liberals will win while 77% of NDP voters think the Liberals will win the election.
What is the election about?
In our final survey of the campaign, we asked respondents to pick which option, from a list, they felt best describes what the Newfoundland and Labrador provincial election was most about.
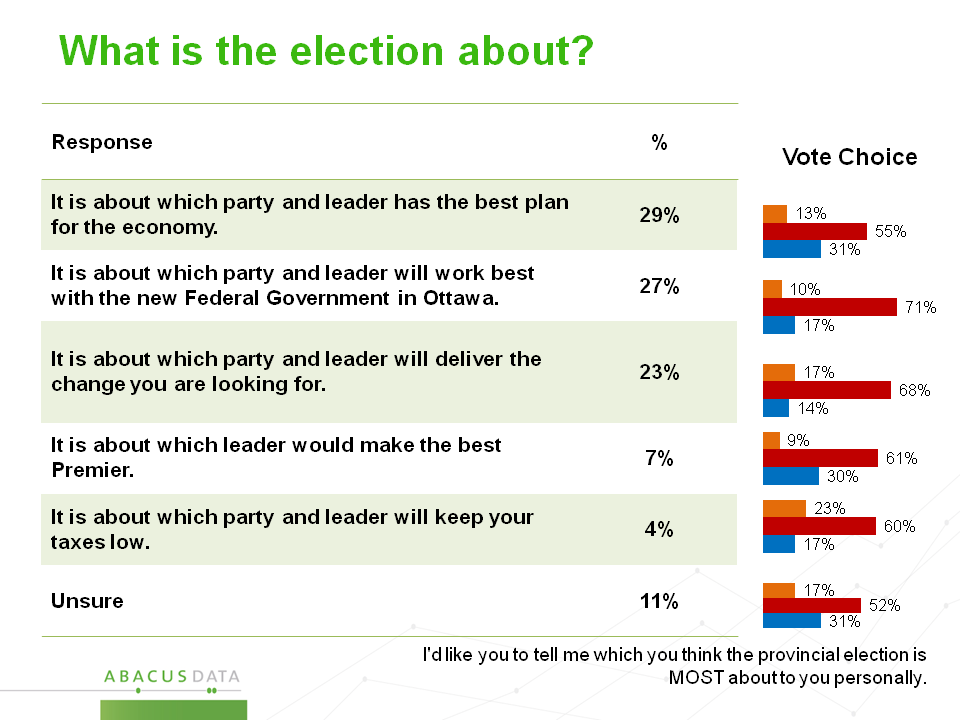
Responses were mixed with 29% saying the election is about which party and leader has the best plan for the economy. Another 27% said it was about which party and leader could work best with the new government in Ottawa while 23% said it was about which party and leader could deliver the change they were looking for. Keeping taxes low and voting for the leader who would make the best Premier were less likely to be thought what the election was about.
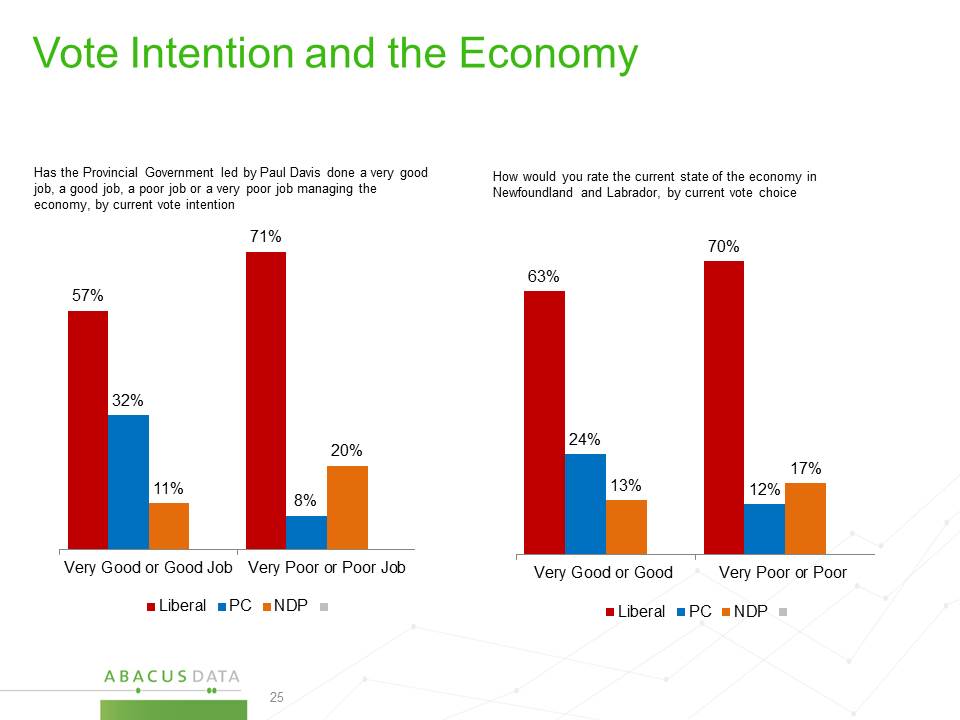
When we compare what people said the election was about with their vote intention, we find that the Liberal Party wins among all groups although its lead was smaller among those who believed the election was about the economy. Among those saying the election is about the economy, 55% are voting Liberal compared with 31% for the PCs and 13% for the NDP.
The Liberals hold commanding leads among those who say the election is about cooperation with the new Liberal government in Ottawa and among those who say it is about change.
The Upshot
As the 2015 Newfoundland and Labrador provincial election ends, the Liberal Party led by Dwight Ball remains in a very solid position to defeat the incumbent Progressive Conservative Government.
The desire for change has not dissipated much throughout the election campaign and as such, the PCs and Paul Davis have not been able to make much of a dent in the commanding Liberal lead. Just 7% of voters felt that the Conservatives will win, and that number has not grown since the campaign began. Moreover, almost all eligible voters expect the Liberals to win on Monday.
If the PCs do lose on Monday, it will not be because most people dislike Premier Davis or think the province is headed in the wrong direction but because people want change and see an opportunity for cooperation between a new provincial government and the new Liberal government in Ottawa.
According to our data, the campaign and all the leaders’ debates have not changed the trajectory of the campaign. Mr. Ball remains very popular and his Liberal Party continues to hold a commanding lead over the PCs and NDP. However, despite his popularity, only 7% felt the election will be about the best Premier. Moreover, even though taxes are a bedrock Conservative issue, just 4% of voters felt this election will be about taxes. The election of a new Liberal government in Ottawa is a consideration for many, and a strong driver of Liberal support and a change agenda.
Unless something fundamentally changes in the closing days of the election and voters change their minds, we expect Mr. Ball to be the next Premier of Newfoundland and Labrador
Methodology
The random live-interview telephone survey was conducted with 700 eligible voters living in Newfoundland and Labrador. The survey was completed from November 22 to 24, 2015.
The margin of error for a probability-based random sample of 700 respondents using a probability sample is +/- 3.8%, 19 times out of 20.
The data was statistically weighted according to census data to ensure that the sample matched population of Newfoundland and Labrador. The tables within this report detail the weighted and unweighted counts for the sample.
Note the small sample sizes when reviewing results in subgroups.
For more information about the poll’s methodology or the results, please contact David Coletto, CEO at david@abacusdata.ca or at 613-232-2806.
Abacus Data Inc.
We offer global research capacity with a strong focus on customer service, attention to detail and value added insight. Our team combines the experience of our Chairman Bruce Anderson, one of Canada’s leading research executives for two decades, with the energy, creativity and research expertise of CEO David Coletto, PhD.