How do we feel about the Trudeau government?

By a 2:1 margin, people approve

By Bruce Anderson & David Coletto

PdfExport

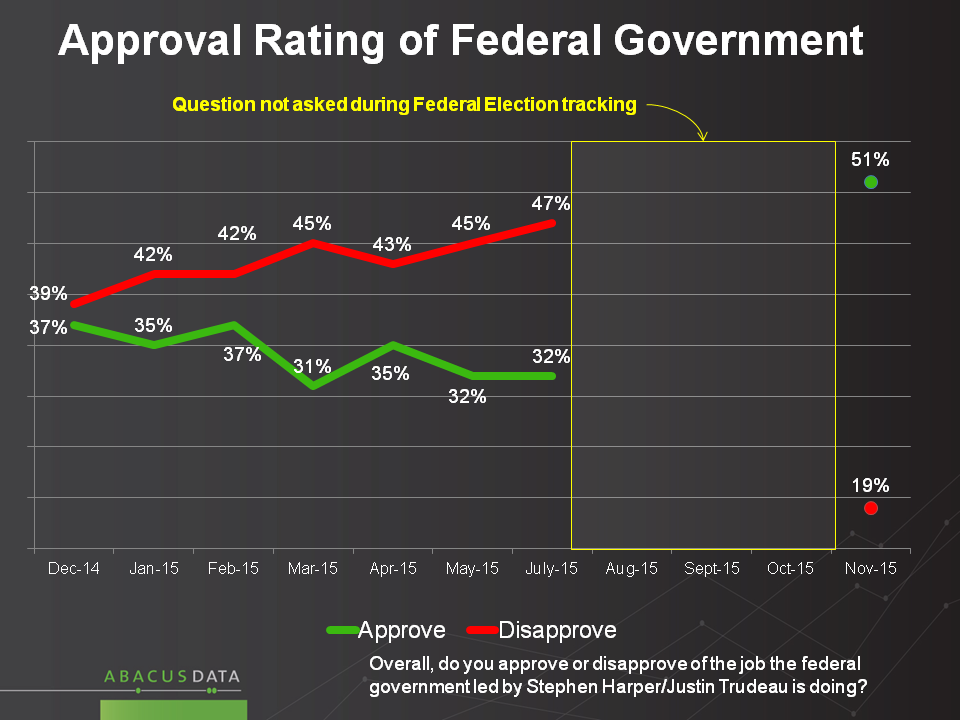
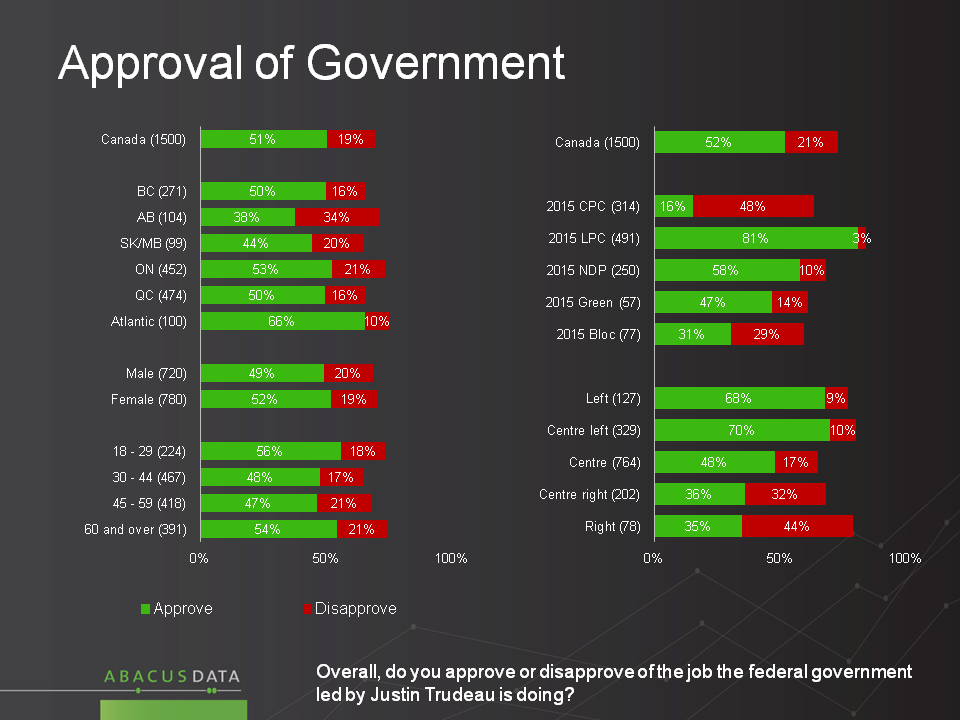
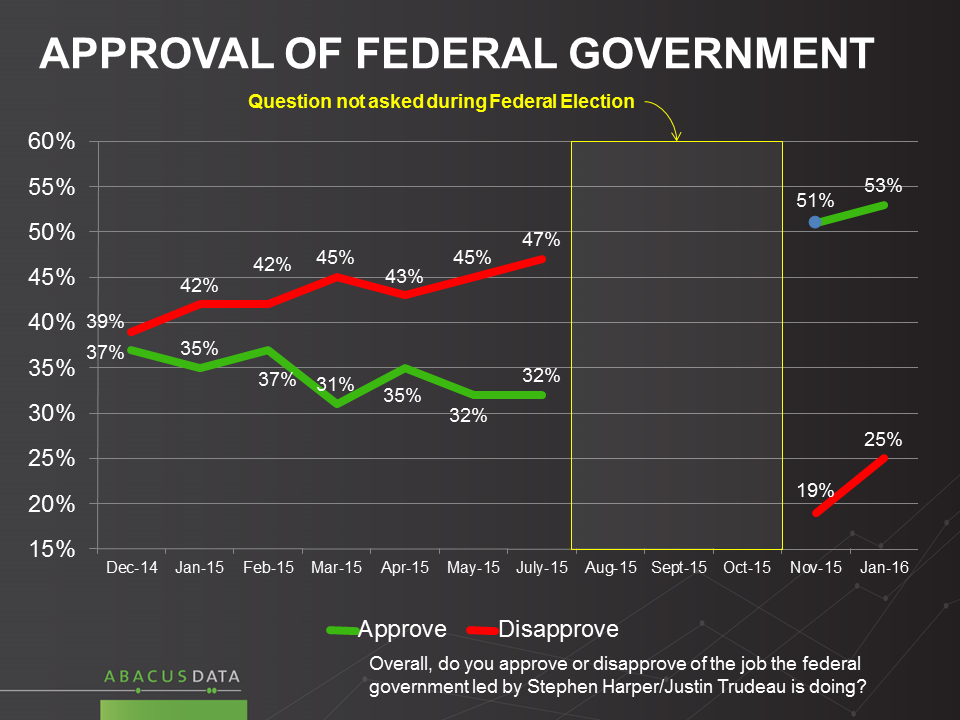
Today, 53% say they approve of the performance of the federal government, similar to the 51% we measured in December. To put this in context, at no point during 2015 did the Harper government find an approval rating higher than 37%.

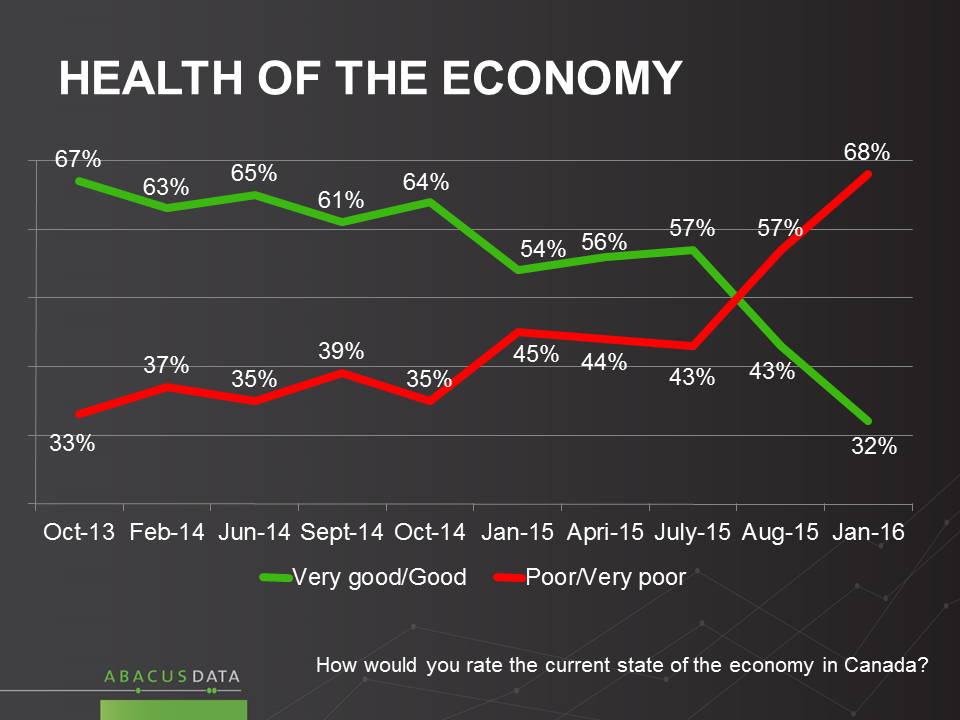
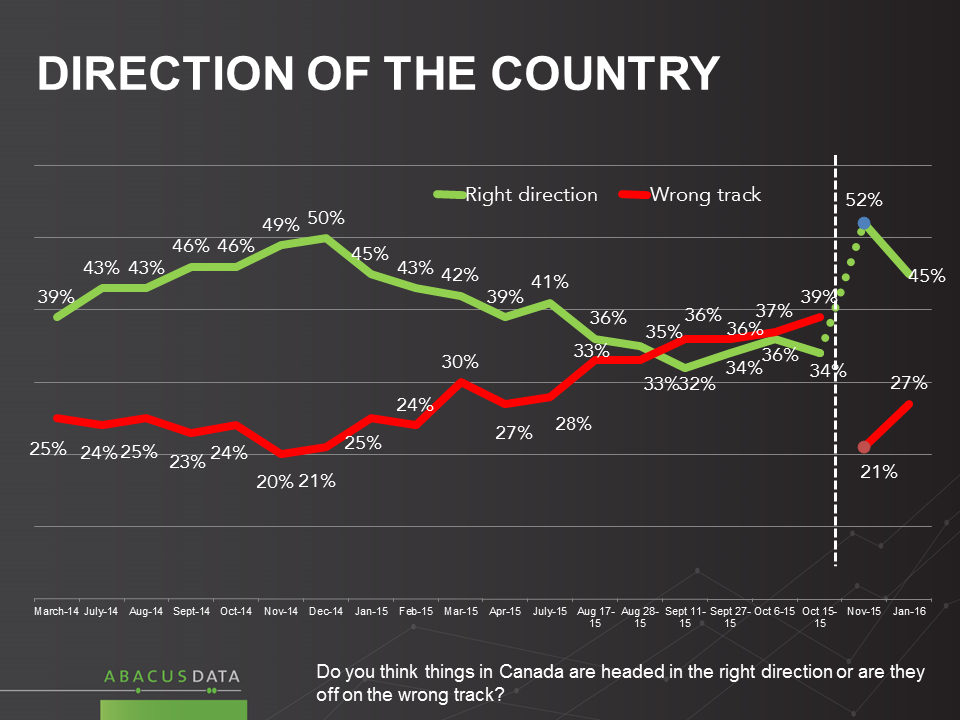
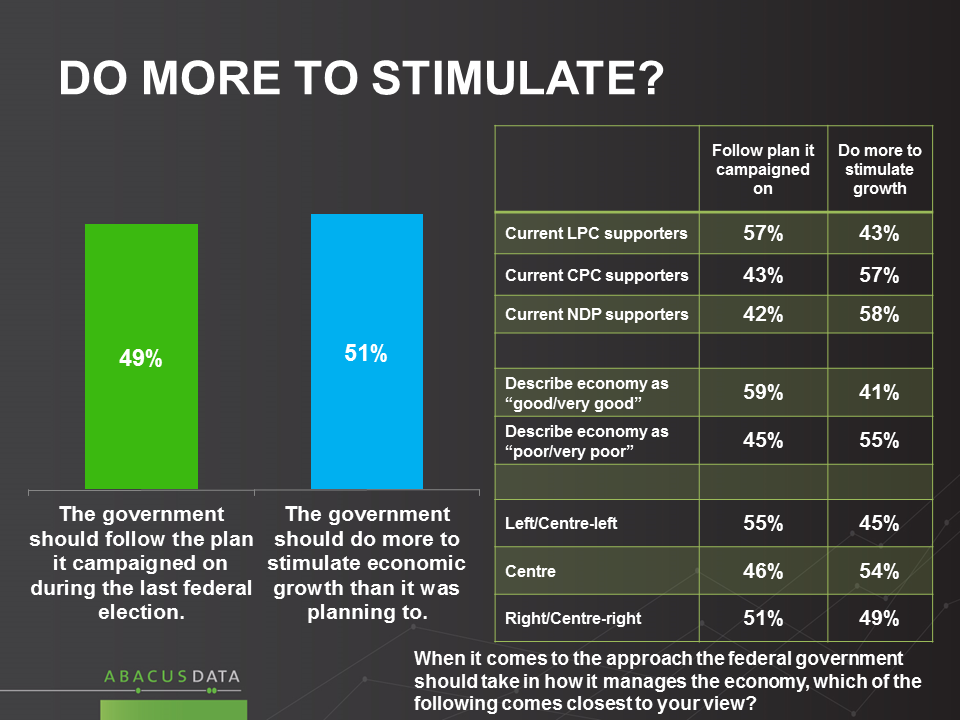
Also noteworthy is that a year ago, 2 out of 3 people thought the economy was doing well; today, 2 out of 3 describe it as poor.

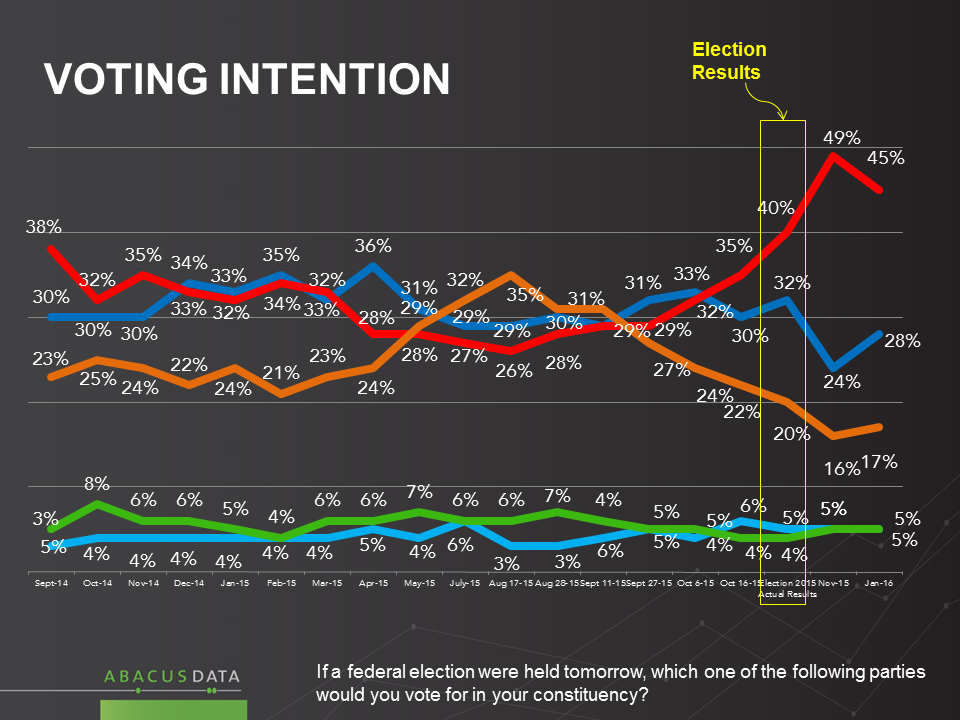
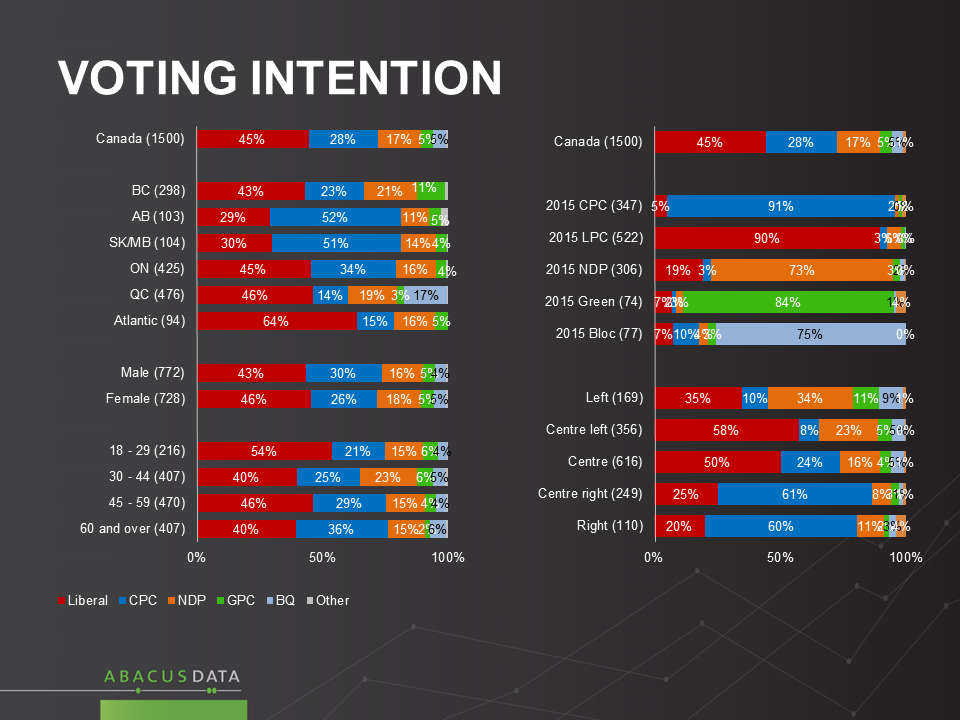
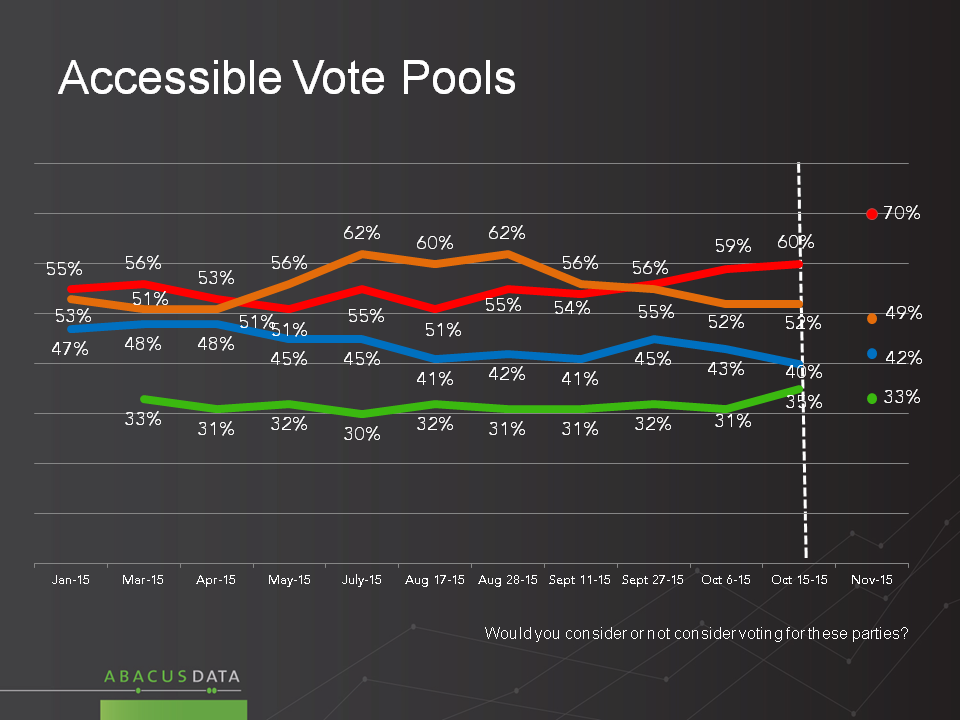
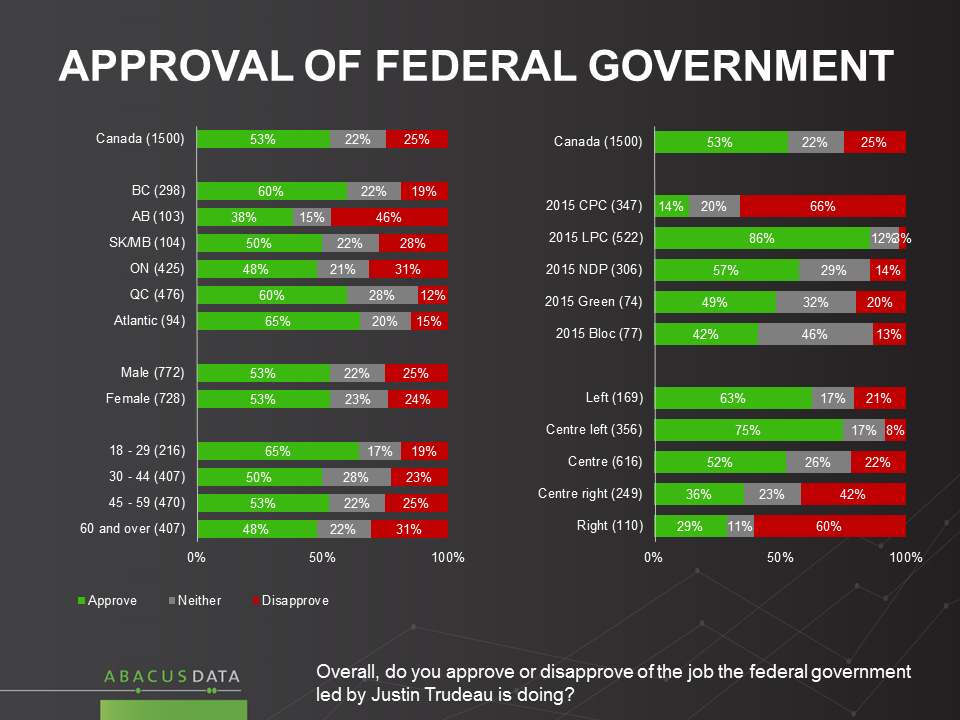
Today, just 25% disapprove of the performance of the government, even though 60% voted for another party. This underscores the challenge facing opposition parties, as Canadians are inclined to give this government some time to establish its agenda.

14% of those who voted Conservative voters approve of the Liberal government’s performance so far, as do a striking 57% of those who voted for the NDP.

Approval of Prime Minister Trudeau personally is at 57% while disapproval is 24% underlining that a very large proportion of the positive feeling about the government has to do with reactions to Mr. Trudeau himself.

Slide1
Slide2

Detailed Assessments of the Prime Minister

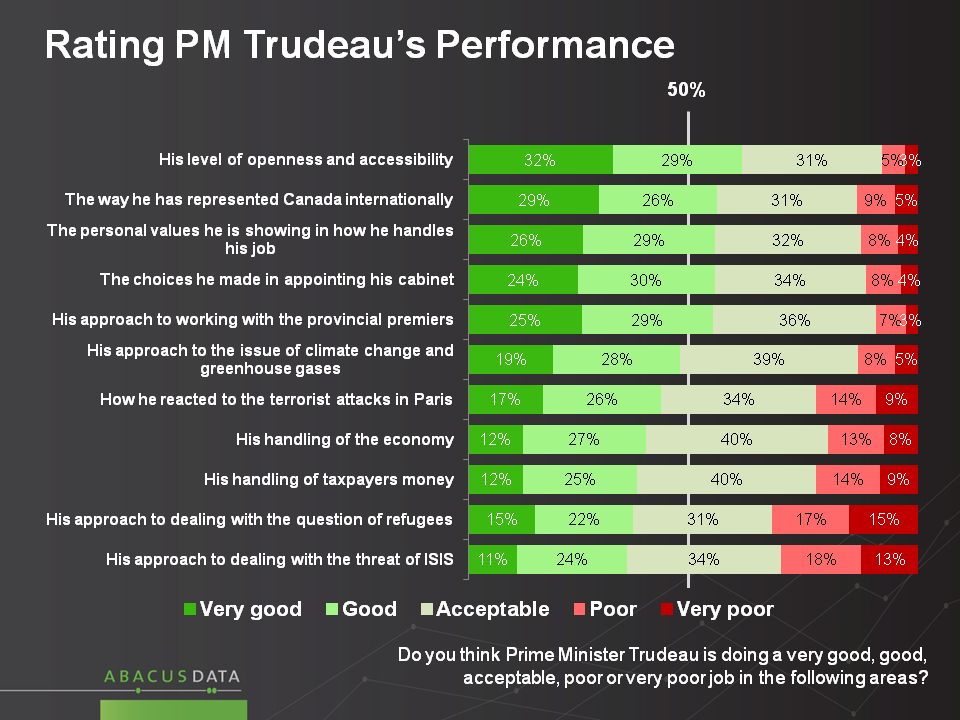
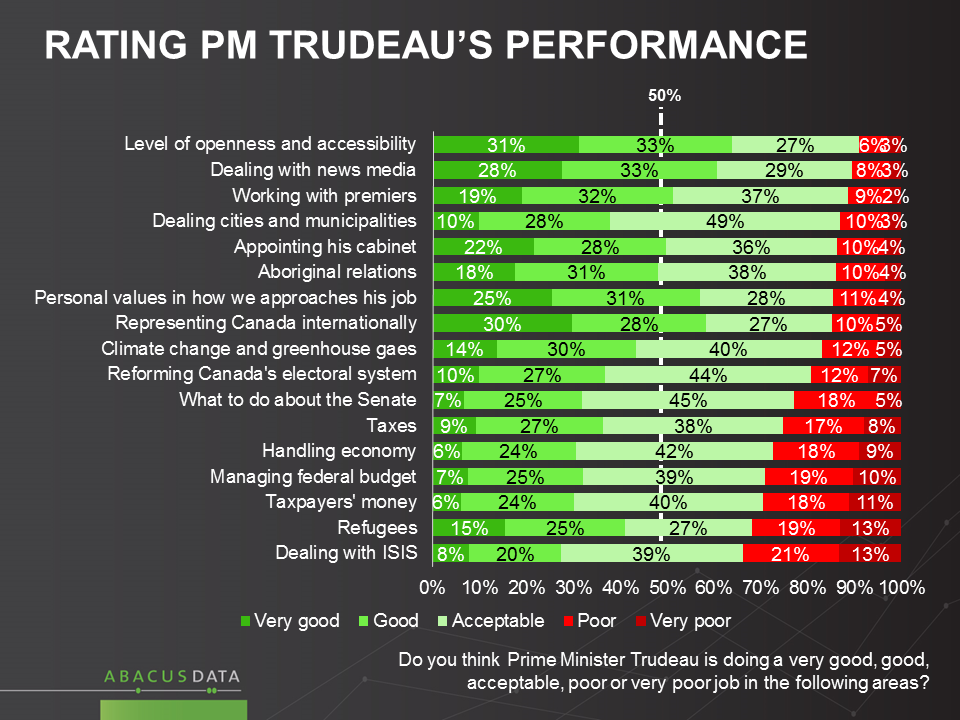
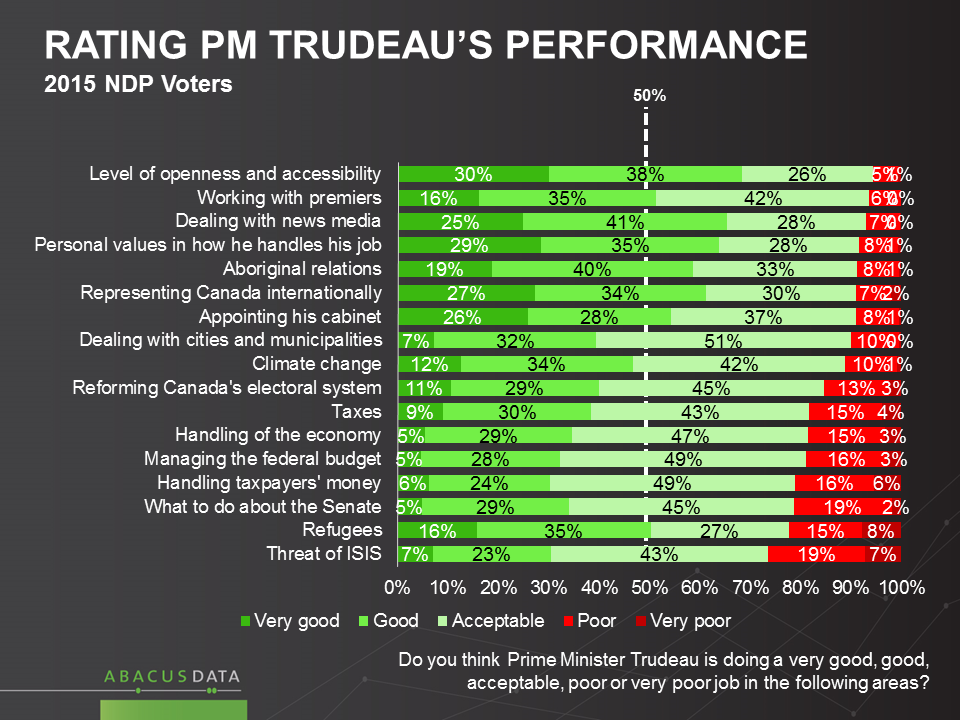
We explored reactions to Mr. Trudeau’s performance in office on 17 different items.

• On all 17 items a sizeable majority (never smaller than 67%) said he was doing an acceptable or better job.

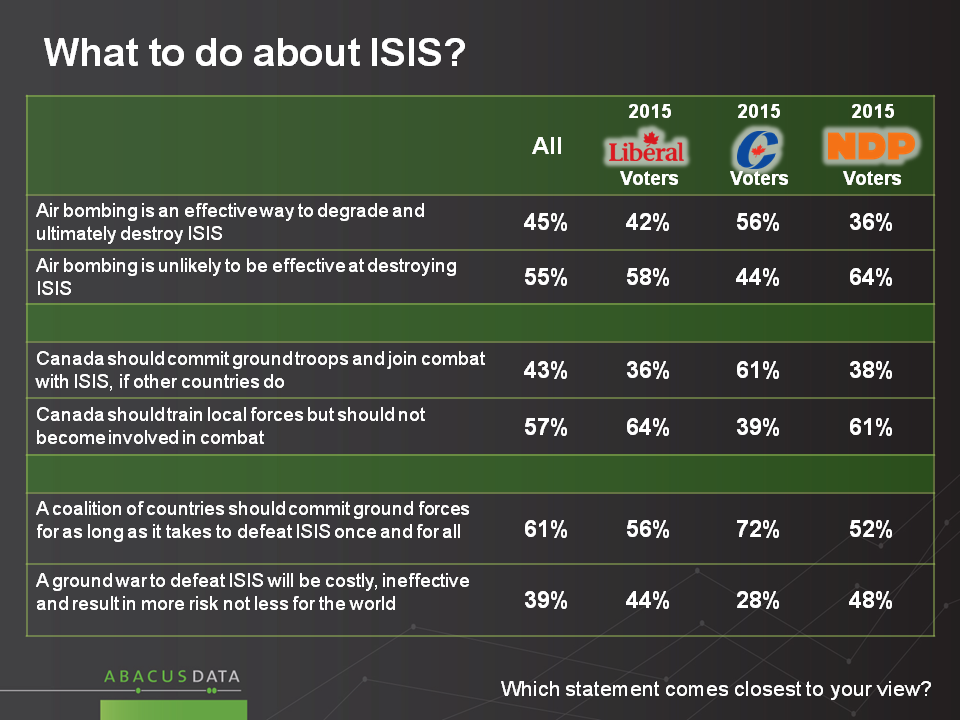
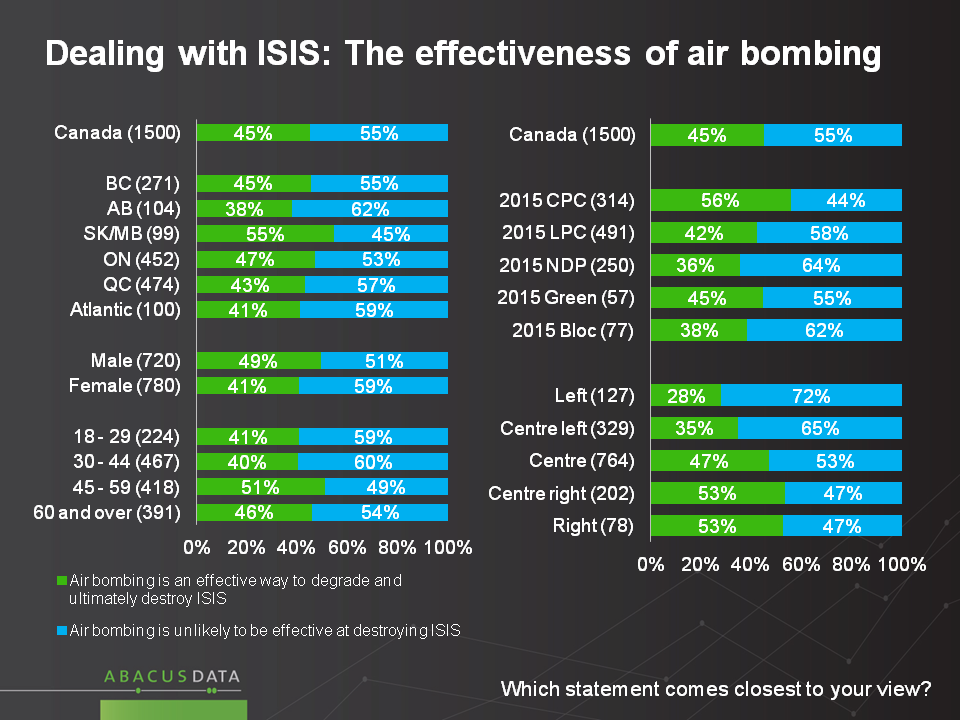
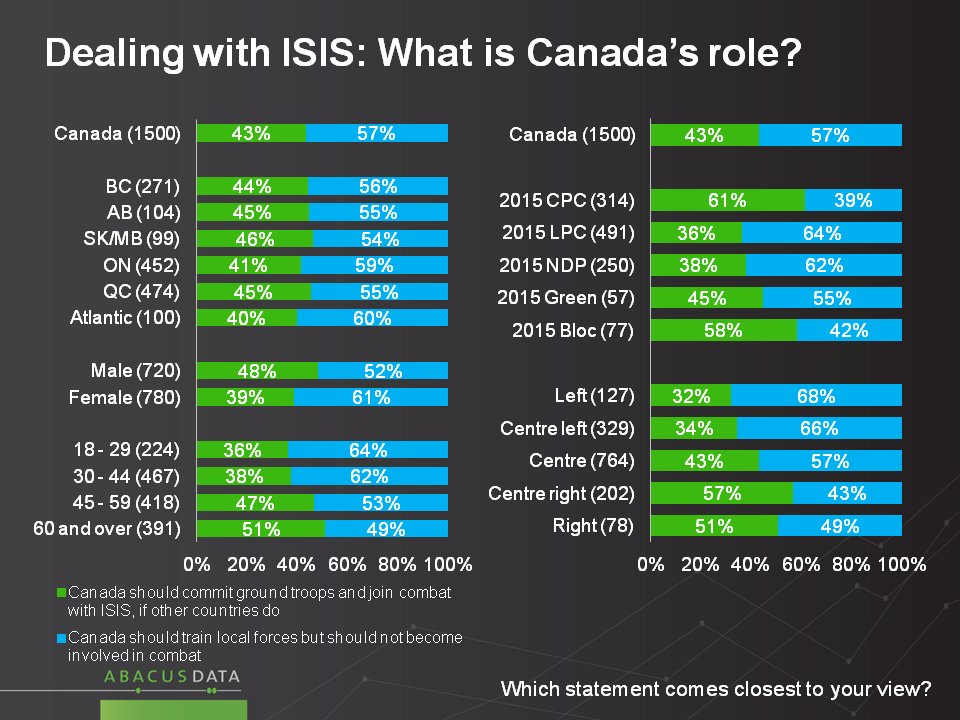
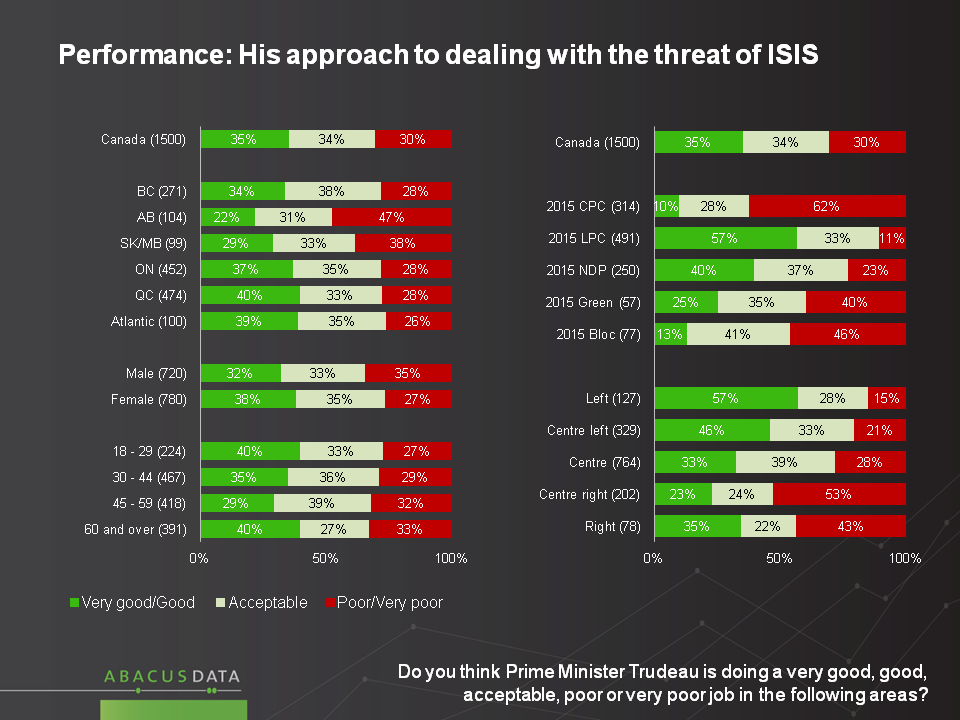
• On his worst rated item, “dealing with ISIS”, only 34% give the PM a poor rating.

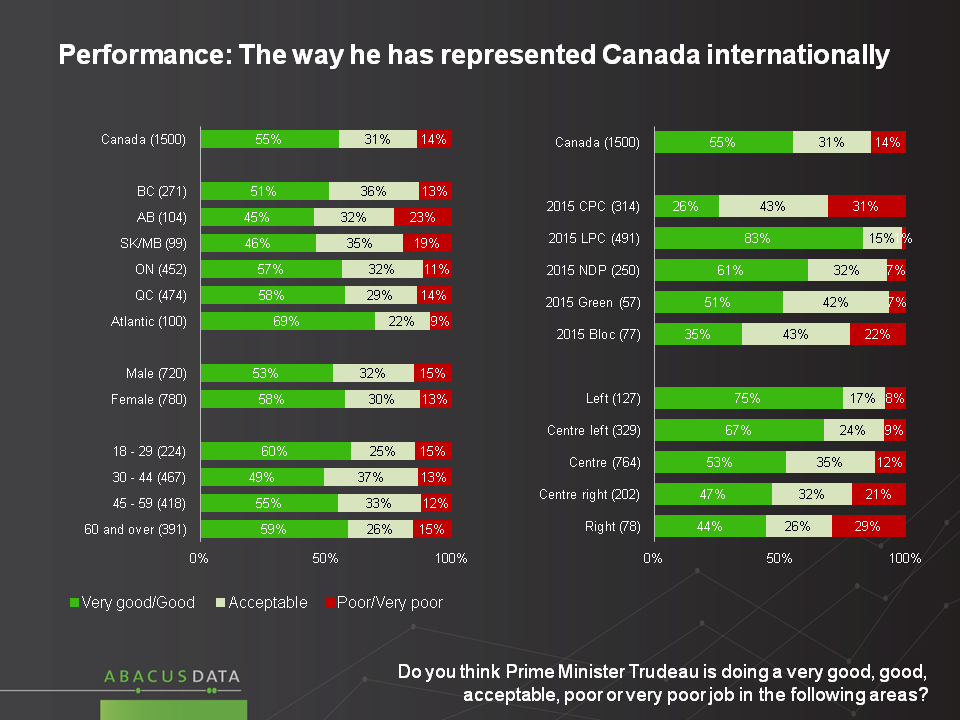
• Four items stand out for showing the strongest positive assessments: “level of openness and accessibility’, approach to “dealing with the news media” “personal values in how he approaches his job” and “representing Canada internationally”

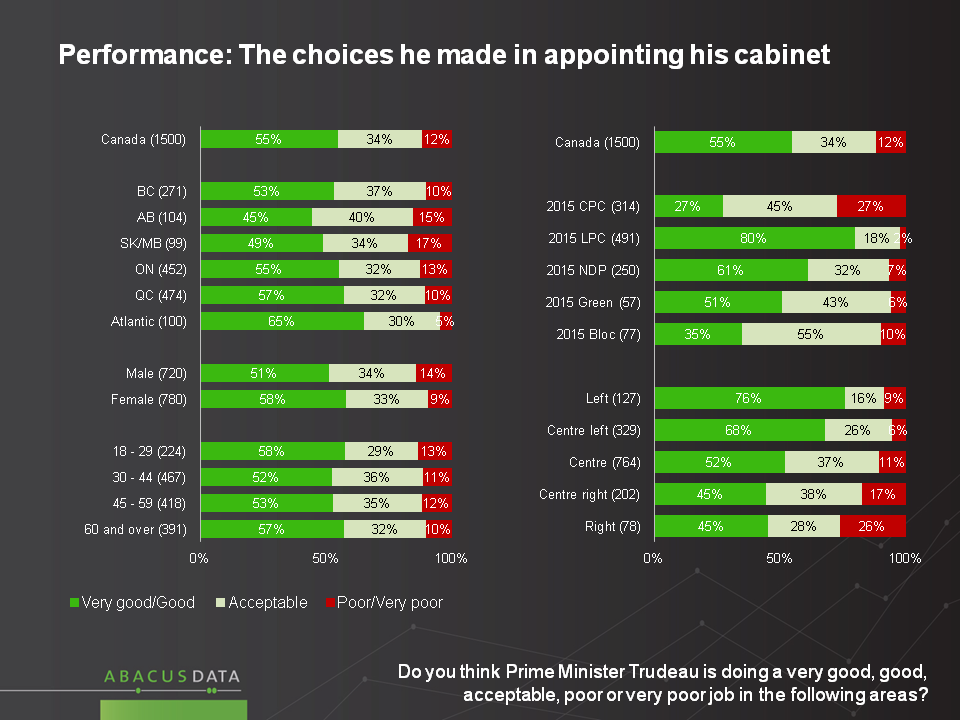
• Close behind these were “working with the Premiers” “aboriginal relations” and his selections to Cabinet posts.

• On handling the economy, managing the federal budget, and dealing with taxpayers money, Mr. Trudeau gets acceptable or better ratings from 70%-72%.

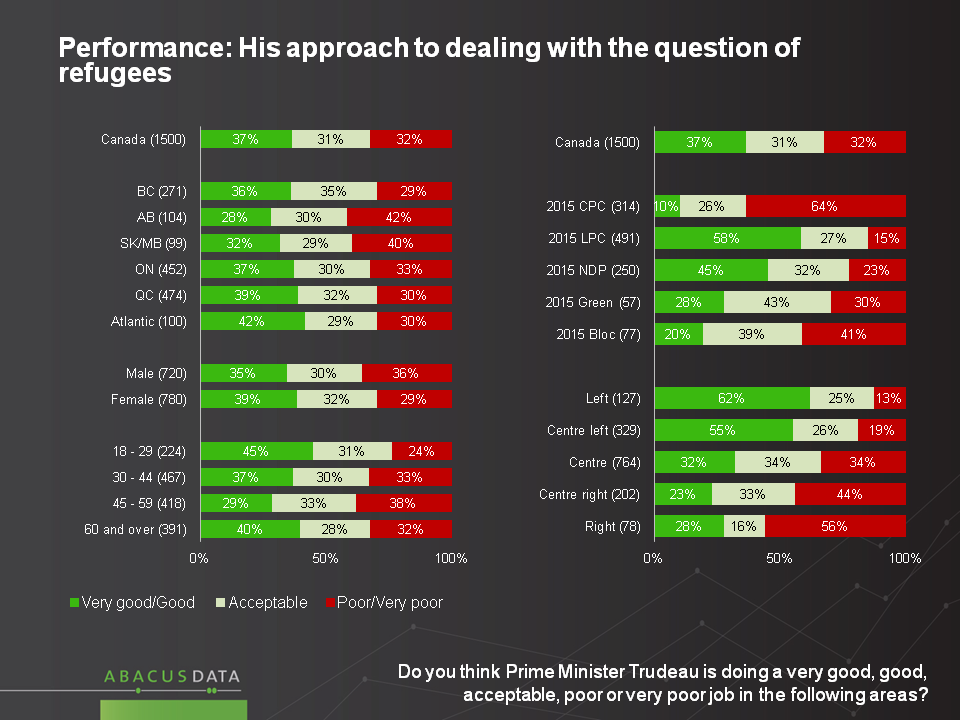
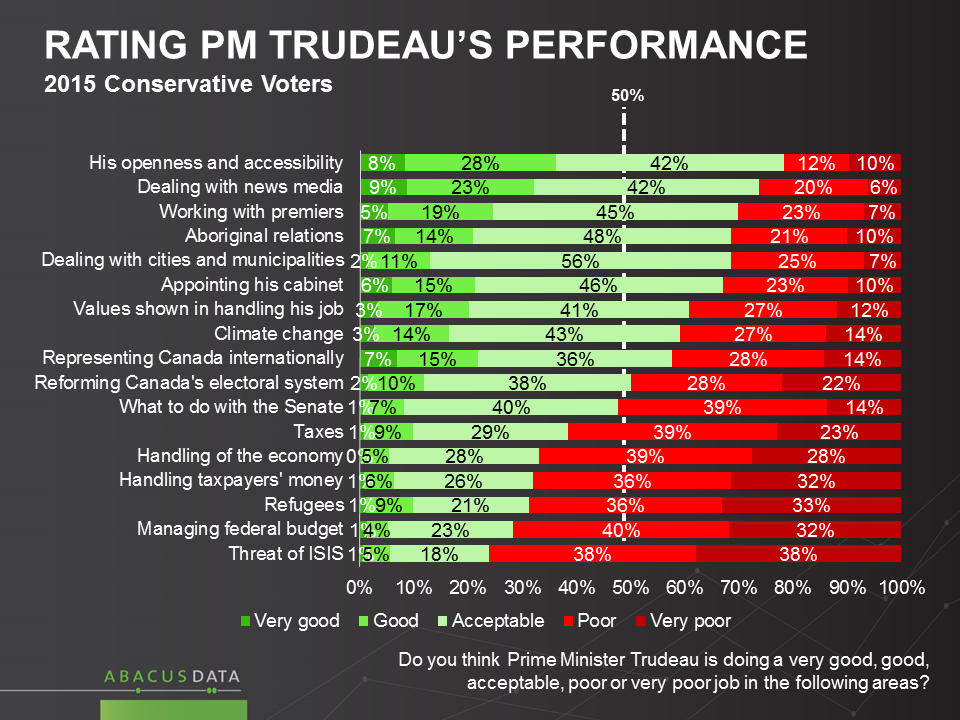
• On his approach to refugees, 40% give Mr. Trudeau a good rating, 27% acceptable, and 32% a poor rating. Deeper analysis shows that this issue more than any other creates a clear dividing line between Conservative Party supporters and other voters.

• When it comes to reforming the electoral system, 37% say the PM is doing a good job, another 44% acceptable, while only 19% are unhappy at this point in time.

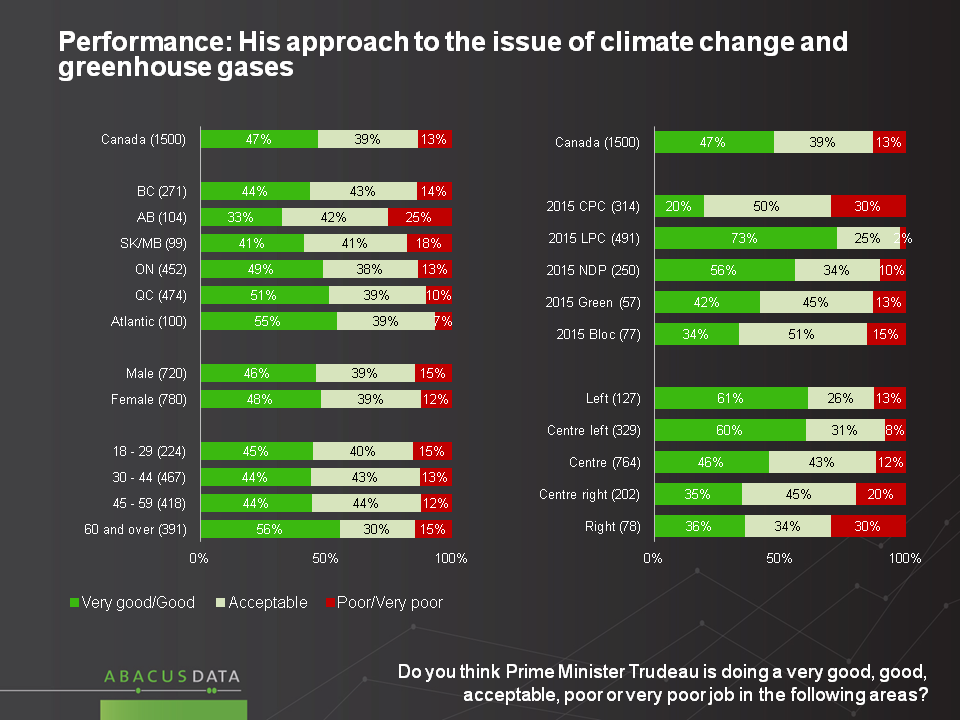
• In the wake of the COP21 agreement, 44% give the PM a good rating, 40% acceptable, and just 17% say “poor” when it comes to how he has dealt with climate change and greenhouse gases.

• On “what to do about the Senate” 32% say Trudeau is doing well, 45% acceptably, while 23% offer a poor rating.

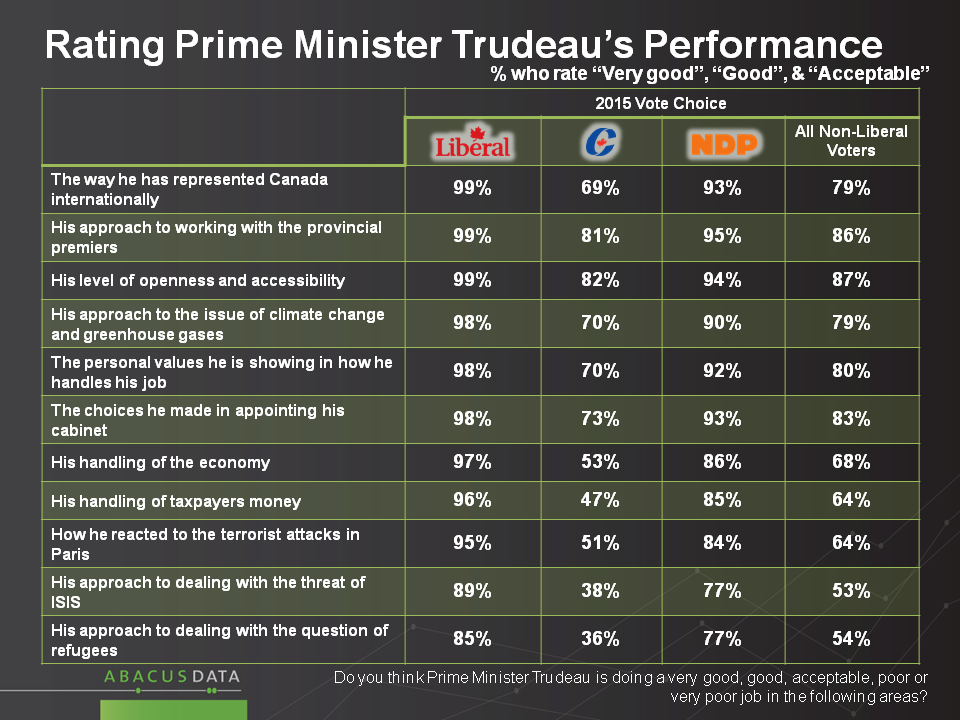
Mr. Trudeau receives positive reviews from most of those who voted NDP: large majorities describe his performance as acceptable or better on all 17 items. A majority of Conservative voters rate Mr. Trudeau’s performance as acceptable or better on 10 of the 17 items.

Slide3
Slide4
Slide5

The Upshot

According to Bruce Anderson: “The positive feelings about the federal government so far, despite a weakening economy, challenge the conventional wisdom that politics is always about the economy.

While the government is getting pretty good marks for handling challenging substantive issues, the most positive assessments continue to have a lot to do with appreciation for the tone and attitude of the Prime Minister towards others.

Recalling the degree to which both his major opponents built campaigns on the assumption Mr. Trudeau would not wear well with Canadians, it is very clear that they have their work cut out for them now. So far, Mr. Trudeau is converting what was hope that he would do well into a feeling that he is proving himself fit, and then some, to hold the office of Prime Minister.”

Methodology

Our survey was conducted online with 1,500 Canadians aged 18 and over from January 8 to 12, 2016. A random sample of panelists was invited to complete the survey from a large representative panel of over 400,000 Canadians.

The Marketing Research and Intelligence Association policy limits statements about margins of sampling error for most online surveys. The margin of error for a comparable probability-based random sample of the same size is +/- 2.6%, 19 times out of 20. The data were weighted according to census data to ensure that the sample matched Canada’s population according to age, gender, educational attainment, and region. Totals may not add up to 100 due to rounding.

Abacus Data Inc.

We offer global research capacity with a strong focus on customer service, attention to detail and value added insight. Our team combines the experience of our Chairman Bruce Anderson, one of Canada’s leading research executives for two decades, with the energy, creativity and research expertise of CEO David Coletto, PhD.

The Economy & National Politics?

Economic concerns are rising.
Political preferences fairly stable.
LPC 45%, CPC 28%, NDP 17%

PdfExport

A year ago, two thirds of Canadians said the economy was in good shape; one third said it was “poor”. Today, those numbers are reversed, illustrating how significant has been the shift in sentiment. Much of that shift has happened over the last six months.

While this shift has been sizeable, the worry is qualified: the tendency is to describe the decline as a “mild”, rather than a severe recession. Today 28% see the economy as growing, 54% see a mild recession, and 15% say the economic downturn is more severe.

Comparing this result to the numbers we found last August, before the federal election, shows that the movement towards negative sentiment has been about 5 points during that period of time: most of the weakening had happened before people went to the polls.

Economic stress is evident in every region of the country, but is most challenging in Alberta, where 76% say the economy is in poor shape, and Quebec (75%).

Looking deeper into where the shift in economic sentiment has been most acute reveals the largest drops in comfort are found among Albertans (37-point shift since last July), the highest income earners (39-point shift), and Conservative voters (55-point shift).

economy
Slide7
Slide6
Slide5

While economic anxieties have been growing, the effect on political attitudes has been limited. Many more people say the country is heading in the right (45%) rather than the wrong direction (27%). Even in Alberta, 36% say right, 43% say wrong direction. “Wrong direction” sentiment is largely concentrated on the further right and supporters of the Conservative Party.

Slide2
Slide3

Federal Voting Intentions

When asked how they would vote if an election were tomorrow, the Liberals hold a wide 17-point margin over the Conservatives and a 28-point margin over the New Democrats. These numbers reveal a slight decline from the remarkably high levels measured before the end of 2015, but are above the support the Liberals achieved on Election Day.

Slide1

The Liberals continue to hold wide leads in BC (by 20), Ontario (by 11), Quebec (by 27), and in Atlantic Canada (by 48). The strength in Liberal support since the election owes much to the fact that only 73% of those who voted NDP in October say they would vote NDP today: 1 in 5 of them would vote Liberal.

voteintention

Federal Economic Approach

We asked whether the current state of the economy means that the federal government should do more to stimulate the economy than it had planned on, or stick with the plan it campaigned on. The results show a split in opinion, with 51% saying that the government should do more, and 49% saying it should stick with the plan it campaigned on.

Worth noting is that majorities of CPC (57%) and NDP (58%) supporters say the government should do more than had been planned, while smaller numbers (42%) of LPC supporters feel that way.

Regionally, Ontarians were more likely to think the government should do more than had been planned to stimulate the economy while a majority in every other region feel that the government should stick with the plan it campaigned on.

Slide8
Slide9

The Upshot

According to Bruce Anderson: “The economy is no doubt a growing cause of concern for Canadians and will test the level of confidence in this government, as it would for any. So far, the impact on the mood of the country has been muted, except in Alberta where the pain of lower oil prices has been causing extraordinary challenges.

However, at this point, the general tendency is to see the economic downturn as mild rather than severe, and while the government has latitude in public opinion terms to do more to stimulate if it chooses to, these numbers don’t suggest that people believe either that the government has contributed to the economic deterioration, or should consider a major deviation from the course it has been on.

In terms of political preferences, the Liberal Party continues to enjoy broad support. Our releases over the next few days will explore how people are reacting to a broad cross section of measures taken by the Trudeau government.”

Methodology

Our survey was conducted online with 1,500 Canadians aged 18 and over from January 8 to 12, 2016. A random sample of panelists was invited to complete the survey from a large representative panel of over 400,000 Canadians.

The Marketing Research and Intelligence Association policy limits statements about margins of sampling error for most online surveys. The margin of error for a comparable probability-based random sample of the same size is +/- 2.6%, 19 times out of 20. The data were weighted according to census data to ensure that the sample matched Canada’s population according to age, gender, educational attainment, and region. Totals may not add up to 100 due to rounding.

Abacus Data Inc.

We offer global research capacity with a strong focus on customer service, attention to detail and value added insight. Our team combines the experience of our Chairman Bruce Anderson, one of Canada’s leading research executives for two decades, with the energy, creativity and research expertise of CEO David Coletto, PhD. For more information, visit our website at http://www.abacusdata.ca/

What do Canadians think should be done about ISIS?

Canadians are unsure bombing will work, hesitant about sending troops, and think a ground war may be needed.

In our most recent nationwide public opinion survey, we explored three questions that tapped into how Canadians feel about the choices facing Canada and other countries when it comes to dealing with ISIS (This data was gathered after the attacks in Paris, but before the shootings in San Bernardino).

Slide1

Will Air Bombing Work?

Under half (45%) of those surveyed said they believe “air bombing is an effective way to degrade and ultimately destroy ISIS”, while a majority felt “air bombing is unlikely to be effective at destroying ISIS”.

These views vary somewhat by partisan affiliation – but the differences might not be as large as one might expect. As many as 42% of Liberal voters think bombing would work, and as many as 44% of Conservative voters doubt that it would. NDP voters are the most certain on this question, with 64% saying bombing won’t work, and 36% saying it will.

There is less variation by demographics or region. Men, and those 45 and over are somewhat more likely to think that air bombing is effective while women and those under 45 are somewhat less convinced.

Slide2

Should Canada Send Ground Troops or Train Local Forces?

The uncertainty about whether air bombing would work is also evident on the question of whether Canada should send ground troops to join in combat with ISIS, if other countries do. Almost half (43%) think we should, while the majority (57%) prefer that “Canada should train local forces but not become involved in combat”.

Once again, differences by partisanship are evident but not extreme. Majorities of Liberal voters (64%) and NDP voters (62%) say we should stick to training local forces, while 61% of Conservative voters favour participation in a coalition ground war.

Similar demographic differences persist on this question as well.

Slide3

Should a Coalition Commit to a Ground War to Defeat ISIS?

While many have doubts about bombing’s effectiveness and hesitate about having Canadian troops be involved in combat, when asked if a coalition of countries should commit to a ground war, the tendency is for most people to want to see that happen: 61% say “a coalition of countries should commit ground forces for as long as it takes to defeat ISIS once and for all” while 39% felt “a ground war to defeat ISIS will be costly, ineffective and result in more risk, not less, for the world”.

Conservative voters (72%) are most convinced of the merits of a ground war, but significant numbers of Liberal voters (56%) and NDP voters (52%) share the feeling that this might be necessary.

Older Canadians and men are more likely to favour a coalition ground effort than women and younger people.

Slide4

Worth noting is the fact that three quarters (74%) of those who think air bombing would be effective also believe that ground forces are needed. Of those who doubt the effectiveness of an air campaign, half thing ground troops are a good idea.

Slide5

The Upshot

These numbers illustrate that many Canadians are unsure of what course will be best for Canada and the world when it comes to dealing with the complex threat posed by ISIS.

According to Bruce Anderson “In a situation like this, Canadians know that their political leaders have no simple, easy or obvious choices. They also know that the situation is evolving and that new events or information may tilt the balance in favour of one type of action or another.

In a sense this uncertainty provides room for political leaders, of any stripe, to champion the course of action they most believe in, secure in knowing that few Canadians will dismiss it out of hand. Finally, while the debate about ISIS has been partisan at times, these data suggest that a fair number of people on all sides of partisan divides aren’t committed to the line adopted to date by their party. In all likelihood, this is because they are unsure of what the best course really is given the complexity of the situation.”

Methodology

Our survey was conducted online with 1,500 Canadians aged 18 and over from November 23 to November 25, 2015. A random sample of panelists was invited to complete the survey from a large representative panel of over 500,000 Canadians, recruited and managed by Research Now, one of the world’s leading provider of online research samples.

The Marketing Research and Intelligence Association policy limits statements about margins of sampling error for most online surveys. The margin of error for a comparable probability-based random sample of the same size is +/- 2.6%, 19 times out of 20. The data were weighted according to census data to ensure that the sample matched Canada’s population according to age, gender, educational attainment, and region. Totals may not add up to 100 due to rounding.

Abacus Data Inc.

We offer global research capacity with a strong focus on customer service, attention to detail and value added insight. Our team combines the experience of our Chairman Bruce Anderson, one of Canada’s leading research executives for two decades, with the energy, creativity and research expertise of CEO David Coletto, PhD.

In case you missed it…some of our latest releases

Early handicapping of the Conservative Party leadership race

Job approval of the new government

How financially literate are Canadians?

Broad support for the new government

Early Handicapping of the CPC Leadership Race: MacKay on top

In our most recent nationwide public opinion survey, we tested support levels for 9 people whose names have been rumoured as people who might make good candidates for the leadership of the federal Conservative Party.

Undoubtedly, other names may be added and some subtracted from this list next time we do this survey, as people rule themselves in or out as candidates, but this set of data helps us understand going in levels of familiarity and enthusiasm.

Also, it almost goes without saying that public opinion, and even the opinion of Conservative voters, might not reflect the views of CPC activists who will vote in the leadership race. These numbers are more a reflection of the broader community in which the CPC operates and seeks to attract support.

Five top tier contenders; Peter MacKay with an early advantage

Five of the nine names tested have more substantial or broadly based support than the other four. The leading group would include Peter MacKay, Jean Charest, Jason Kenney, Lisa Raitt, and Brad Wall. The second group includes Max Bernier, Doug Ford, Michael Chong and Kellie Leitch.

Peter MacKay would start a leadership race with a sizeable public opinion lead (31%), including strength among current and accessible Conservative voters, and people who describe themselves as on the centre of the spectrum, a group the Conservatives need to court in order to be in a position to win an election.

Jean Charest (although of this field he may be the least likely to enter a race), would command substantial initial support (15%). When it comes to accessible (not current) CPC voters, Charest would do substantially better than all of the other candidates save MacKay.

Jason Kenney and Lisa Raitt both poll at 10% across the country. Ms. Raitt’s support is a bit stronger among accessible rather than core voters; the opposite appears true for Kenney, but these are mild differences at this point.

Slide1

Some important differences are found in regional breakdowns:

• MacKay’s support out of the gate would be heaviest in Atlantic Canada (49%) but fairly substantial in other regions as well, including 33% in Ontario.

• Jean Charest would find no less than 11% in any region of the country and 23% in Quebec.

• Brad Wall finds 26% support in the Prairies, but at only 6% in Ontario and 2% in Quebec would need to build up his recognition and support outside his home turf.

• Jason Kenney’s support is slight in Atlantic Canada (5%), but 10% in Ontario, BC and Quebec, and 13% in the Prairies.

• Lisa Raitt finds fairly consistent support across different regions, and is tied for second in Ontario (with Charest and Ford)

• Doug Ford claims 12% support in Ontario, 9% in BC, but no higher than 5% anywhere else.

• Maxime Bernier finds 22% support in Quebec, putting him in a tight three-way cluster with Charest and Mackay in that province. His support in other parts of the country is more limited, and he polls at just 2% in Ontario.

• Michael Chong finds 10% support in BC and 7% in Ontario, suggesting he could tap into pools of people who have noticed and liked his stance on Parliamentary reform.

• Kellie Leitch would start the race with less name recognition and support only hitting 5% support in her home province of Ontario.

There are some other differences in support patterns that are worth noting as well.

• Lisa Raitt has almost twice as much support among women (13%) as among men (7%) Her support is fairly consistent across age groups. If anything, her support skews a bit younger.

• Peter MacKay has more support among men (33%) than women (29%), and his support tends to skew older, although he leads among all age groups.

• Jason Kenney’s support rises a bit with age. Gender differences are mild.

• If we look only at current CPC voters (24% of all voters) in this survey the race is led by MacKay (35%) followed by Wall (17%) Kenney (12%) Charest (11%), and Raitt (8%).

• If we look only at accessible CPC voters (“I’d consider the Conservatives but not voting CPC now”) the Mackay leads (36%) followed by Charest, Kenney and Raitt all at 12%.

• If we look only at those who describe themselves as on the right of the spectrum Mackay’s support is a bit lower (28%) followed by Charest (14%) Wall (10%) Ford (10%) Kenney 9%) Bernier (9%) Chong (8%). Raitt is at 7% within this group.

• If we look at centre right voters MacKay leads, and Charest, Wall, and Kenney are all closely bunched.

• Finally, among centre voters MacKay leads, followed by Charest, with Kenney and Raitt tied for third place. Brad Wall is a little further back among this group.

Slide2
Slide3
Slide4

We also probed whether voters would vote or consider voting Conservative if each of the individuals tested were leader. The results show that MacKay would create a potential CPC pool of 47%, followed by Charest, Kenney, Raitt, Wall all at 36-38%. Bernier (34%) Chong (34%) Leitch (32%) follow a little further back. Doug Ford would clearly be the most difficult choice, as fully half say they would not consider voting CPC with him as leader, a far greater level of resistance than for any of the other candidates.

Slide5

Looking at the results to these questions broken down by ideology reveals that Jason Kenney would slightly eclipse the potential of Peter MacKay among self described right-wingers. Mr. Kenney trails Mr. MacKay among centre right voters and centrist voters, when it comes to the potential to increase CPC support.

Slide6

The Upshot

This race of course has not yet begun, and to some degree these numbers reveal largely name recognition. A lot can and often does happen once a campaign gets underway.

Nevertheless the patterns do suggest that some names tend to stand out from the rest and some people are know more as centre/centre right conservatives while others have more direct appeal on the right. Regional patterns of support matter too.

Taking a step back, it seems fair to conclude that as far as public, and indeed CPC public opinion is concerned, there may be a looming battle among those who favour a more pragmatic, less ideological Conservative Party and those who feel otherwise. Support for names like MacKay, Charest, Raitt suggest also that support in central and eastern Canada may, initially anyway, gravitate towards a candidate from a different part of the country.

By most accounts, Jason Kenney has formidable support across the base of the Conservative Party and among its activists. These numbers confirm his strength but also suggest the campaign may turn out to be a more competitive one than some have imagined.

Methodology

Our survey was conducted online with 1,500 Canadians aged 18 and over from November 23 to November 25, 2015. A random sample of panelists was invited to complete the survey from a large representative panel of over 500,000 Canadians, recruited and managed by Research Now, one of the world’s leading provider of online research samples.

The Marketing Research and Intelligence Association policy limits statements about margins of sampling error for most online surveys. The margin of error for a comparable probability-based random sample of the same size is +/- 2.6%, 19 times out of 20. The data were weighted according to census data to ensure that the sample matched Canada’s population according to age, gender, educational attainment, and region. Totals may not add up to 100 due to rounding.

Abacus Data Inc.

We offer global research capacity with a strong focus on customer service, attention to detail and value added insight. Our team combines the experience of our Chairman Bruce Anderson, one of Canada’s leading research executives for two decades, with the energy, creativity and research expertise of CEO David Coletto, PhD.

Financial Literacy in Canada: Trust and Sources of Information

Research Objectives

In June, Canada launched its first-ever National Strategy for Financial Literacy and the country is now examining how best to increase the financial knowledge and skills of Canadians.

On behalf of the Canadian Bankers Association, Abacus conducted an extensive nationwide study of Canadians’ financial aspirations and their know-how when it comes to managing money in ways that will help them achieve their goals. This research is designed to explore the values, financial goals and priorities of Canadians of different ages and to get a better understanding of what financial issues they would like to know more about and where they go to look for information. This study is being widely released so that all financial literacy organizations can use the knowledge to properly evaluate their programs and ensure that they are reaching all generations in this digital age.

This is the fourth of a series of releases to highlight key elements of this fascinating study.

Important Sources of Information

Canadians learn about money from a wide variety of sources. Information is passed on from financial service staff but also from friends and family. Just over 7 in 10 say that older generations were helpful sources for them, and two thirds have counted on peers and friends.

School courses have been useful sources for the majority of those interviewed. As technology has changed so many marketplaces, it is also playing a strong role in the dissemination of learning about money. Financial service company websites are important sources of information for about 6 in 10 people, and almost as many say they use government publications and websites.

Slide1

When it comes to generational differences, Millennials are more likely to say that social media and other websites, advertisements, financial service provider websites, and government websites are important sources compared to older generations while Gen Xers and Boomers are more likely to say that financial service provider staff are important. Millennials are more likely to rely on digital sources while Boomers, for example, are more likely to rely on more traditional sources of information.

Slide2

When it comes to socio-economic status, we find almost no difference across income groups except when it comes to financial service provider staff – lower income respondents were somewhat less likely to say they are important sources for information.

Slide3

Trusted Sources of Information

Most people say they trust the information about money that they get from staff and financial service companies as they do advice from people who are older. Peers, government, and school sources are almost as well trusted, with two thirds or more saying they trust these sources.

Trust levels are lower when it comes to advertisements and social media and general websites. This suggests that people consider the source more important than the platform when it comes to trust.

News media stories do not enjoy particularly high levels of trust when it comes to this subject matter.

Slide4

We examined differences by generation on these questions and found relatively few important differences. Across all generations, people are about equally likely to trust peers and friends, as well as staff in financial services companies. There are slightly higher levels of trust in social media and general websites among younger people, but the differences are modest.

Slide5

We also find lower trust levels among those whose household income is $50,000 or less for financial service provider staff and websites. Otherwise, there is little variation across socio-economic status.

Slide6

The Upshot

Learning about money is something that is not a function of any single source of information, rather it happens over time through a combination of formal/structural ways and informal peer and inter-generational influences.

For the most part, it appears that Canadians feel they have access to a good number of information sources they can trust, using traditional, word of mouth and digital delivery systems. While generations differ on many things, how they acquire information and the sources they trust are not all that different, when it comes to learning how to manage money well.

Methodology

The survey, commissioned by the Canadian Bankers Association, was conducted online with 1,978 Canadians aged 18 to 70 from April 10 to 21, 2015. A random sample of panelists was invited to complete the survey from a large representative panel of over 500,000 Canadians, recruited and managed by Research Now, one of the world’s leading provider of online research samples.

The Marketing Research and Intelligence Association policy limits statements about margins of sampling error for most online surveys. The margin of error for a comparable probability-based random sample of the same size is +/- 2.2%, 19 times out of 20. The data were weighted according to census data to ensure that the sample matched Canada’s population according to age, gender, educational attainment, and region. Totals may not add up to 100 due to rounding.

Abacus Data Inc.

We offer global research capacity with a strong focus on customer service, attention to detail and value added insight. Our team combines the experience of our Chairman Bruce Anderson, one of Canada’s leading research executives for two decades, with the energy, creativity and research expertise of CEO David Coletto, PhD.

Job Approval of the New Government: 51% approve vs. 19% disapprove

Remarkably Few Unhappy with New Government

PdfExport

While less than half of Canadian voters marked a ballot for a Liberal candidate, only 19% are unhappy with the performance of the Trudeau government so far.

Slide1

This view cuts across regional, demographic and political lines to a remarkable degree.

Demographically, there is little difference in overall approval with 49% of men and 52% of women saying they approve of the job the federal government is doing. Only about 1 in 5 disapprove. A majority or large plurality of Canadians across all age groups also approve including 56% among those aged 18 to 29 and 54% of those aged 60 and over.

Regionally, Atlantic Canadians (66% approve), Ontarians (54% approve), Quebecers (50% approve) and British Columbians (50% approve) are the most likely to approve of the job performance of the federal government. Even in Alberta, more respondents approve (38%) than disapprove (34%).

Almost 6 in 10 NDP voters approve of the job the federal government is doing, as do 47% of Green voters, and 31% of BQ voters. 81% of those who voted Liberal approve of the federal government’s job performance thus far. Among Conservative voters, 16% approve while 48% disapprove. The rest say they neither approve nor disapprove.

Slide2

Detailed Performance Assessments

We asked respondents to rate the performance of the new government on 11 different criteria. Large majorities said they thought the government was doing an acceptable or good job on all 11.

Strongest ratings were for “openness and accessibility” where 62% said Mr. Trudeau was doing a good job, and another 31% said “acceptable”. Only 8% gave the PM negative ratings on this criteria.

While his critics said that Mr. Trudeau would embarrass the country internationally, Canadians have reacted differently. 55% give him a good rating, 31% acceptable and only 14% negative when it comes to the way he has represented Canada on the international stage (Note – this survey was taken after his participation in the G20 meeting).

Similarly good reactions were found on the “values he is showing in how he handles his job” the “choices he made in appointing his cabinet, and “his approach to working with the provincial premiers.” In each case, no more than 12% of the public give the PM a poor rating (Note- the survey was partially in the field after the First Ministers’ Meeting ended on Monday).

On his “approach to climate change and greenhouse gases”, the PM gets good marks from 37%, acceptable from 39%, and negative reviews from 13%.

On handling the economy and tax dollars, 77%-79% are satisfied.

One of the two weakest ratings for the PM was on his approach to dealing with the question of refugees, where 33% offered a poor rating (The timing of the survey was before the government announced that it would stretch its timetable to settle refugees into the new year).

The other weakest rating is on his “approach to dealing with the threat of ISIS”. On this item, 35% give the PM a good rating, 34% acceptable, and 31% a poor rating.

Slide3
Slide4

For the most part demographic patterns are consistent on these performance assessments. The following charts show the patterns on five of these assessments: representing Canada internationally, his handling of climate change, ISIS, refugees, and his approach to appointing his cabinet.

When it comes to his approach to the issue of climate change and greenhouse gas, evaluations are consistent across demographic groups. Atlantic Canadians, Quebecers, and Ontarians are most likely to rate his approach as very good or good. 30% of only three subgroups (Albertans, Conservative voters, and those who self identify as on the right) give Mr. Trudeau poor marks for his approach to climate change.

In terms of dealing with ISIS, seven out of ten (69%) rate Mr. Trudeau’s performance as at least acceptable and this is consistent across all age groups and genders. Among Conservative voters, 10% rate his performance as good or very good, 28% rate it as acceptable while 62% believe Mr. Trudeau’s approach is poor or very poor. When it comes to ideology, those on the left are most likely to favour Mr. Trudeau’s approach while those on the right are less likely to. That being said, 35% of those who self-identify as being on the right of the spectrum rate his performance on dealing with ISIS as good or very good.

Few give Mr. Trudeau poor marks on the choices he made in appointing his cabinet. There was little demographic or regional variation. Most Conservative voters (72%) even found his choices to be good or acceptable.

A majority of Canadians (55%) rate Mr. Trudeau’s performance internationally as good and these feelings are consistent across demographic and regional subgroups. Even a majority who self-identify as being on the right of the political spectrum are generally satisfied with his performance.

Finally, when it comes to his approach to dealing with the question of refugees, there is little overall variation beyond political support. 64% of Conservative voters felt Mr. Trudeau’s approach is poor or very poor while 36% felt it was good or acceptable. Most Liberal voters (85%) and NDP voters (77%) find Mr. Trudeau’s approach on the refugee file to be good or acceptable.

Slide5
Slide6
Slide7
Slide8
Slide9

The Upshot

Throughout this survey it is clear that people for the most part believe that Mr. Trudeau is handling his responsibility as PM in a way they find acceptable. The shape of these responses seems less a function of them having had low expectations based on his critics “he’s not ready” mantra and more a reaction to the way he has put his government in place, the choices he made in appointing a cabinet, his apparent determination to be more accessible, and his manner representing Canada abroad.

These numbers suggest that opposition criticisms of the various steps the government has taken so far have landed weakly – Canadians seem to be forming their own opinions, and positive ones for the most part.

This is even true on the complex issues of what to do with the threat of ISIS and how to respond to the refugee crisis. Even in these two areas, while most people didn’t vote for Mr. Trudeau, most people find his handling of these issues acceptable or better.

Methodology

Our survey was conducted online with 1,500 Canadians aged 18 and over from November 23 to November 25, 2015. A random sample of panelists was invited to complete the survey from a large representative panel of over 500,000 Canadians, recruited and managed by Research Now, one of the world’s leading provider of online research samples.

The Marketing Research and Intelligence Association policy limits statements about margins of sampling error for most online surveys. The margin of error for a comparable probability-based random sample of the same size is +/- 2.6%, 19 times out of 20. The data were weighted according to census data to ensure that the sample matched Canada’s population according to age, gender, educational attainment, and region. Totals may not add up to 100 due to rounding.

Abacus Data Inc.

We offer global research capacity with a strong focus on customer service, attention to detail and value added insight. Our team combines the experience of our Chairman Bruce Anderson, one of Canada’s leading research executives for two decades, with the energy, creativity and research expertise of CEO David Coletto, PhD.

How Financially Literate are Canadians?

Research Objectives

In June, Canada launched its first-ever National Strategy for Financial Literacy and the country is now examining how best to increase the financial knowledge and skills of Canadians.

On behalf of the Canadian Bankers Association, Abacus conducted an extensive nationwide study of Canadians’ financial aspirations and their know-how when it comes to managing money in ways that will help them achieve their goals. This research is designed to explore the values, financial goals and priorities of Canadians of different ages and to get a better understanding of what financial issues they would like to know more about and where they go to look for information. This study is being widely released so that all financial literacy organizations can use the knowledge to properly evaluate their programs and ensure that they are reaching all generations in this digital age.

This is the third of a series of releases to highlight key elements of this fascinating study.

How Financially Literate Are We?

As part of the study, we asked respondents five financial knowledge multiple choice questions. The questions had varied levels of difficulty to provide some insight into how financially literate Canadians from different generations and socio-economic backgrounds are.

The questions we asked are reported at the end of this report.

Overall, only 13% of Canadians aged 18 and over got all five questions correct. Another 25% got four right with 27% getting three right. Over one in three failed to get more than two of the questions correct.

Slide2

Profiling the Most and Least Financially Knowledgeable

Significant demographic and socio-economic differences exist between Canadians who have the most and least financial knowledge. We detail those who answered all five questions correctly (most knowledgeable) and those who answered none or only one of the questions correctly.

Most Financially Knowledgeable – Correctly Answered all 5 Questions

Representing just over one in ten Canadians (13%), those who correctly answered all five of the financial knowledge questions correctly are more likely to be male (58%), are generally older (80% are aged 45 or older), and most (54%) have a university education. Household incomes among the most financially knowledgeable are also the highest, with 54% making $75,000 per year or more. Four in ten (44%) say they have a financial advisor.

Least Financially Knowledgeable – Correctly Answered None or Only One Question

Also representing over one in ten Canadians (15%), those who answered none or only one of the financial knowledge questions correctly are more likely to be female (61%), are younger (54% are aged 35 or younger), and most (57%) have high school education or less. Household incomes among the least financially knowledgeable are lowest on average, with 48% living in households that make less than $50,000 per year. Only 26% say they have a financial advisor.

The results also reveal:

• Millennials are less financially knowledgeable than Gen Xers or Baby Boomers. Only 26% of Millennials got four or more questions right, compared with 38% of Gen X, and 51% of Baby Boomers.

• Those with lower household incomes were less financially literate. Among those in households earning less than $35,000 per year, 44% failed the test and only 27% got four or more right. Canadians in the highest income bracket were the most financially literate with 52% getting four or more right and few getting one or less right.

• Among those with a financial advisor, 45% got four or more questions correct compared with 33% among those without a financial advisor.

• Respondents have a more difficult time answering questions that relate to interest and choosing which financial strategy is better in certain circumstances. Many also underestimate what the cost of housing will have on their monthly budgets.

Slide4
Slide3
Slide5

The Upshot

Our financial literacy test reveals that a substantial proportion of Canadians lack a basic understanding of simple financial concepts. Just over two in three respondents we surveyed could correctly answer a majority of the questions we asked and 15% answered one or less correctly.

Noteworthy are the generational and socio-economic differences our study found. Younger Canadians, those earning less, and those without a financial advisor are less knowledge about financial matters.

Financially literacy test questions and percent of respondents selecting them.

1. Suppose you had $100 in a savings account and the interest rate was 2% per year. After 5 years, would you have: $102, more than $102, less than $102?
$102 – 7%
More than $102 [correct answer] – 83%
Less than $102 – 4%
Not sure – 7%

2. Imagine that you put $10,000 into a savings account that paid interest of 1% a year. Inflation was 2% per year. After 1 year, would you be better off, worse off, or no better or worse off?
Better off – 15%
Worse off [correct answer] – 51%
No better or worse off – 16%
Not sure – 18%

3. Let’s imagine someone has a $100,000 mortgage on their home and the mortgage interest rate is 3.0%. They come into a windfall of $10,000. Would they be better to invest that $10,000 in a bond that pays them 5%/2% (split sample) or put the $10,000 towards reducing their mortgage?

(split sample with 5%)
Bond that pays 5% [correct answer] – 37%
$10,000 towards reducing their mortgage – 42%
Not sure – 21%

(split sample with 2%)
Bond that pays 2% – 13%
$10,000 towards reducing their mortgage [correct answer] – 66%
Not sure – 22%

4. For the average household, what percentage of a household’s monthly income should ideally be spent on housing?
5% – 5%
25% – 52%
40% [correct answer] – 28%
70% – 2%
Not sure – 13%

5. How big should a household’s emergency fund ideally be?
1 week’s income – 3%
1 month’s income – 17%
6 months’ income [correct answer] – 58%
1 year’s income – 13%
Not sure – 10%

Methodology

The survey, commissioned by the Canadian Bankers Association, was conducted online with 1,978 Canadians aged 18 to 70 from April 10 to 21, 2015.A random sample of panelists was invited to complete the survey from a large representative panel of over 500,000 Canadians, recruited and managed by Research Now, one of the world’s leading provider of online research samples.

The Marketing Research and Intelligence Association policy limits statements about margins of sampling error for most online surveys. The margin of error for a comparable probability-based random sample of the same size is +/- 2.2%, 19 times out of 20. The data were weighted according to census data to ensure that the sample matched Canada’s population according to age, gender, educational attainment, and region. Totals may not add up to 100 due to rounding.

Abacus Data Inc.

We offer global research capacity with a strong focus on customer service, attention to detail and value added insight. Our team combines the experience of our Chairman Bruce Anderson, one of Canada’s leading research executives for two decades, with the energy, creativity and research expertise of CEO David Coletto, PhD.

Canadian Politics: Broad Support for New Government

PdfExport

1 in 2 say they Would Vote Liberal Tomorrow

In our latest nationwide poll, fully 49% say that they would vote Liberal if there was an election today, signalling that the early choices made by the Trudeau government have been generally well received by voters. Conservative support today stands at 24% and the NDP level of support is 16%.

Clearly “horse race” numbers have much less importance this far outside an election period, however they do provide benchmarks against which to compare public assessments of the incumbents and challengers on a going forward basis.

In Ontario, 54% would vote Liberal, 26% Conservative and 16% NDP.

In Quebec, the numbers for the Liberal Party are almost as strong: 47% say they would vote Liberal, 19% for each of the NDP and Conservatives. Remarkably, when the federal campaign began only a few months ago, the numbers were reversed: the NDP was at 47% and the Liberals at 20%.

In BC, the Liberals are at 42%, the Conservatives 29% and the NDP 16%.

Polling at 49% support means that some people who didn’t vote for the Liberals are happy enough with the early efforts of the Liberal government. Among those who now say they would vote Liberal are 17% of those who voted NDP on October 19%, 12% of those who voted BQ, 11% of those who voted Green, and 9% of those who voted Conservative

The Liberals have held 88% of those who voted with them on Election Day. The NDP has kept 66% of its support while the Conservatives have maintained 70%.

Slide1
Slide2
Slide3
Slide4

7 in 10 Would Consider Voting Liberal

Across the country, 70% would consider voting Liberal, underscoring that since taking office, the Liberals have increased the number of people who regard the party positively. 49% say they would consider voting NDP and 42% say they would consider voting Conservative. The NDP number is down 3 points from October, even more in Ontario and Quebec, and the Conservative number is up 2 points nationally, 3 in Ontario.

Slide5
Slide6

18-point jump in feelings that things in Canada are headed in the “right direction”

In our last survey before the election (October 15th), 34% said the country was headed in the right direction, 39% off on the wrong track. Today, the “right direction” number is up 18 points that level.

Majorities in BC, Ontario, Quebec and Atlantic Canada feel the country is headed in the right direction. Even in Alberta, where the Liberals had their weakest results, more feel the country is going in the right direction (42%) than wrong (30%).

There is remarkably little difference between men and women and even among different generations.

Politically, 56% of those who voted NDP think the country is heading in the right direction, 15% say “wrong”. Conservative Party voters are split, with 30% thinking things are headed in the right direction while 38% say things are off on the wrong track.

Slide7
Slide8

The Upshot

Since taking office, the Liberal Party has made choices and conducted itself in a way that has expanded its appeal. Obviously, these are early days in the life of a government with a four-year mandate, but so far, the weeks since the new government has taken office have produced a boost in confidence that the country is heading in the right direction.

According to Bruce Anderson “While opposition parties must challenge the government, these numbers are a reminder that much of the sparring that happens in Ottawa often stays in Ottawa, a pattern that was evident throughout the years of the Harper government as well.

The fact that just 21% across the country are unhappy with the direction of things, underscores the reality that voters are mostly not partisans. The roughly 60% who didn’t vote Liberal aren’t licking their wounds and spoiling for the next fight. History tells us (and these data reinforce) that they will be attentive to important arguments and criticisms of the government, but will not assume that every criticism is well founded or important.

Since there has neither been a Throne Speech nor a budget from the new government yet, it’s self evident that some of the harder choices a government has to make have not yet been made, and public reaction not yet tested.

That having been said, Mr. Trudeau has appointed a cabinet, and made a number of decisions since taking office, and these numbers show his choices and tone have resonated well with many Canadians.”

Methodology

Our survey was conducted online with 1,500 Canadians aged 18 and over from November 23 to November 25, 2015. A random sample of panelists was invited to complete the survey from a large representative panel of over 500,000 Canadians, recruited and managed by Research Now, one of the world’s leading provider of online research samples.

The Marketing Research and Intelligence Association policy limits statements about margins of sampling error for most online surveys. The margin of error for a comparable probability-based random sample of the same size is +/- 2.6%, 19 times out of 20. The data were weighted according to census data to ensure that the sample matched Canada’s population according to age, gender, educational attainment, and region. Totals may not add up to 100 due to rounding.

Abacus Data Inc.

We offer global research capacity with a strong focus on customer service, attention to detail and value added insight. Our team combines the experience of our Chairman Bruce Anderson, one of Canada’s leading research executives for two decades, with the energy, creativity and research expertise of CEO David Coletto, PhD.

Our Values & Our Money

Research Objectives

In June, Canada launched its first-ever National Strategy for Financial Literacy and the country is now examining how best to increase the financial knowledge and skills of Canadians.

On behalf of the Canadian Bankers Association, Abacus conducted an extensive nationwide study of Canadians’ financial aspirations and their know how when it comes to managing money in ways that will help them achieve their goals. This research is designed to explore the values, financial goals and priorities of Canadians of different ages and to get a better understanding of what financial issues they would like to know more about and where they go to look for information. This study is being widely released so that all financial literacy organizations can use the knowledge to properly evaluate their programs and ensure that they are reaching all generations in this digital age.

This is the second of a series of releases to highlight key elements of this fascinating study.

Where Money Fits in our Values System

In discussions of politics, it’s common to suggest that economic matters dominate the concerns of citizens, and that may be somewhat accurate in terms of what they want political leaders to focus on. However, when we probed for the level of importance that people attach to different values, we found that financial success is not quite at the top of the list for most people.

Instead, enjoying good health, being close with family, being kind and thoughtful, and being well respected form the top of the list of what’s important to people.

Another thing that is interesting in the results is that more people attach importance to the “simpler things in life” than do “the finer things in life”.

In short, the results suggest that the Canadian dream, if there is a common one, is not first and foremost a dream of financial gain, but about enjoying good relations with others and earning respect for the way you live your life.

Slide1
Slide2

Are We Meeting our Goals?

We asked people, for each of the 23 items tested, how well they thought they were doing at meeting their goals. The results paint a country where most people feel they are meeting most of their goals. On the single most important value – maintaining good health – 27% said they were falling short of where they wanted to be. On being kind and thoughtful, and being close with family, less than 15% were unhappy with the way things were going.

The areas where the largest number of people said they were falling short of meeting their goals included seeing the world (50%), and taking the vacations they wanted (42%).

In terms of their financial success, 9% said they were exceeding their goals, 47% said they were meeting their goals, and 44% said they were falling short of meeting their goals.

Slide3
Slide4

Are Generations Different?

One of the things we wanted to explore in this study was the question of how values differ by generation. When it comes to the list of 10 things that were most important of the list of 23 values tested, our analysis revealed that:

• Every generation attaches the highest importance to health, but the importance is stronger among older people.

• Older people attach greater importance to “being kind and thoughtful” enjoying “the simpler things” living “in a good neighborhood”, “giving to those who have less”, “keeping up to date with the world” and “making a positive contribution to the community”.

• Younger generations attach greater importance to being financially successful, “achieving career success”, “seeing the world”, “finer things in life”, and “leaving a mark in your field”.

Slide1
Slide2

When it comes to assessing how well people are achieving their goals, there are some differences across generations.

• Millennials who prioritize being financial successful are more likely to say they are falling short of their goals (50%) than Gen Xers (45%) or Boomers (33%).

• Those from younger generations who prioritize seeing the world are more likely to say they are falling short of their goals.

Slide3

• Gen Xers are more likely to say they are falling short of their goals when it comes to taking vacations they want.

Slide4

• Millennials are also less likely to say they are meeting their goals when it comes to owning a nice home, leaving a mark in their field, and achieving career success – all functions of a life cycle effect.

Slide5

Methodology

The survey, commissioned by the Canadian Bankers Association, was conducted online with 1,978 Canadians aged 18 to 70 from April 10 to 21, 2015. A random sample of panelists was invited to complete the survey from a large representative panel of over 500,000 Canadians, recruited and managed by Research Now, one of the world’s leading provider of online research samples.

The Marketing Research and Intelligence Association policy limits statements about margins of sampling error for most online surveys. The margin of error for a comparable probability-based random sample of the same size is +/- 2.8%, 19 times out of 20. The data were weighted according to census data to ensure that the sample matched Canada’s population according to age, gender, educational attainment, and region. Totals may not add up to 100 due to rounding.

Abacus Data Inc.

We offer global research capacity with a strong focus on customer service, attention to detail and value added insight. Our team combines the experience of our Chairman Bruce Anderson, one of Canada’s leading research executives for two decades, with the energy, creativity and research expertise of CEO David Coletto, PhD.

Financial Goals and Know How

Research Objectives

In June, Canada launched its first-ever National Strategy for Financial Literacy and the country is now examining how best to increase the financial knowledge and skills of Canadians.

On behalf of the Canadian Bankers Association, Abacus conducted an extensive nationwide study of Canadians’ financial aspirations and their know how when it comes to managing money in ways that will help them achieve their goals. This research is designed to explore the values, financial goals and priorities of Canadians of different ages and to get a better understanding of what financial issues they would like to know more about and where they go to look for information. This study is being widely released so that all financial literacy organizations can use the knowledge to properly evaluate their programs and ensure that they are reaching all generations in this digital age.

This is the first of a series of releases to highlight key elements of this fascinating study.

How We Define Our Financial Goals

For most people, learning about how to manage their finances well is a means towards an end, not an end unto itself. And the aspiration that most people have in mind is the absence of worry. When given a choice of four different aspirations, the most important, easily, was “being unworried about finances”.

After that, equal numbers cite “being a smart manager of finances” and “becoming financially successful”. Far fewer embrace the goal of “understanding how markets and money work”.

Slide1

This is an important backdrop when it comes to designing initiatives aimed at promoting financial literacy and know how. People want to achieve a sense of confidence rather than a particular level of detailed expertise.

We then asked people how well they thought they were doing at achieving each of these financial aspirations. The results show that very few people think they are failing (assigning themselves an “F” grade) on any of the aspirations, but few give themselves top marks either.

On the top ranked aspiration “being unworried about finances”, 40% gave themselves an A or B, while the plurality gave themselves a C, and 16% a D. When it comes to being “a smart manager of finances” the majority (52%) gave themselves an A or B, only 16% gave themselves a D or F. This highlights the fact that while improving financial literacy/know how is a useful initiative, the vast majority do not think they are starting from a very low level of knowledge.

Slide2

What We Want to Know More About

We asked respondents to tell us which of a list of financial topics they felt like they needed to learn more about, as this information can help in developing priority content for financial literacy/know how initiatives. The results reveal:

• The large majority of people say they are knowledgeable enough about chequing accounts, savings accounts and credit cards. Roughly 20% say they could stand to know more about these common financial products.

• Between 40% and 50% indicate they could usefully know more about a wide range of financial topics from interest rates, lines of credit, mortgages, RRSPs, TFSAs and many others.

• Finally, when it comes to mutual funds, bonds, stocks, and stock markets, upwards of two thirds indicate that they have a need to know more.

Slide3
Slide4

Are Generations Different?

An analysis of responses by generations shows that there are substantial differences in levels of confidence and knowledge about these topics. Millennials and Gen X respondents are far more likely than Baby Boomers to say they could stand to know more about the most common products like savings accounts as well as loans and other savings products such as TFSAs or RRSPs.

Slide5
Slide6
Slide7
Slide8

The results show that most people feel that they have some knowledge about financial management but that there are areas where they could stand to learn more, in order to achieve their financial aspirations. The level of know how varies significantly by generation, with younger people indicating that there are more gaps in their knowledge than they would like.

It’s also clear in the data that there is a segment of society (roughly 20%) which feels that it lacks sufficient know how about even the most common financial matters such savings and chequing accounts.

Methodology

The survey, commissioned by the Canadian Bankers Association, was conducted online with 1,978 Canadians aged 18 to 70 from April 10 to 21, 2015.A random sample of panelists was invited to complete the survey from a large representative panel of over 500,000 Canadians, recruited and managed by Research Now, one of the world’s leading provider of online research samples.

The Marketing Research and Intelligence Association policy limits statements about margins of sampling error for most online surveys. The margin of error for a comparable probability-based random sample of the same size is +/- 2.2%, 19 times out of 20. The data were weighted according to census data to ensure that the sample matched Canada’s population according to age, gender, educational attainment, and region. Totals may not add up to 100 due to rounding.

Abacus Data Inc.

We offer global research capacity with a strong focus on customer service, attention to detail and value added insight. Our team combines the experience of our Chairman Bruce Anderson, one of Canada’s leading research executives for two decades, with the energy, creativity and research expertise of CEO David Coletto, PhD.