The Case for Change vs. The Case for No Change

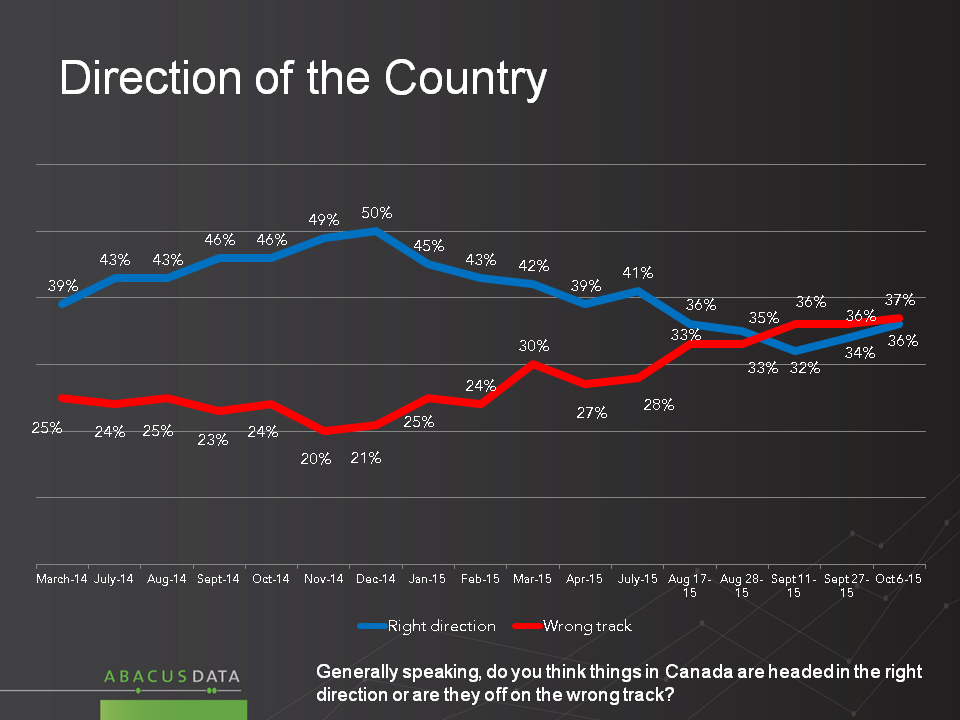
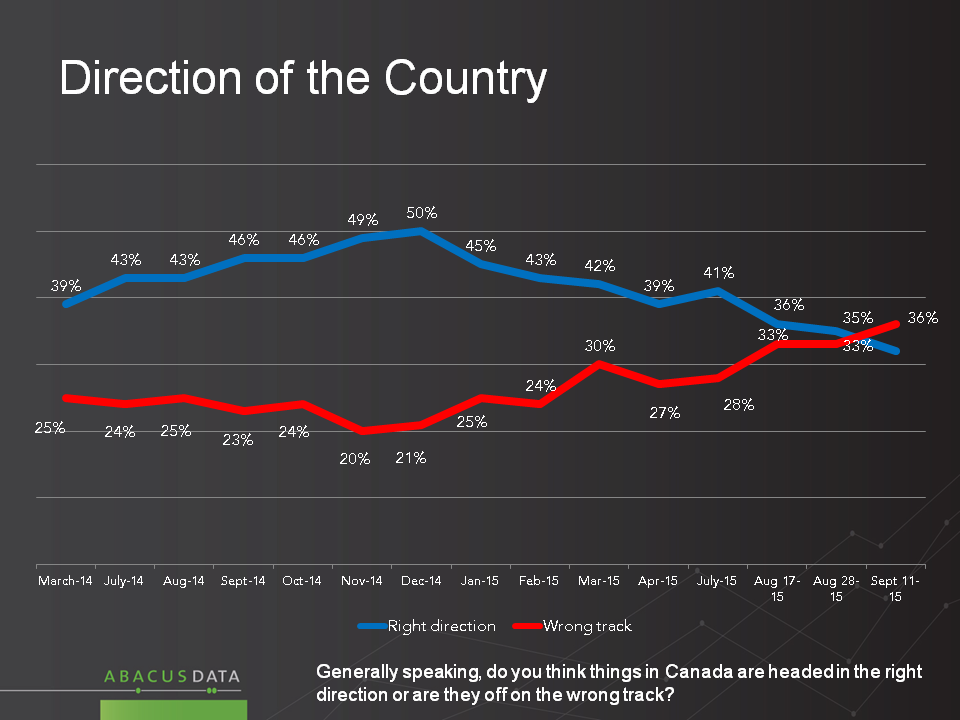
Canadians split on whether the country is on the right track

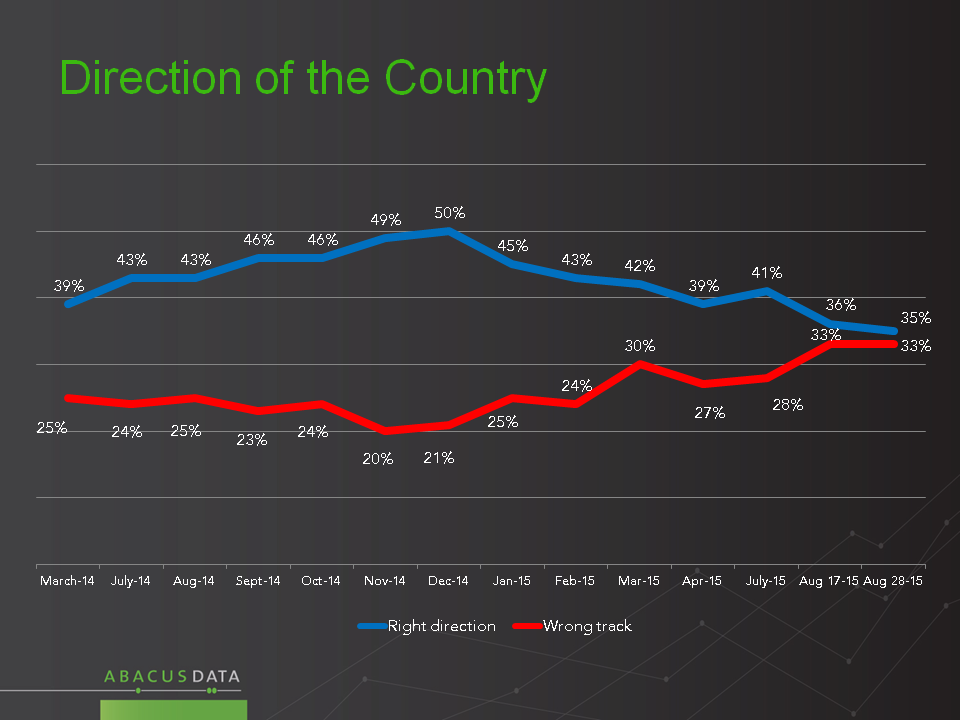
37% of Canadians say the country is on the wrong track while 36% feel the opposite. Since the beginning of the campaign, the country has been remarkably split, an indicator of just why this election is so hard to predict.

Slide2

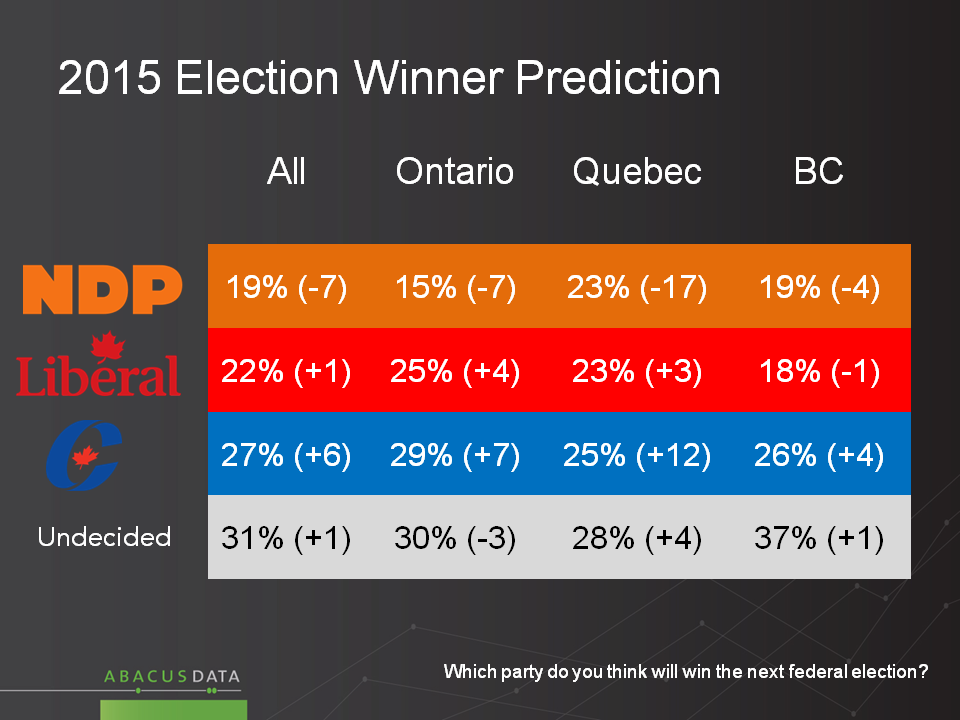
Among those voters who think the country is headed in the right direction, 58% support the Conservatives, 22% will vote Liberal, and 14% NDP.

Among those who think the country is off on the wrong track, the Liberals have a 9-point advantage over the NDP, 43% to 34%. 12% of these “wrong track” voters are planning to vote Conservative.

Slide3

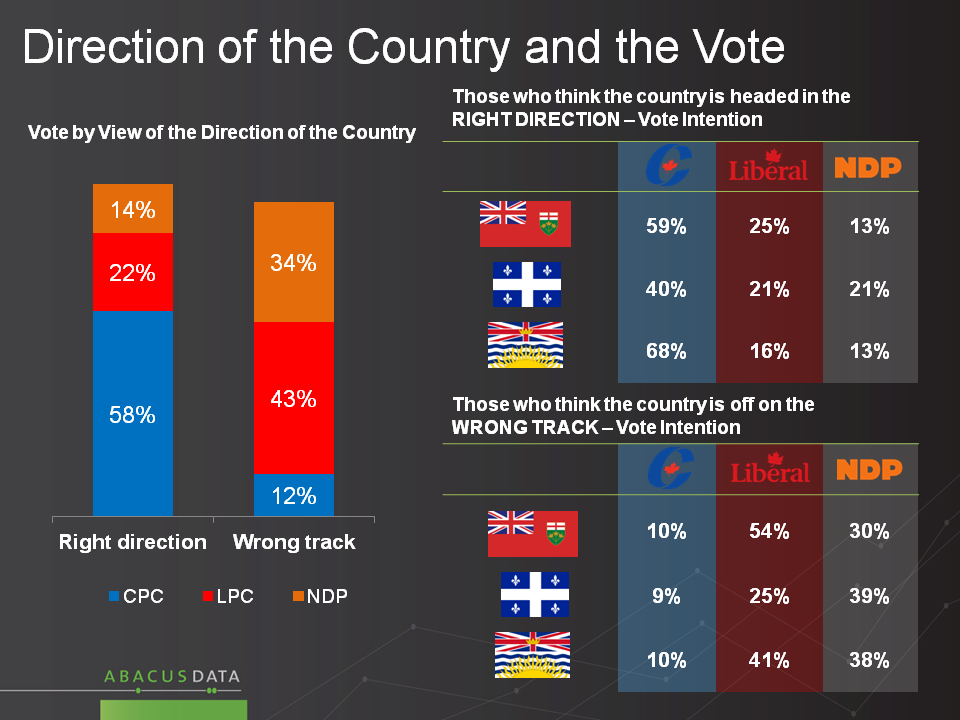
This underscores two things: the Conservatives are challenged by the fact that not everyone who thinks things are going well are inclined to vote Conservative; the Liberals are challenged by the fact that they are dividing the wrong track vote with the NDP.

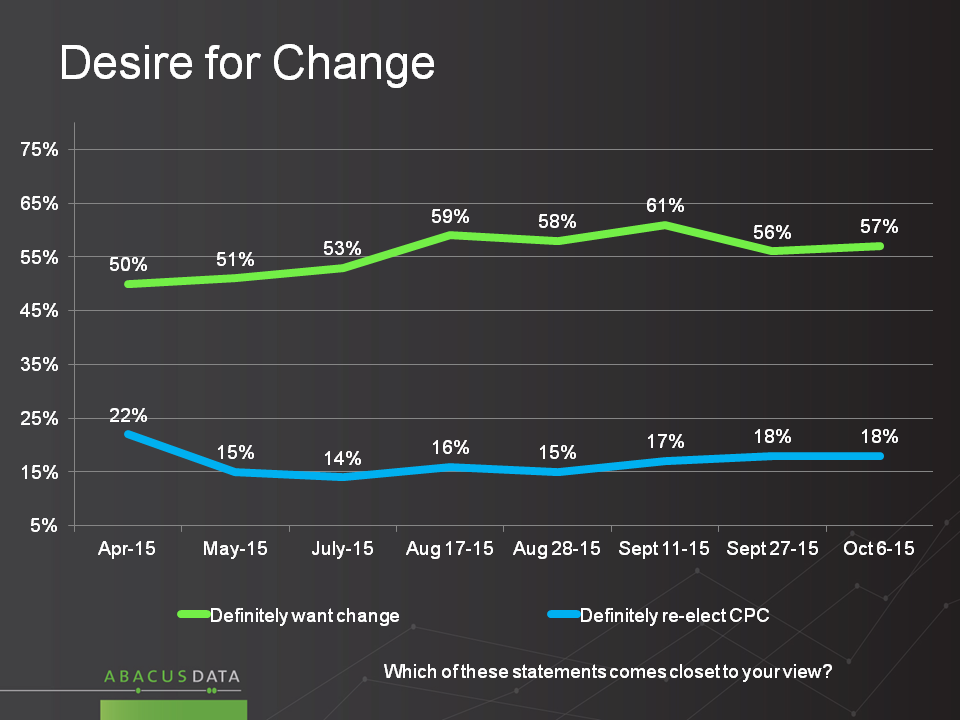
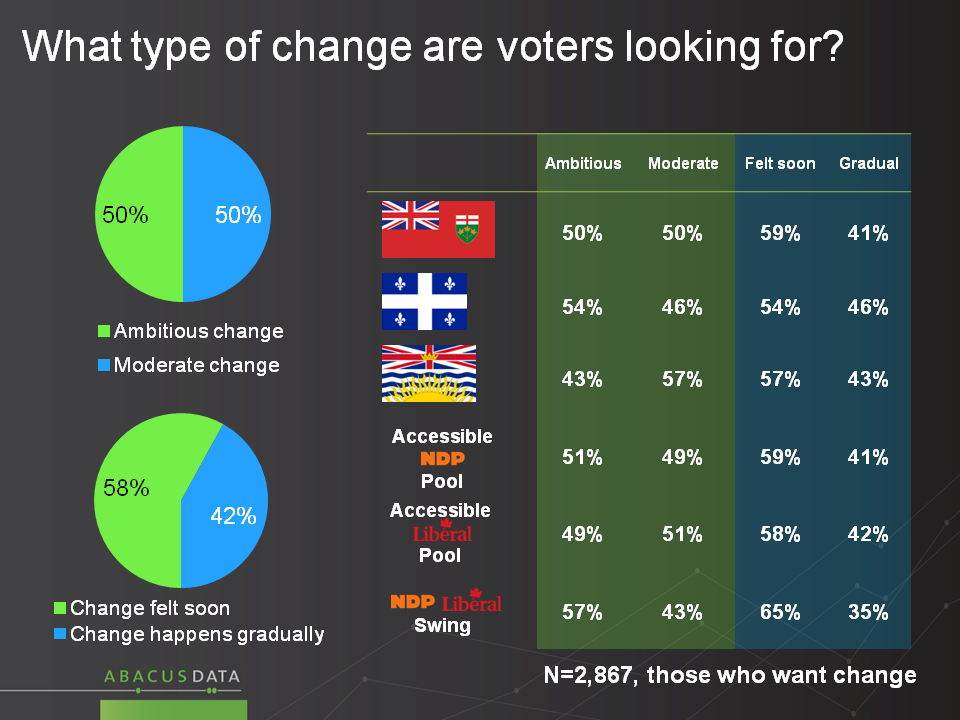
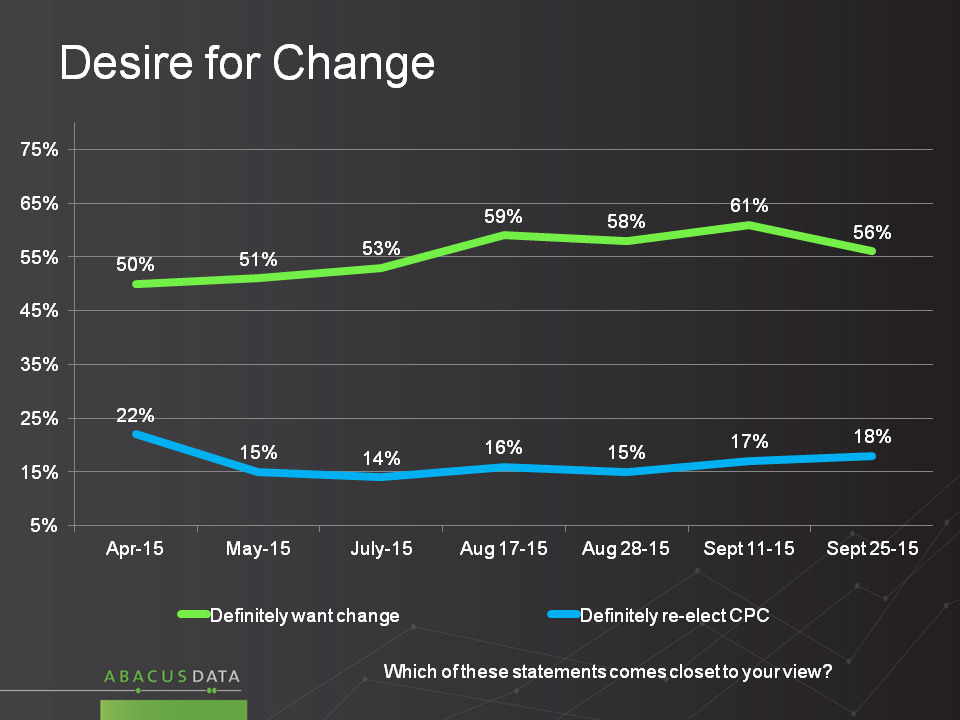
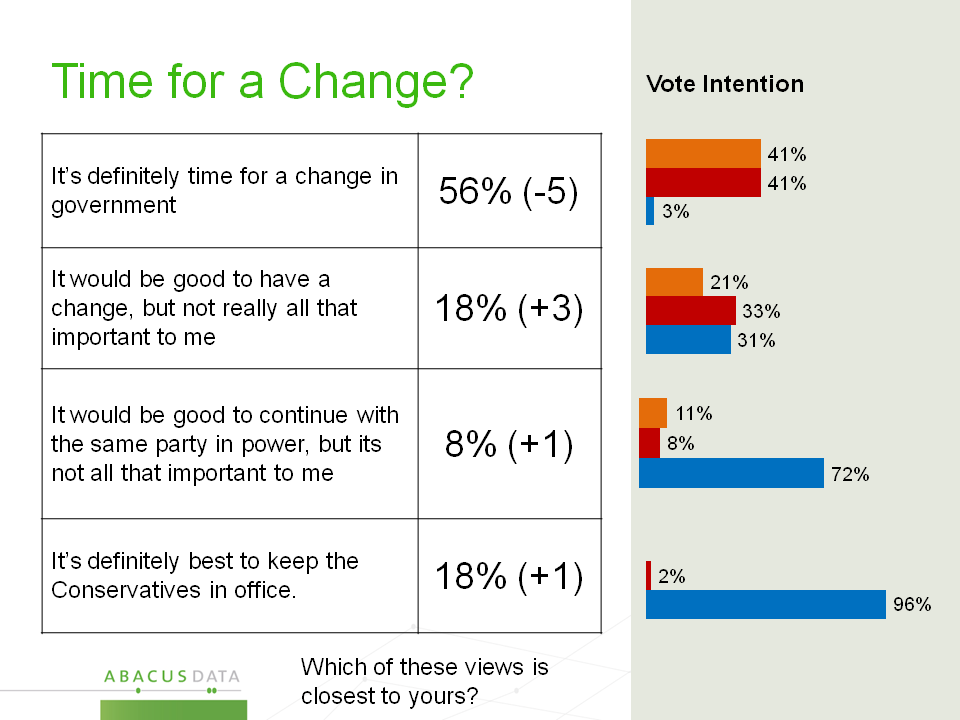
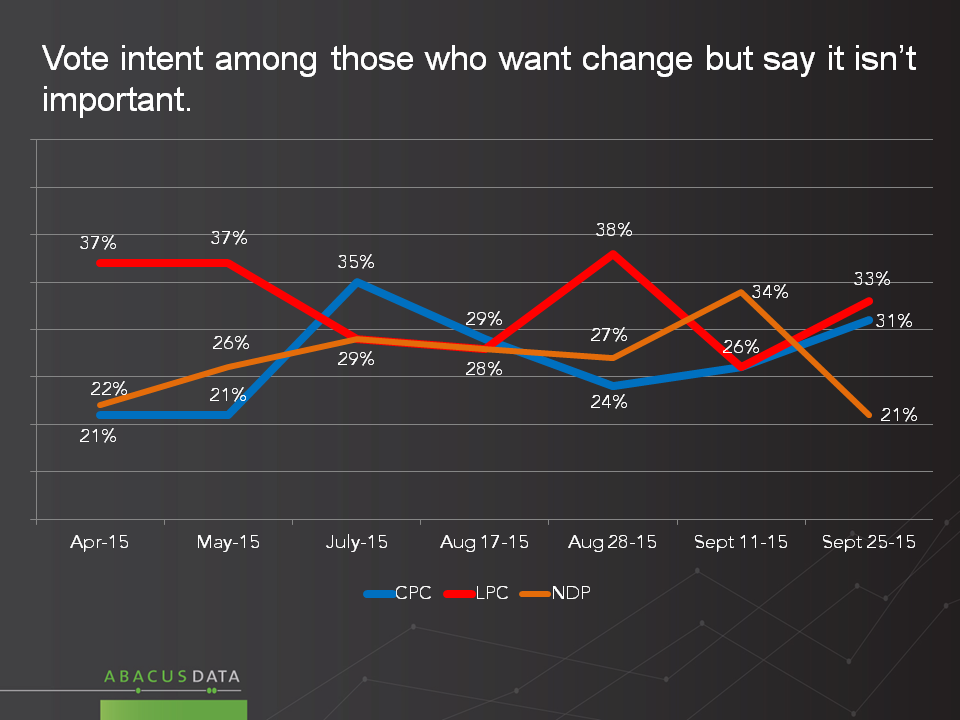
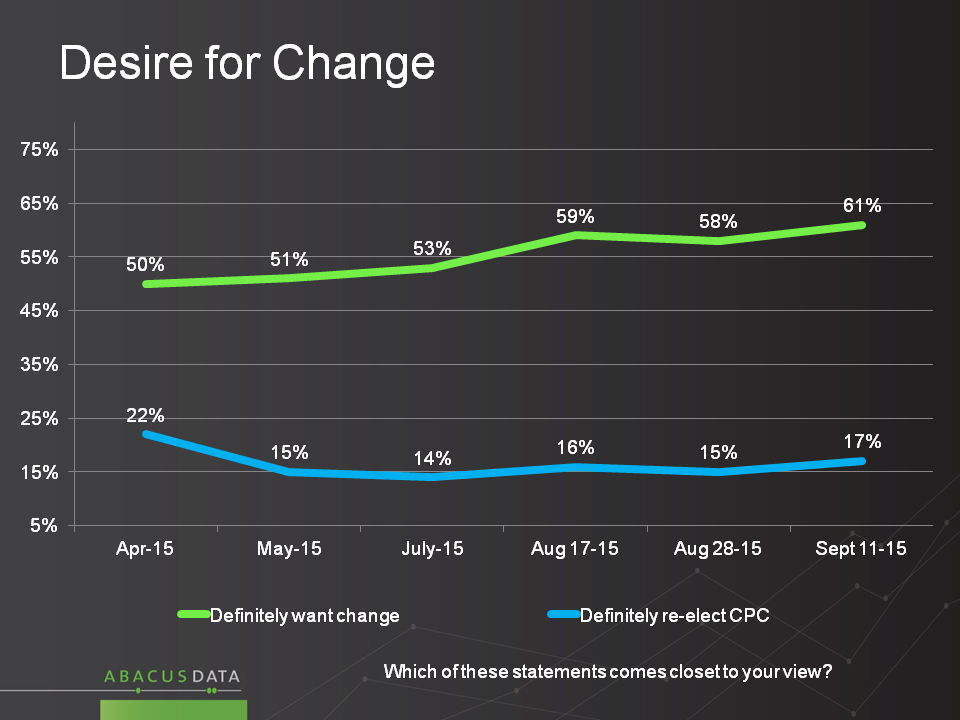
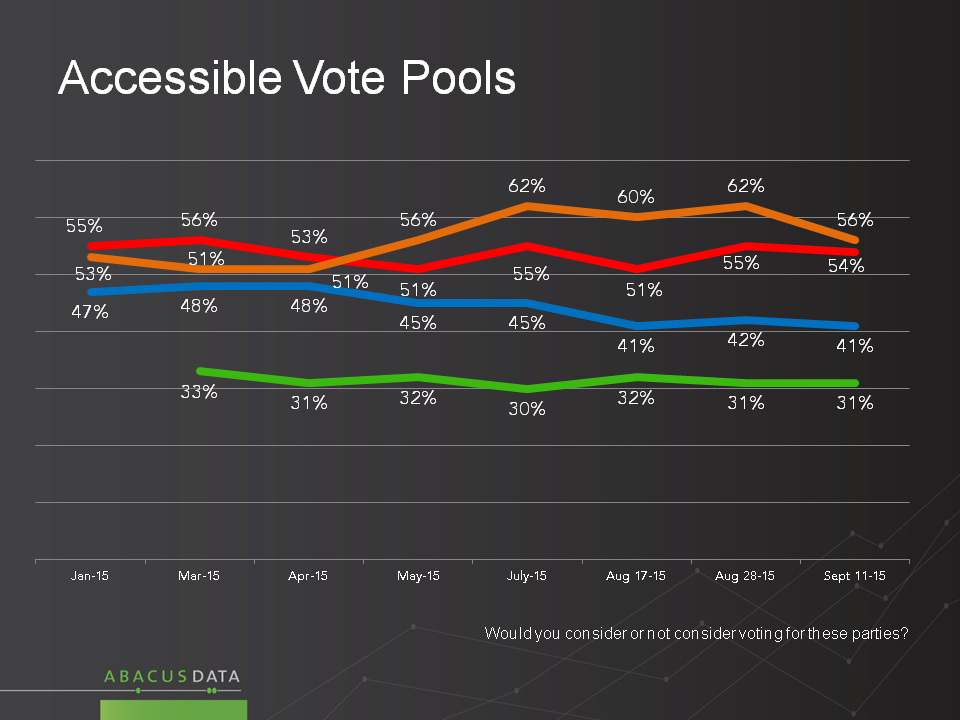
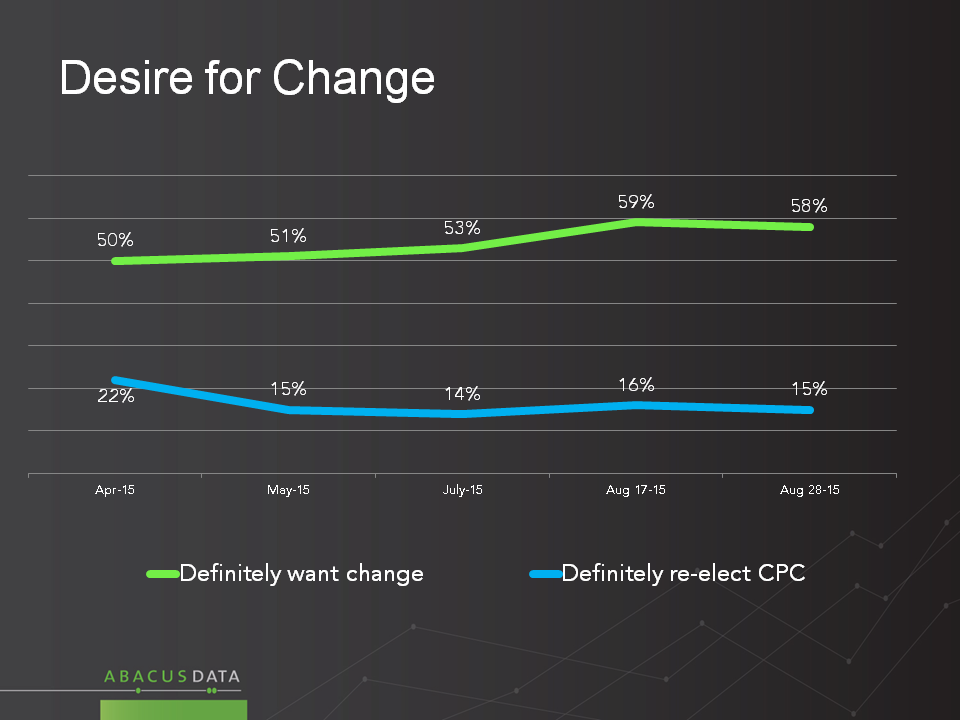
A total of 73% Want Change, 57% feel strongly that way.

There has been very little movement in the number of people who are strongly in favour of replacing the Conservatives, which stands at 57%, nor has there been any real growth in the number of people who are sure they want the Conservatives re-elected, which stands at 18%

Slide5

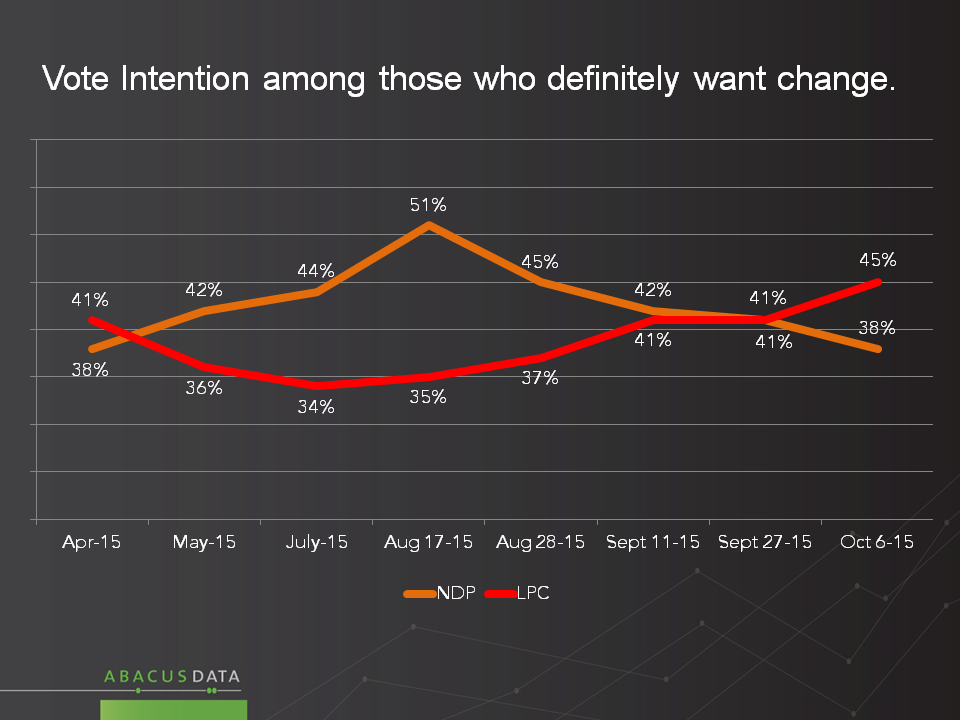
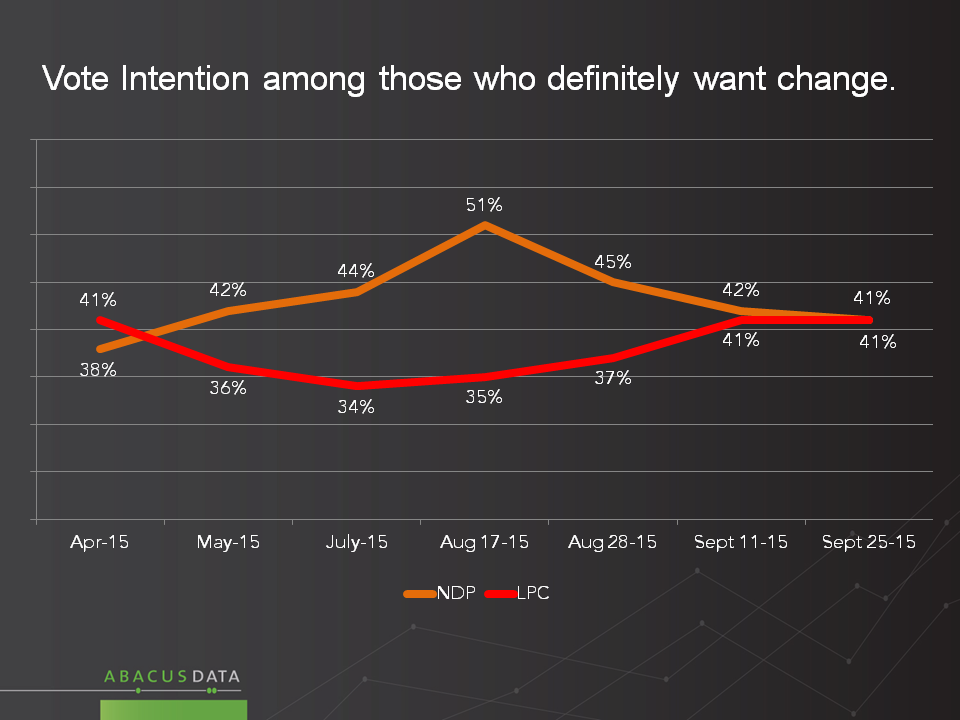
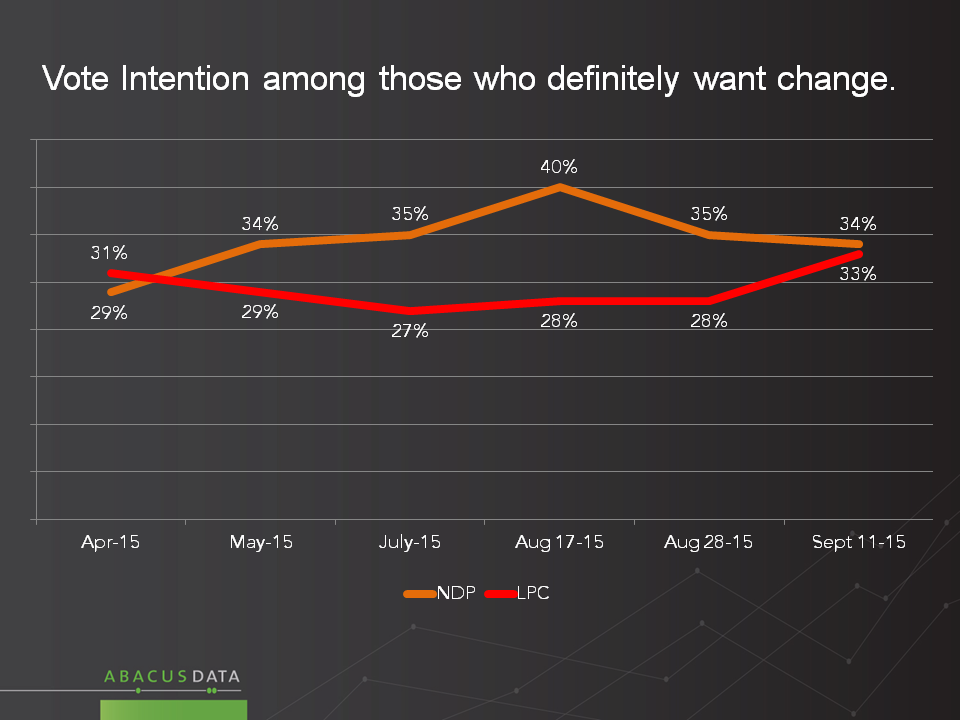
Among the voters who most want change, the Liberals were 16 points behind the NDP when the campaign began, and are 7 points ahead of the NDP now. This is perhaps the most important movement of any that we’ve witnessed in this campaign so far.

Slide6

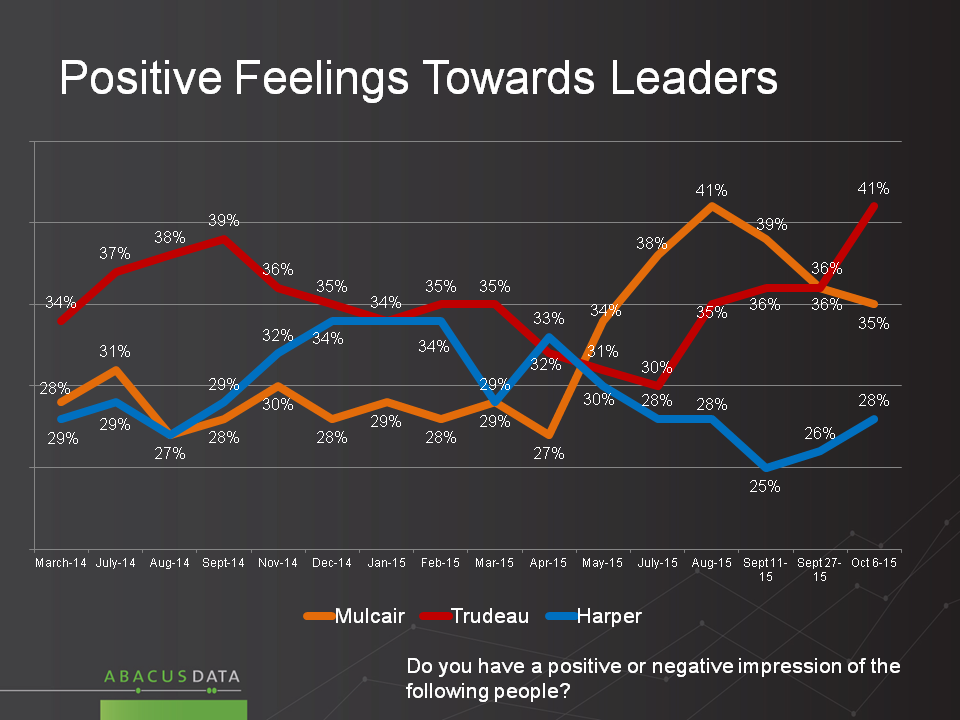
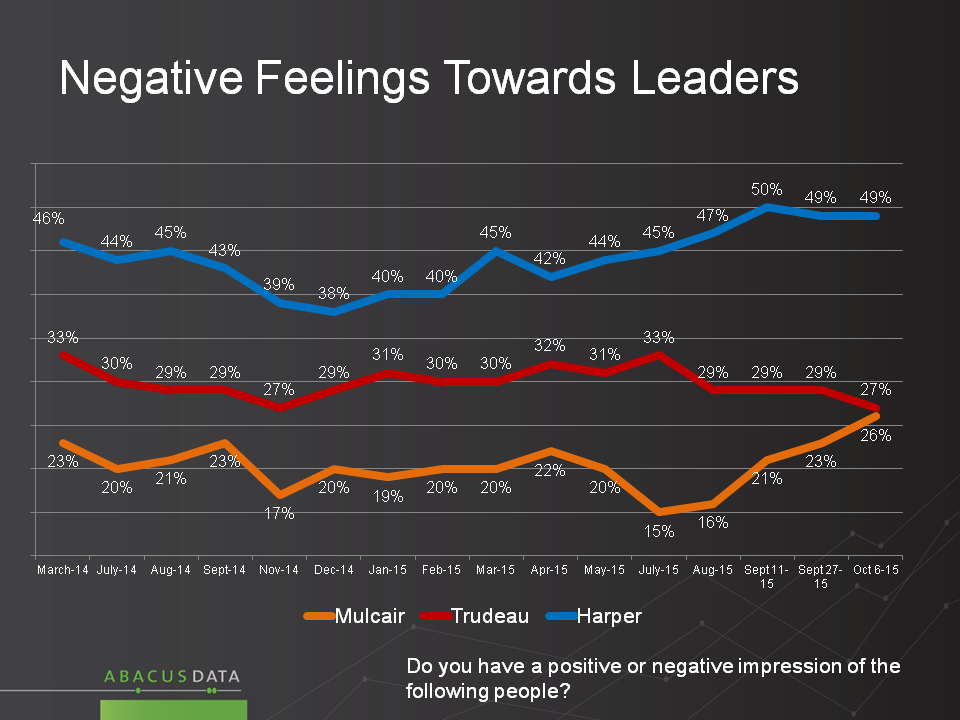
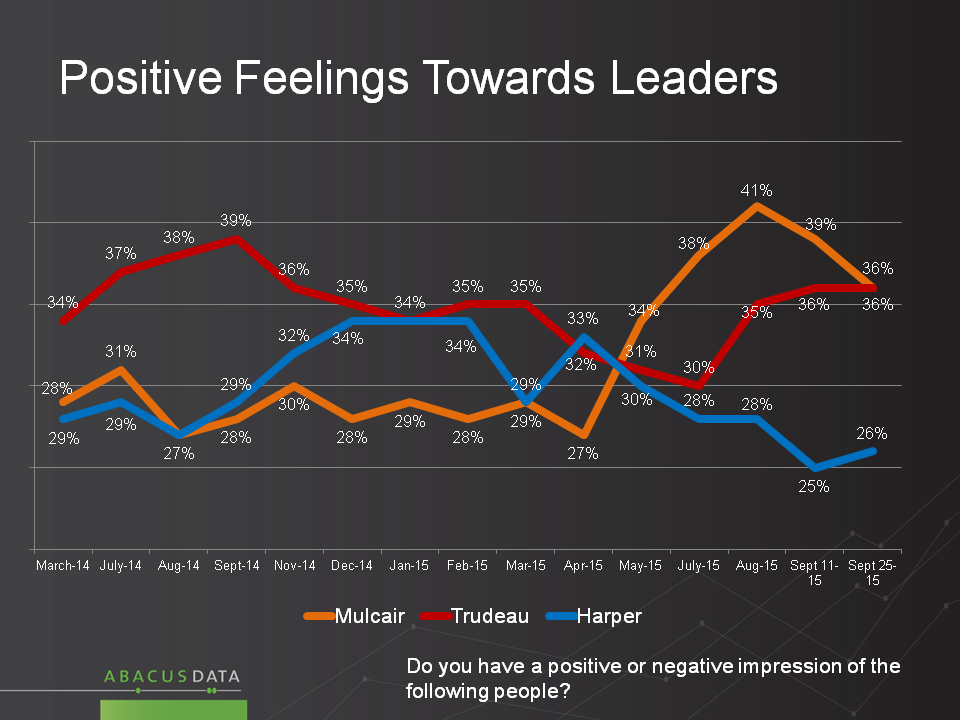
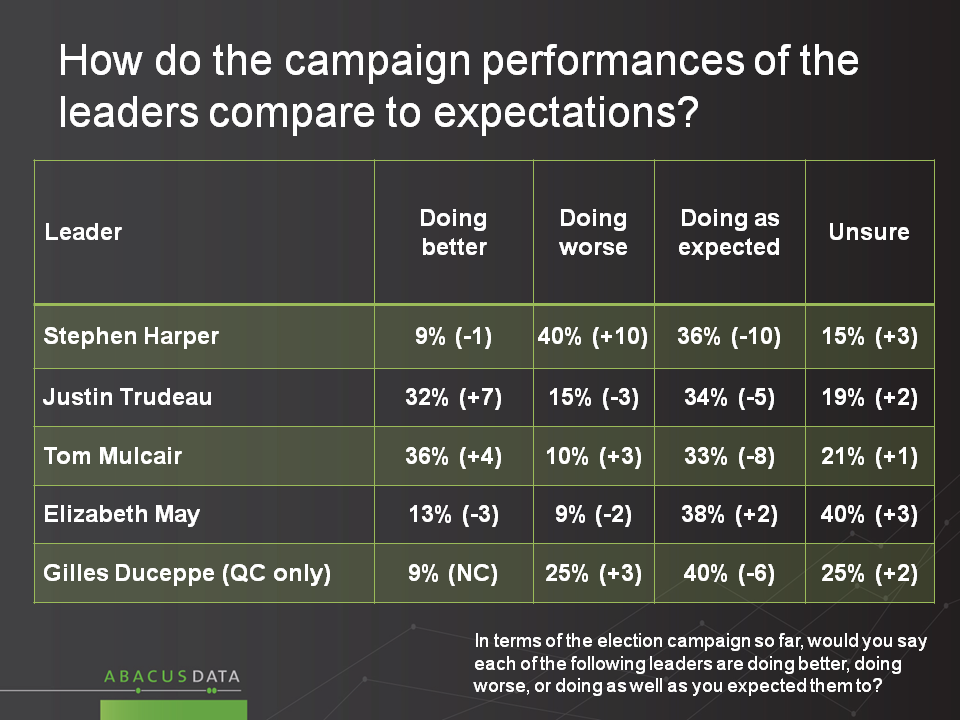
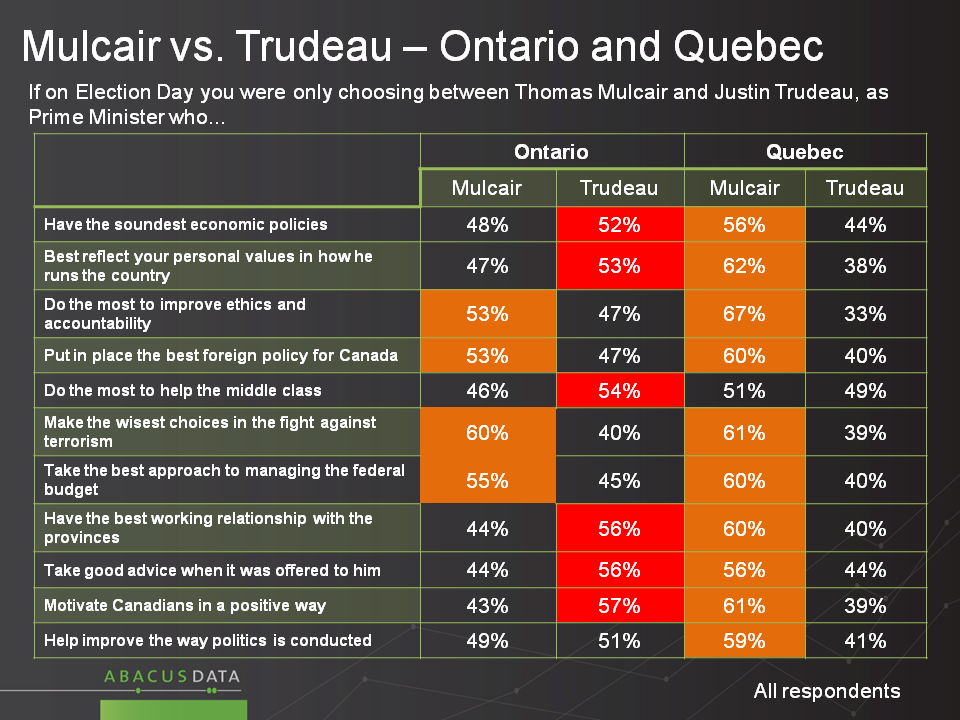
The Leaders’ Performance

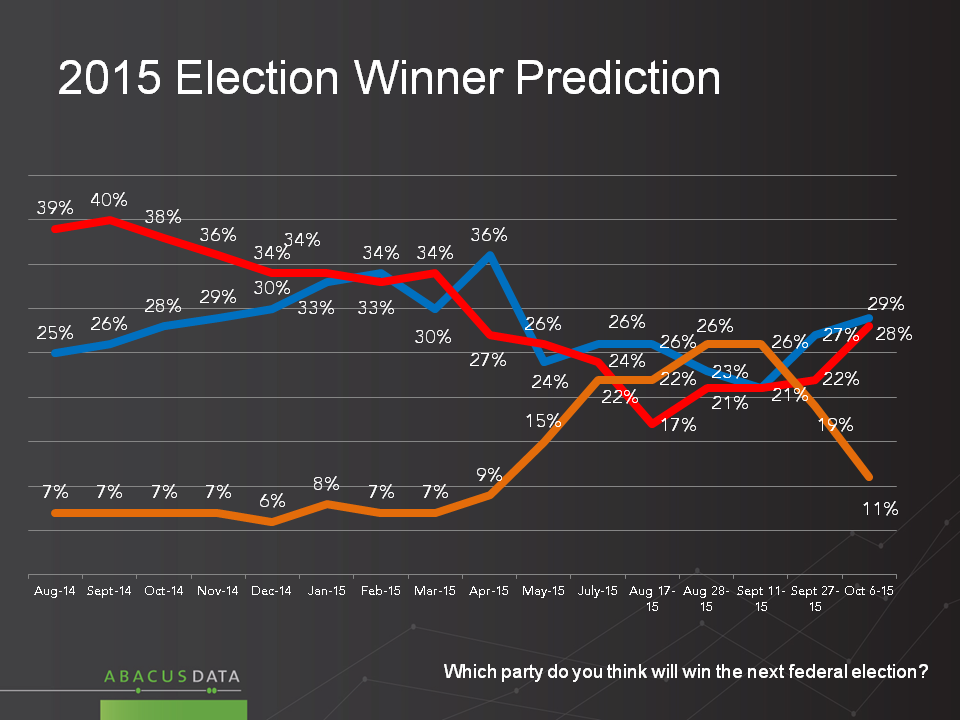
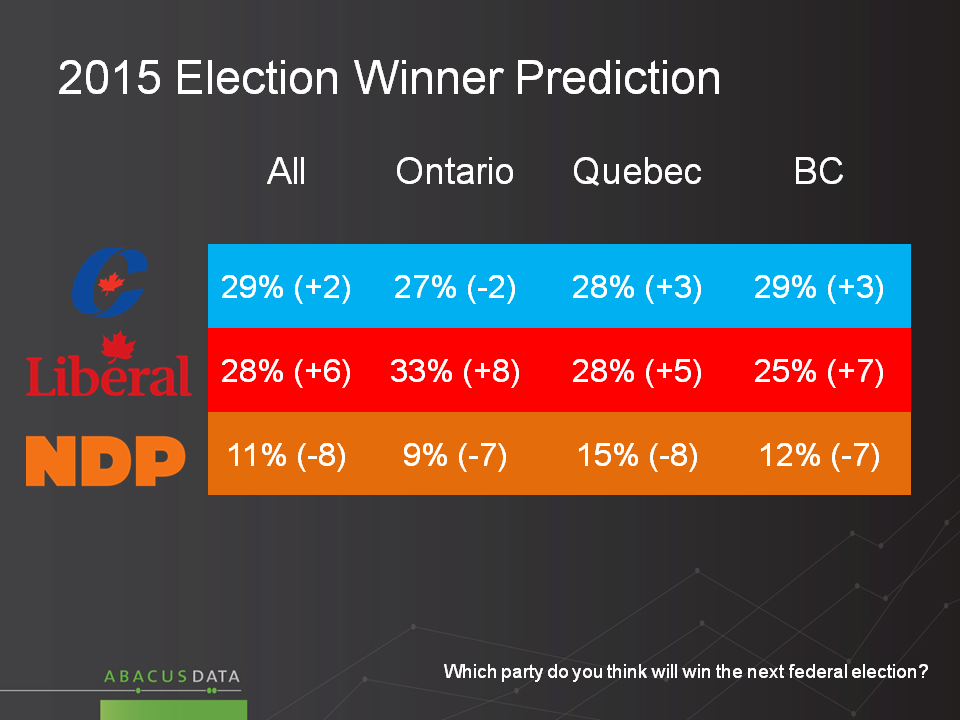
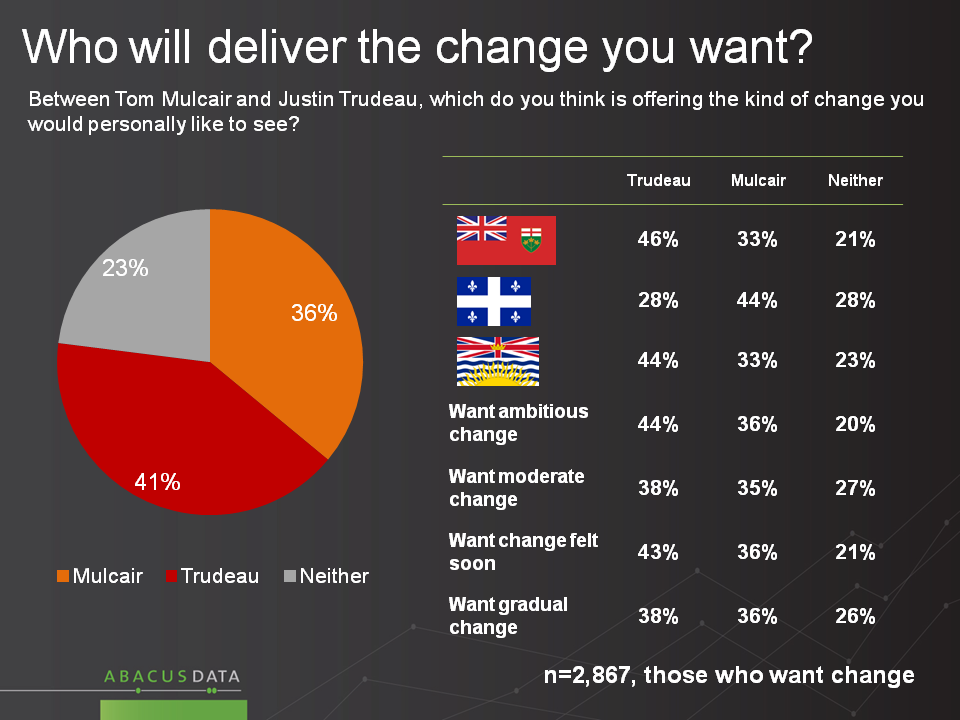
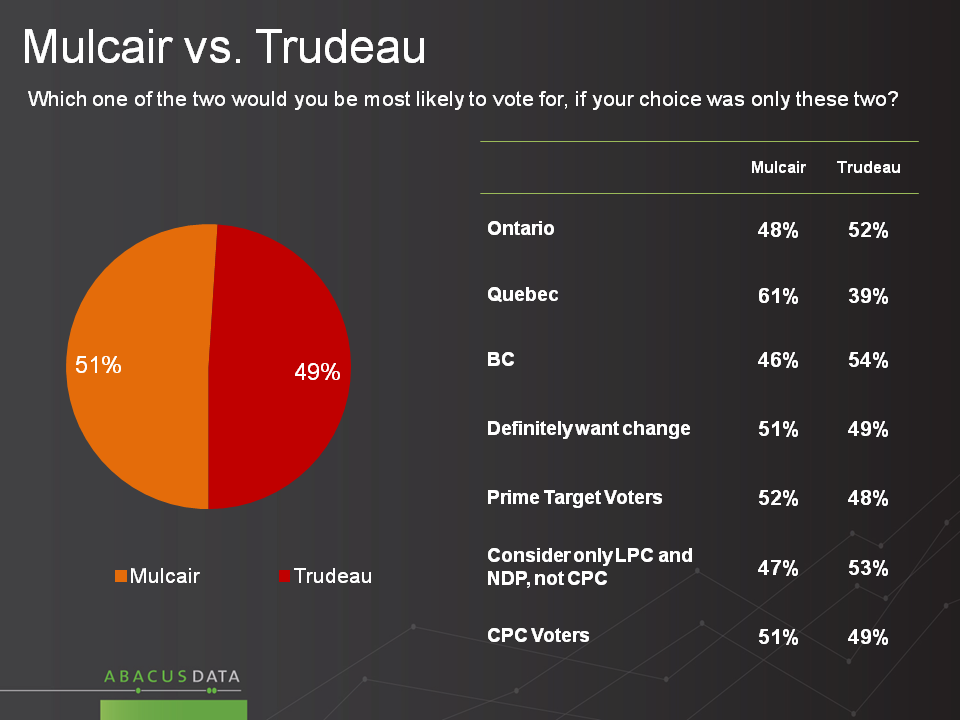
In the biggest seat markets, Ontario, Quebec and BC, a plurality now says that Liberal leader Justin Trudeau has been performing best in the campaign. Across the country, Trudeau was the pick of 16% when the campaign first got underway, and is now picked by 28%.

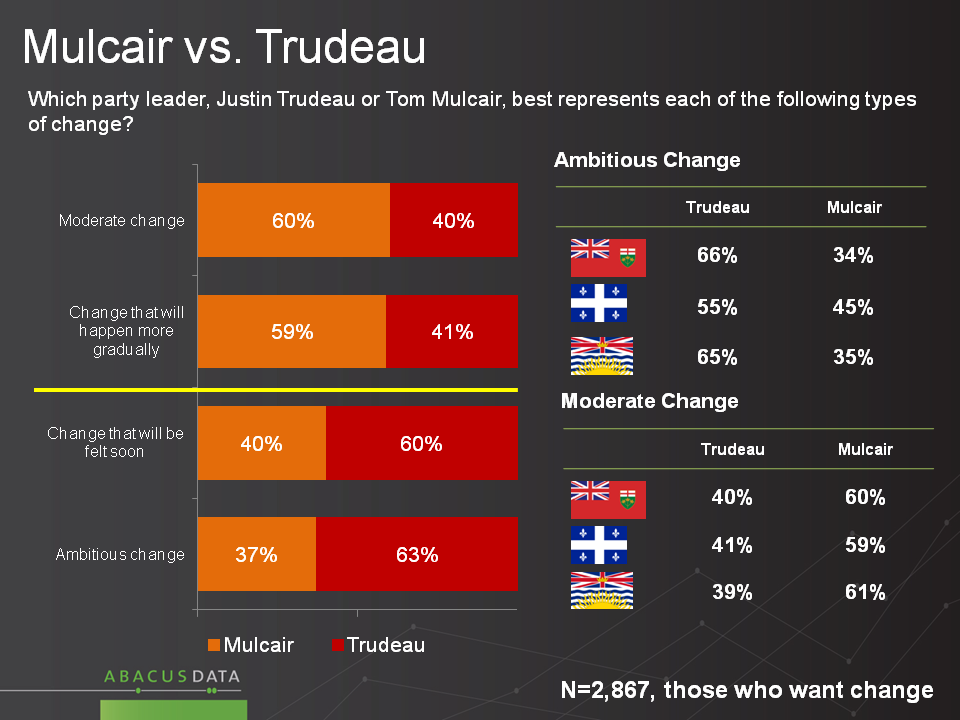
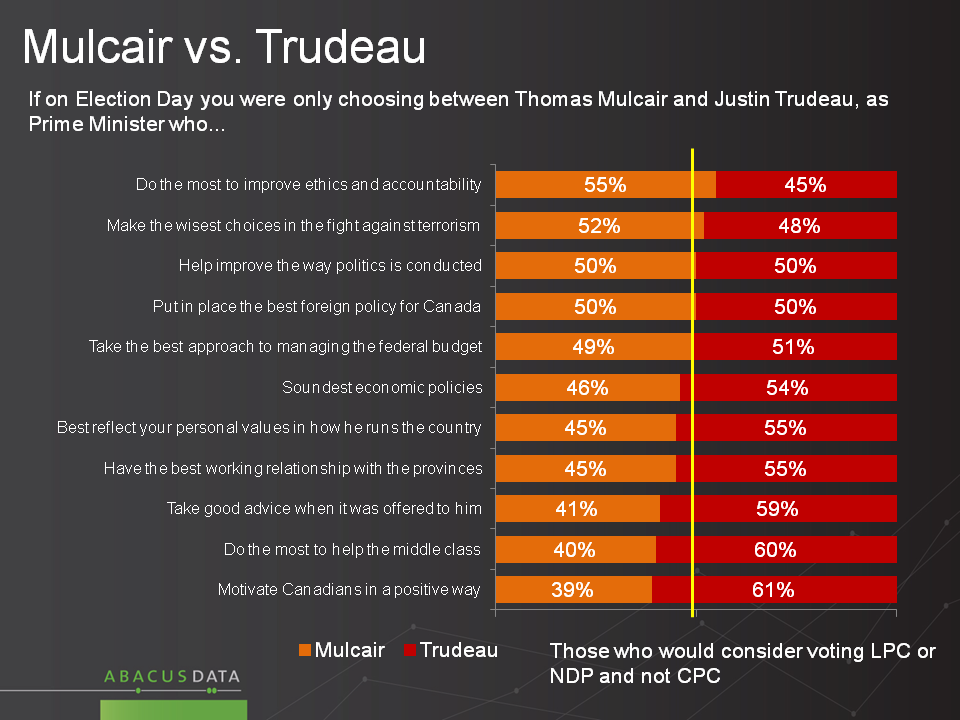
Among those voters who most want change, and among Liberal-NDP swing voters, Mr. Trudeau scores well ahead of the other leaders on this question.

Slide12

Trans Pacific Partnership

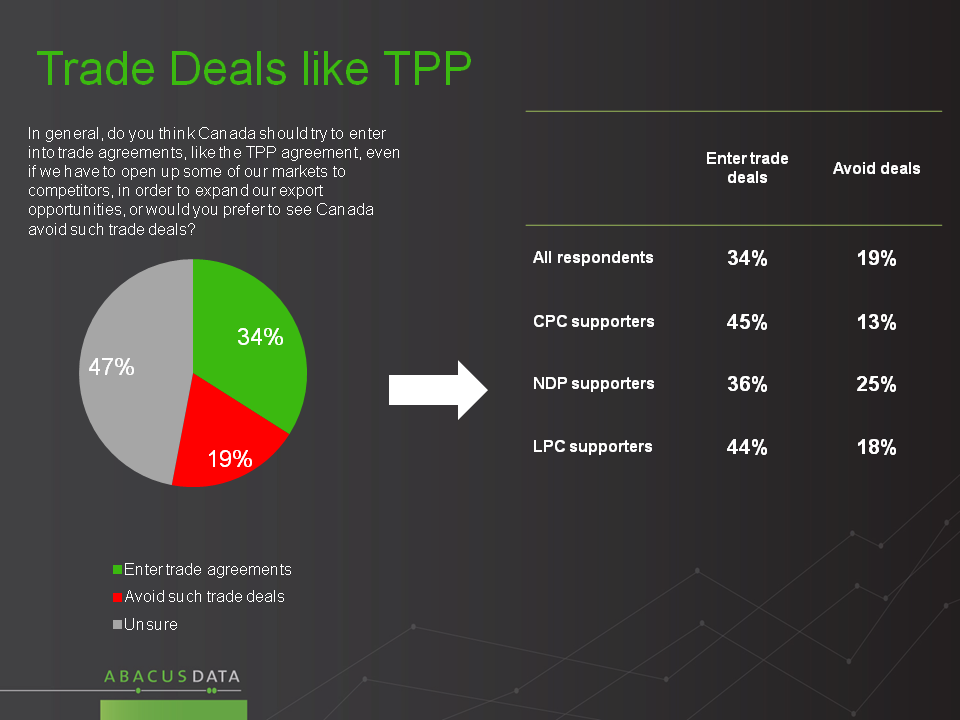
While 42% of voters don’t yet have a view on whether the TPP will be a good thing or a bad thing for Canada, of those who do, 3 have a positive view for every 1 who sees it negatively.

Worth noting is that the tendency even among NDP voters is to think it is more likely to be good (37%) for Canada, rather than bad for Canada (21%). Among Liberal-NDP swing voters, the split is 36% good/22% bad.

In BC and Quebec, two critical markets for the NDP, roughly 1 in 2 voters has a positive view of the deal, and fewer than 15% have a negative view. In Ontario, the split is 41% positive/16% negative.

Slide13

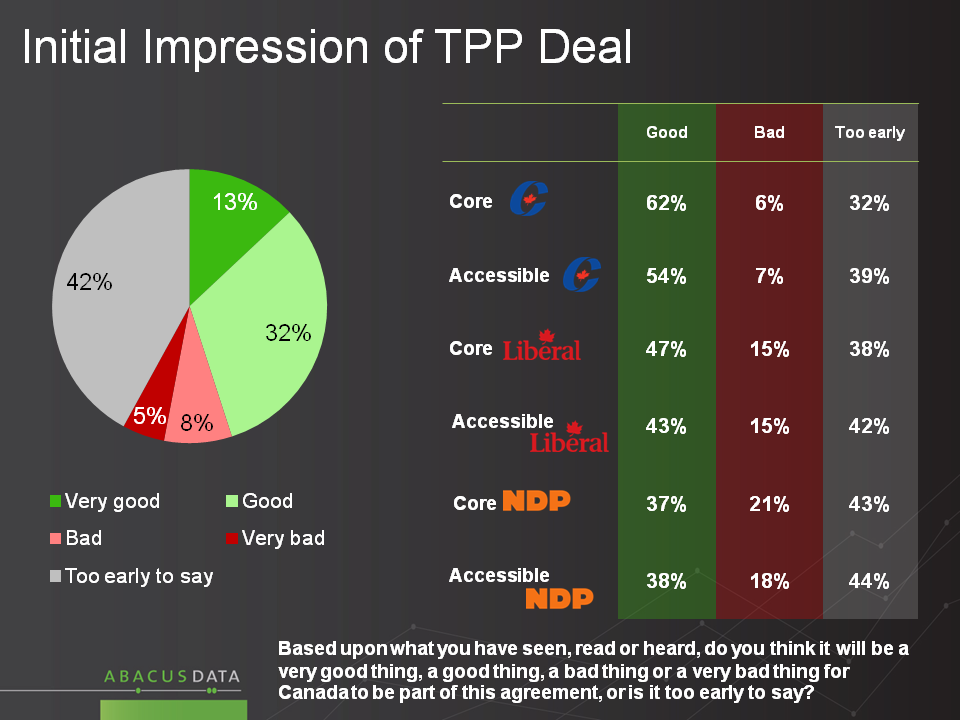
Looking at the core and accessible voter pools for each party, we find that respondents are more likely to consider TPP a good thing than a bad thing, even among those who say they will vote NDP. While resistance to the deal is higher among NDP supporters, a plurality think the deal is a good thing.

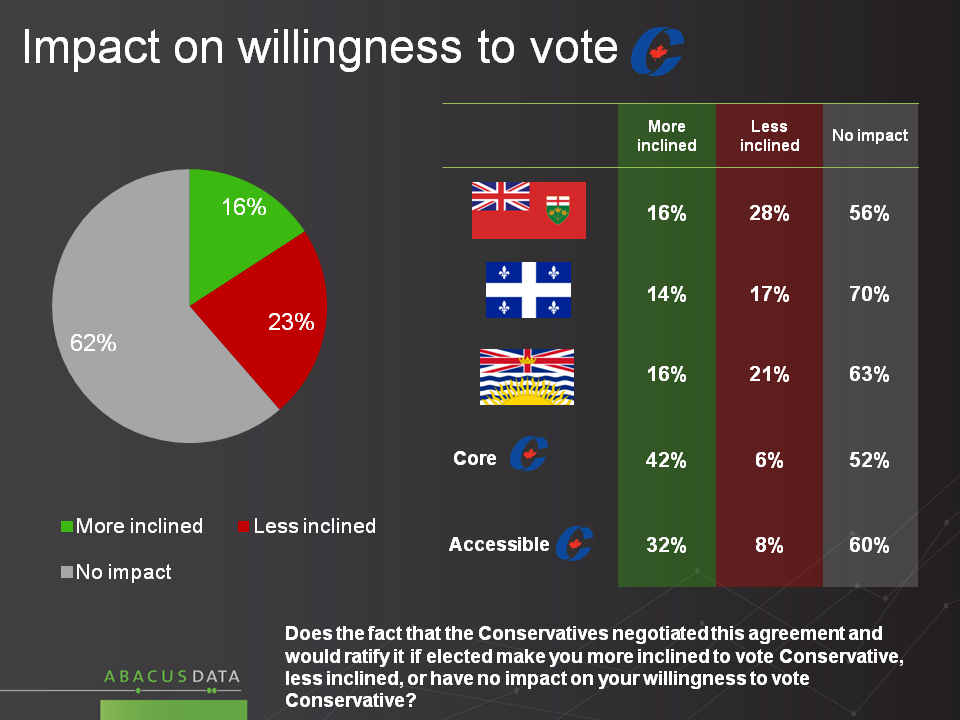
We described the position of each of the three main parties and asked what influence each would have on intentions to vote for that party. The results suggest that the deal may not provide a great deal of upside for the Conservatives and that NDP-Liberal swing voters are more drawn to the “pro-trade, but we’ll study it” position of the Liberals than the more aggressive sounding resistance to the deal that the NDP has voiced.

Overall, 16% say they are more likely to vote Conservative because they negotiated the TPP deal while 23% say they are less inclined to vote Conservative. 62% say it will have no impact on their vote. These patterns are fairly consistent across the three key provinces.

Core Conservative supporters and those who are open to voting Conservative are more likely to say they are more inclined to vote the incumbents because of the TPP deal, but a majority still say it will not affect their vote.

Slide14

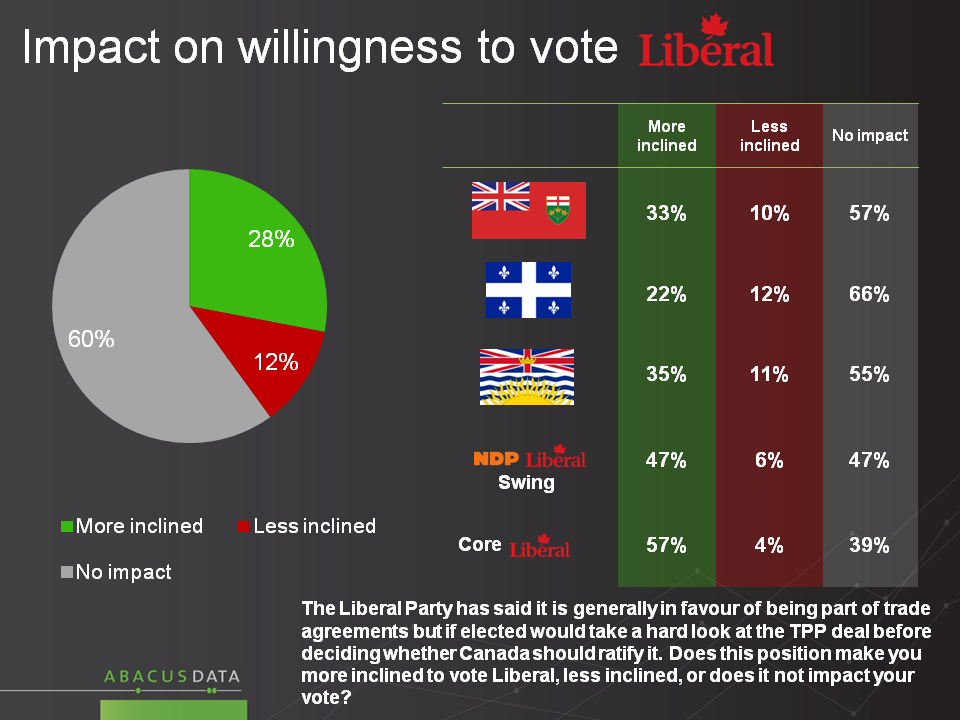
The Liberal position appears to be the most likely to draw supporters towards the party with 28% of all respondents saying they are more inclined to vote Liberal while 12% are less inclined.

Core Liberal and NDP/Liberal swing voters are more enthusiastic about the Liberal position than Conservative supporters are of the fact that the Conservatives negotiated the deal.

Slide15

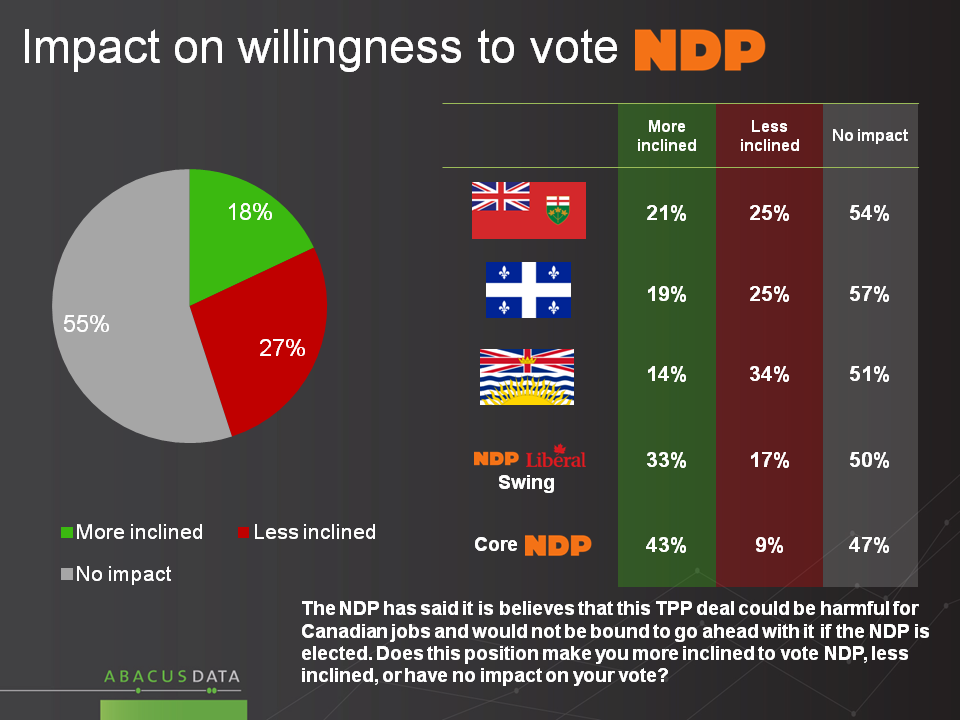
While the NDP has voiced strenuous concerns (“could be harmful – we will not be bound”) with the TPP deal, voter reaction to that position is more negative than positive. Overall, 18% say they are more inclined to vote NDP because of its position on TPP while 27% are less inclined. In Ontario, Quebec, and especially British Columbia, this pattern is consistent.

While the NDP position is a net gain among its current supporters, among Liberal-NDP swing voters, the Liberal position shows more vote pulling potential.

Slide16

The Upshot

The election remains unpredictable because while most voters want change, not everyone feels strongly about that, and those who want change continue to be split somewhat between voting Liberal and NDP.

Over the course of the campaign so far, the Liberals have been winning the change vote away from the NDP, and Mr. Trudeau’s campaign has impressed voters. Nevertheless, with the regional concentrations of votes, it’s an open question as to whether Conservatives win because of a split change vote or whether the drift/coalescence from the NDP to the Liberals continues and causes a change on October 19.

Will TPP be a vote mover? Based on these results, it’s hard to imagine the deal or the reaction to it having a large impact. Many voters feel it’s hard to have an opinion about the deal. Between the NDP and the Liberals, the NDP position is not as productive as the Liberal position when it comes to the battle for support among swing voters. The NDP posture will help somewhat among the NDP base, but not hugely.

Methodology

Our survey was conducted online with 2,000 Canadians aged 18 and over from 2:00pm ET October 5, 2015 to 4:00pm ET on October 6, 2015. A random sample of panelists was invited to complete the survey from a large representative panel of over 500,000 Canadians, recruited and managed by Research Now, one of the world’s leading provider of online research samples.

The Marketing Research and Intelligence Association policy limits statements about margins of sampling error for most online surveys. The margin of error for a comparable probability-based random sample of the same size is +/- 2.2%, 19 times out of 20. The data were weighted according to census data to ensure that the sample matched Canada’s population according to age, gender, educational attainment, and region. Totals may not add up to 100 due to rounding.

Abacus Data Inc.

We offer global research capacity with a strong focus on customer service, attention to detail and value added insight. Our team combines the experience of our Chairman Bruce Anderson, one of Canada’s leading research executives for two decades, with the energy, creativity and research expertise of CEO David Coletto, PhD. For more information, visit our website at http://www.abacusdata.ca/

Election 2015: Blue vs. Red; Orange flagging.

Liberals continue to edge upward, NDP downward

PdfExport

In our latest horserace numbers, the Conservatives have 33% across the country, the Liberals 32%, and the NDP 24%. For both the Conservatives and Liberals these are the best levels of support we’ve seen since the election started; for the NDP, it is the lowest number we’ve seen.

In Ontario, we see the Liberals up 6 points from our last wave, and now with a 7-point lead over the Conservatives. The NDP have fallen back to 23%, down 9 points from the start of the election.

In Quebec, we see no significant change from our last wave: four parties are within 12 points of each other. The NDP started the election with a 27-point lead over the Liberals. Today, that lead is 7 points.

Slide1
Slide2
Slide3

Accessible Voter Pools

The Liberals now enjoy the largest number (59%) of accessible voters (people who say they would consider voting for a party), followed by the NDP (52%) and the Conservatives at 43%. Since the start of the campaign, the NDP pool has shrunk by 8 points, the Liberal pool has grown 8 points, and the Conservative pool has been pretty stable.

Worth noting is that the number of Quebec voters who would consider the Liberals is now 48%, and the number who would consider the Conservatives is 30%, unchanged from the last wave. In Ontario, the accessible pool for the Liberals is 67%, up 4 points from our last wave, and 10 points higher than the NDP pool, and 24 points higher than the Conservatives.

Slide6
Slide5


The Leaders: Trudeau now most popular

Positive feelings toward Justin Trudeau have been rising quickly in this campaign. In mid-July only 30% had a positive feeling about the Liberal leader, only 2 points better than Stephen Harper. At one point he trailed Thomas Mulcair by 8 points in positive regard. Today, Trudeau is up 11 points from his trough, and is 6 points better than Mr. Mulcair, and 13 points better than Mr. Harper.

Feelings about Mr. Harper have stayed in a fairly narrow range this election, while ratings of the NDP leader have seen significant losses. Negative feelings about the NDP leader are up from 15% to 26% in the last few months.

Slide15
Slide16

Who Voters Think Will Win

Two weeks ago, the NDP was picked as the likely winner of the election by a plurality (26%) of those surveyed. Today, only 11% believe the NDP will win, compared to 29% who think the Conservatives will win and 28% who think the Liberals will finish on top.

In Ontario, 33% think the Liberals will win, followed by the Conservatives at 27% and the NDP at 9%. In Quebec, the CPC and LPC are deadlocked at 28%, followed by the NDP at 15%. In Ontario and BC, the NDP have dropped 7 points on this question in just over a week, in Quebec they are down 8. As the race enters its final stages, and some voters consider strategic voting, it is clear that far fewer believe that the NDP is the party most likely to defeat the Conservatives.

Slide8
winner_region

The Upshot

The story so far of this election campaign has been one of relative steadiness in the prospects of the Conservatives, rising Liberal support, and declining enthusiasm for the NDP. The outcome at this point remains impossible to predict, especially since support levels continue to be fluid.

While much has been made about how the NDP platform may have positioned them poorly relative to the Liberals, it is also clear that feelings about the NDP leader are part of the challenge for that party. Mr. Mulcair, who began the campaign as a front-runner, has been leaving voters wanting. It seems reasonable to assume that at least some of this about reaction to his debate performances.

Mr. Trudeau, on the other hand, has capitalized on the fact that he started the campaign as something of an underdog, and has built substantially more opportunity for his party to stake a claim as the party best positioned to unseat the Conservatives, a point of differentiation which may be critical in the final days.

Tomorrow, we’ll provide data on the mood for change, the views of change voters, and reactions to the TPP deal.

Methodology

Our survey was conducted online with 2,000 Canadians aged 18 and over from 2:0pm ET October 5, 2015 to 4:00pm ET on October 6, 2015.. A random sample of panelists was invited to complete the survey from a large representative panel of over 500,000 Canadians, recruited and managed by Research Now, one of the world’s leading provider of online research samples.

The Marketing Research and Intelligence Association policy limits statements about margins of sampling error for most online surveys. The margin of error for a comparable probability-based random sample of the same size is +/- 2.2%, 19 times out of 20. The data were weighted according to census data to ensure that the sample matched Canada’s population according to age, gender, educational attainment, and region. Totals may not add up to 100 due to rounding.

Abacus Data Inc.

We offer global research capacity with a strong focus on customer service, attention to detail and value added insight. Our team combines the experience of our Chairman Bruce Anderson, one of Canada’s leading research executives for two decades, with the energy, creativity and research expertise of CEO David Coletto, PhD. For more information, visit our website at http://www.abacusdata.ca/

The Battle for the Change Vote

Three out of four voters want change: but what does that mean?

We asked the 76% of voters who said they preferred to see a change in government, whether they preferred ambitious or moderate change, and change that would be felt soon, or more gradually. We also asked which of the Liberals and New Democrats looked best positioned to deliver the change they were looking for.

The responses reveal:

• People are split on the scale of change they want, with 50% wanting moderate change and 50% wanting ambitious change. In Quebec, the majority wants ambitious change; in BC it’s the opposite. But perhaps most important is this: among voters who are going to choose only between the NDP or Liberals, 57% want ambitious change, compared to 43% who want moderate change.

• Most (58%) favour change that would be felt soon, rather than more gradually (42%). This is the consensus in all three of the largest seat provinces. Among NDP-Liberal swing voters, 65% want change sooner rather than later.

Slide1

• Justin Trudeau is seen as the leader who represents ambitious change (63%) and change that will be felt soon (60%). Thomas Mulcair is more identified with moderate change (60%) that will happen more gradually (59%). This puts the NDP leader at a disadvantage to Mr. Trudeau among the Liberal-NDP swing voter.

Slide3

• When asked which leader is best able to deliver the change they want, 41% of change voters say Justin Trudeau, compared to 36% for Thomas Mulcair. Mr. Trudeau has a substantial 46%-33% lead in Ontario, and leads in BC (44%-33%), while Mr. Mulcair has a sizeable lead in Quebec (44%-28%).

trudeaumulcair

• Among those who want ambitious change, Mr. Trudeau leads 44% to 36%. Among those who want moderate change, the Liberal leader and NDP leader are about even (38% to 35%)

• Among those who want change that happens soon, Mr. Trudeau leads 43% to 36%. Among those who want gradual change, the two are about even (38% vs. 36%).

We also revisited questions we asked earlier in the year about what would happen if an NDP or Liberal government replaced the Conservatives. The results (among the entire sample) reveal:

• Most people doubt things would be worse with a change to a Liberal or NDP government. The range of fearful voters is 17% to 30% for the Liberals, and 15% to 31% for the NDP.

• These perceptions show deterioration for the NDP and improvement for the Liberals since July. The Liberals have improved 9 to 11 points in perceptions that they would improve the rate of economic growth, job creation and keep taxes low, when compared to the Conservative government. The NDP have lost ground on keeping taxes low and keeping Canada safe from terrorism.

Slide5
Slide4

The Upshot

It may well be that the rest of the campaign turns on two themes: a Conservative effort to promote concern about the consequences of change and an effort by the two main opposition parties to harden the desire for change and define the most appealing version of change.

The fear of change has grown a bit in the case of a prospective NDP win, and has lowered when it comes to the prospect of a Liberal win. Overall, the fear of change is fairly limited.

Thus far in this campaign Liberals have out-positioned the NDP among change voters. For those who want ambitious change and to feel it soon, the Liberals have established stronger credentials: remarkable given the traditional relationship between these two parties. At the same time, among those who prefer more modest and gradual change, the Liberals are competitive with the NDP. As the leaders battle for the roughly 30% of voters who say they will only vote NDP or Liberal, this may be the topic to watch as Election Day draws nearer.

Methodology

Our survey was conducted online with 3,814 Canadians aged 18 and over from 9:30 pm ET on September 24 to 3:00pm ET on September 27, 2015. A random sample of panelists was invited to complete the survey from a large representative panel of over 500,000 Canadians, recruited and managed by Research Now, one of the world’s leading provider of online research samples.

The Marketing Research and Intelligence Association policy limits statements about margins of sampling error for most online surveys. The margin of error for a comparable probability-based random sample of the same size is +/- 1.6%, 19 times out of 20. The data were weighted according to census data to ensure that the sample matched Canada’s population according to age, gender, educational attainment, and region. Totals may not add up to 100 due to rounding.

Abacus Data Inc.

We offer global research capacity with a strong focus on customer service, attention to detail and value added insight. Our team combines the experience of our Chairman Bruce Anderson, one of Canada’s leading research executives for two decades, with the energy, creativity and research expertise of CEO David Coletto, PhD. For more information, visit our website at http://www.abacusdata.ca/

NDP facing headwinds as support drops in Quebec.

PdfExport

In our latest nationwide poll, only 5 points separates the Conservatives (32%) Liberals (29%) and NDP (27%). However, underneath the national figures, important trends have been developing in Quebec and Ontario, where 199 of the country’s 338 seats are at stake.  The number of undecided voters in our sample this week is 21%.

The NDP started the campaign with a slight lead in Ontario and has fallen behind the other parties and is now running third. This week the NDP suffered a large drop in support in Quebec.

Slide1

Quebec

Since our last survey, the NDP shed 17 points in Quebec. When the election began, 37 points separated the NDP from the three other main parties. Today that gap has narrowed to 6 points, with the NDP at 30%, LPC 24%, CPC 21% and BQ 20%.

Slide3

Ontario

In Ontario the NDP was roughly even with or slightly ahead of the other parties when the election began: currently (at 26%) they trail the Conservatives (36%) and Liberals (33%) by 10 and 7 points.

Slide2

British Columbia

We see a tight three-way race with a gap of 3 points separating the three main parties, as the Liberals picked up support since the campaign began. The Green Party is at 8%.

Slide4

Other Indicators

VOTER POOLS: the NDP voter pool has slid 7 points from its peak of 62%. The Liberal accessible voter pool (56%) is once again as big as that of the NDP (55%) while the Conservatives’ pool has increased to 45%, 4-points since last wave. In Quebec, the Conservative voter pool has increased 12 points from 19% to 31% in just two weeks.

Slide8
Slide7

PREDICTED WINNER: 19% predict the NDP will win this election, down 7 points from our last wave. Confidence in an NDP win is down 17 points in Quebec and 7 points in Ontario since our last wave

27% predict the Conservatives will end up ahead, up 6 points. 22% predict a Liberal win.

Slide10
Slide11

DESIRE FOR CHANGE: the desire for change remains broad (74%), but the intensity of that desire has softened a bit. Today, 56% say they definitely want change (down 5 points) and 18% say they it would be good to have a change but it’s “not all that important to me” (up 3 points).

Among those who most want change, the Liberals and the NDP are tied at 41%. At the beginning of this campaign, the NDP had a 16-point lead within this group. Among those who are only somewhat inclined to want change, we’ve seen a drop in NDP support to 21%, well behind the Liberals 33% and the Conservatives at 31%, and the party’s lowest score since May.

Slide14
change
Slide15
Slide16

Views of Leaders

Just after the Alberta NDP victory, Thomas Mulcair’s popularity jumped from 27% (3rd place) to 41% (1st place). Recently his positives have sagged (to 36%) and his negatives have jumped (15% in July, 23% today). His net rating (positive minus negative) is down 18-points in Quebec.

Slide17

The summertime advantage that Mr. Mulcair had over Mr. Trudeau has mostly disappeared.

Justin Trudeau’s reputation (36% positive, 28% negative) has been steady in Quebec and improving in other parts of the country. A 40-point differential in Quebec between Mr. Mulcair and Mr. Trudeau has narrowed to 20 points.

Stephen Harper’s (26% positive, 50% negative) net rating improved 16 points in Quebec and dropped 4 points elsewhere.

Slide23
Slide25

Reaction to Election Outcomes

A majority of Canadians would be ok with or happy with either a Liberal or an NDP victory. Majorities would be unhappy with a Conservative win. Since the last time we asked this question, there has been slight growth in resistance to Conservative wins (majority down 4, minority down 8) or an NDP majority (down 4).

Slide27

The Upshot

Having lost ground in Ontario since the election began, the NDP is now facing a loss of support in the province of Quebec, where they hold the majority of seats and where the bulk of their caucus is from.

The election remains very close, and the outcome impossible to predict. One of the variables to watch is whether change voters will consider strategic voting if they feel the choice of which party can best stop a fourth Conservative victory is becoming more clear. Most NDP voters would prefer a Liberal rather than a Conservative victory.

But while many prefer a change, change is not a foregone conclusion: the Conservatives are competitive in Ontario, and have experienced a lift in the province of Quebec as well.

Tomorrow, we’ll share more data about how perceptions of the different parties are changing and what may account for the shifting.

Methodology

Our survey was conducted online with 3,814 Canadians aged 18 and over from 9:30 pm ET on September 24 to 3:00pm ET on September 27, 2015. A random sample of panelists was invited to complete the survey from a large representative panel of over 500,000 Canadians, recruited and managed by Research Now, one of the world’s leading provider of online research samples.

The Marketing Research and Intelligence Association policy limits statements about margins of sampling error for most online surveys. The margin of error for a comparable probability-based random sample of the same size is +/- 1.6%, 19 times out of 20. The data were weighted according to census data to ensure that the sample matched Canada’s population according to age, gender, educational attainment, and region. Totals may not add up to 100 due to rounding.

Abacus Data Inc.

We offer global research capacity with a strong focus on customer service, attention to detail and value added insight. Our team combines the experience of our Chairman Bruce Anderson, one of Canada’s leading research executives for two decades, with the energy, creativity and research expertise of CEO David Coletto, PhD. For more information, visit our website at http://www.abacusdata.ca/

Platforms strengths & weaknesses entering the second half of Election 42

CPC wins on security, struggling on economy.

NDP has strength in Quebec, but soft on taxes, jobs elsewhere

Liberals competitive on economy, especially in Ontario

As we’ve passed the mid-point in the campaign, parties have announced many parts of their platforms. We thought it would be useful to see how the parties were faring in terms of establishing policy credentials.

We asked respondents “Which Party Has Best Position on…?” on a series of issues. The results:

• The Conservative Party edges out the other parties, by a wide margin, when it comes to combating terrorism and dealing with ISIS. In each case roughly half of all voters say the CPC has the best position. The Conservatives have a notably more narrow advantage when it comes to the federal budget, ahead of the Liberals by only 3 points, with the NDP a couple more points back. The weakest results for the Conservatives are for education and training, health care, and the environment/climate change.

• The NDP is ahead when it comes to education and training, health care and the environment/climate change. In each case, on these items, the Conservatives are third. The weakest results for the NDP are on taxes, the budget, growing the economy, and infrastructure.

• The Liberal Party edges out other parties on taxes, infrastructure, growing the economy and creating jobs. The weakest results for the Liberals are on terrorism and ISIS, although they trail the NDP by a large margin on health care and the environment as well.

Slide1

The Battles for Quebec and Ontario

Because this election is starting to turn into a series of regional races, each with their own dynamic, we felt it would be useful to compare the results in the two largest provinces (where sample sizes are large enough to improve reliability.

Here’s what that analysis shows:

Quebec

• The NDP leads on 8 of 10 issues, trailing only on terrorism. In every case but on the terrorism issue, the Liberal Party is second, and the CPC is third.

• The NDP advantage over the Liberals is largest on the environment (24 points), and smallest on growing the economy/creating jobs (5 points).

• The Conservatives are weakest on the environment, health care, and economic growth/job creation.

Ontario

• The NDP lead on just 2 items (environment, health care) and are tied with the Liberals on education and training.

• The Conservatives lead on 4 items ISIS, terrorism, refugees, and the federal budget. Their advantage is 25 points on the terror/ISIS items but only 5 points over the Liberals on the federal budget.

• The Liberals in addition to tying for the lead on taxes and education, have an outright lead on infrastructure and economic growth.

• The Conservatives and Liberals are tied when it comes to taxes, both ahead of the NDP by about 10 points.

Slide2

The Upshot

The patterns are revealing.

First, the platforms are having some impact on public opinion. The most apparent example is that the Liberals were not as competitive on economic growth and infrastructure before the campaign began.

The Conservatives have taken a more cautious line than the other parties when it comes to refugees from Syria and Iraq, a position that probably strengthens their political standing among their accessible voters a little bit, even if it makes other voters more likely to vote for a different party.

Outside of Quebec, the NDP are a more vulnerable on economic growth and jobs than on any other issue. Arguably, this is the worst issue to be vulnerable on.

The Liberals seem more competitive in these numbers, especially on economic issues, and will take heart in their advantages over the NDP in Ontario.

Finally, for the Conservatives, their strongest suit is the security/terror issue set, but they have been less successful at convincing voters (especially in the two largest provinces) that they are a superior choice on economic, tax or fiscal matters. In each case, they find few voters giving them credit for the way things are today, and more voters imagining that other parties could do just as well or in some cases better.

Methodology

Our survey, commissioned by Abacus Data, was conducted online with 1,500 Canadians aged 18 and over from September 9 to 11, 2015. A random sample of panelists was invited to complete the survey from a large representative panel of over 500,000 Canadians, recruited and managed by Research Now, one of the world’s leading provider of online research samples.

The Marketing Research and Intelligence Association policy limits statements about margins of sampling error for most online surveys. The margin of error for a comparable probability-based random sample of the same size is +/- 2.6%, 19 times out of 20. The data were weighted according to census data to ensure that the sample matched Canada’s population according to age, gender, educational attainment, and region. Totals may not add up to 100 due to rounding.

Abacus Data Inc.

We offer global research capacity with a strong focus on customer service, attention to detail and value added insight. Our team combines the experience of our Chairman Bruce Anderson, one of Canada’s leading research executives for two decades, with the energy, creativity and research expertise of CEO David Coletto, PhD.

The Race for 24 Sussex

Mulcair most popular, but has lost ground
Trudeau’s campaign shows good results
Harper negatives hit new high

After soaring from April of this year, our latest survey shows a softening of impressions of NDP Leader Thomas Mulcair. His positives sagged slightly (2 points) to 39% and his negatives jumped 5 points to 21%.

For Stephen Harper, the news is worse. Positive feelings about the PM have hit a new low of 25%, down 9 points from his level in February of this year. His negatives hit a new high of 50%, up a remarkable 16 points from December.

For Justin Trudeau the news is that he has held the gains we saw in our last wave of surveying. His positives are 36%, and his negatives 29%. His net score is 10 points better than it was in July.

Slide3
Slide4
Slide5
Slide1
Slide2

What to make of the leaders?

We asked the same three questions about each leader: how much do they want my vote, how close are their values to mine, and do they have new ideas about how to improve the country. The results paint a picture of how voters see their choices.

Both Mr. Mulcair (54%) and Mr. Trudeau (57%) are seen as really wanting to “win your vote”, compared to 34% who say the same thing about Mr. Harper. 36% say Mr. Harper “really doesn’t care if I vote for him” about twice as many who say that about the other leaders.

When it comes to values, few people say any of the leaders’ values are “pretty much the same as mine”. A combined 50% say their values are pretty much the same, or “not exactly but we share some of the same values” as Mr. Harper. 67% say the same thing about Mr. Mulcair and 68% about Mr. Trudeau. 50% say Mr. Harper’s values are very different from mine, compared to 33% for the other two leaders.

In Quebec, 76% say that Mr. Mulcair’s values are either pretty much like theirs or that he shares some of their values compared with 66% for Mr. Trudeau and only 35% for Mr. Harper. In Ontario, Mr. Trudeau leads slightly with 69% thinking he shares at least some of their values, followed by Mr. Mulcair at 66% and Mr. Harper at 55%.

When asked about their ideas, only 18% say Mr. Harper has new ideas about how to improve the country, compared to 39% for Mr. Mulcair, and 43% for Justin Trudeau.

Slide8

Because the way partisans feel about their party’s leaders can have a lot to do with their determination to turn out and vote it is worthwhile to look at how each party’s supporters rate their leaders on these questions.

Conservative Party voters are least likely to say their party’s leader really wants their vote (67%), has values pretty much the same as theirs (46%), and has new ideas about how to improve the economy (52%).

Liberal Party voters are at the other end of the spectrum, with 85% saying Mr. Trudeau really wants their vote, 56% say his values are pretty much the same as theirs, and 80% say he has new ideas about how to improve the country.

Mr. Mulcair’s ratings among his party’s supporters are significantly better than those of Mr. Harper, but not quite as strong as those of Mr. Trudeau.

Slide10

Campaign Performance

Both Mr. Mulcair and Mr. Trudeau tend to be seen as performing better than expected rather than worse than expected (32% better – 15% worse for Mr. Trudeau and 36% better – 10% worse for Mr. Mulcair). Only 9% say Mr. Harper is performing better than expected, while 40% say he is doing worse than they anticipated.

Since our last reading, these numbers show improvement for Mr. Trudeau (his net better vs worse rating improved 10 points) steady results for Mr. Mulcair (net rating shifted 1 point) and and 11-point negative shift for Mr. Harper.

Slide7

Mulcair v Trudeau head to head matchup

To find out how voters might evaluate a choice between Mr. Mulcair and Mr. Trudeau we asked people to compare the two on a series of measures. (In our next wave, we will do a similar test including Mr. Harper and one of the other leaders).

The results show the two leaders are close together in public esteem, with all 11 items showing a highly competitive race. Mr. Mulcair was preferred choice when it comes to:

• Making the wisest choices in the fight against terrorism
• Doing the most to improve ethics and accountability
• Best approach to managing the federal budget

Mr. Trudeau scored better for:
• Motivating Canadians in a positive way
• Taking good advice if it was offered to him
• Doing the most to help the middle class

The choice is effectively too close to call (a 2-point gap from a 50/50 result) on:
• Improving the way politics is conducted
• Best foreign policy for Canada
• Best reflect your personal values in how he runs the country
• Soundest economic policies
• Best working relationship with the provinces

Slide12

The difference of opinion between Ontarians and Quebecers is again evident, with Mr. Trudeau leading on five measures in Ontario compared with four for Mr. Mulcair. In Quebec, Mr. Mulcair beats Mr. Trudeau on all measures except one (Do most to help the middle class) on which they are effectively tied.

Slide11

Worth noting is that when we look only at those voters who say they will consider voting for either for the Liberals or the NDP (but will not consider the Conservatives) the responses favour Mr. Trudeau, who leads on 6 items, while Mr. Mulcair leads on 1 and 4 items are too close to call.

Slide13

When pressed on which of the two they would ultimately vote for, Mr. Mulcair gets 51% to Mr. Trudeau’s 49%, an extraordinarily close result. In Quebec, Mr. Mulcair wins (61%-39%) while Mr. Trudeau prevails in BC (54%-46%) and in Ontario (52%-48%).

Among swing voters who will consider voting for either the Liberals and NDP but not the Conservatives, Mr. Trudeau leads 53%-47%.

The Upshot

This election will be influenced by platform ideas, but the outcome will also have a lot to do with impressions of the individual who would be Prime Minister and about the values they share with Canadians.

The results show that Mr. Harper’s party remains competitive nationally, but that he is running well behind the other leaders in popularity and is not enjoying as ardent support among supporters of his own party as had been the case in prior elections, or as enjoyed by the other main party leaders.

The sense of Mr. Harper’s campaign is that it is not going as well as the others’, that Mr. Harper seems a bit more indifferent about winning votes, less aligned with the values of voters, and offering fewer ideas about improving the economy. To win, barring a major failure by his opponents, he would likely need to improve these perceptions.

For those looking for a change in this election, the race between Mr. Mulcair and Mr. Trudeau is clearly narrowing. The Liberal leader had surrendered a lead to the NDP leader, and now the balance is shifting in the other direction. To understand the electoral implications of these patterns, it is critical to recognize the differences between perceptions in Quebec compared to the rest of the country. Mr. Mulcair maintains great strength in Quebec, where the NDP already holds a very large majority of the seats. His biggest growth opportunities are in Ontario, where the NDP holds a small fraction of the 121 seats contested this year.

In Ontario, Mr. Trudeau and the Liberal Party have become more competitive, and as the campaign rolls into its second half, enjoy a modest advantage in that province, and among voters who say their choice will come down to the NDP and Liberal Party.

Methodology

Our survey, commissioned by Abacus Data, was conducted online with 1,500 Canadians aged 18 and over from September 9 to 11, 2015. A random sample of panelists was invited to complete the survey from a large representative panel of over 500,000 Canadians, recruited and managed by Research Now, one of the world’s leading provider of online research samples.

The Marketing Research and Intelligence Association policy limits statements about margins of sampling error for most online surveys. The margin of error for a comparable probability-based random sample of the same size is +/- 2.6%, 19 times out of 20. The data were weighted according to census data to ensure that the sample matched Canada’s population according to age, gender, educational attainment, and region. Totals may not add up to 100 due to rounding.

Abacus Data Inc.

We offer global research capacity with a strong focus on customer service, attention to detail and value added insight. Our team combines the experience of our Chairman Bruce Anderson, one of Canada’s leading research executives for two decades, with the energy, creativity and research expertise of CEO David Coletto, PhD.

Desire for change intensifies, and battle for “change vote” tightens

PdfExport

The mood of the country continued to deteriorate and the desire for change grew since our last wave of surveying. Today, just 32% say the country is heading in the right direction, a drop of 18 points since last December and the lowest we have measured since we began tracking this item in March 2014. This is the first time since that tracking began that more people say the country is on the “wrong track” than say it is heading in the right direction.

direction


The desire for change in Ottawa has also hit a new high, with 61% saying they “definitely think it’s time for a change”, up from 50% in April of this year. Another 15% are inclined to want change meaning a total of 76% of voters would prefer to see a different party take office at the conclusion of this election. Only 17% are sure that they want the Conservatives to remain in power, with another 7% inclined to want this outcome.

change


Current Voting Intention

The incumbent Conservatives find themselves in the middle of an intense 3-way battle for support. In terms of current voting intentions, we see the NDP at 31% and the Liberals and CPC both registering 29%. For all intents and purposes these levels of support are identical, and have only changed one point since our last survey, when the Liberal Party registered 28%.

vote

In Ontario, we see a close two-way race between the Conservatives and the Liberals with the NDP having fallen back a bit. In Quebec, the NDP continues to lead by a wide margin. In BC, the Liberals appear to have picked up a bit of ground and a 3-way fight is evident again.

Slide3
Slide2
Slide6

Accessible Voter Pools

One area where we have seen some shifting is in the size of the accessible voter pools for the parties. We note a 6-point drop in the number of people who would consider voting NDP, bringing their voter pool to a level about the same as that of the Liberal Party (NDP 56%, LPC 54%). Both parties enjoy consideration by substantially more voters than does the Conservative Party. Only 41% now say they would consider voting Conservative, down 7 points from April of this year.

Slide8


Firmness of Voting Intentions

In terms of the firmness of voting intentions, there continues to be a lot of evidence of fluidity. Only 31% are sure of how they will vote, the rest are not.

Half (49%) of the current CPC vote (meaning about 15% overall) is locked in and won’t change, as is 38% of the Liberal vote and 29% of the NDP vote.

Slide9


Battle for the Change Vote

Finally, perhaps the most interesting finding to draw attention to in this series of numbers is the voting intention among voters who are most passionate about change. This battle for the change vote is a key element of this campaign.

At one point, in mid August, he NDP a 12-point lead over the Liberals within this group. Today, the two parties are tied (34-33 with 19% undecided). In Quebec, the NDP leads by 22% among those who definitely want change. In Ontario, the Liberals lead by 9 points.

Slide17


The Upshot

Tomorrow, we’ll release data on the evolving perceptions of the main party leaders.

These numbers released today indicate that the Conservatives are holding on to a competitive position, but continue to face headwinds in terms of a deteriorating mood and a growing desire for change. The NDP have softened a bit in the last few weeks, and the Liberals have re-established themselves as serious contenders.

The battle to become the vehicle of choice for change voters may determine the outcome of the election: if the NDP and the Liberals split equally, this can help the Conservatives, however if one or the other emerges as a dominant choice in large-seat regions, the math works poorly for Conservative incumbents. Increasingly we need to be watching the races in BC, Ontario and Quebec, as each has its own unique dynamic, and the potential to swing a lot of seats from one column to another.

Methodology

Our survey, commissioned by Abacus Data, was conducted online with 1,500 Canadians aged 18 and over from September 9 to 11, 2015. A random sample of panelists was invited to complete the survey from a large representative panel of over 500,000 Canadians, recruited and managed by Research Now, one of the world’s leading provider of online research samples.

The Marketing Research and Intelligence Association policy limits statements about margins of sampling error for most online surveys. The margin of error for a comparable probability-based random sample of the same size is +/- 2.6%, 19 times out of 20. The data were weighted according to census data to ensure that the sample matched Canada’s population according to age, gender, educational attainment, and region. Totals may not add up to 100 due to rounding.

Abacus Data Inc.

We offer global research capacity with a strong focus on customer service, attention to detail and value added insight. Our team combines the experience of our Chairman Bruce Anderson, one of Canada’s leading research executives for two decades, with the energy, creativity and research expertise of CEO David Coletto, PhD.

Research Note: Who are the undecided voters?

In our latest survey (completed August 26 to 28), 24% of respondents said they were undecided about which party they would support.  This is same proportion as our previous wave of research two weeks ago.

Past Federal Voting Behaviour

In 2011, 42% say they did not vote while 58% said they voted.  Among those who voted, 46% supported the Conservative Party, 25% voted NDP, while 21% voted Liberal.  Two percent said they voted Green.

A quick look at the demographic and regional make up of this group finds they are:

– More likely to be female (59%) than male (41%)
– Younger than the general population.  52% are under the age of 45.
– More likely to reside in Ontario, less likely to live in Quebec.
– Less educated.  41% have high school or less compared 29% among those who identified a party they support.

And this is what they think about some surrounding issues..

– 20% think the country is generally headed in the right direction.  35% think it’s off on the wrong track.  45% are unsure.
– Vote consideration: 59% would consider voting NDP, 58% Liberal, 45% Conservative, and 33% Green.
– 40% say they are certain to vote, another 20% said they are likely to vote.
– 54% believe it is definitely time for a change in government, another 33% say it would be good to have a chance, but it is not really that important to them.  Only 5% think its definitely best to keep the Conservatives in office.
– 69% describe the Canadian economy as poor or very poor, 13-points higher than those who have a stated vote preference.
– 15% say they are following the Duffy trial very closely or closely.
– 64% are unsure which party will win the next election. 14% pick the Liberals, 11% pick the CPC, and 10% pick the NDP.

The Undecideds

The Upshot?

There is a large group of voters who say they are undecided when we ask which party they would support if an election was held at the time of the election.  About 40% are unlikely to vote and so may not impact the result.  But among those who say they are certain or likely to vote, their mood is decidedly worse than that of those who have a vote preference.  They are more bearish on the state of the economy and almost all prefer a change in government.

Most striking is that among those who voted in 2011, 46% supported the Conservative Party.  If the Conservatives hope to be re-elected, they will have to convince these undecided voters to go against their desire for change and vote Conservative once again.

Election 2015: The Politics of a Soft Economy

PdfExport

Only 35% believe the country is heading in the right direction, while 33% say it is on the wrong track. These are the weakest indicators we have seen since we began tracking this question 18 months ago. Among those who say the country is heading in the right direction, 46% intend to vote CPC, 25% NDP, and 23% LPC. Among those who have the opposite view, 38% intend to vote LPC, 37% intend to vote NDP, and 12% intend to vote CPC.

Slide1

State of the Economy

A majority say the economy is in poor or very poor health, also the highest number we have seen since we began measuring this in October 2013. Among those who say the economy is in good shape, 45% intend to vote CPC, 24% NDP, and 23% LPC.. Among those who have the opposite view and describe the economy as poor or very poor, 37% intend to vote NDP, 32% LPC and 18% CPC.

Slide2

In this wave of surveying, 29% say the economy is growing, down 4 points from our last measurement that ended August 17th. A total of 67% say the economy is shrinking and in a recession.

Slide3

How Canada’s Economy Compares

While many people aren’t thrilled with the state of the economy, it is important to note that only 24% think our economy is doing worse than that of our major competitors. 16% believe that we are outperforming others, and 50% think our situation is more or less the same.

Among those who think our economy is outperforming, the Conservatives can count on the votes of 46%, with the other parties well behind. Among those who think we are underperforming, only 11% are planning on voting Conservative, while the Liberals and NDP are tied at 29%. Among those who think we are roughly on par with our competitors, the three main parties are closely bunched.

Slide4

What Economic Conditions Cause Anxiety?

We measured levels of fear about different economic conditions, in part because we wanted to see the impact of large fluctuations in world stock markets during the week we were in the field. The results show that a weak Canadian dollar and a shrinking Canadian economy are the two things that create the most fear. Relatively speaking a soft manufacturing sector and low oil prices cause considerably less anxiety, although these factors also cause uneasiness among a majority of those surveyed.

Slide8

Deficits

37% people believe that the government should spend money to ensure the economy grows, even if it means going into deficit”, while 38% prefer “to keep the budget balanced, even if the economy weakens”. On this question, 25% were unsure of where to come down.

Liberal Party supporters were more likely to favour spending (51%-31%) while CPC supporters were almost the mirror opposite (33%-51%). New Democrats were evenly split 41%-41%.

Slide28

Trade Deals like TPP

34% believe that Canada “should try to enter into trade agreements, like the TPP agreement, even if we have to open up some of our markets to competitors, in order to expand our export opportunities” while 19% would prefer to see Canada avoid such trade deals. Roughly half (47%) are unsure.

The supporters of all major parties tend to be more inclined to support entering into such trade deals, rather than to avoid them.

TPP

Political Parties and Economic Purposes

If the question is which party and leader is best able to “protect Canada from the effects of economic turmoil in other parts of the world”, the Conservatives (35%) would win this ballot question, followed by the NDP (29%) and the Liberals (28%).

However when we asked a question about “putting in place the right policies to grow Canada’s economy and create jobs”, the Conservatives drop to third place (28%) behind the Liberals (32%) and the NDP (33%).

Finally, when probed on which party/leader would do best at making “sure that regular Canadians are treated fairly when it comes to the economy”, the NDP lead (35%) followed closely by the Liberals (32%) and the Conservatives again trail at 25%.

partyeconomy

The Upshot

The economy may well become the issue that carries the most weight in this election campaign, and current economic conditions are testing the popularity of the incumbents. Among those who think the economy is healthy and growing and doing better than our competitors, the Conservatives enjoy solid levels of support, however the economic mood has soured recently, and voters are evaluating whether other parties would provide better economic leadership.

The Conservative Party is seen as best when it comes to buffeting global economic pressures, but other parties come more readily to mind when the topic is how to generate growth in the economy.

Results on deficit and TPP questions show Canadians remain largely pragmatic, not dogmatic. They will support policies they believe might work to improve things, and with three quarters of voters inclined to want change in this election, the conversation is more likely to be about what new measures might help.

Right now, this is an election without a defining ballot question. If it becomes an election about how to avoid economic risk, that may play to the Conservatives’ advantage. If it becomes about how to create and distribute economic upside, other parties may stand to gain more.

Methodology

Our surveyed, commissioned by Abacus Data, was conducted online with 1,500 Canadians aged 18 and over from August 26 to 28, 2015. A random sample of panelists was invited to complete the survey from a large representative panel of over 500,000 Canadians, recruited and managed by Research Now, one of the world’s leading provider of online research samples.

The Marketing Research and Intelligence Association policy limits statements about margins of sampling error for most online surveys. The margin of error for a comparable probability-based random sample of the same size is +/- 2.6%, 19 times out of 20. The data were weighted according to census data to ensure that the sample matched Canada’s population according to age, gender, educational attainment, and region. Totals may not add up to 100 due to rounding.

Abacus Data Inc.

We offer global research capacity with a strong focus on customer service, attention to detail and value added insight. Our team combines the experience of our Chairman Bruce Anderson, one of Canada’s leading research executives for two decades, with the energy, creativity and research expertise of CEO David Coletto, PhD.

Race narrows as NDP support dips

PdfExport

Our latest national voting intention numbers reveal a tightening race as the NDP has lost a little ground. If the election were tomorrow, 31% say they would vote NDP (down from 35% two weeks ago), 30%
would vote CPC, and 28% would vote Liberal.

Slide1

The Liberals picked up 2 points since our last poll and the Conservatives are up 1 point, both within the margin of error. The three-point gap is the closest we have seen since May, when the NDP began to climb in support following the election of NDP Premier Rachel Notley in Alberta.

Some softening of NDP support appears in several regions: Atlantic Canada (-5) Quebec (-3), Ontario (-6) and BC (-3). The NDP leads in Quebec, with a 21-point advantage over the Liberals; the margin was 27 points in our last survey. In Ontario, we see the Liberals at 34%, the Conservatives 33% and the NDP 26%. In BC, the NDP (31%) and CPC (32%) are locked in a tie, followed by the LPC (20%) and a strengthening Green Party (15%).

Slide3
quebec


ontario

71% Not Fully Decided

In this wave, 29% say they have made up their mind who they will vote for and their decision won’t change. Two weeks ago, 31% were firm.

58% Really Want Change, 15% Really Don’t

A clear majority (58%) of those surveyed really want a change in government, while 15% are adamantly opposed to change. The number of people adamantly in favour of change is higher in recent waves than it was earlier in the year.

Another 18% say “it would be good to have change but it’s not really all that important” meaning a total of 76% would prefer a different government. Another 9% say “it would be better to continue with the Conservatives, but it’s not really all that important”, meaning that the total number who prefer the Conservatives to continue in office is 24% in this wave.

Slide8
Slide10

No clear consensus on which party will win.

Asked which party will win this election, 26% say the NDP, 23% say the Conservatives and 21% say the Liberals. In the last 12 months, all three parties have been on top on this question, this week marking the first time a plurality picked the NDP as the most likely victor.

These national numbers mask some differences among those living in different regions. In Ontario, 20% think the NDP will win, compared to 25% for the Conservatives and the Liberals, while in Quebec, 42% think the NDP will win, compared to 17% for the Liberals. Only 14% of Quebecers think Mr. Harper will win a fourth term at this point in time.

Slide5

Pools of Accessible Voters

The NDP enjoys access to the largest potential pool of voters, as 62% say they would consider voting NDP, followed by the Liberals at 55% and the Conservatives at 42%. Put another way, the NDP have the potential to add 31 points more support, the Liberals 27 more points and the Conservatives only 12. The room for growth for the Conservatives is smaller than for the other parties, thus it is more imperative that their voters are highly motivated to turn out to vote.

Today, 28% say their choice will be between the NDP and the Liberals, a number which has risen.

Duffy Trial

A total of 25% say they were following the Duffy trial closely, up from 22% in the last wave. Worth noting, in Ontario 30% are following the trial closely, compared to 20% in Quebec. Attentiveness is highest at 37% in Atlantic Canada.

Slide34

In this wave, 7% believe Mr. Duffy acted appropriately, and 61% improperly, unchanged from our last wave. 8% think Nigel Wright acted properly, 53% improperly. 14% think the PM acted properly, 49% improperly.

duffy2

These results represent a net 2-point improvement for Mr. Duffy and a 3-point deterioration for Messrs. Harper and Wright compared to our last wave.

Three in ten voters say the Duffy trial will affect their vote – up 5 points since our last wave. Of those, 15% say it makes them more inclined to vote CPC, while 85% say it has the opposite effect.

Perhaps most important is the effect of the trial on those who are leaning for or against wanting change in this election. Among those who are inclined but not passionately for change, 20% say the Duffy trial makes them less likely to vote CPC. Among those who are softly inclined to want the Conservatives back in office, 15% say the Duffy trial makes them less inclined to vote CPC.

duff2

The Upshot

If more evidence was needed that it is premature to draw conclusions about how this election will turn out, this wave of results reinforces that point. The NDP enjoys the largest potential support, but also has been attracting the challenging scrutiny that comes with front-running status.

The numbers show that any party can win this election, and that Canadians themselves are quite uncertain which party will come out on top, something that could make for a more engaging election and possibly even a higher turnout on Election Day.

The Duffy trial has been a cloud hanging over the Conservatives, making those inclined to want change to feel even more inclined that way, and some of those who had been inclined to want a fourth Conservative mandate to feel less motivated to support Mr. Harper.

A sizeable proportion of Conservative leaning voters believe that the Prime Minister acted inappropriately. This means that every time he maintains that he did nothing untoward, he is saying something only a quarter of his supporters believe. An equal number don’t believe him, and half put themselves on the fence.

Whether the Duffy trial remains a factor in this campaign is uncertain, now that the trial has is recessed until after the election. For the Conservatives, who have the smallest potential pool of voters, they must now redouble their efforts to motivate and energize supporters, while trying to weaken the broad instinct towards change.

For the Liberals and the NDP, the situation is clear: neither can win without winning votes that the other is counting on or hoping for.

Methodology

Our surveyed, commissioned by Abacus Data, was conducted online with 1,500 Canadians aged 18 and over from August 26 to 28, 2015. A random sample of panelists was invited to complete the survey from a large representative panel of over 500,000 Canadians, recruited and managed by Research Now, one of the world’s leading provider of online research samples.

The Marketing Research and Intelligence Association policy limits statements about margins of sampling error for most online surveys. The margin of error for a comparable probability-based random sample of the same size is +/- 2.6%, 19 times out of 20. The data were weighted according to census data to ensure that the sample matched Canada’s population according to age, gender, educational attainment, and region. Totals may not add up to 100 due to rounding.

Abacus Data Inc.

We offer global research capacity with a strong focus on customer service, attention to detail and value added insight. Our team combines the experience of our Chairman Bruce Anderson, one of Canada’s leading research executives for two decades, with the energy, creativity and research expertise of CEO David Coletto, PhD.