Conservatives and Liberals locked in dead heat. Eve Adams defection reactions mixed.

Our latest nationwide polling explored a number of topics, which we will post over the next week. For this initial release, we look at the headline numbers as well as reactions to the high profile floor crossing of MP Eve Adams.
Our findings:
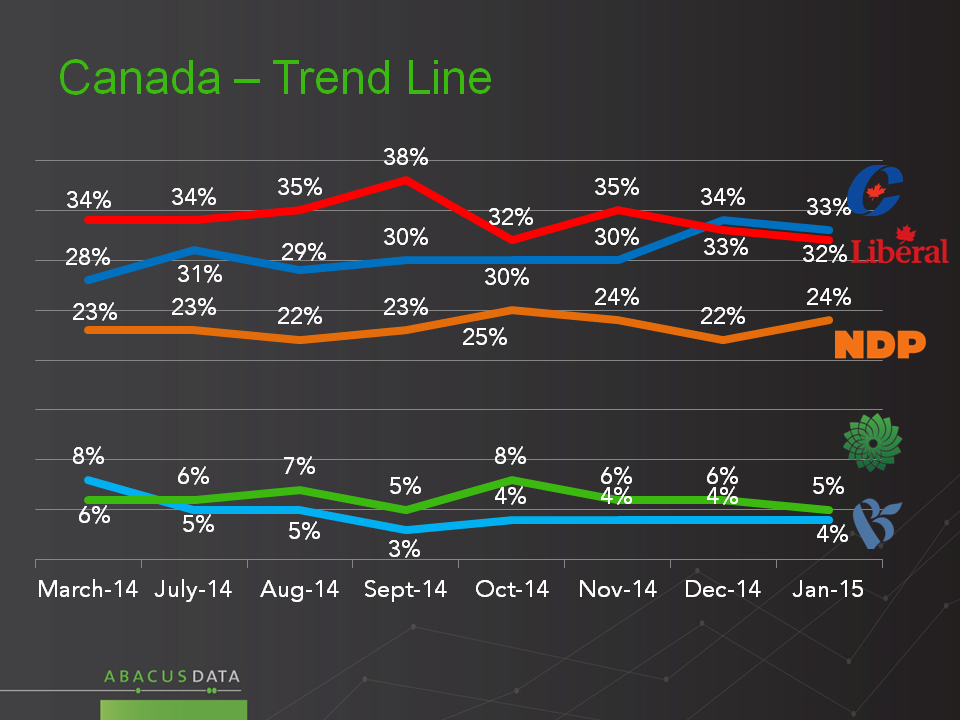
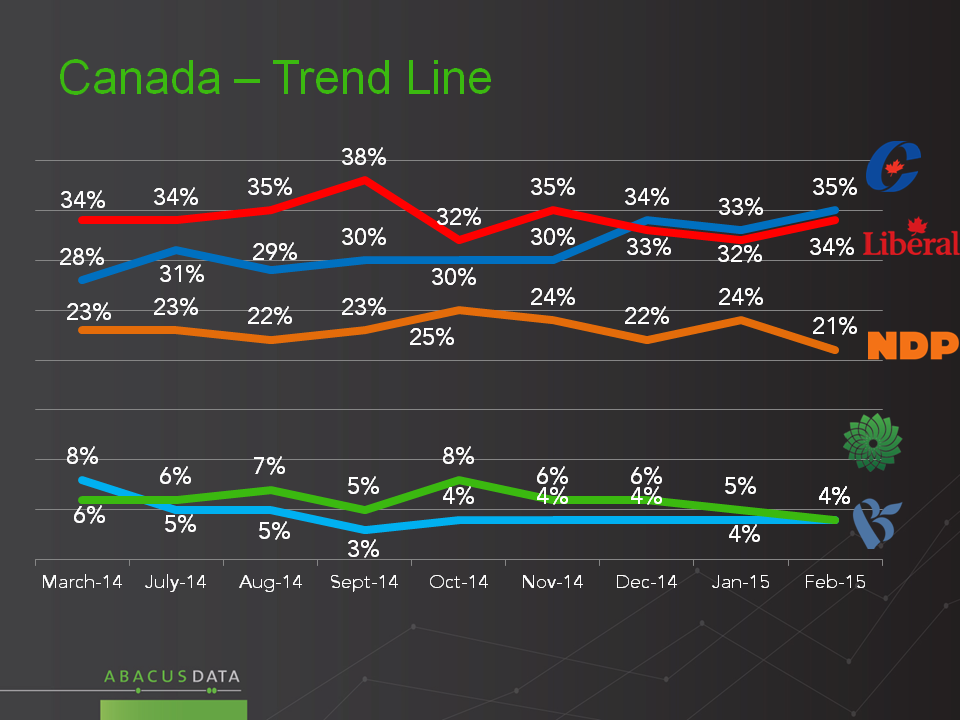
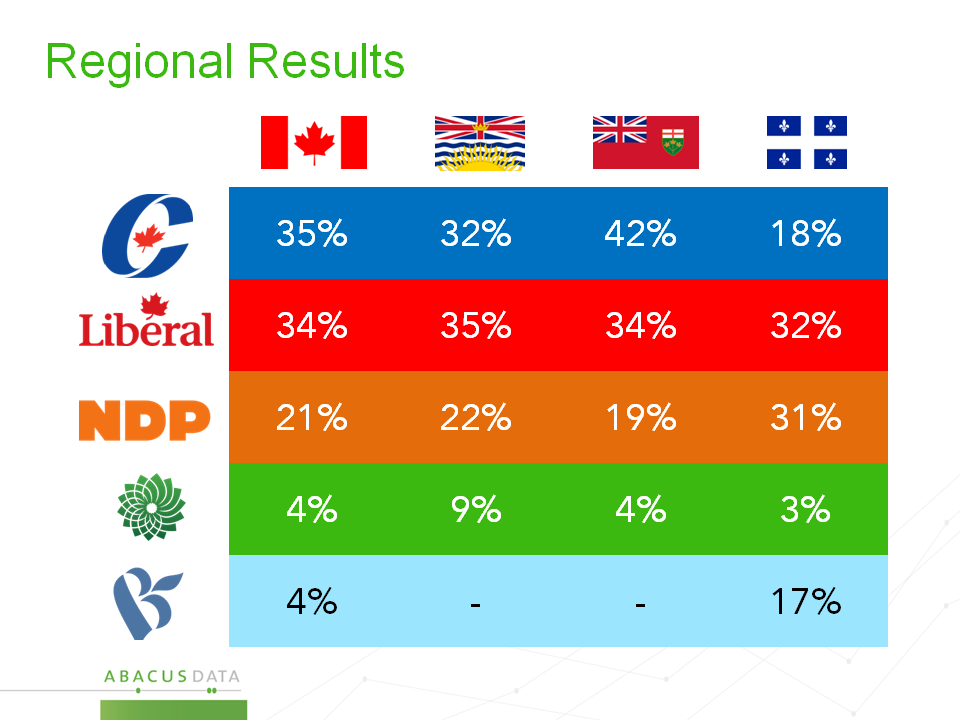
Across Canada, 35% of decided voters in our sample would vote Conservative, 34% Liberal, and 21% NDP. The Green Party polls at 4% nationwide and 9% in BC. The BQ is at 17% in Quebec. This is largely unchanged from our previous poll in January which had the Conservatives at 33% and the Liberals at 32% and the NDP at 24%.
Based on the sample size (1,460) there is a 65% chance that the Conservatives are leading the Liberals. Based on the confidence interval, the Conservatives could be leading by as much as six points while the Liberals could be leading by as much as four points.
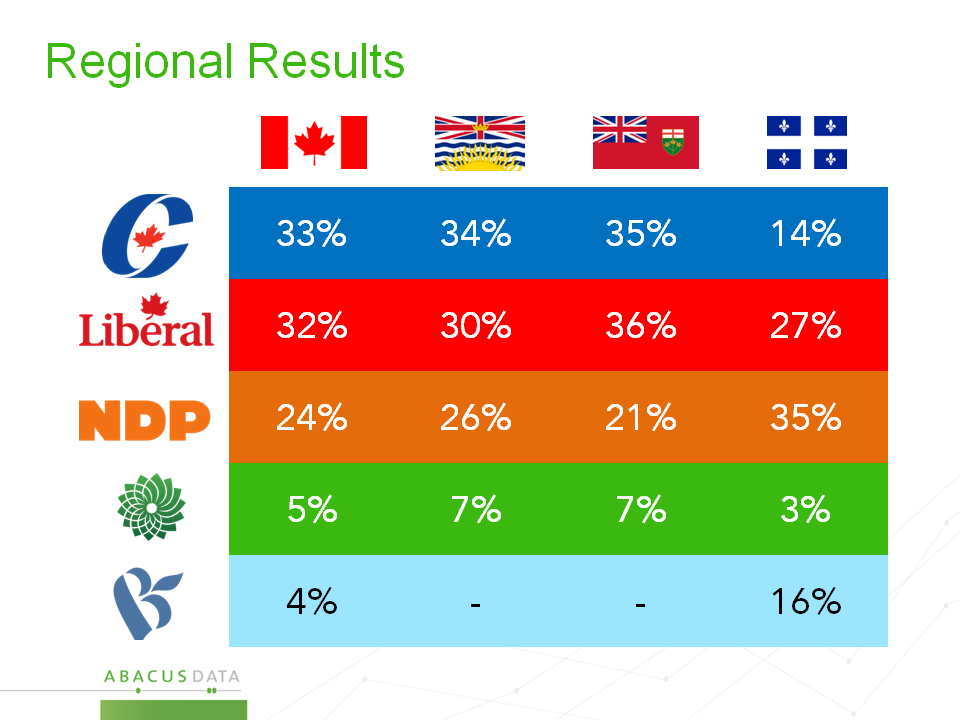
In the three most critical provincial races, results continue to show tight competition involving the three national parties. In BC, we see the Liberals with 35%, followed by the Conservatives at 32% and the NDP at 21%. In Ontario, the Conservatives have a lead with 42%, followed by the Liberals at 34% and the NDP at 19%. In Quebec, the Liberals are at 32%, the NDP 31% and the Conservatives have climbed to 18%.
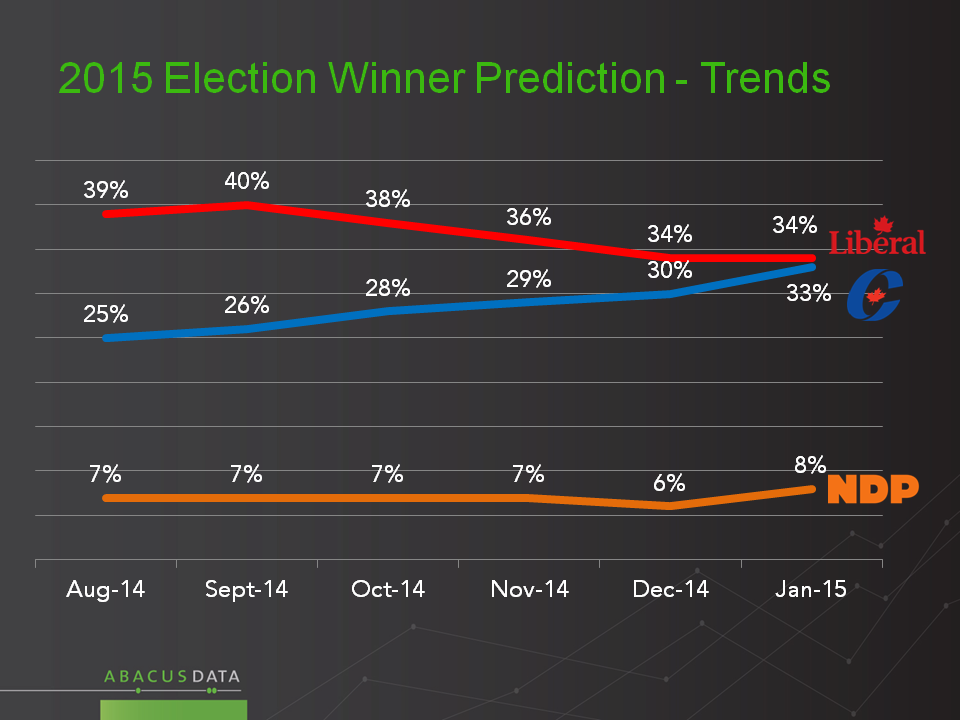
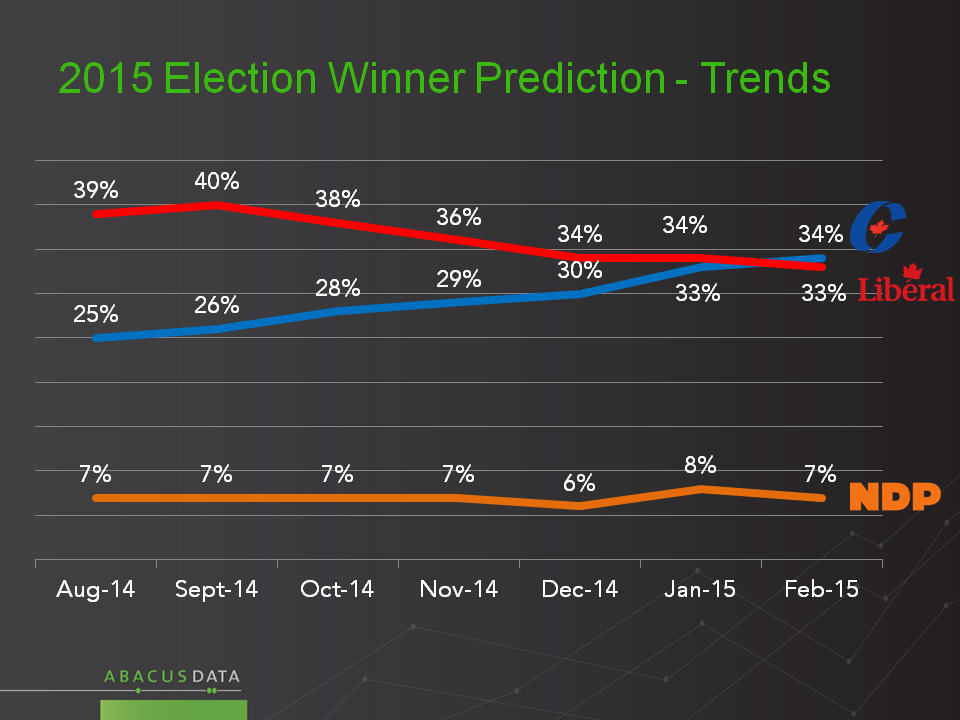
Asked to predict the winner of the next election, 34% say the Conservatives will win, 33% the Liberals. In August of last year, the Liberals were predicted to win by 39%, the Conservatives by 25%. A fairly steady 7% predict an NDP win.
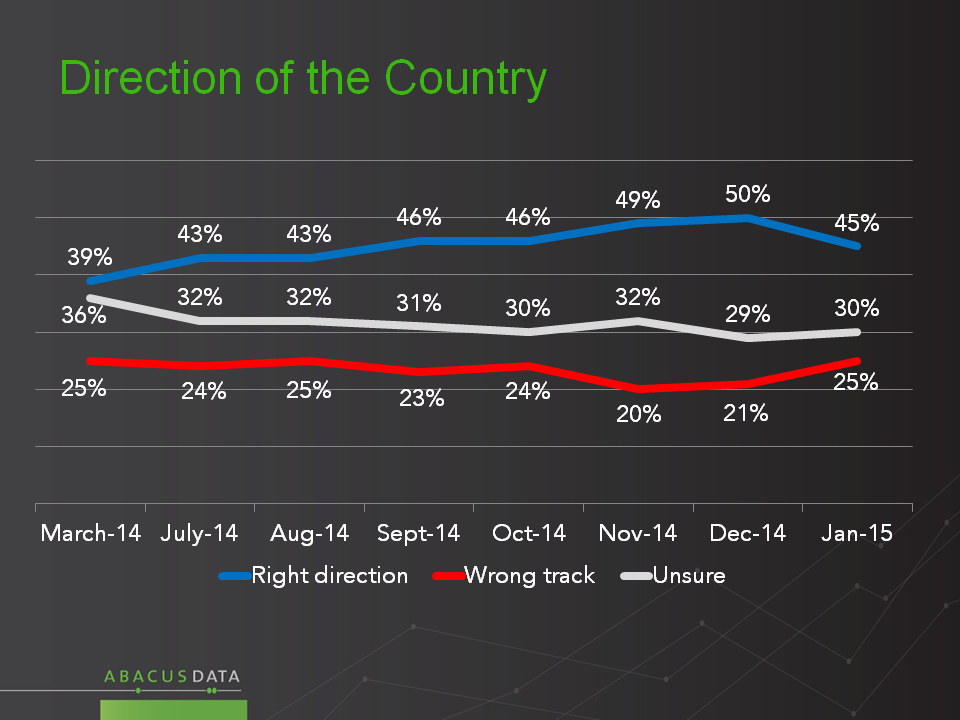
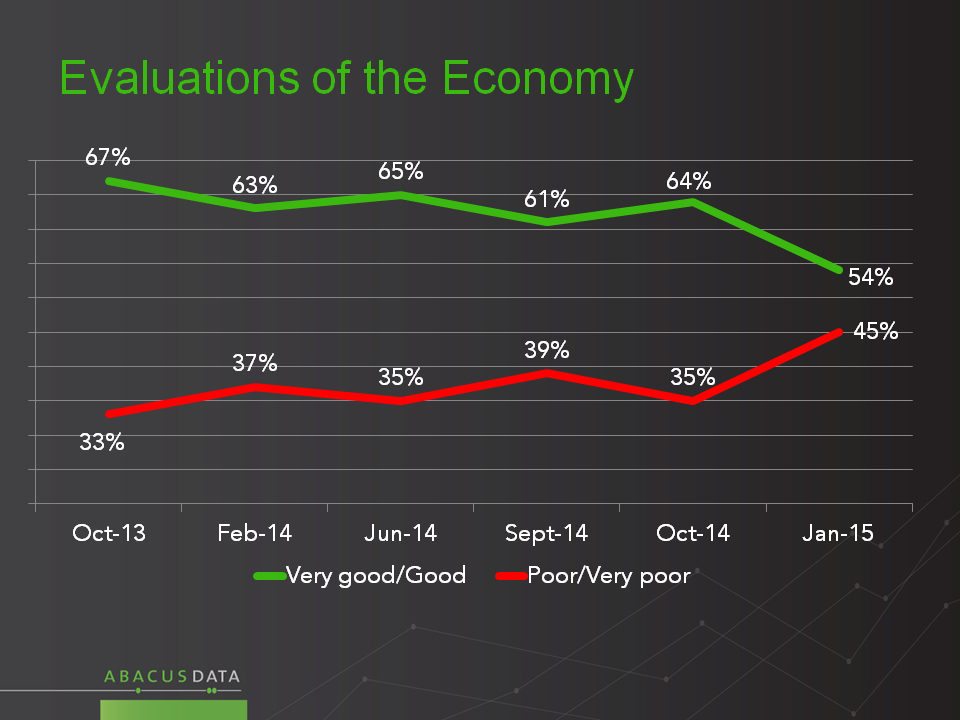
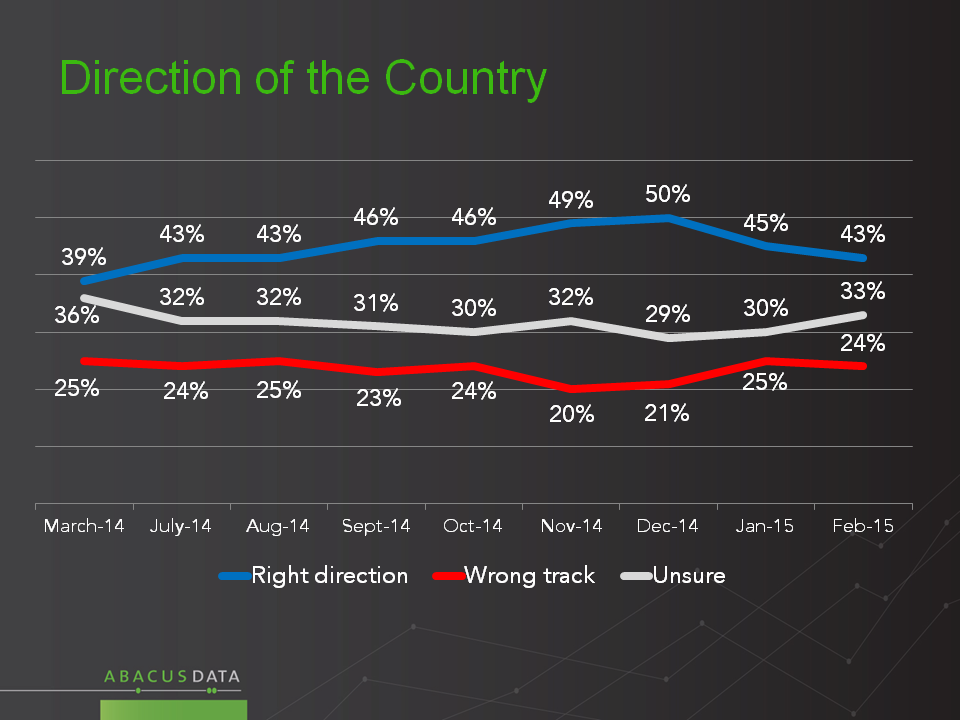
While some indicators have improved for the Conservatives in recent months, including voting intentions, in this latest survey we also see some softening of a few indicators. The number of people who say the country is heading in the right direction has slipped from 50% in December to 43% now.
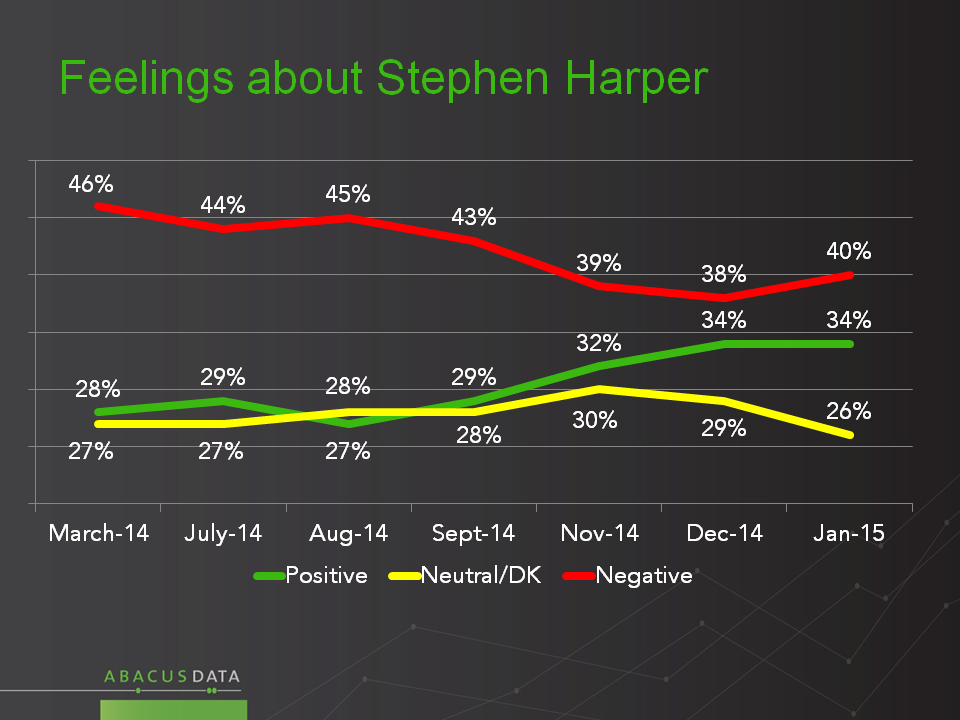
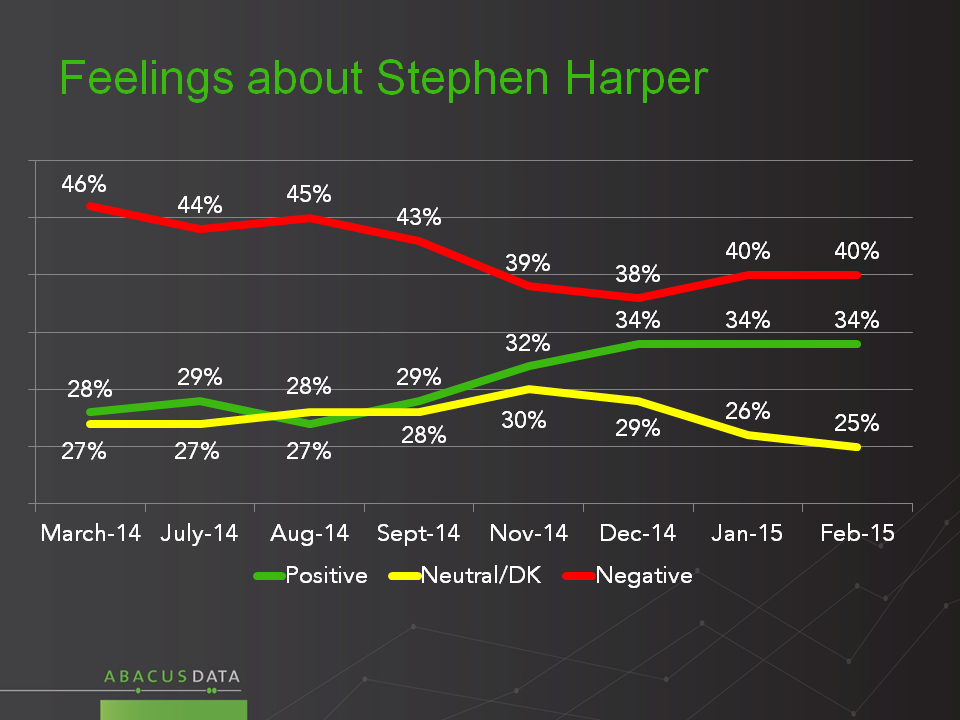
Feelings about Stephen Harper improved through the fall, and have been stable of late. As in January, our February survey shows the PM with 34% positive impressions and 40% negative.
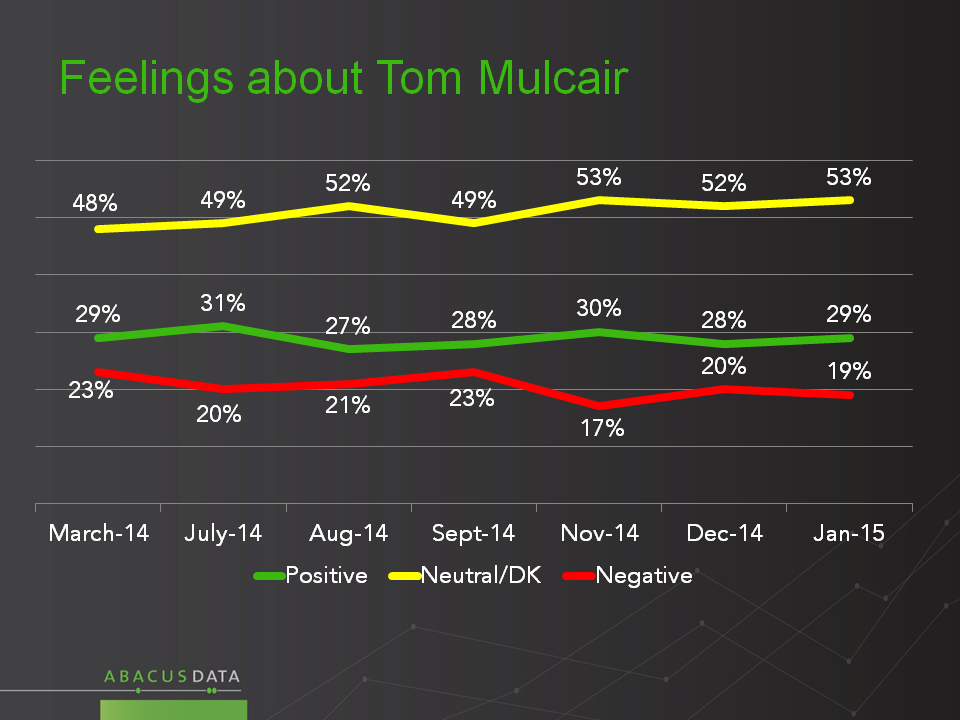
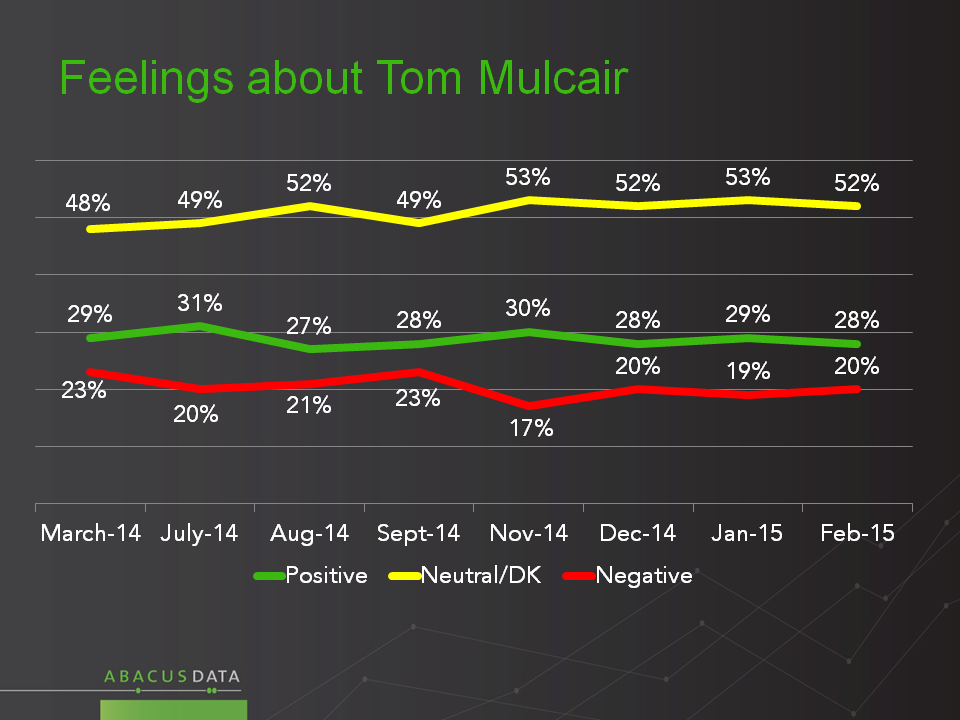
For Thomas Mulcair, results are also not shifting noticeably. He finds 28% positive and 20% negative impressions.
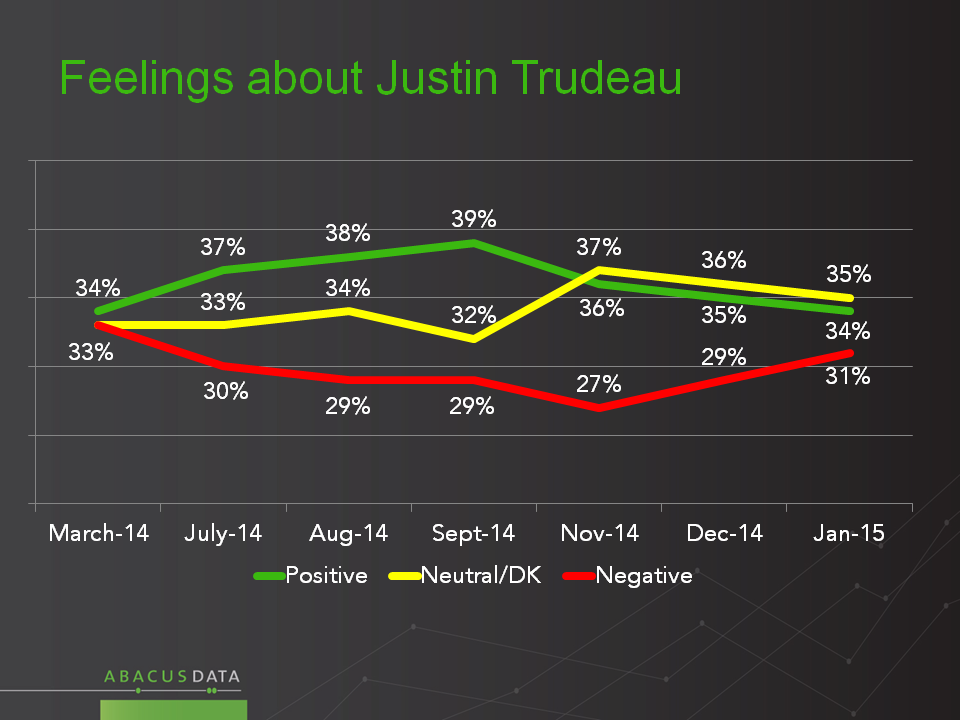
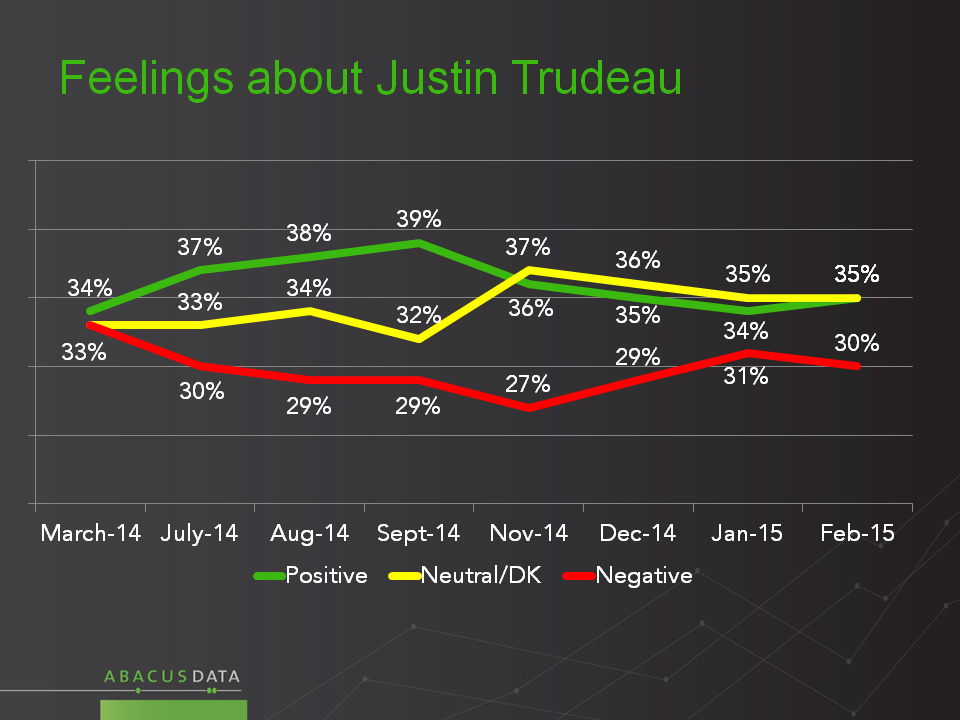
As for Justin Trudeau, the latest results are slightly better than last month’s. He finds 35% positive, 30% negative opinions. Mr. Trudeau’s negatives had risen from 27% to 34% between November and January, before dropping this month.
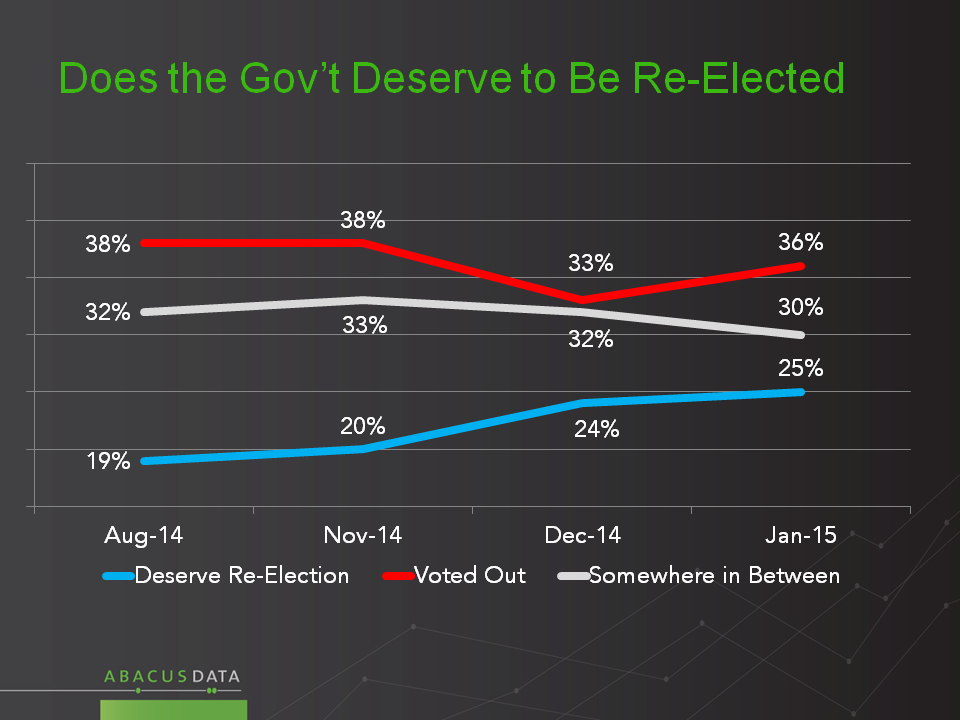
This month, 24% say the government has governed well enough that it deserves to be re-elected, 34% say poorly enough that it deserves to be voted out of office, and 31% find themselves “in between these two points of view”. These numbers are a substantial improvement for the government over those found late last summer, when 38% said voted out, and 19% said re-elected.
The floor crossing decision of MP Eve Adams attracted considerable attention among political observers, and generated lots of commentary. Among the public, just over half 56% heard of this event.
Of those aware of the floor crossing:
28% said Ms. Adams made a bad decision, 33% said an “acceptable decision given her circumstances” and 16% said she made a good decision. Among CPC voters, 9% said “good” and 25% said “acceptable” decision. Among NDP voters, 20% said “good” and 36% said “acceptable”. Among LPC voters 25% said “good” and 44% “acceptable”.
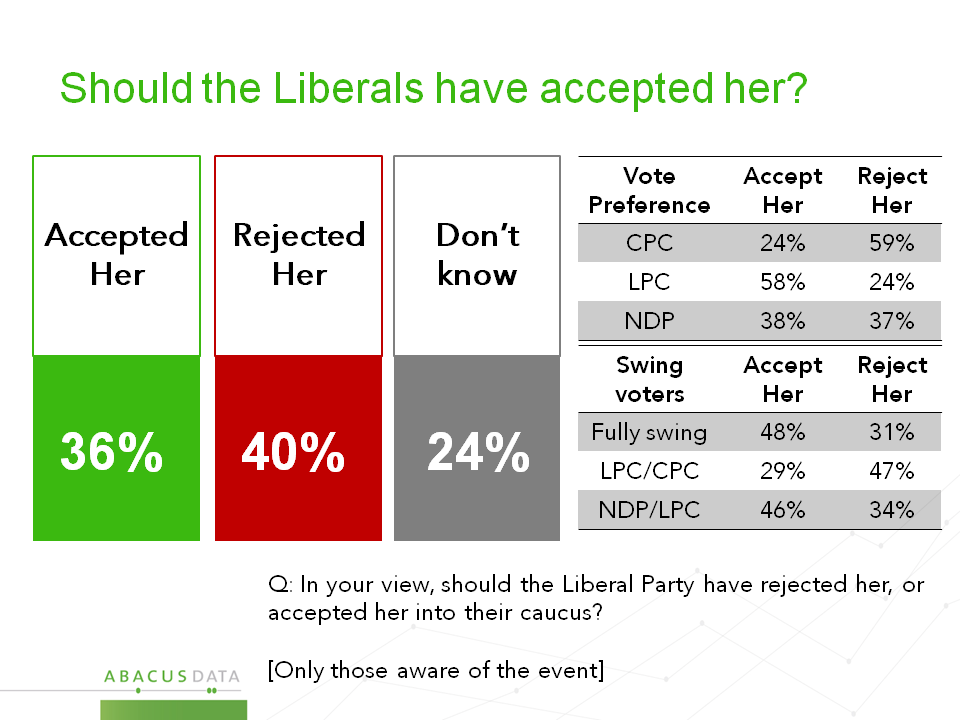
36% said the Liberal Party was right to accept her, while 40% said the Liberals should have turned her away. Among Liberals, the majority (58%) said the party was right to accept her, 24% said the opposite. NDP voters were evenly split (38%-37%). Among Conservatives 24% said the Liberals did the right thing, while the majority said she should have been rejected. Among swing voters, the plurality view (48%-31%) was in favour of accepting Ms. Adams rather than rejecting her.
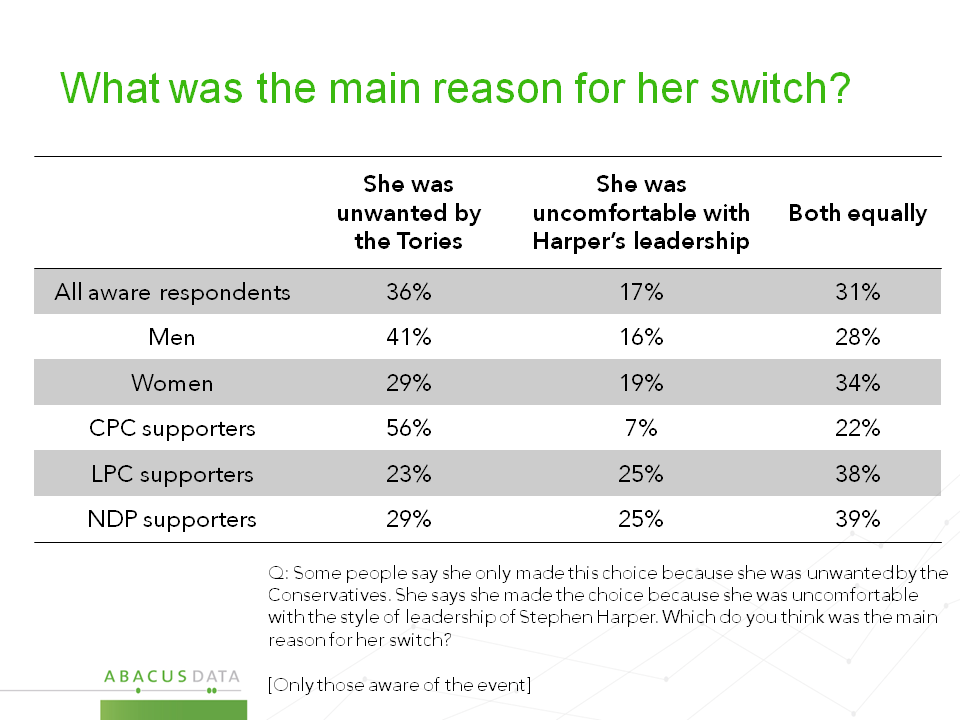
In terms of the motivation for her decision, we provided three possible scenarios: she was unwanted by the Conservatives, she was uncomfortable with Mr. Harper’s leadership, or both equally. 36% said the main reason was being unwanted by the Conservatives, 31% said both factors were equally involved, and 17% said the main driver was discomfort with the Prime Minister’s leadership.
Women as well as NDP and Liberal supporters were more likely than average to believe that discomfort with the PM was at least partly a motivating factor. Conservative voters were inclined to believe the main reason was being unwanted (56%) although a total of 29% imagined that her feeling about the PM was an equal or greater factor.
The Upshot?
According to Abacus Chairman Bruce Anderson:
For the Conservatives, these results are the latest indication of improving competitiveness, including in Quebec and Ontario. We have seen numbers swing back and forth a bit in Ontario in some of our more recent unpublished polls, which underscores the value of studying aggregations and averages over time rather than trying to provide seat projections at this time.
The Liberal Party can see mixed news in these results. While the recent softening of impressions of Mr. Trudeau has not continued this month, the consistent and substantial lead they enjoyed for many months has been replaced by a dynamic and competitive situation. They will have to beat a competitive Conservative Party if they are going to win an election this year. Overall levels of anger towards the government are modest, especially for a government that has been in office for this length of time. Roughly a third of likely voters remain to be persuaded of the case for change or against change.
The situation for the NDP remains largely unchanged. They are highly competitive in Quebec, but are having trouble gaining momentum in other parts of the country. Few see them as a likely winner of the next election, which means continued risk of strategic voting working to the advantage of the Liberals.
On the Eve Adams decision, it seems unlikely that this episode will have a major lingering effect on public opinion. While many political commentators had strong views, almost half of the public did not notice the story, and among those who did, opinions seem rather mixed. While there isn’t much evidence of enthusiasm for the outcome among Liberals, neither is there a great deal of outrage.
Methodology
Our survey was conducted online with 1,460 Canadians aged 18 and over from February 12 to February 16, 2015. A random sample of panelists was invited to complete the survey from a large representative panel of Canadians, recruited and managed by Research Now, one of the world’s leading provider of online research samples.
The Marketing Research and Intelligence Association policy limits statements about margins of sampling error for most online surveys. The margin of error for a comparable probability-based random sample of the same size is +/- 2.6%, 19 times out of 20. The data were weighted according to census data to ensure that the sample matched Canada’s population according to age, gender, educational attainment, and region. Totals may not add up to 100 due to rounding.
We offer global research capacity with a strong focus on customer service, attention to detail and value added insight. Our team combines the experience of our Chairman Bruce Anderson, one of Canada’s leading research executives for two decades, with the energy, creativity and research expertise of CEO David Coletto, PhD. For more information, visit our website at http://www.abacusdata.ca/
In case you missed it, here are some of our recent releases:
Economic anxiety on the rise; Canadians want pragmatic policy making
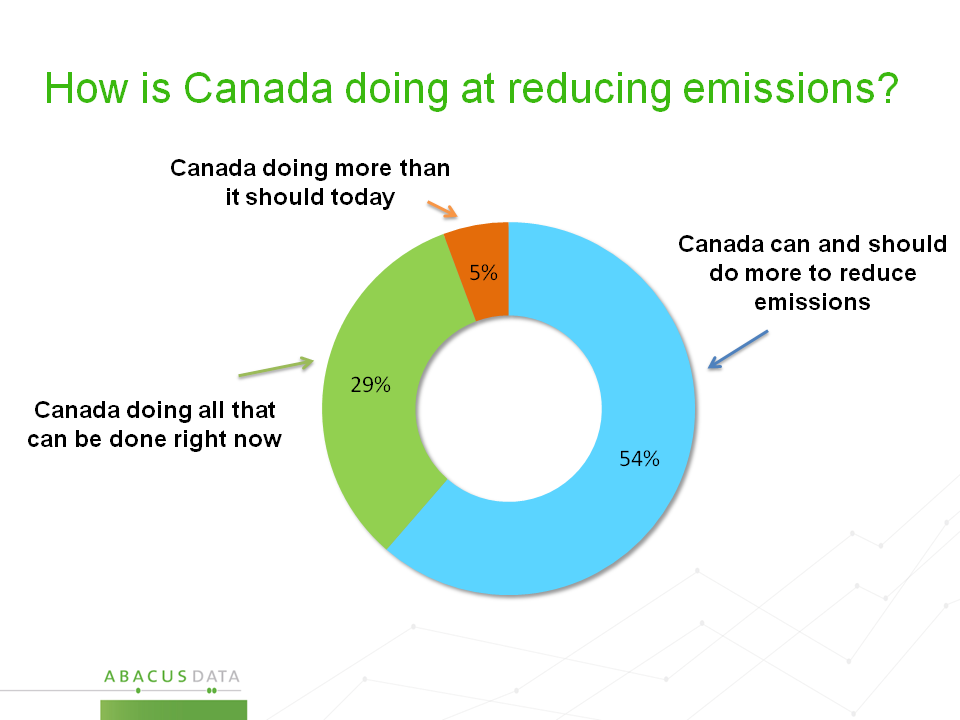
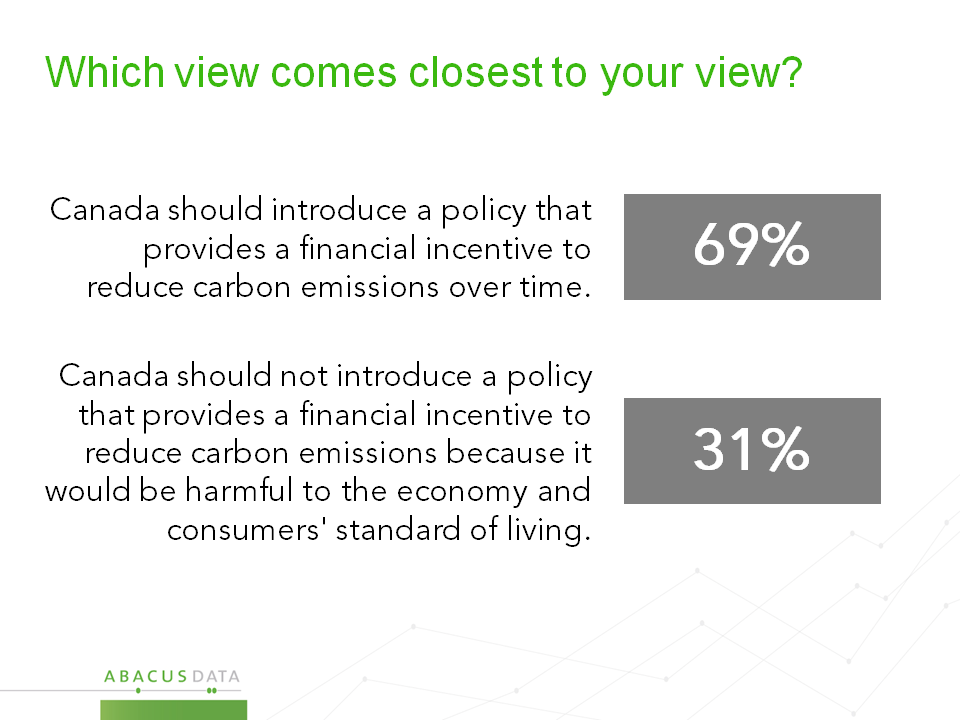
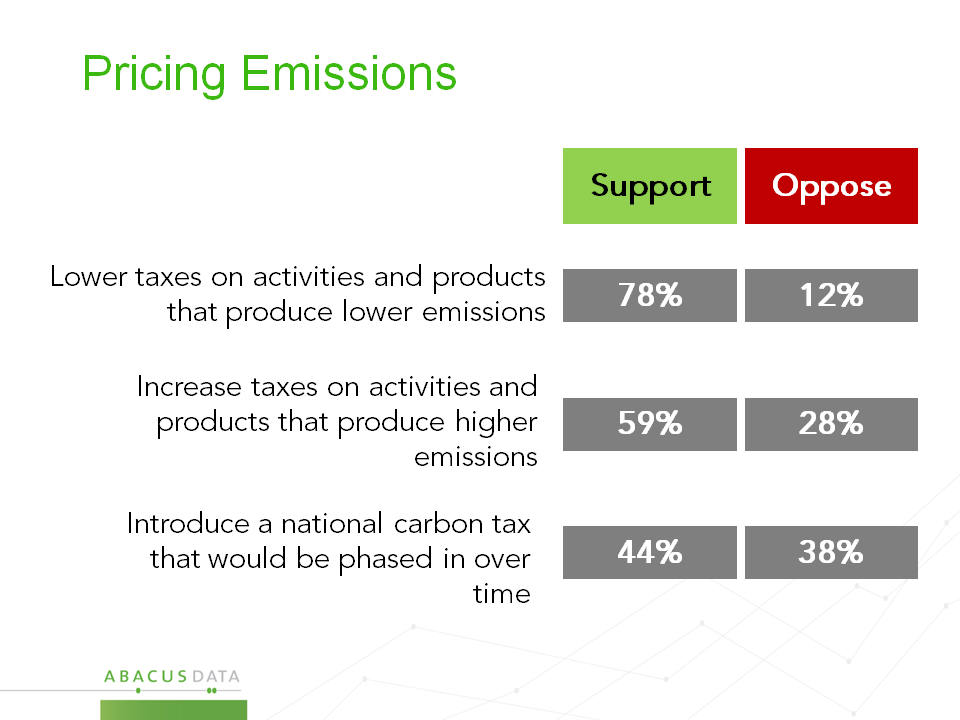
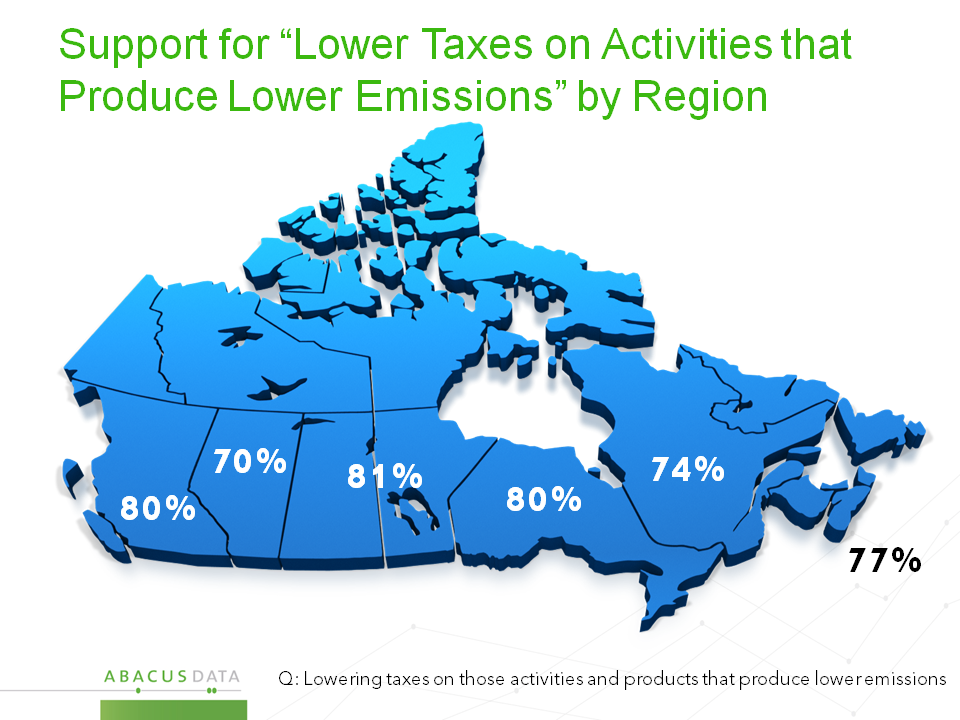
Should carbon be priced? Should public opinion decide pipelines?