Has Canada been worth it? Views on leaving Confederation
In our most recent national survey of 1,500 Canadian adults, we asked respondents about whether being part of Canada has been a good or bad thing for their province and whether they would vote to leave or stay in Canada if given an option to do so. Here’s what we found:
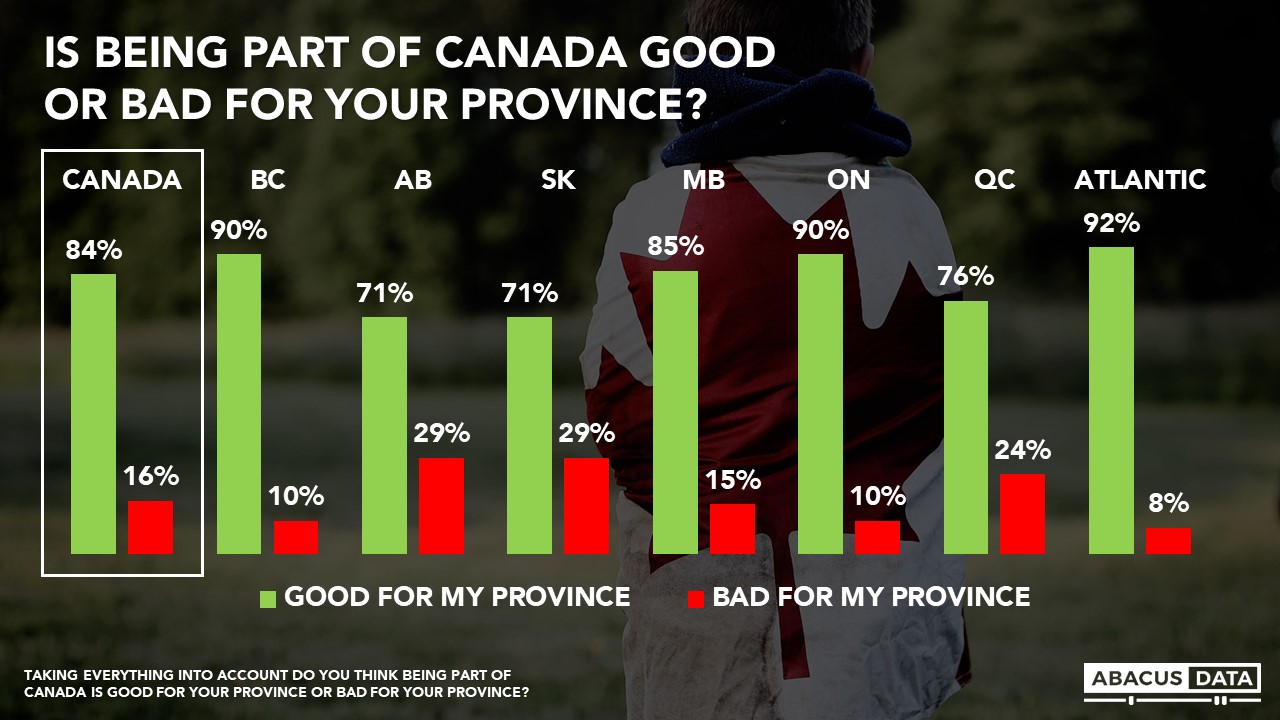
84% SAY CANADA HAS BEEN GOOD FOR THEIR PROVINCE
The vast majority of Canadians (84%) believe that being part of Canada has been good for their province. Younger Canadians are the most enthusiastic, but almost eight in 10 of those over 60 are convinced that the benefits of their province being in Canada have been greater than the drawbacks.
BC (90%), Ontario (90%) and Atlantic Canada (92%) pull the national average up. Three-quarters of Quebecers think being part of Canada has been good for La Belle Province.
But today, Alberta and Saskatchewan lead the country in terms of dissatisfaction: 29% in each province say being part of Canada has been bad for their province. However, a sizeable majority in those provinces believe Canada has been a net positive.
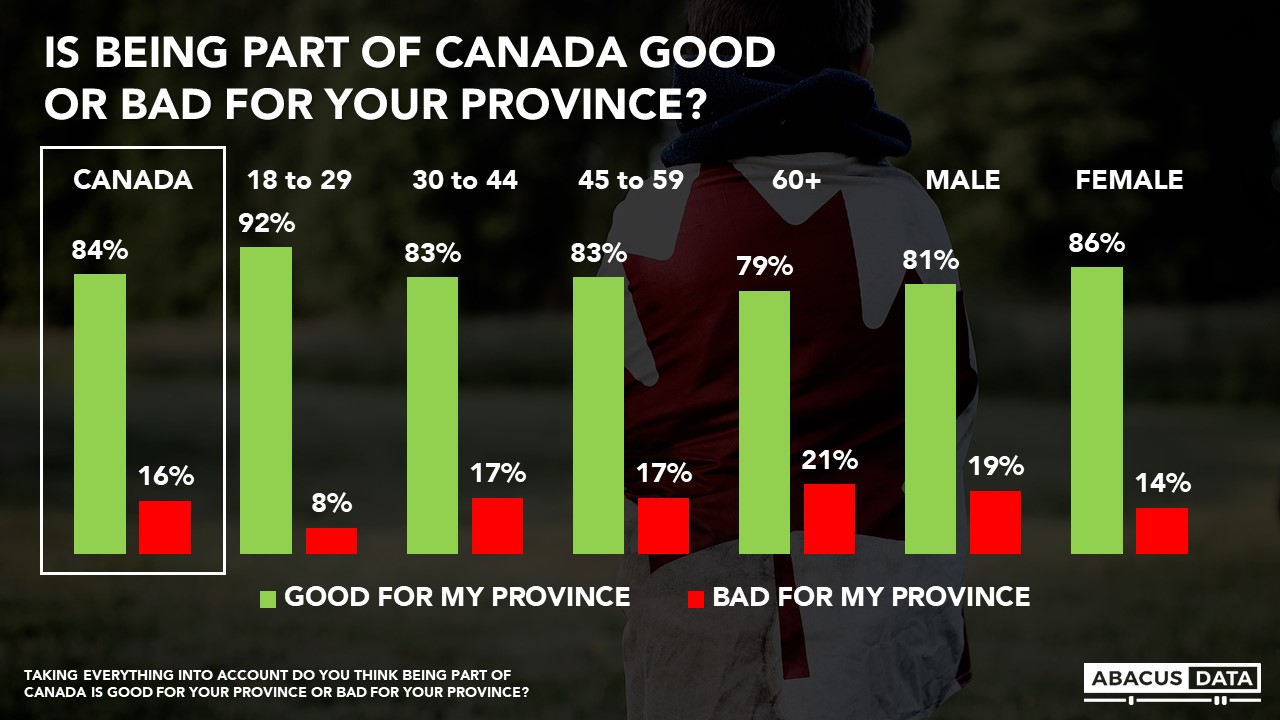
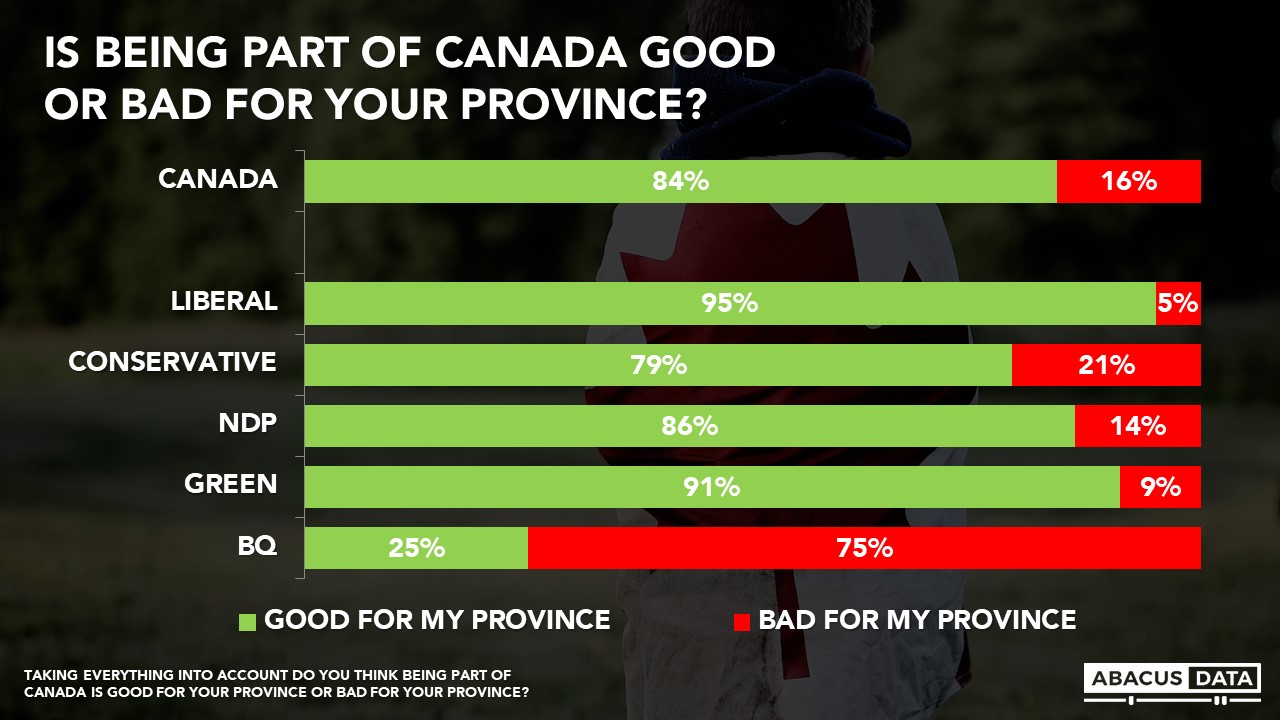
Conservatives are the least satisfied (79%) while supporters of the NDP (86%), the Green Party (91%) and the Liberal Party (95%) are most positive.
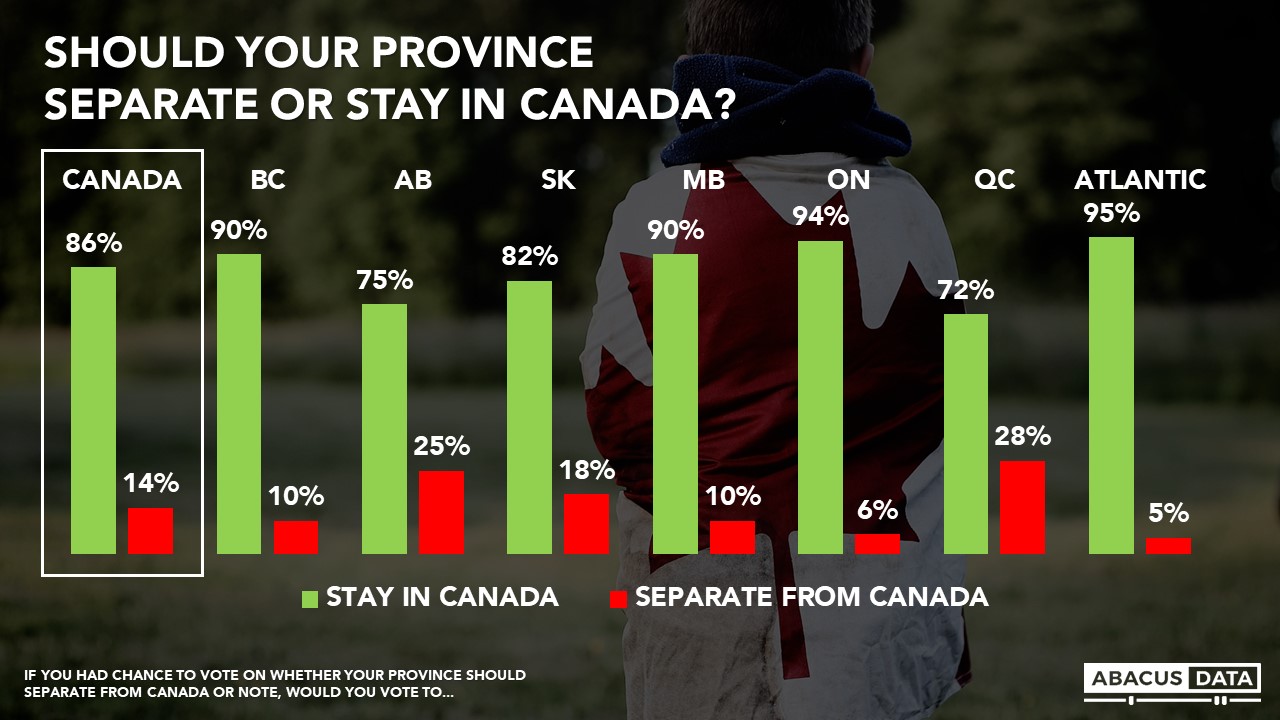
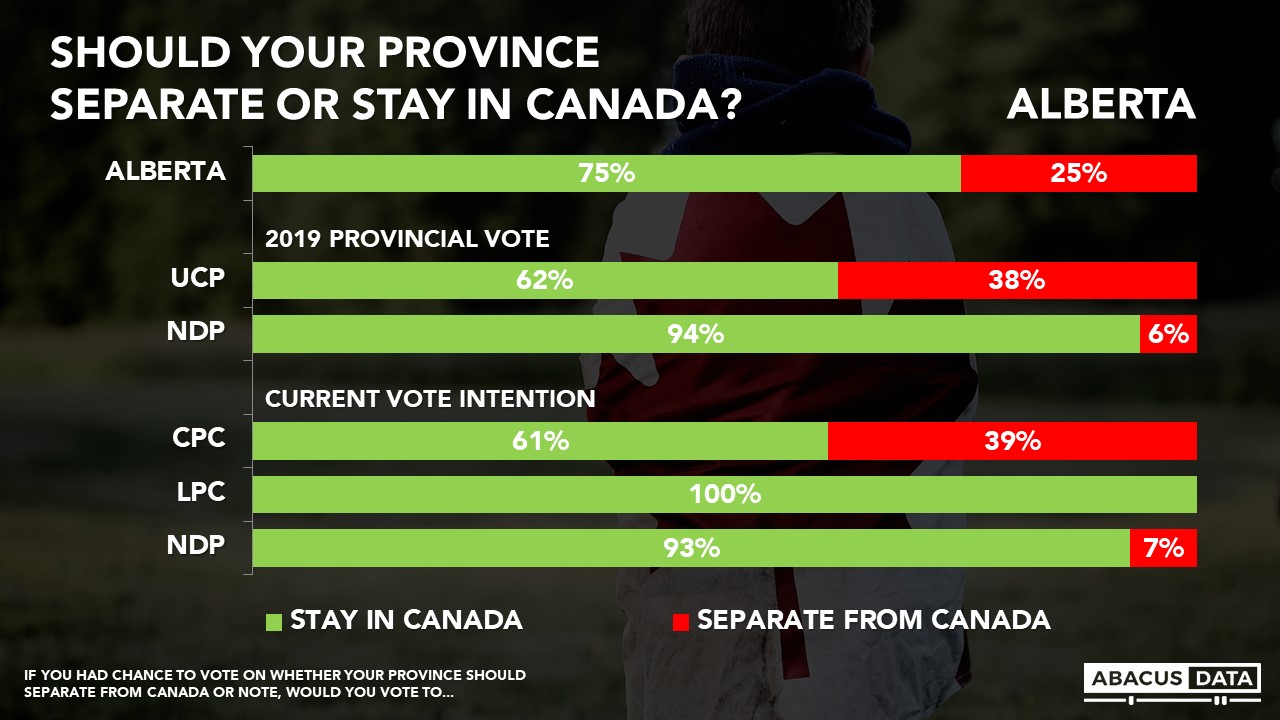
JUST 14% WOULD VOTE TO LEAVE CANADA; 25% IN ALBERTA, 28% IN QUEBEC
Relatively few Canadians (14%) say they would vote for their province to separate. In Quebec, where there have been two referendums (one of which found 40%, the other 49% support for separation), the number of people who say they would currently vote to separate stands at 28%.
In Alberta, one in four (25%) would vote to separate, while 75% would reject this idea. In Saskatchewan, 18% would vote to leave.
Support for separating from Canada is much lower in other parts of the country: 10% in Manitoba, 10% in BC, 6% in Ontario, and 5% in Atlantic Canada.
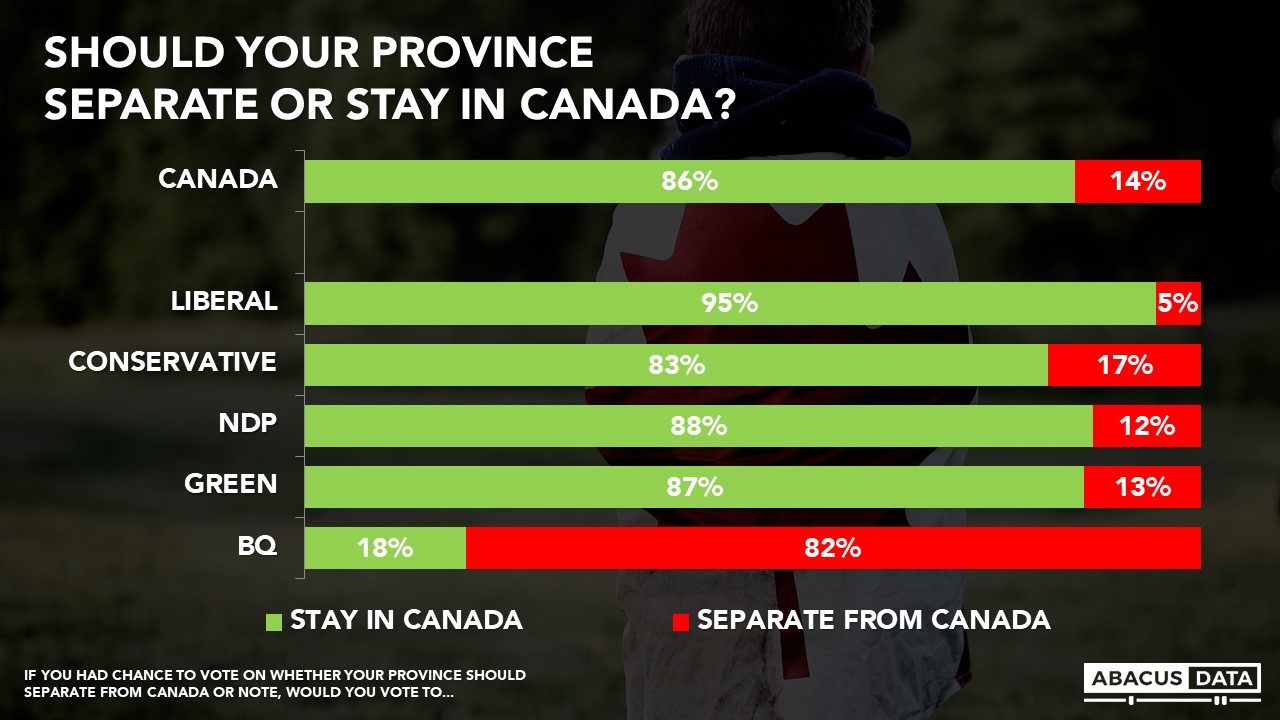
Within Alberta, those who would vote to separate from Canada tend to be supporters of the United Conservatives provincially and the Conservative Party federally. Having said that, a majority of both parties’ supporters say they would vote to remain rather than exit.
WESTERN VS QUEBEC SEPARATISM
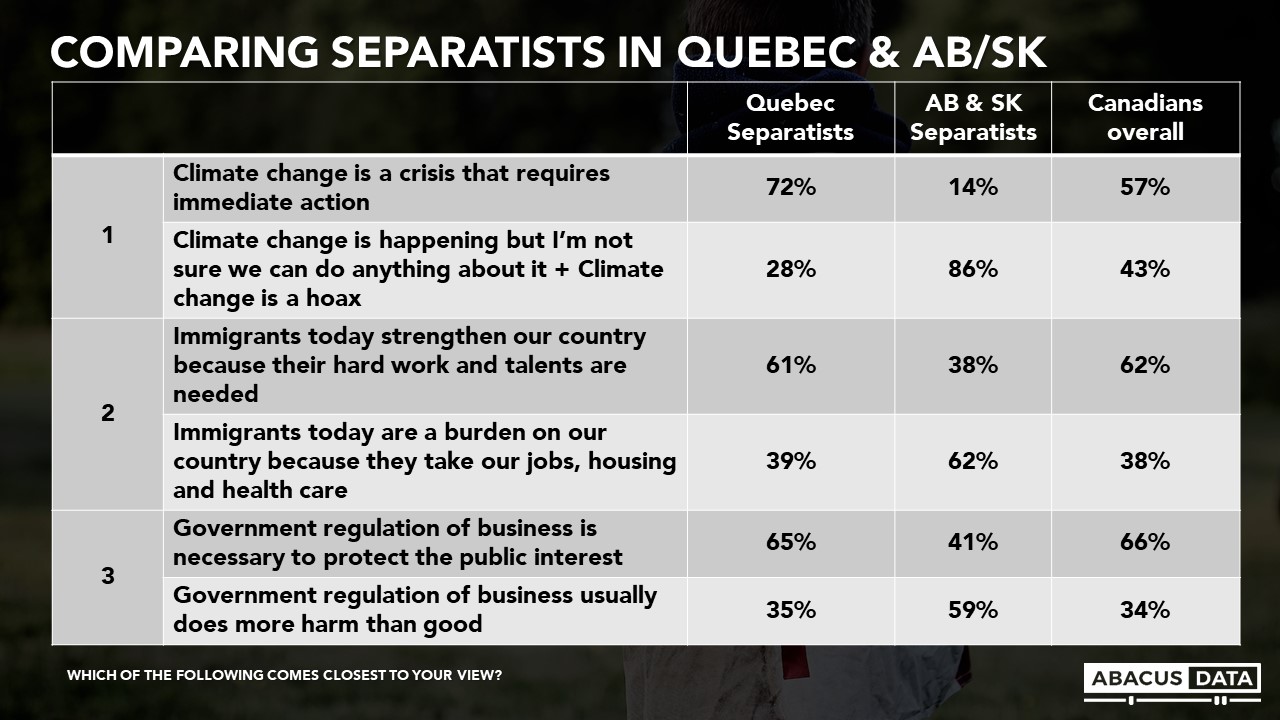
Separatists in Quebec and Alberta/Saskatchewan are different attitudinally.
Quebec separatists see climate change as a crisis while Western separatists (in this case meaning Alberta and Saskatchewan) tend to see climate change as something we can’t do anything about, or a hoax.
The majority of Western separatists see immigrants as a burden, while the majority of Quebec separatists see immigrants as a factor that strengthens the country.
Most Quebec separatists say regulation of business is necessary to protect the public interest while most Western separatists say government regulation of business usually does more harm than good.
Note: Sample sizes of both groups of separatists is small but the differences are statistically significant.
IF NOT CANADA, WHAT ABOUT JOINING THE UNITED STATES?
Only a fraction of Canadians (8%) say they would vote for their province to join the United States if they had the option to do so. In Quebec, Ontario, and Atlantic Canada, 6% or less would join the US. In Alberta, 17% would vote to join the United States. Conservative Party supporters (14%) are more likely than Liberals (3%) or NDP voters (7%) to support this idea.
UPSHOT
According to Bruce Anderson: “The state of unity within Canada is overall fairly positive, and nationalist separatism in Quebec seems to have ebbed over recent years.
The conversation about Alberta separatism that has been in the news lately clearly has some roots within the province, but it is very much a minority view at the moment and almost exclusively within the UCP and federal Conservative Party voter group.
Most people in Alberta don’t believe that Canada has been a bad deal for the province, including most of those who voted for Jason Kenney and most of those intending to vote for Andrew Scheer. There are political hazards in stoking resentment: while a minority of Alberta conservatives cheer talk about separation; for most, it’s a project they reject.
As for joining the US, people may see the US as having virtues – but they see more here.”
According to David Coletto: “Regionalism has always been part of the Canadian political experience, and that continues today, three months before the 2019 federal election. The threat of Quebec separatism is fairly low, and although 1 in 4 Albertans would vote to leave Canada, it is not at a level to cause serious concern.
What’s most striking about these results is the attitudinal differences between separatists in Quebec and those in Alberta and Saskatchewan and how they compare to the rest of Canada. Quebec separatists share many of the same broad policy and issue positions as Canadians in general. Their desire for independence is historical and rooted in a shared civic and, to some extent, ethnic nationalism.
For Alberta and Saskatchewan residents who would vote to leave Canada, the push seems to be more about how different their views and ideologies are compared to other Canadians, and less about what is shared among them.”
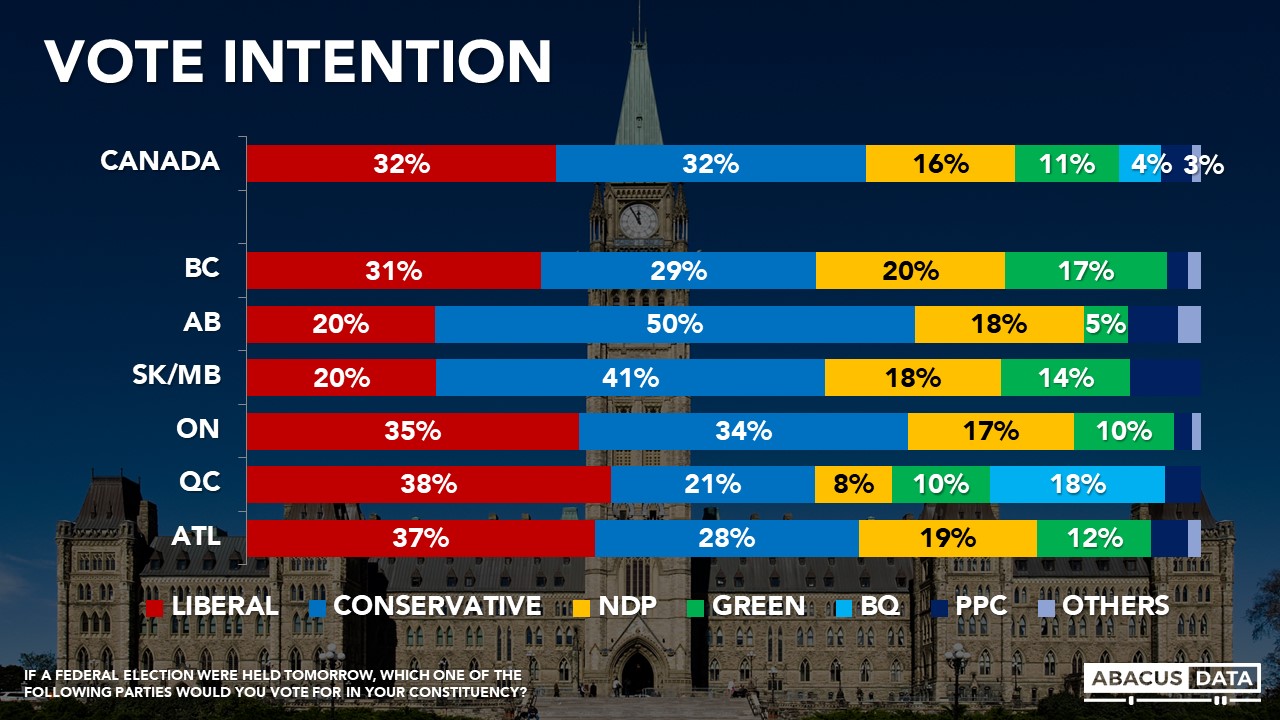
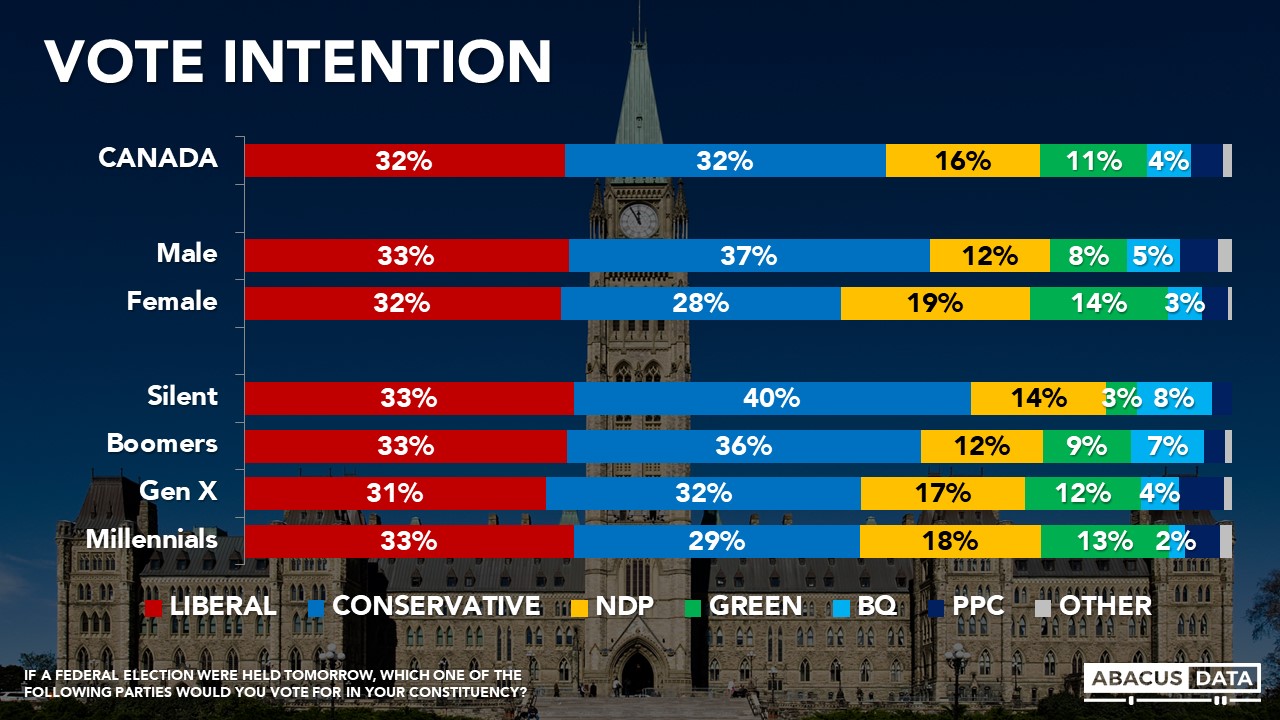
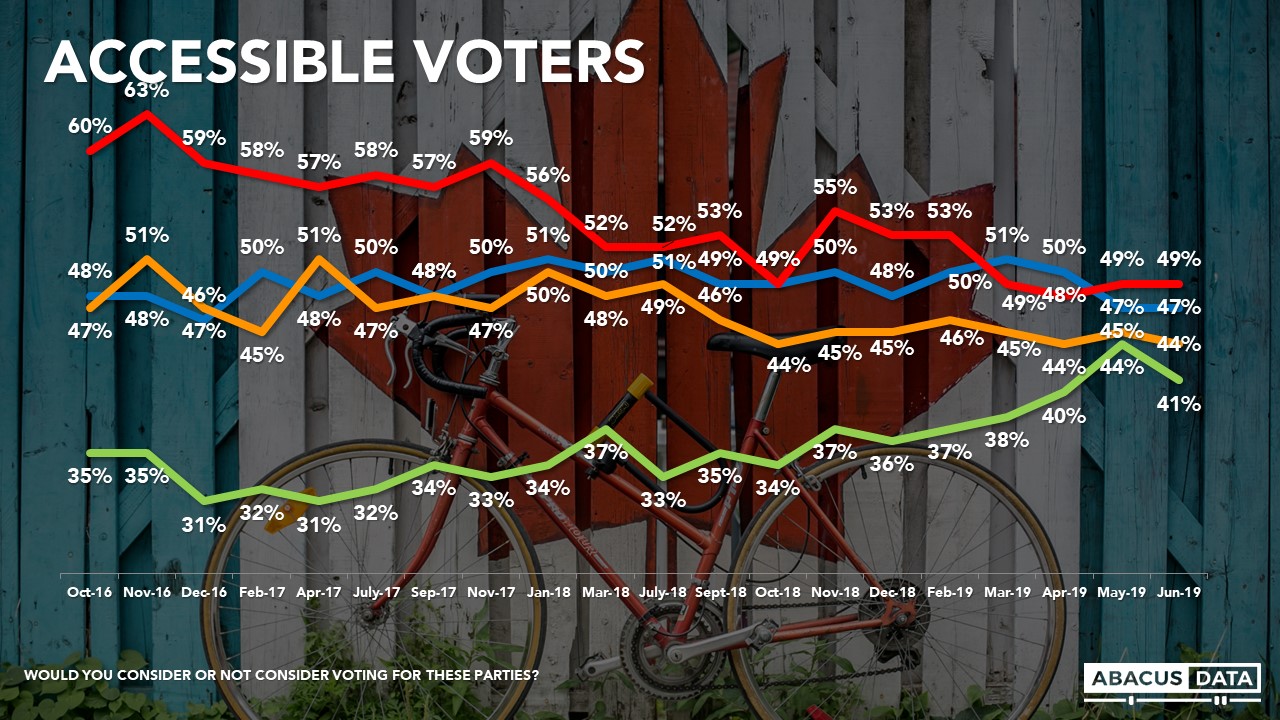
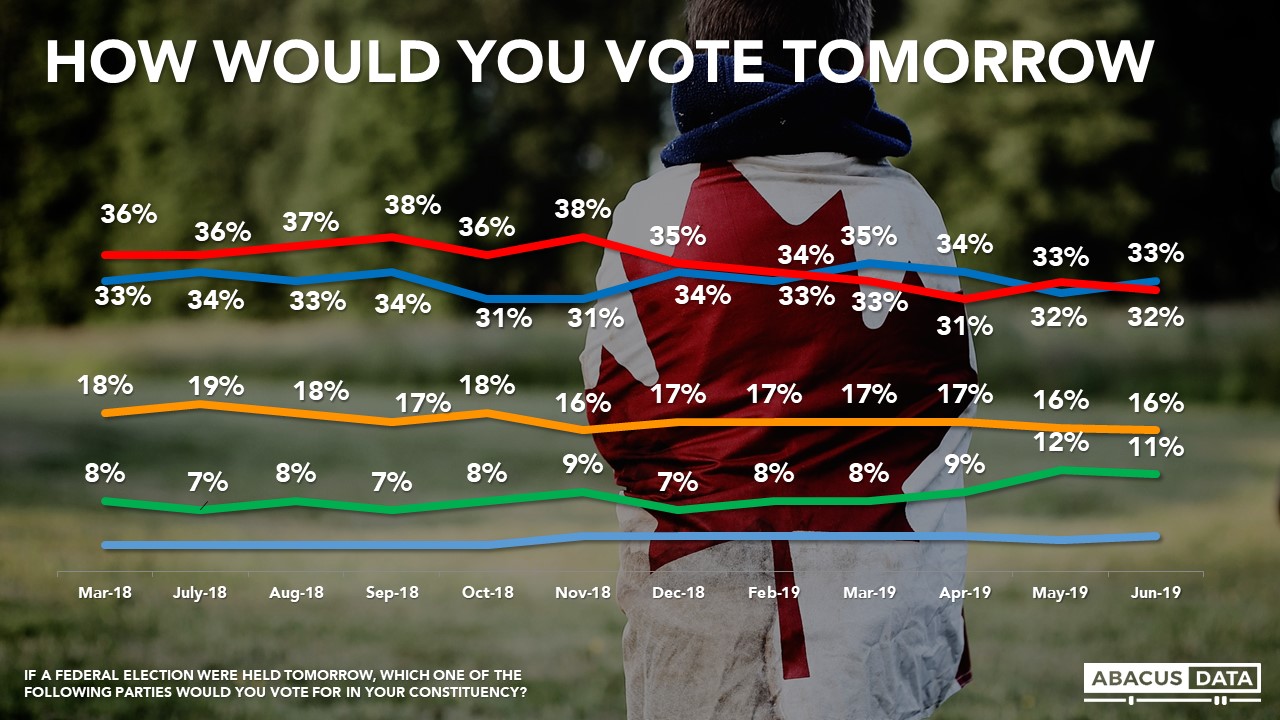
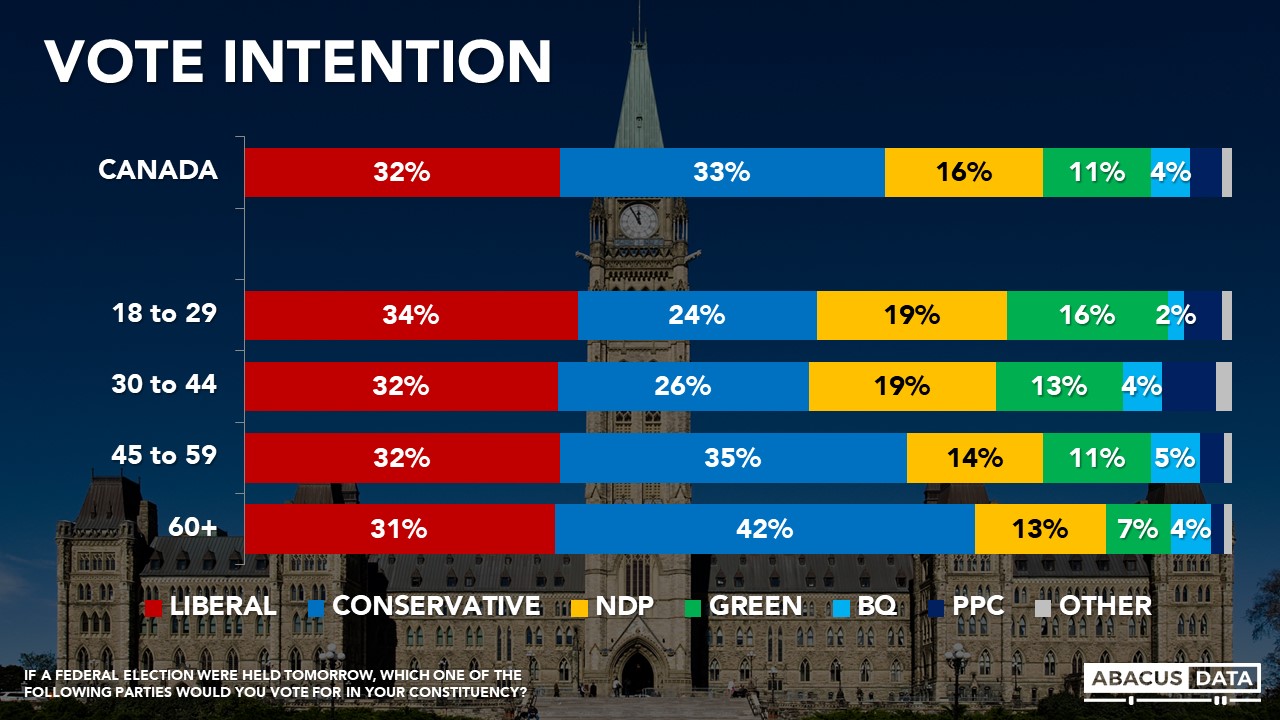
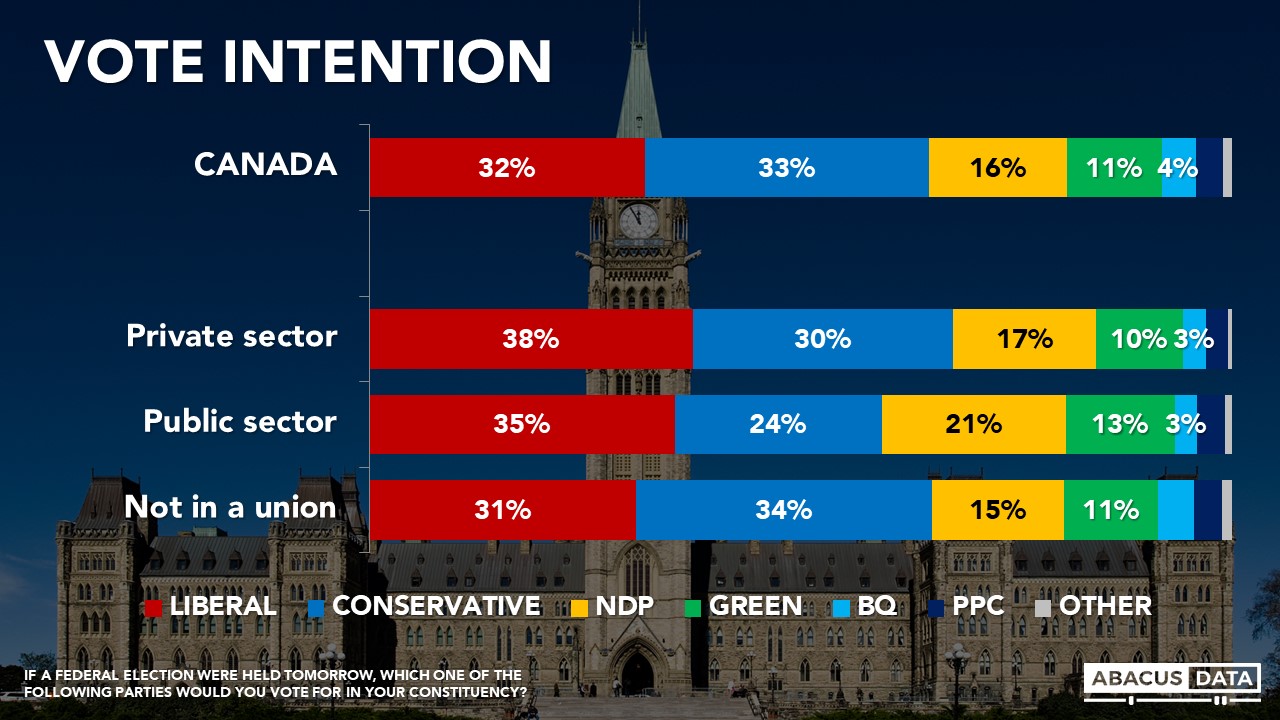
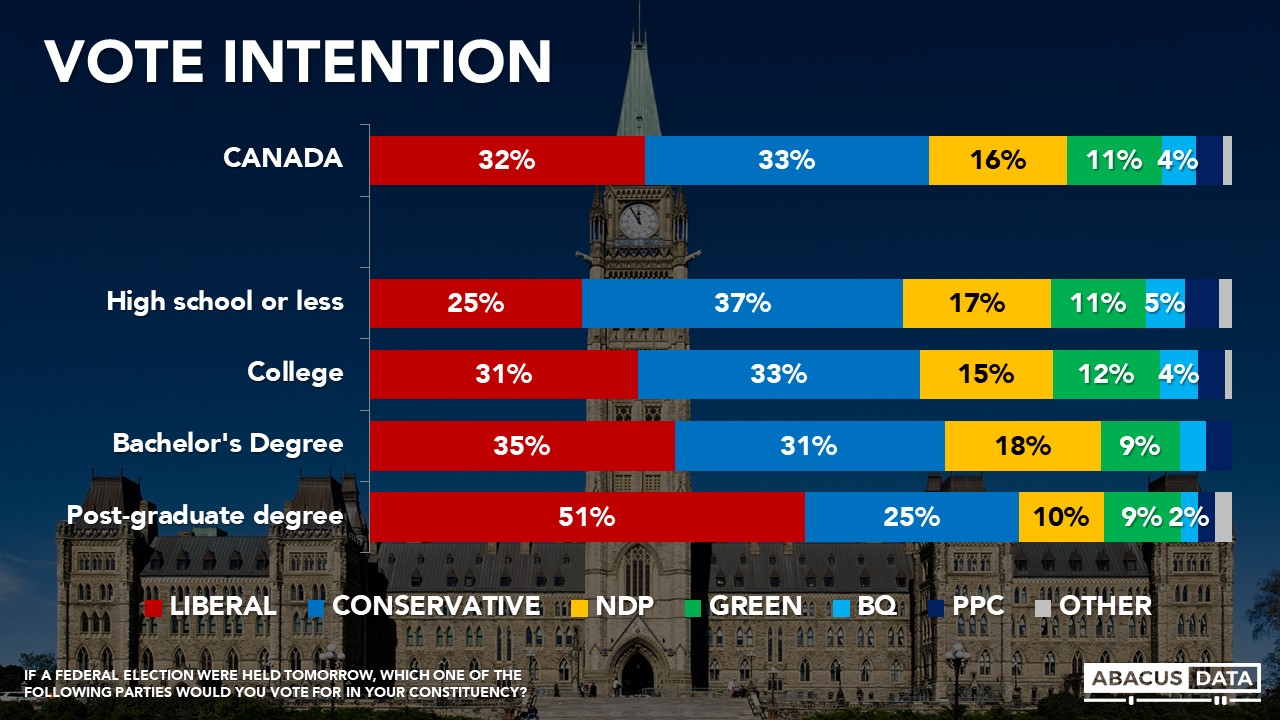
And in case you missed our earlier poll release, here’s the latest Canadian political update, released on last week: https://abacusdata.ca/liberals-and-conservatives-deadlocked-at-32/
METHODOLOGY
Our survey was conducted online with 1,500 Canadians aged 18 and over from July 12 to July 17, 2019. A random sample of panellists was invited to complete the survey from a set of partner panels based on the Lucid exchange platform. These partners are double opt-in survey panels, blended to manage out potential skews in the data from a single source.
The margin of error for a comparable probability-based random sample of the same size is +/- 2.6%, 19 times out of 20. The data were weighted according to census data to ensure that the sample matched Canada’s population according to age, gender, educational attainment, and region. Totals may not add up to 100 due to rounding.
ABOUT ABACUS DATA
We are the only research and strategy firm that helps organizations respond to the disruptive risks and opportunities in a world where demographics and technology are changing more quickly than ever.
We are an innovative, fast-growing public opinion and marketing research consultancy. We use the latest technology, sound science, and deep experience to generate top-flight research-based advice to our clients. We offer global research capacity with a strong focus on customer service, attention to detail and exceptional value.
Contact us with any questions.
Find out more about how we can help your organization by downloading our corporate profile and service offering.