This week, we completed a nationally representative survey of 1,500 Canadians and explored their views on Canadian politics to update our regularly tracking. Early next week we will release an in-depth analysis of the Green Party’s rise and surrounding implications.
For now, here’s our view of the federal political landscape:
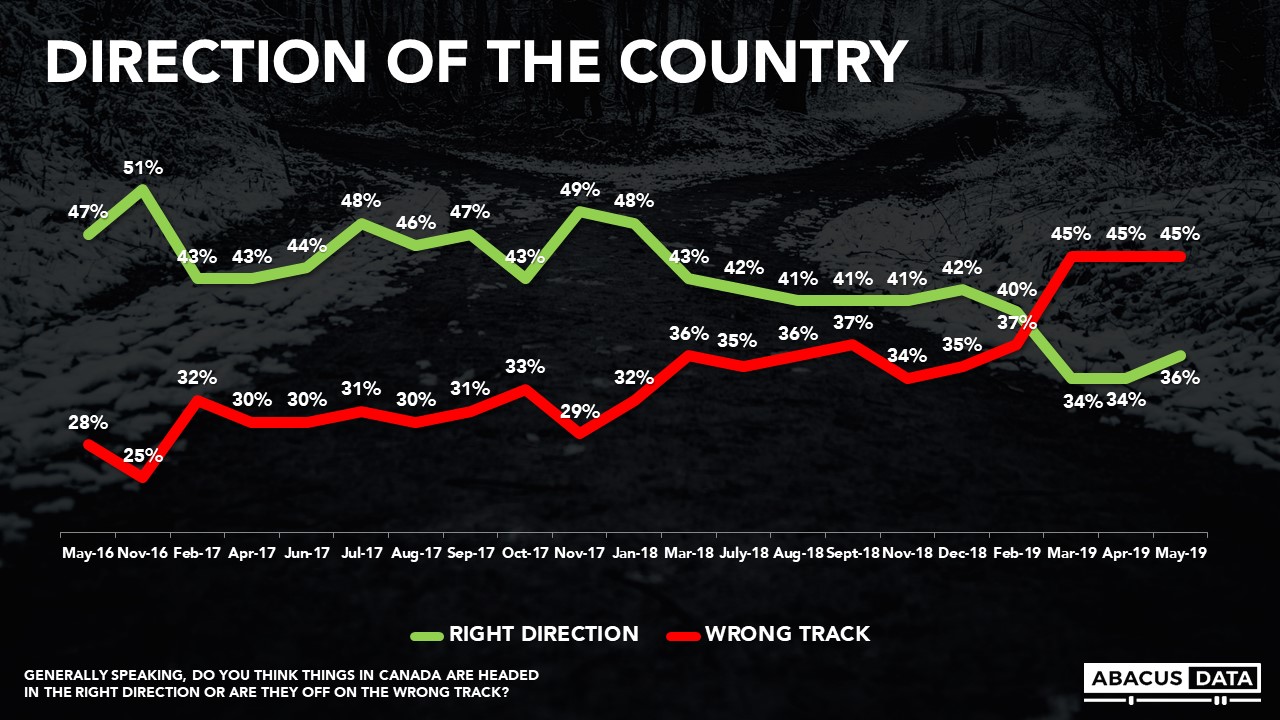
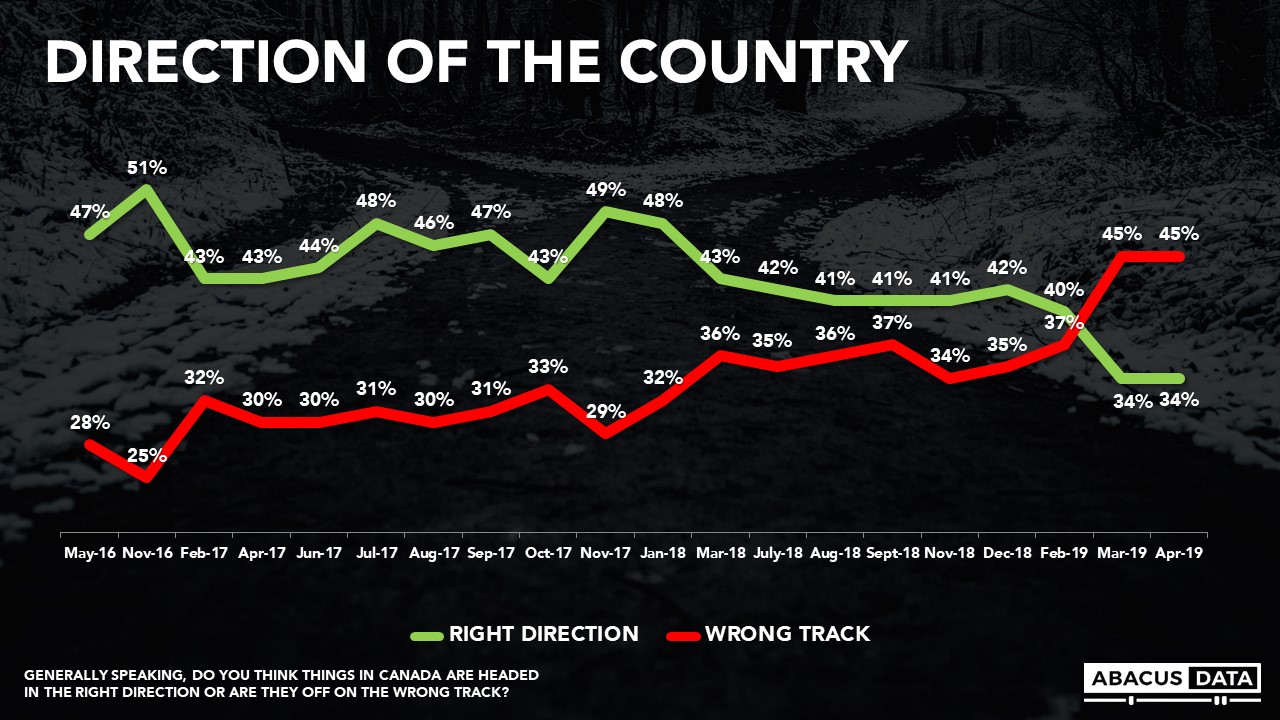
DIRECTION OF THE COUNTRY
By a nine-point margin, Canadians are more likely to think (45%) the country is headed on the wrong track, rather than headed in the right direction while 36% say it is headed in the right direction. The wrong direction number is unchanged from March, while the right direction number is up marginally by two points.
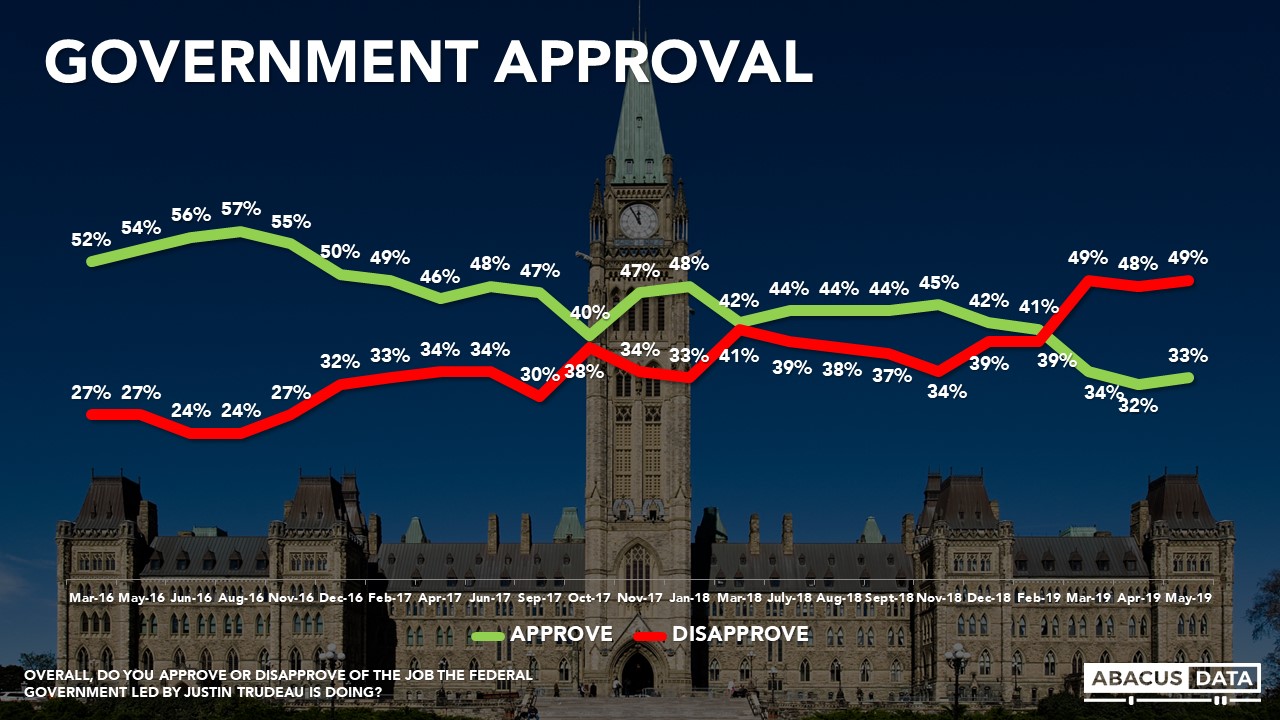
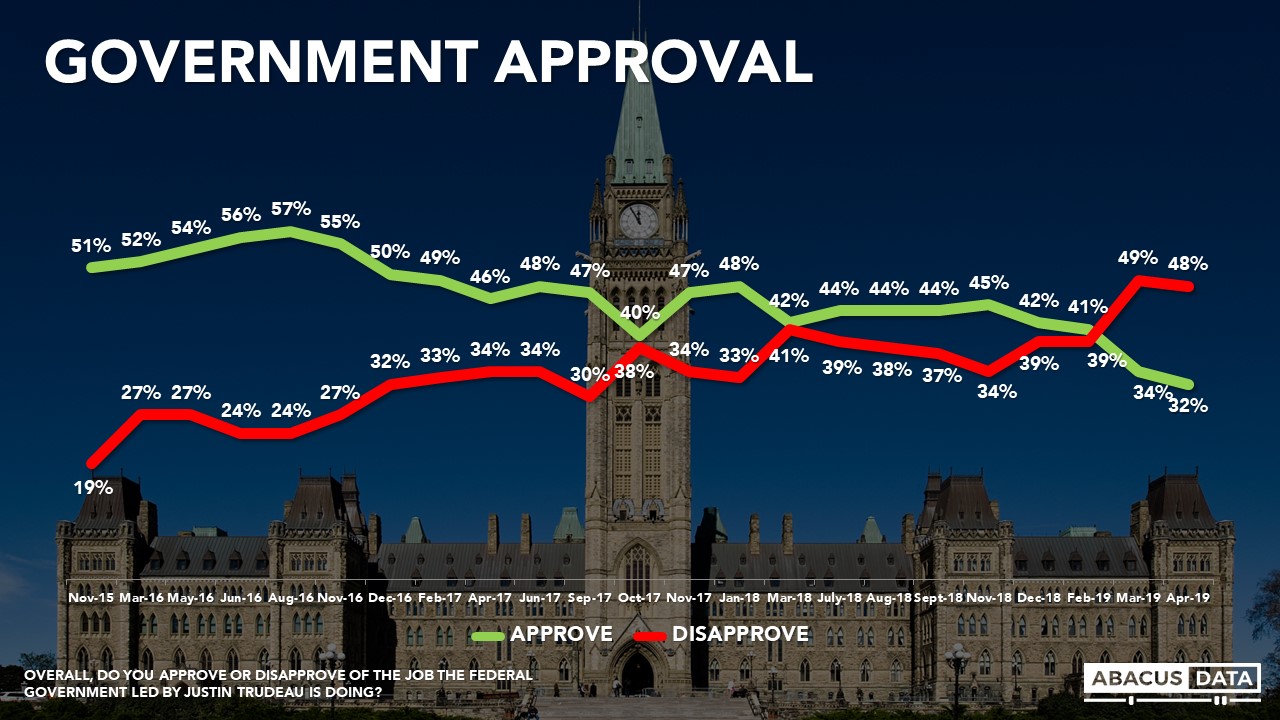
APPROVAL OF THE FEDERAL GOVERNMENT
Today 32% approve of the performance of the Trudeau government, while 49% disapprove. These numbers are also basically unchanged from our last reading in April.
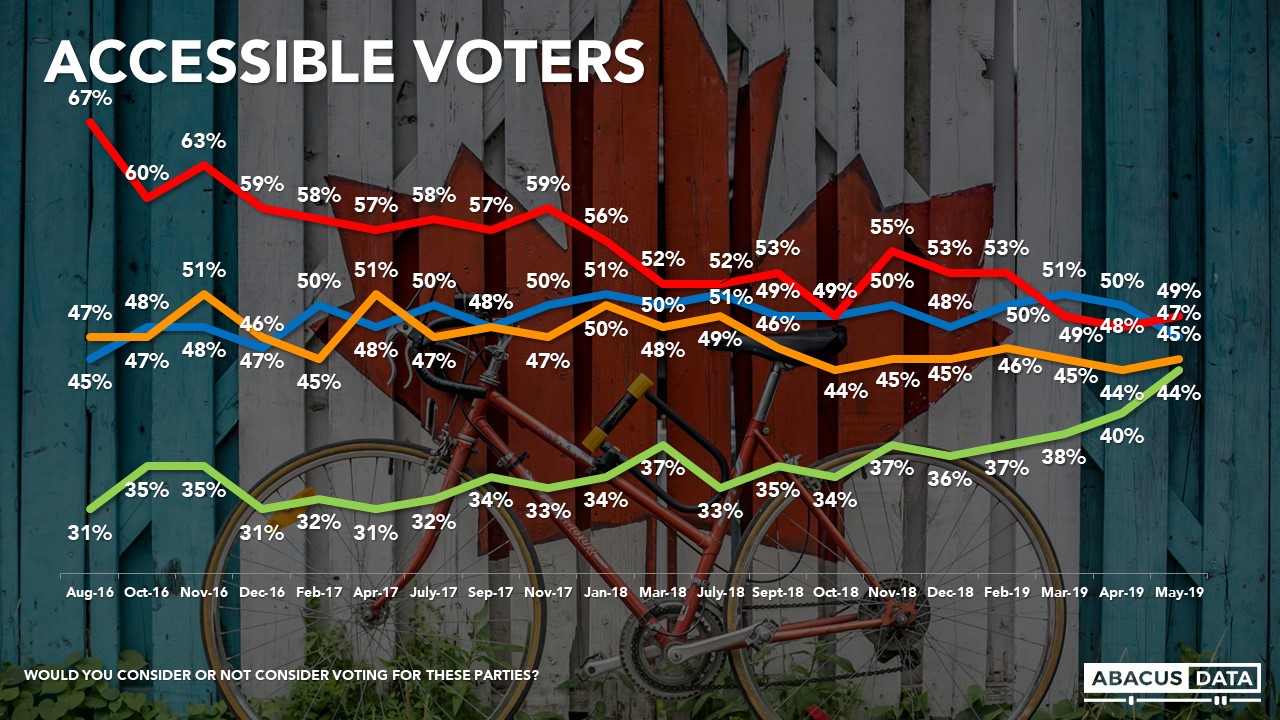
ACCESSIBLE VOTER POOLS
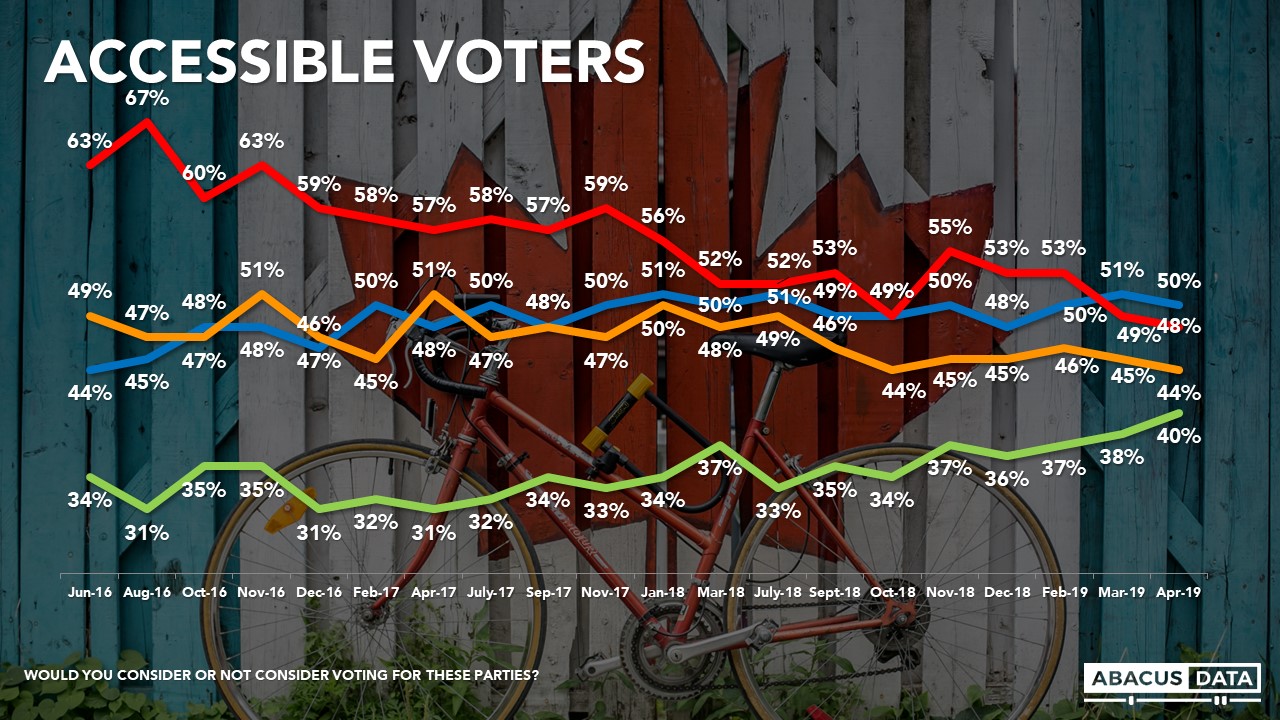
Today 49% say they would consider voting Liberal, compared to 48% in our last poll. 47% say they would consider voting Conservative, down 3 points. 45% would consider the NDP, compared to 44%, 44% would consider the Greens (up 4 points since April and 8-points since December), and 21% would consider voting for the People’s Party. In Quebec, 28% would consider voting for the BQ.
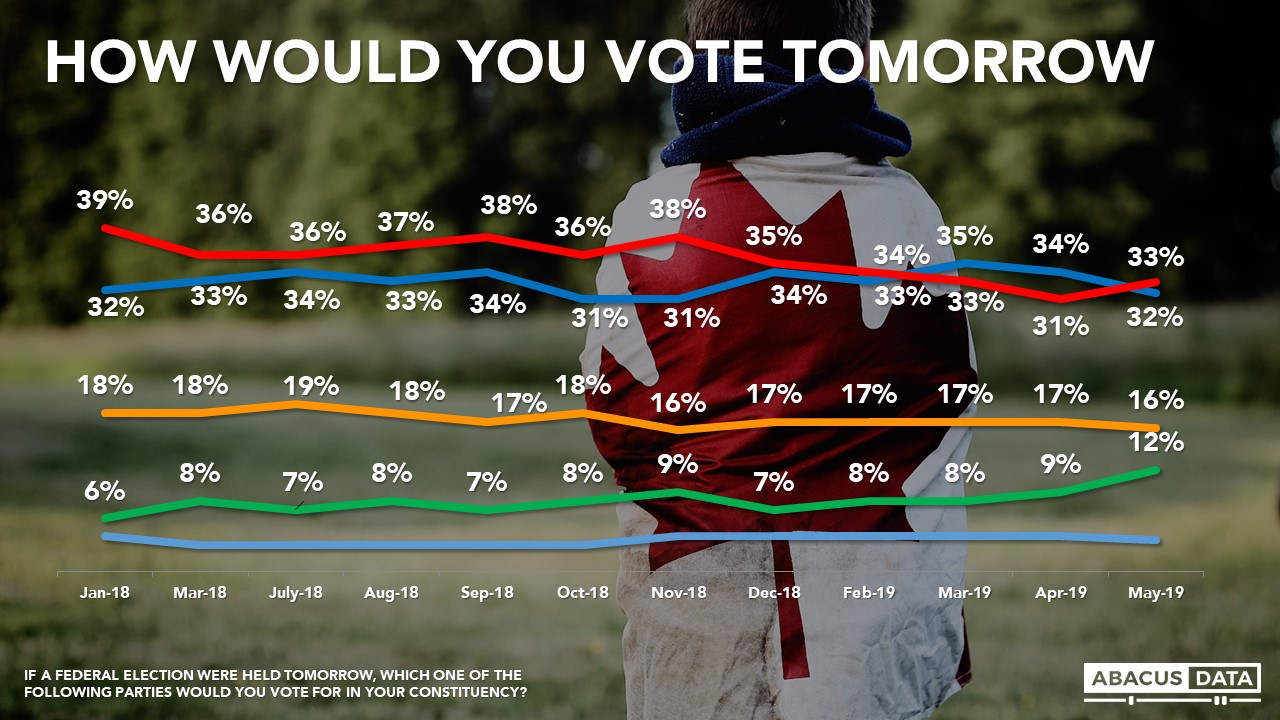
CURRENT VOTING INTENTION
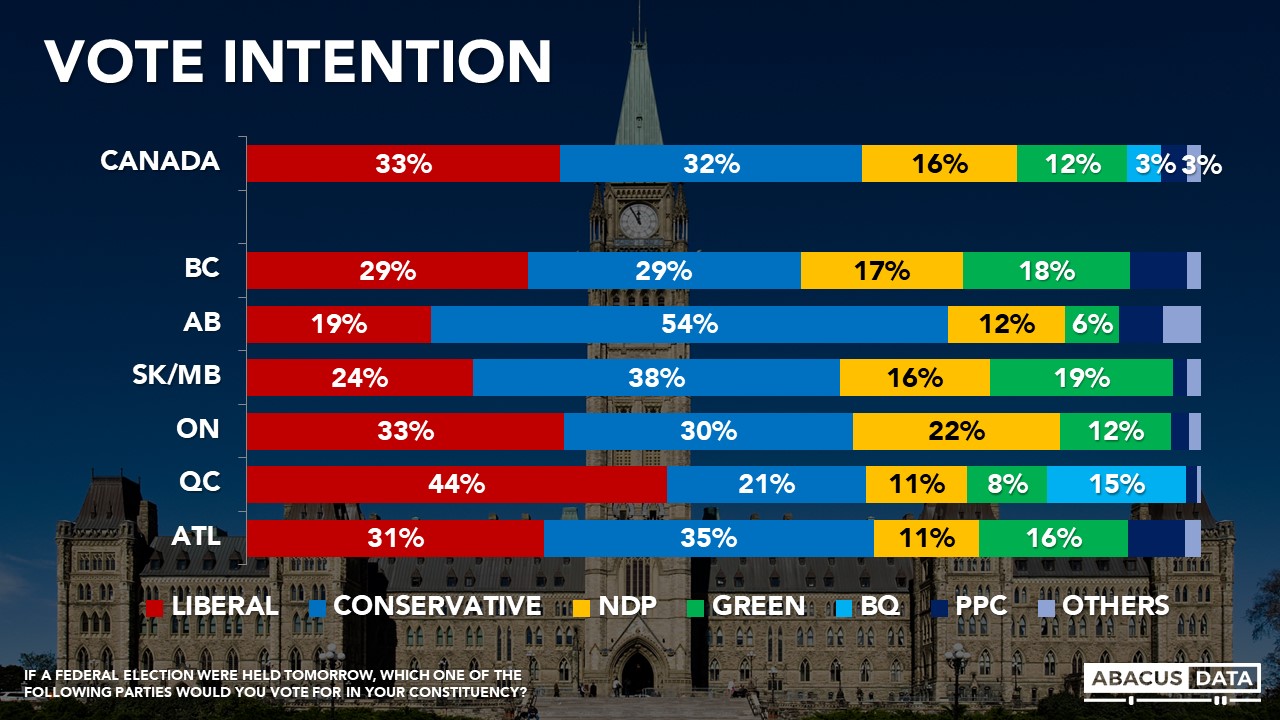
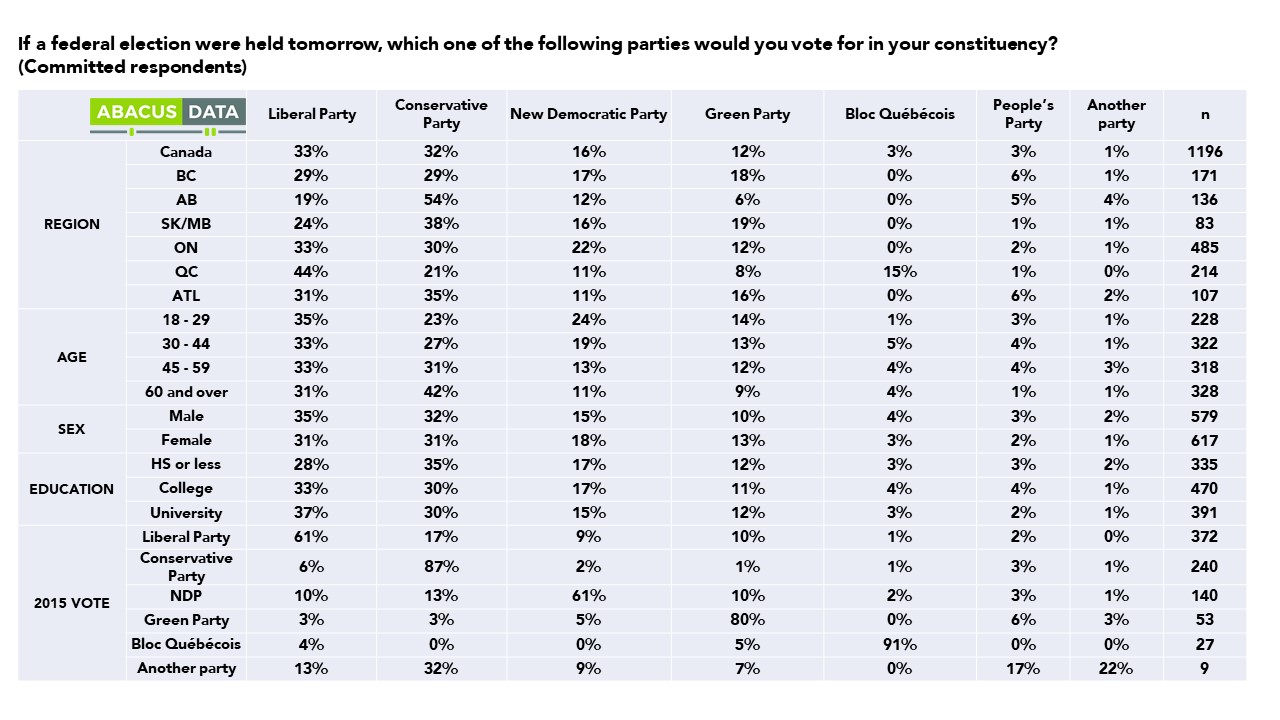
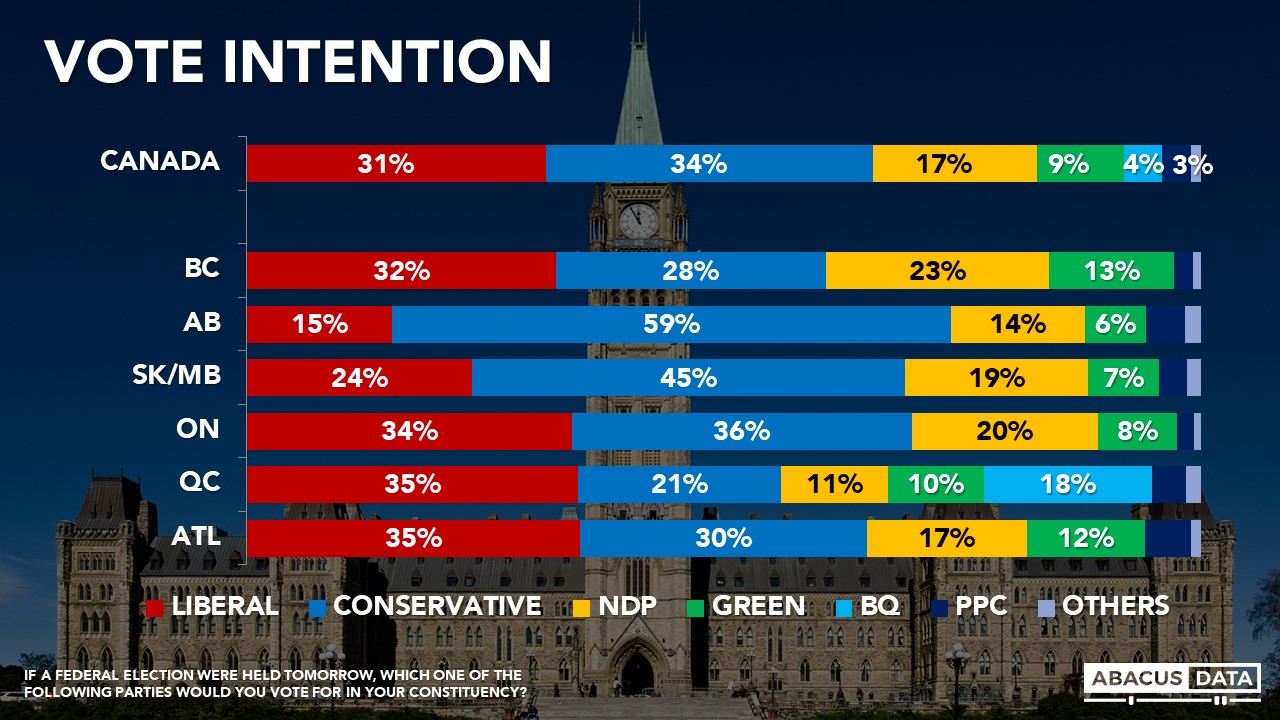
If an election were held tomorrow, 33% say they would vote Liberal, 32% Conservative, 16% NDP, and 12% Green. These numbers suggest some softening of Conservative support over the month, some strengthening of the Green Party, and an ongoing weak trend for the NDP. Today, the NDP trails the Green party in BC, Saskatchewan & Manitoba, and Atlantic Canada. In Quebec, where the NDP won 25% of the vote and 16 seats in 2015, the party is polling at 10% only two points ahead of the Greens and 34 points behind the Liberals.
We now see a pretty tight four-way race in BC, with the Liberals at 29%, the Conservatives at 28%, the Green Party at 18%, the NDP at 17% and the People’s Party with a notable 6%. The Greens appear to be eating into NDP support.
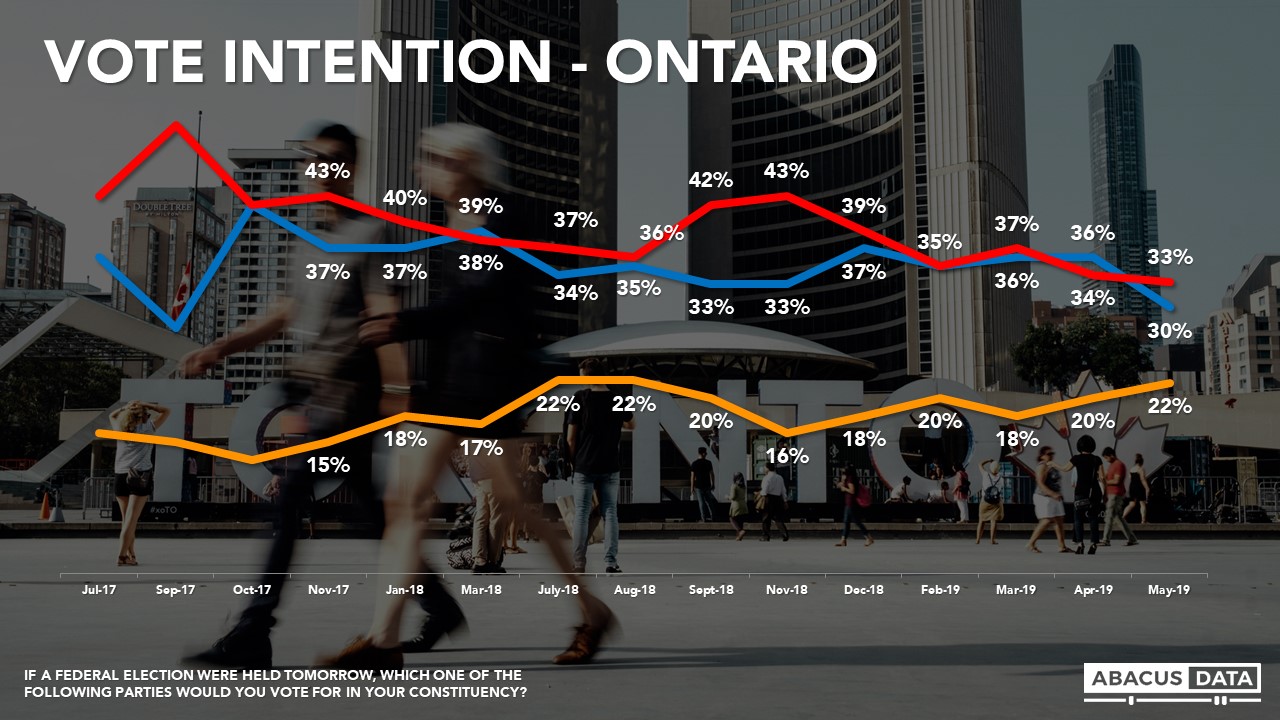
In Ontario, the Liberals have a 3-point edge over the Conservatives (33% to 30%), with the NDP back at 22% and the Greens at 12%. The People’s Party is at 2%. Compared to our last wave, this is a weakening of Conservative support and strengthening of Green Party and NDP support.
In Quebec, the Liberals are well ahead at 44% with the Conservatives at 21%, the Bloc at 14%, NDP at 10%, the Greens at 8%, the People’s Party at 1%. Compared to our last wave, this is a 10-point improvement for the Liberals.
In Atlantic Canada, the Conservatives have the edge (34%) over the Liberals (31%), with the Greens at 15%, the NDP at 11% and the People’s Party at 6%. These numbers reflect a big drop for the Liberals, a softening for the NDP, and strengthening of Conservative and Green Party support in the region. In 2015, the Liberal Party swept all 32 seats in Atlantic Canada, beating the Conservatives by 40 points in the popular vote.
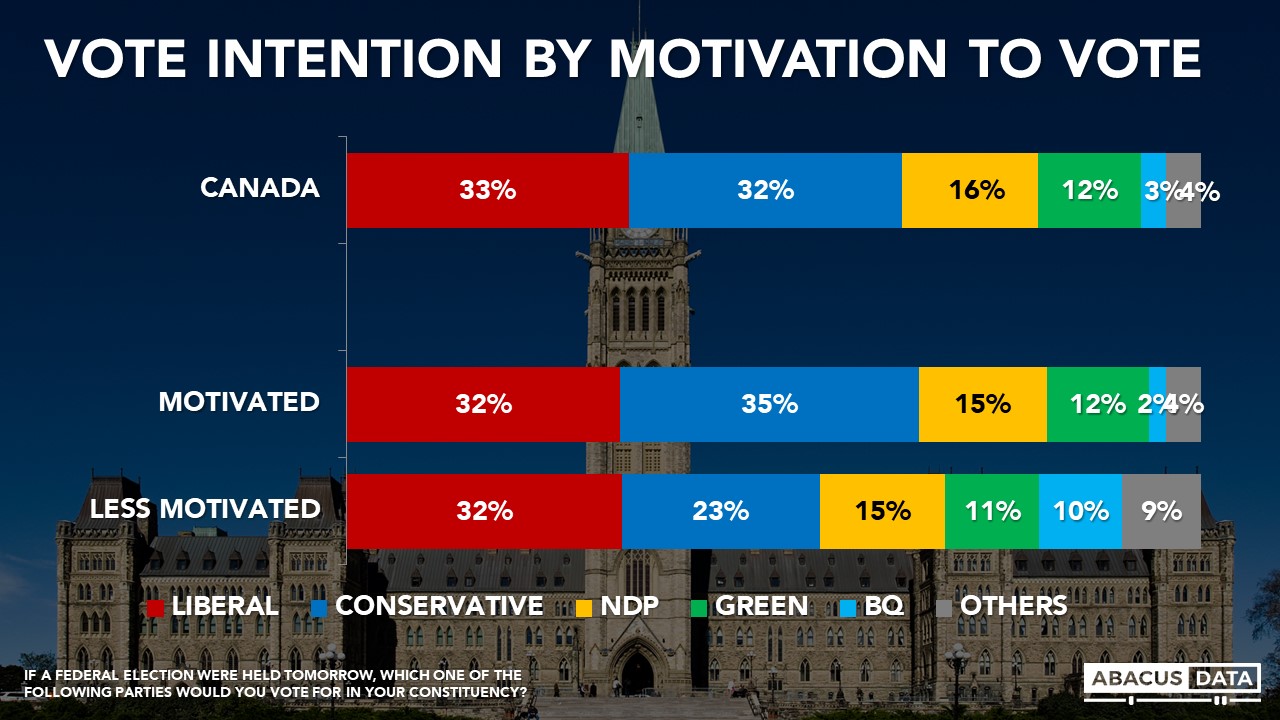
Among those who say they are most motivated to vote the Conservatives (35%) have a 3-point advantage over the Liberals (32%) followed by the NDP (15%), and 12% for the Greens.
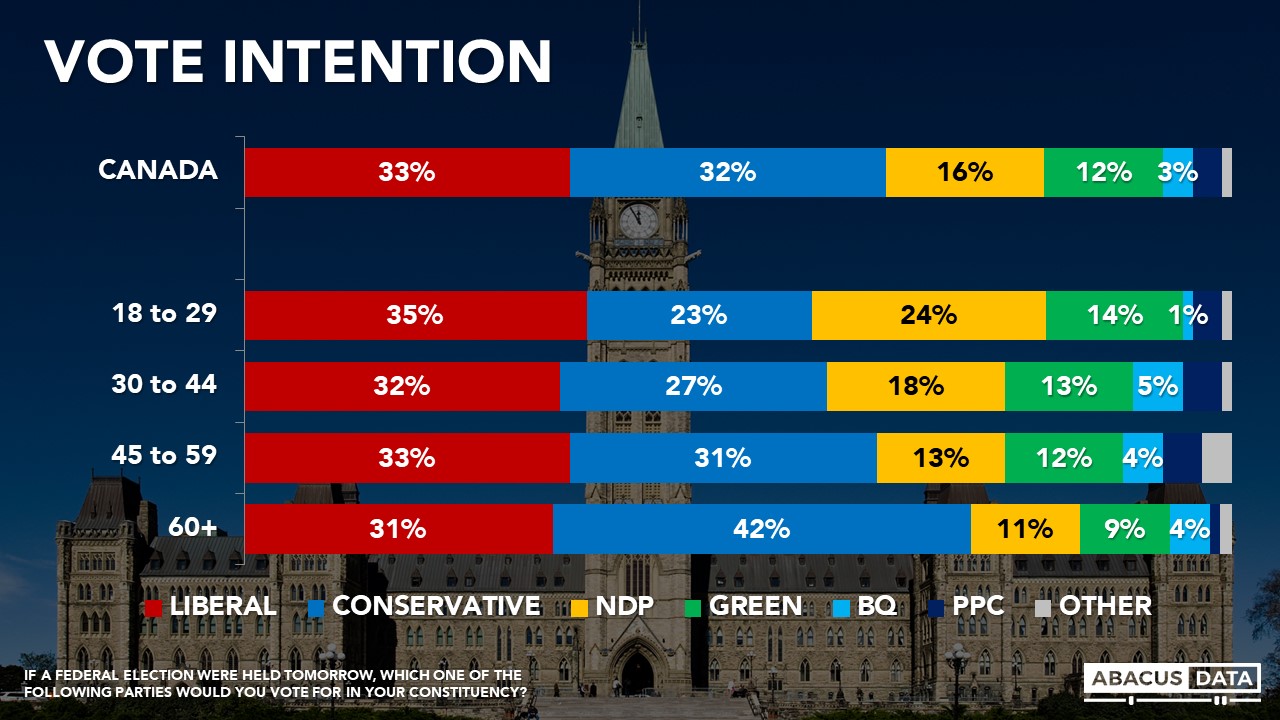
We also are noticing an increasing age divide in vote intentions. The Liberals lead among 18 to 29-year-olds (by 11 over the NDP and 12 over the Conservatives) and among those aged 30 to 44 (by 5 points over the Conservatives). The Liberals and Conservatives are basically tied among those aged 45 to 59 while the Conservatives have a healthy lead of 11-points among those aged 60 and over.
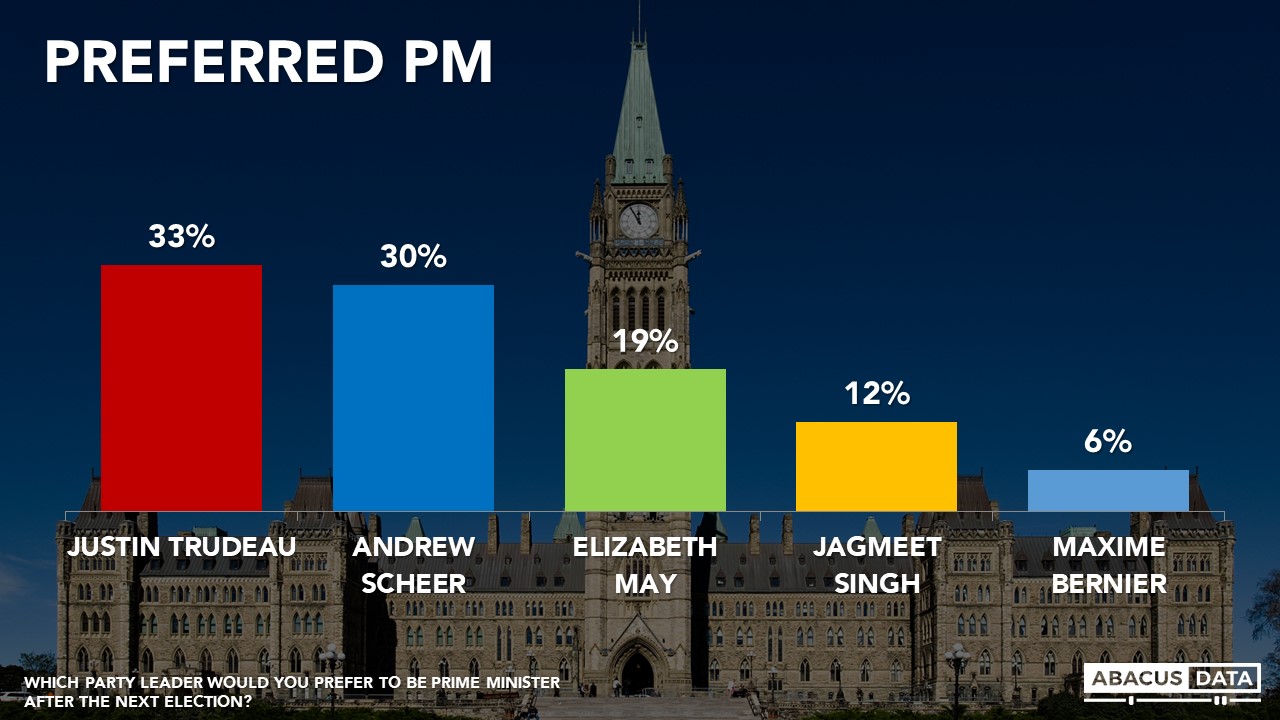
PREFERRED PRIME MINISTER
When asked which of the party leaders they would prefer to see as Prime Minister after the next election, 33% picked Justin Trudeau, 30% Andrew Scheer, 19% Elizabeth May, 12% Jagmeet Singh, and 6% Max Bernier. This is a slight 3-point decline for Andrew Scheer, and a 5-point increase for Elizabeth May, who now polls better than the NDP leader in every region of the country on this question.
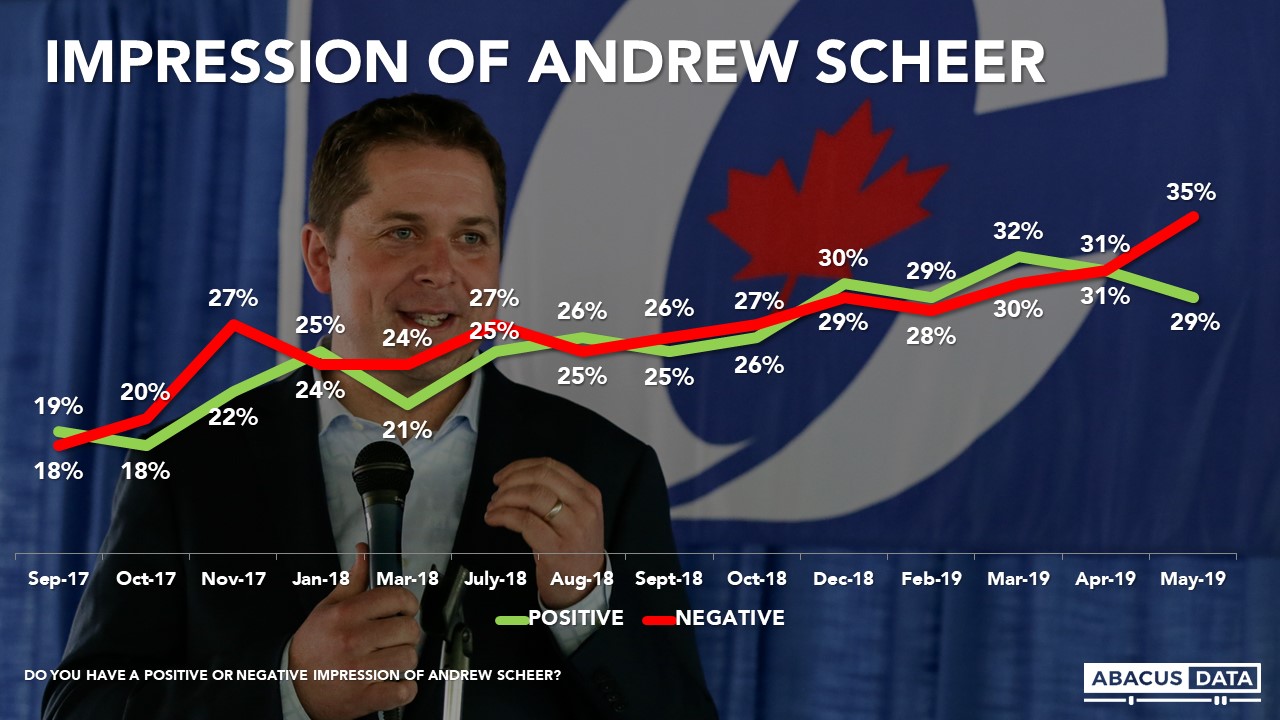
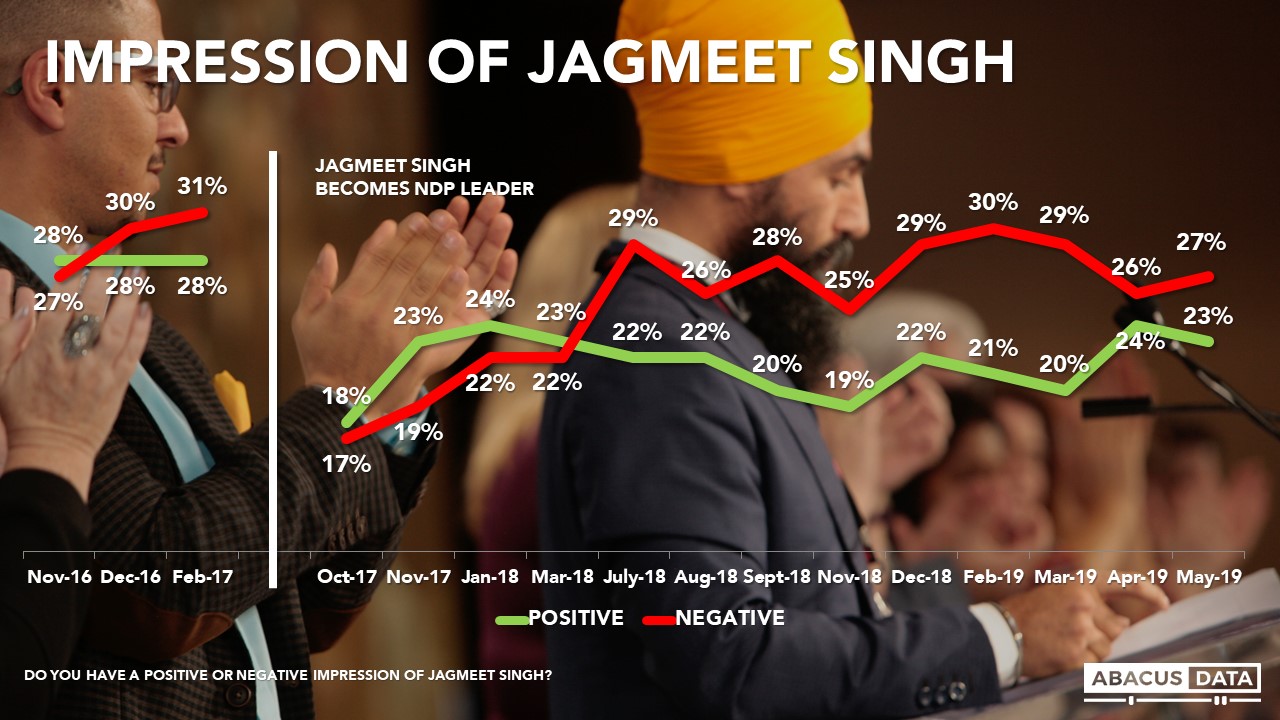
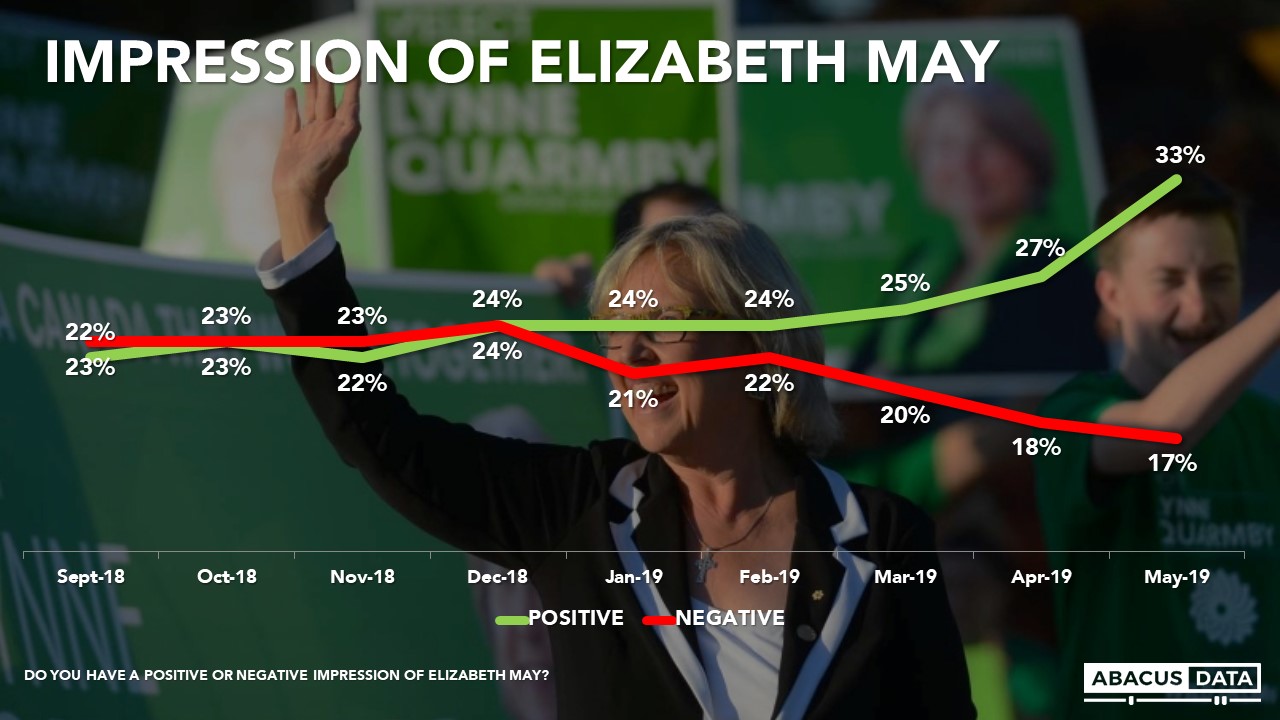
REPUTATION OF LEADERS
Currently, 33% say they have a positive view of Mr. Trudeau and 47% negative, which is essentially unchanged from our last wave. For Mr. Scheer, we find an increase in his negative numbers, up 4 since April while his positives are down 2. Overall, 35% view the Conservative leader negatively while 29% have a positive impression.
For Mr. Singh, we see 23% positive and 27% negative, mostly unchanged. For Ms. May we find 32% positive, 17% negative, a 5-point climb in positive ratings since April.
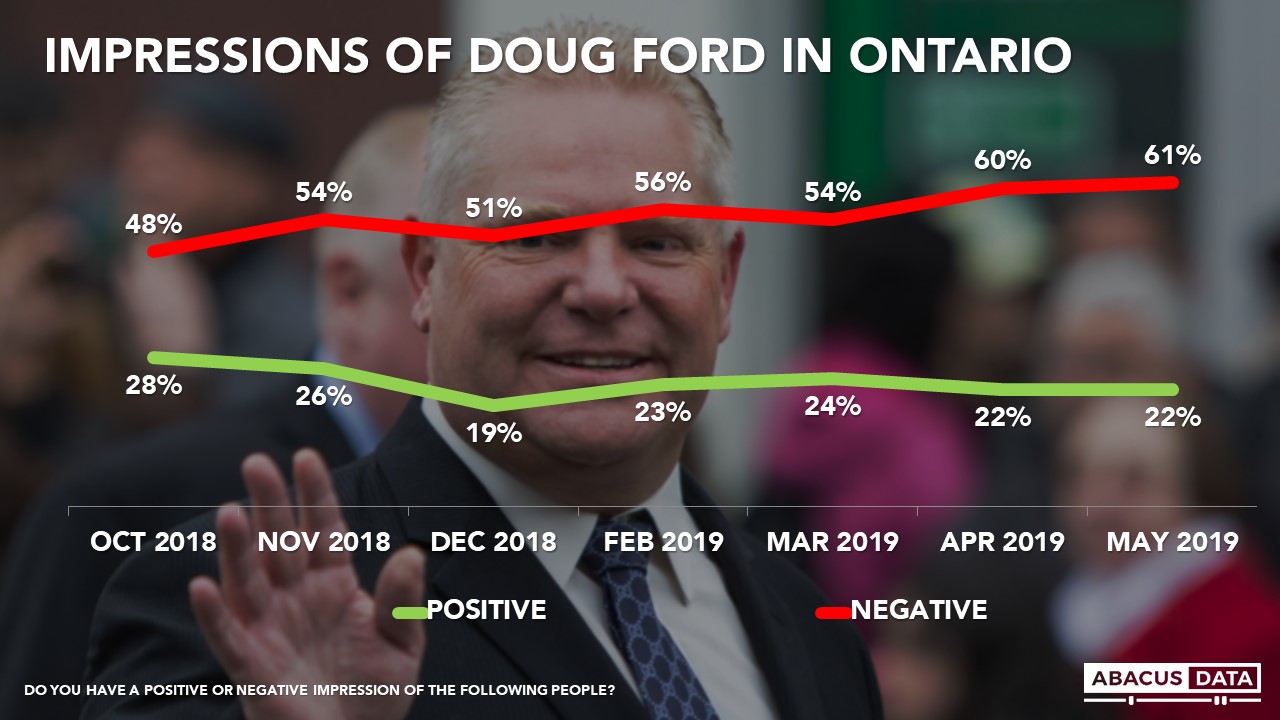
Worth noting is the fact that Doug Ford continues to show very high negative ratings nationally (55%) and in Ontario (61%). Among those open to voting Conservative, 26% have a positive impression compared with 37% who view him negatively. Among those who say they would vote Conservative today, 35% view him positively but almost as many (28%) have a negative impression of the Ontario Premier.
In Ontario, we have also seen a rise in Mr. Ford’s negatives. Last October, 48% of Ontarians had a negative view of the Premier. Today it is up to 61%, the highest we have tracked since we started regularly tracking Mr. Ford’s image. In the vote and swing seat-rich GTHA, only 20% have a positive view of Mr. Ford compared to 63% who view him negatively.
UPSHOT
According to Bruce Anderson: “The race to this fall’s election features some really unusual dynamics with the role of the Green Party, the challenges facing the NDP, and the challenge to the Conservatives of the People’s Party all looking as though they could influence the outcome.
Perhaps the most important of the influences though may turn out to be the way Ontario voters feel about the Conservative brand. Doug Ford’s popularity is remarkably low, given the relative strength of the Ontario economy. He arrived in office with a significant amount of public skepticism and his spending cuts have added more controversy. Public interest in deficit-fighting has not been that strong in recent years, even though people wanted a more frugal government, it’s not clear that they expected to be seeing cutbacks on public services and programs.”
According to David Coletto: “As we have noted in the past, the federal political landscape remains very fluid. Almost 1 in 5 Canadians are open to voting for 3 or more of the main political parties. The rapid ascent of the Green Party in both vote intention and more importantly, vote consideration, is something we will watch very closely. Tune into more analysis next week on some additional questions we asked of those open to voting Green.
The damage of the SNC-Lavalin controversy to the Liberals persists but the Conservatives nor the NDP have not been able to take advantage of this opportunity. Instead, many more Canadians are now giving the Greens a look as Ms. May’s popularity grows. Given that one in five Canadians would now prefer her as Prime Minister is clear evidence of how fast things can change in this environment.
For the Conservatives, the silver lining in these numbers is the advantage they continue to have among more motivated voters. But relying along on motivating their base may not be enough to win the election. Despite the SNC-Lavalin controversy shaking lose some voters from the Liberals, the Conservatives have not expanded their tent at all over the past five months. In fact, there’s some evidence to suggest fewer Canadians are open to voting Conservative than earlier this year.”
METHODOLOGY
Our survey was conducted online with 1,500 Canadians aged 18 and over from May 27 to 30, 2019. A random sample of panelists was invited to complete the survey from a set of partner panels based on the Lucid exchange platform. These partners are double opt-in survey panels, blended to manage out potential skews in the data from a single source.
The margin of error for a comparable probability-based random sample of the same size is +/- 2.6%, 19 times out of 20. The data were weighted according to census data to ensure that the sample matched Canada’s population according to age, gender, educational attainment, and region. Totals may not add up to 100 due to rounding.
ABOUT ABACUS DATA
We are the only research and strategy firm that helps organizations respond to the disruptive risks and opportunities in a world where demographics and technology are changing more quickly than ever.
We are an innovative, fast-growing public opinion and marketing research consultancy. We use the latest technology, sound science, and deep experience to generate top-flight research-based advice to our clients. We offer global research capacity with a strong focus on customer service, attention to detail and exceptional value.
Find out more about how we can help your organization by downloading our corporate profile and service offering.
Don’t miss any of our releases and receive our weekly “Worth a Look” newsletter by signing up for our email list. We promise no more than 2 emails a week… unless there’s something really important we want to share.
With Climate Change being one of the ballot box issues for the upcoming Federal Election, candidates would do well to recognize the importance climate change plays in the electoral calculus of Canada’s millennials. Candidates without a credible plan on climate change will find it difficult to gain the support of Canada’s largest voting segment.
In our most recent Canadian Millennials Report, we found that 87% of millennials consider themselves to be either environmental moderates or ardent environmentalists. This attitude demonstrates that most millennials care, in some capacity, about the environment. However, to represent millennials as a bunch of ardent climate activists would be a misnomer. Millennials and the rest of Canada see a multitude of options available to address climate change that is as diverse as they are. Regulation, innovation, incentives, and punishment are all things that millennials, and more broadly Canadians, think any good environmental plan should have.
Note: This graph is representative of the general population, not millennials specifically.
To further this, millennials have different views on the government’s performance on climate change. In a survey we conducted earlier this year (just before the federal carbon pricing policy came into effect), 37% of millennials said that they think that the federal government has done a poor or very poor job on climate change. Meanwhile, 28% of millennials believe that they have done an acceptable job and 17% believe that they have done a good to very good job.
As millennials make up 27.5% of the Canadian Population and 37% of the electorate they have the potential to swing the vote. While the traditional pocketbook issues will certainly play a factor, the issue of climate change may just be catalytic enough to drive them to the polls. At 73%, millennials are more likely than other generations to consider climate change as one of their top five factors affecting their vote. 15% consider it to be their number one issue.
Millennials are not the innocuous activists they were once supposed to be. They are a present electoral reality, and if political parties want to win in October, they need to have the millennials on-side. They are environmental stewards who want to see electric vehicles become a majority. They are the future, and their opinion on how climate change should be resolved is guaranteed to steer their votes this upcoming election season. What politicians and their parties will do about it remains to be seen.
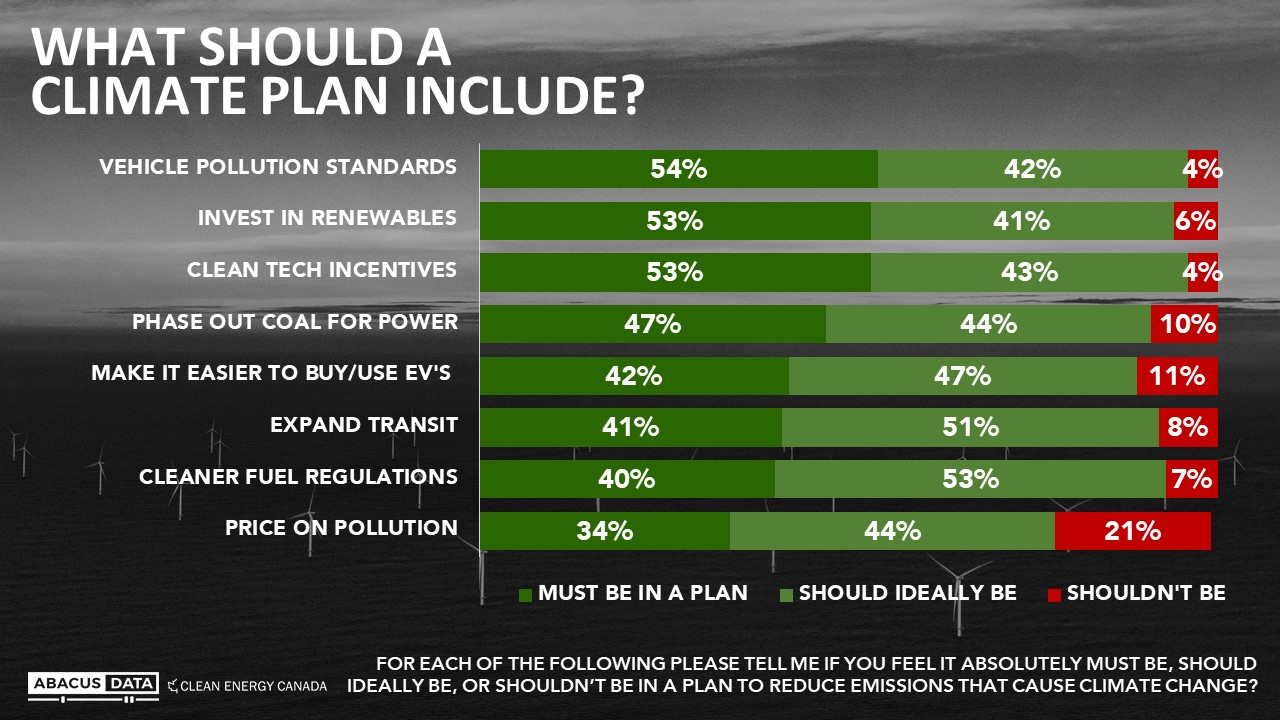
As Canada’s political parties prepare their election platforms, the latest Clean Energy Canada – Abacus Data nationwide poll explored opinions about what should be included in a plan to combat climate change. The results showed:
• All 8 of the possible components tested found a majority say that they should ideally or must be included in a climate plan.
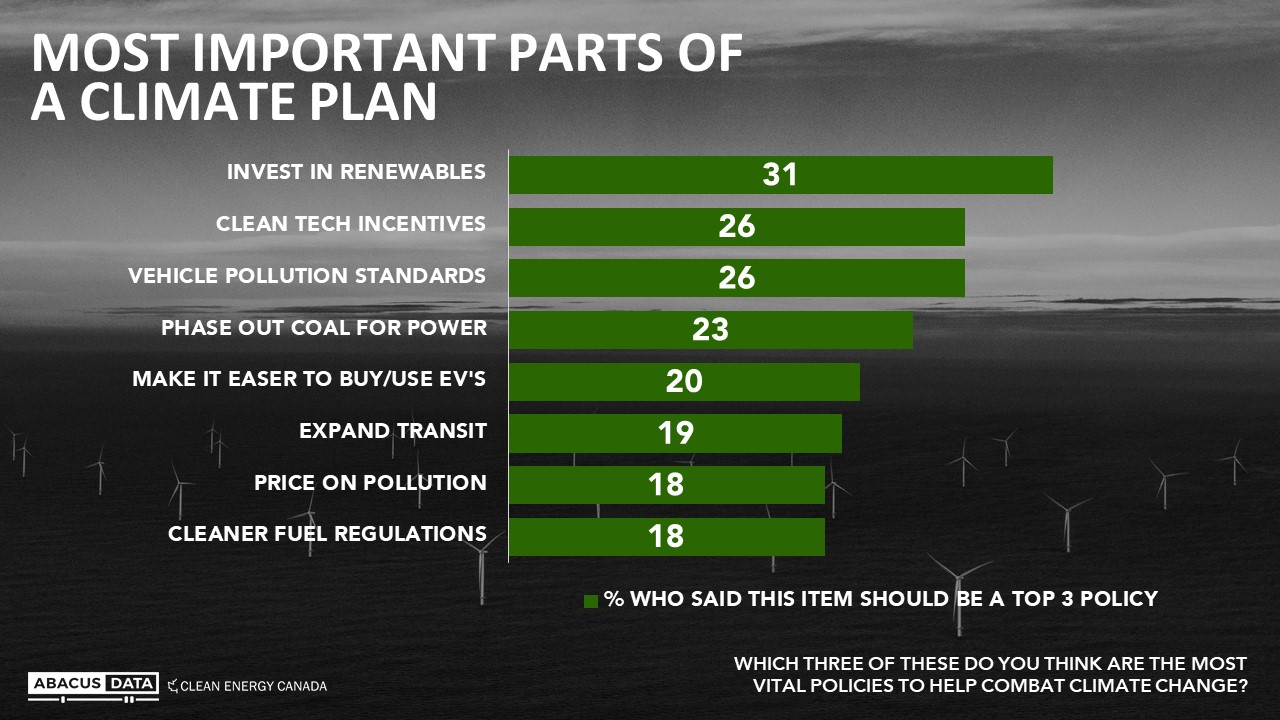
• At the top of the list of “must haves” are vehicle pollution standards, investments in renewable energy, incentives to spur clean technology innovation, and phasing out the use of coal for energy.
• More than 90% also feel that a plan to reduce emissions should include incentives to help people buy and use EVs, spending to expand public transit, and cleaner fuel regulations.
• On the question of whether a policy should include a price on pollution, 34% said this must be in a plan, and another 44% said it should ideally be part of an emissions reduction plan.
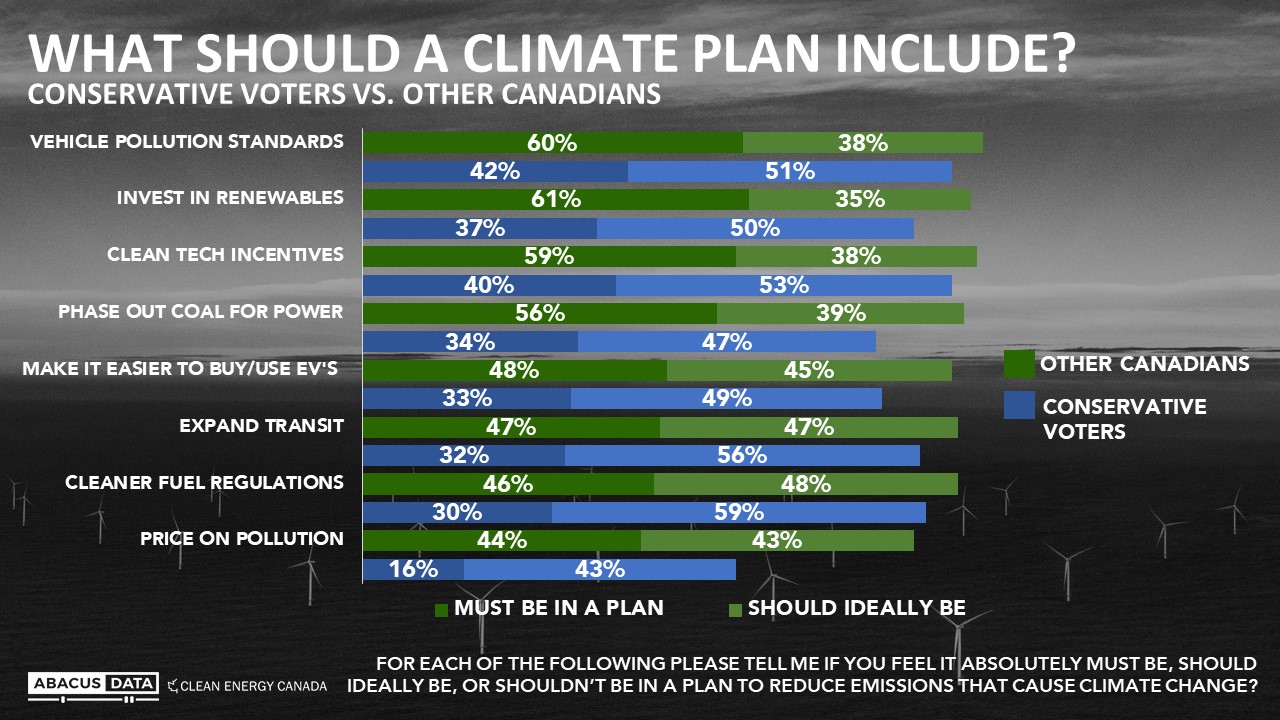
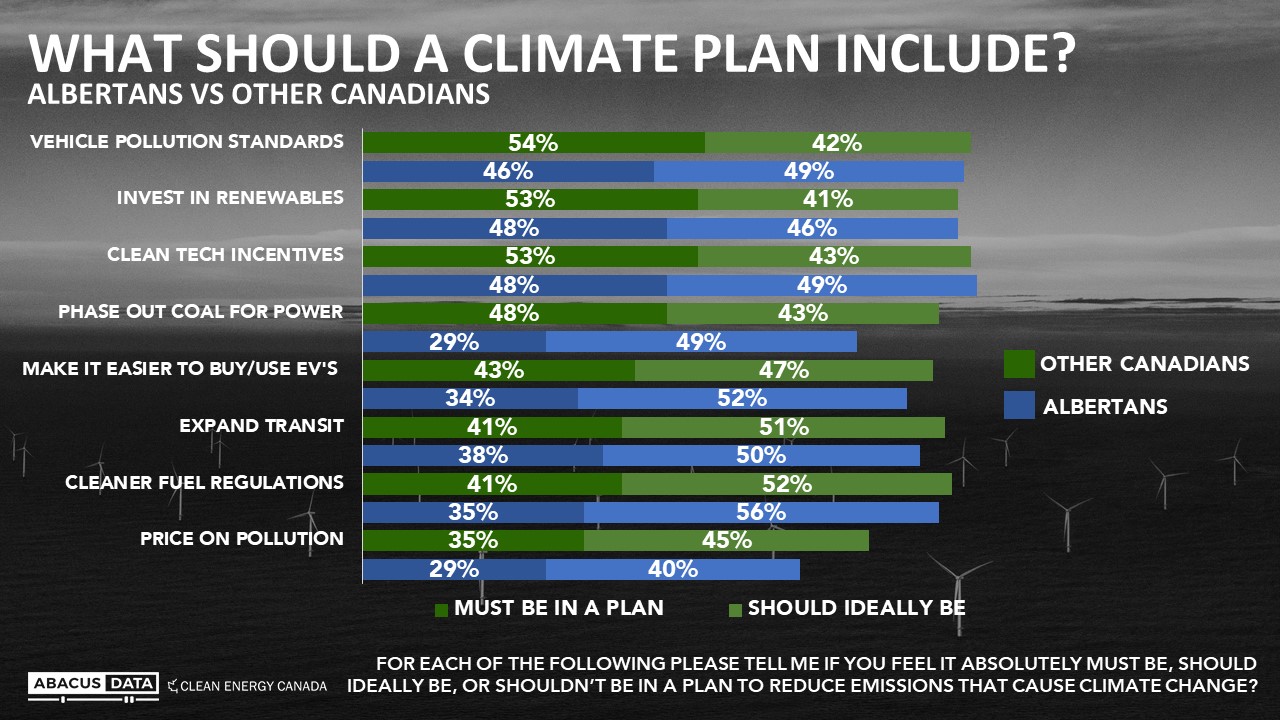
Looking underneath the surface of national opinion for some additional insights, especially when we compare Albertans and Conservative Party oriented Canadians, two groups where differences of opinion on climate change have been most striking in the past:
• On phasing out coal, Albertans are less enthusiastic (just 29% say it must be in a climate plan) but broadly of the view that it should ideally be (49%). Eight in ten Conservative voters say a coal phase out must (34%) or should be (47%) part of a climate plan. Among “Conservative opportunity” voters (those who say they would consider the CPC but aren’t currently planning on voting CPC, 43% say a coal phase out must be and 49% should be in a climate plan.
• On pricing pollution, majorities in every region say this must or should be in a climate plan, led by BC (84%) and with Alberta lower than anywhere else at 69%). 59% of Conservative voters and 82% of Conservative opportunity voters believe a price on pollution is a should have or must have. Supporters of other parties are even more convinced.
• On investments in renewable energy, more than 90% across the country say this must or should be in a climate plan. In Alberta, 48% say must and 46% say should ideally. Among Conservative voters, 37% say must and 50% say should, and among Conservative opportunity voters results are 50% must be and 43% should be in a plan.
• On incentives to support clean technology, more than 90% across the country say this must or should be in a climate plan. In Alberta, 48% say must and 49% say should ideally. Among Conservative voters, 40% say must and 53% say should, and among Conservative opportunity voters results are 53% must be and 43% should be in a plan.
• On investments to expand public transit, more than 85% across the country say this must or should be in a climate plan. In Alberta, 38% say must and 50% say should ideally. Among Conservative voters, 32% say must and 56% say should, and among Conservative opportunity voters results are 39% must be and 52% should be in a plan.
• On investments in to make it easier to buy and use electric vehicles, more than 85% in every region say this must or should be in a climate plan. In Alberta, 34% say must and 52% say should ideally. Among Conservative voters, 33% say must and 49% say should, and among Conservative opportunity voters results are 38% must be and 51% should be in a plan. The youngest voters are 8 points more likely than the oldest voters to say that this must be in a climate plan.
• On regulations to deliver cleaner fuels, more than 90% in every region say this must or should be in a climate plan. In Alberta, 35% say must and 56% say should ideally. Among Conservative voters, 30% say must and 59% say should, and among Conservative opportunity voters results are 39% must be and 54% should be in a plan.
• On regulations to ensure vehicles are manufactured to emit less pollution and be more fuel efficient, 95% or more in every region say this must or should be in a climate plan. In Alberta, 46% say must and 49% say should ideally. Among Conservative voters, 42% say must and 51% say should, and among Conservative opportunity voters results are 50% must be and 46% should be in a plan.
QUOTES
“With strong support across the political spectrum for a range of existing measures to tackle climate change, there appears to be little public support for moving backwards. As all parties begin to build plans to address climate change, the question is not what should be undone—but what more can we do. Given the impacts already being felt in Canada, from recent floods to forest fires, it’s clear that climate change should be a ballot box issue, and that all parties need to put forward credible, comprehensive plans to address it.”
—Dan Woynillowicz, Policy Director, Clean Energy Canada
“A great deal of the discussion about climate policy has centred on carbon pricing, but these results reveal not only that many people believe a price on pollution should be part of a climate plan, but that they would like to see a range of other policies adopted as well. Another common misperception may be that conservative-leaning voters and Alberta voters are opposed to a range of measures that could help combat climate change – on the contrary, these numbers underscore that most people, Alberta and Conservative voters included, expect a solid could plan must or should ideally include all of the elements tested.”
—Bruce Anderson, Chairman, Abacus Data
METHODOLOGY
The survey was conducted with 2,515 Canadian residents aged 18 and older from April 23 to April 29, 2019. A random sample of panelists was invited to complete the survey from a set of partner panels based on the Lucid exchange platform. These partners are typically double opt-in survey panels, blended to manage out potential skews in the data from a single source.
The margin of error for a comparable probability-based random sample of the same size is +/- 1.8%, 19 times out of 20.
The data were weighted according to census data to ensure that the sample matched Canada’s population according to age, gender, educational attainment, and region. Totals may not add up to 100 due to rounding.
ABOUT ABACUS DATA
We are the only research and strategy firm that helps organizations respond to the disruptive risks and opportunities in a world where demographics and technology are changing more quickly than ever.
We are an innovative, fast-growing public opinion and marketing research consultancy. We use the latest technology, sound science, and deep experience to generate top-flight research-based advice to our clients. We offer global research capacity with a strong focus on customer service, attention to detail and exceptional value.
Find out more about how we can help your organization by downloading our corporate profile and service offering.
Don’t miss any of our releases and receive our weekly “Worth a Look” newsletter by signing up for our email list. We promise no more than 2 emails a week… unless there’s something really important we want to share.
Yes, the Millennials have been and are going to turbo-charge the sharing economy and continue to throw our traditional economy into chaos. Let me explain…
We will begin by dispelling some myths about the sharing economy. Firstly, people sharing things is not a new phenomenon. Humans have been formally sharing stakes in property since the first family farms of the Fertile Crescent over 6,000 years ago. It was the enterprising British and thrifty Dutch that brought us into modernity with the first joint-stock companies in 1600. Purchasers of these stocks shared in the ownership of a business (usually a ship or a fleet of ships going off to India). Joint-stock companies allowed for the financing of these expensive ventures and dispersed the losses if a ship were to sink off of some forlorn coast. The last great wave of the sharing economy developed in the 1970s and 80s. The wide acceptance of time-share holiday properties became a hot trend in North America. Moreover, co-operative communities or communes in the “back to the earth” movement sprung up around the world. The point being, the sharing economy is not new – it didn’t arrive with the internet and it certainly isn’t dependent on the “Gig economy”. It’s been around as long as there have been expensive stuff that humans want but couldn’t afford.
Nevertheless, the sharing economy has been changing since its fetal days in the Tigris river valley. Back then, only a handful of feudal families and their merchants could own a share of property. Property ownership remained a privilege of the elite until the 17th century with the innovation of the joint-stock company which opened the sharing economy to merchants and the upper middle classes. Over the next three centuries, more people would be attracted to stock markets and shared asset ownership. The last great expansion in the 70s and 80s brought the shared economy to the broader middle classes of developed nations. The time-sharing of properties and expansion of affordable financial instruments made joint-ownership attainable. Most recently, the internet has accelerated the sharing revolution and now encompasses almost all the world’s population. While the sharing economy is not new, the breadth of economic inclusion it now possesses has fundamentally altered the playing field. Millennials are technologically savvy, globally minded, and are ready to push us into the realm of sharing everything.
The Right Conditions:
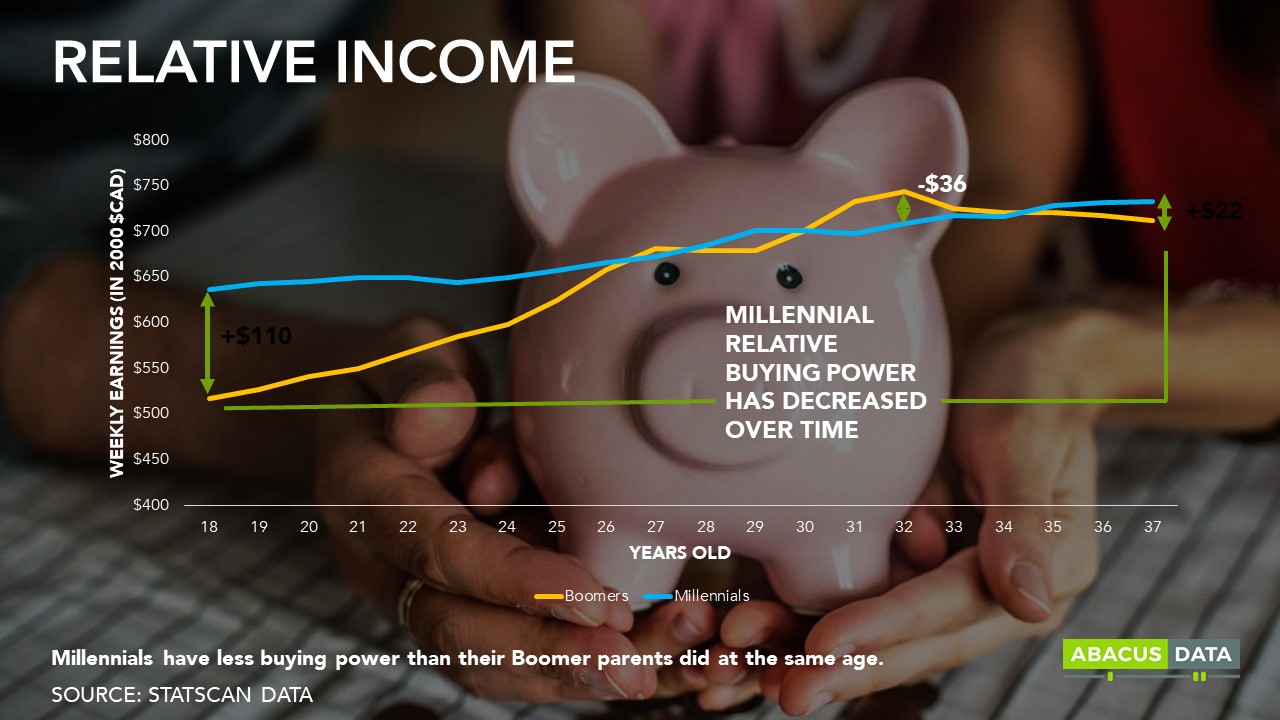
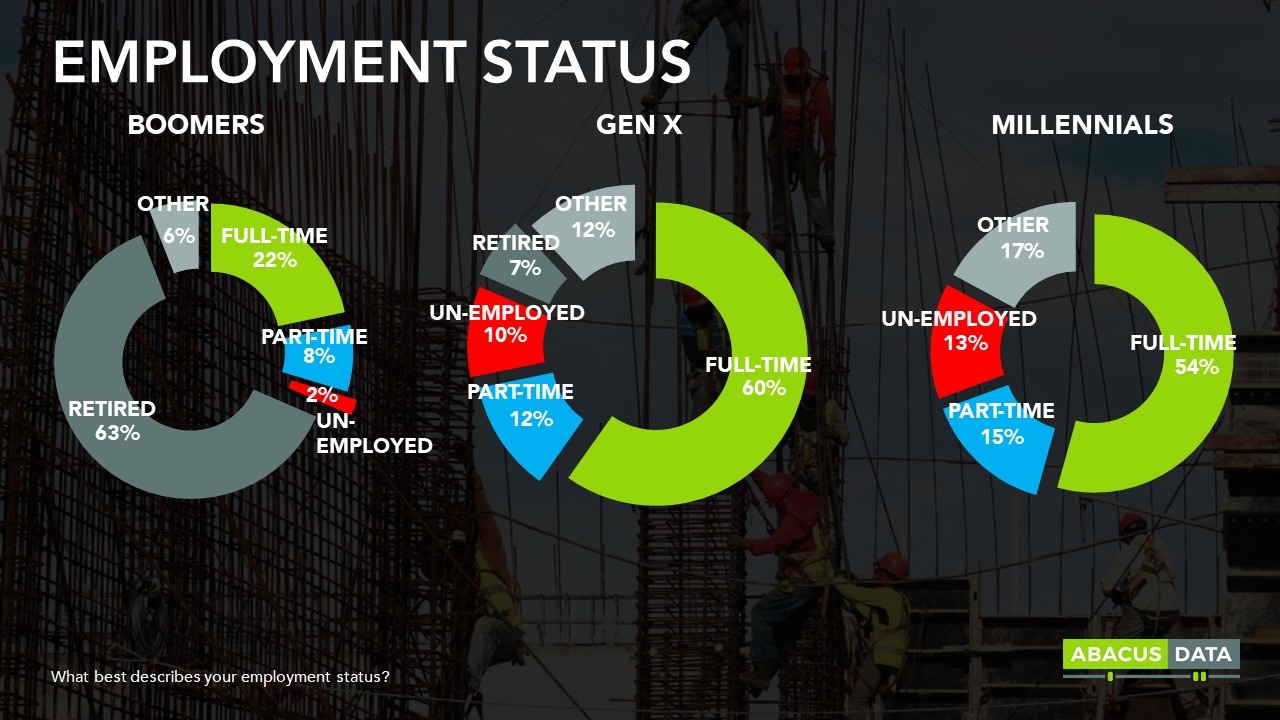
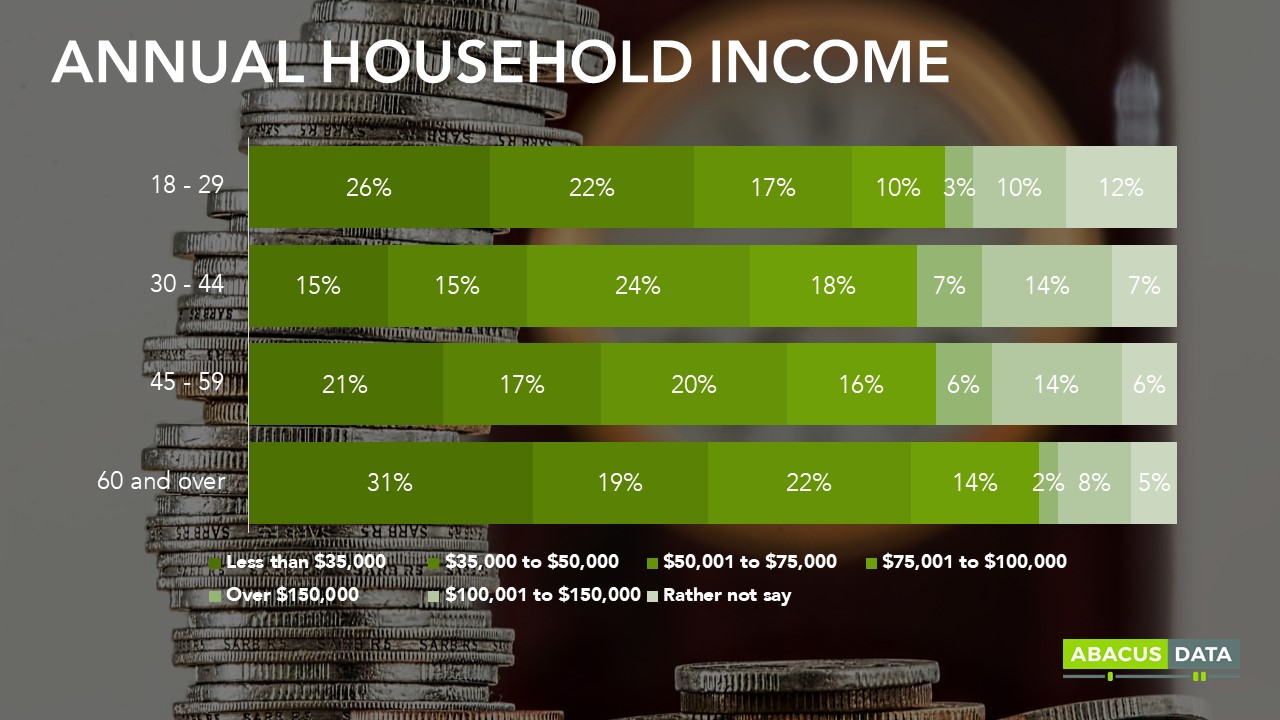
For the sharing economy to thrive there needs to be the right conditions such as expensive or burdensome assets, actors with insufficient resources to solely purchase the asset, and a method for independent actors to communicate and collaboratively share in the ownership of the asset. As we said earlier millennials are, relatively speaking, broke. The cost of living is outstripping many of their incomes and according to a recent Abacus Data study, 48% of millennials make less than $50,000 a year. Comparatively, only 30% of generation X make less than $50,000 a year. Millennials are also twice as likely to report being unemployed or in part-time work than either Gen X or the boomer generations.
Low wages and uncertain employment conditions have transformed assets such as cars or houses—once considered a regular cost of living expense—into unattainable dreams for a lone millennial to own. So far, the millennial experience satisfies the first two criteria of a thriving sharing economy; relatively high-priced goods and actors with insufficient resources to independently purchase them. The third criteria, a method for independent actors to communicate and collaboratively purchase an asset, has been facilitated through the ubiquity of the internet and the pervasiveness of Gig economy platforms which allow strangers to collectively purchase (or lease) an asset, as we can see with gig-companies like Zip Car or Uber. Strangers can lease time to use the car (Zip Car) or just a back seat (Uber) to travel to a destination.
The interconnectedness of the internet primed the sharing economy’s way to dominate all sectors of society, but it would all be for nought if millennials weren’t comfortable with the sharing economy idea. A little over a decade ago, it would be unimaginable to welcome complete strangers into the spare rooms of your home, its something that might have even warranted a call to the police by your neighbours, presuming you had turned your attic into some kind of brothel. But to millennials, Airbnb is a natural extension of their everyday lives, they grew up with these internet sharing platforms and are open to the idea of sharing (almost) everything.
The Impact on Business
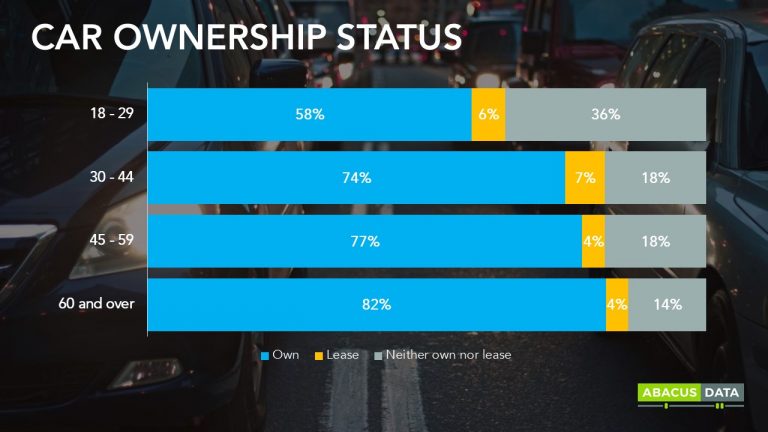
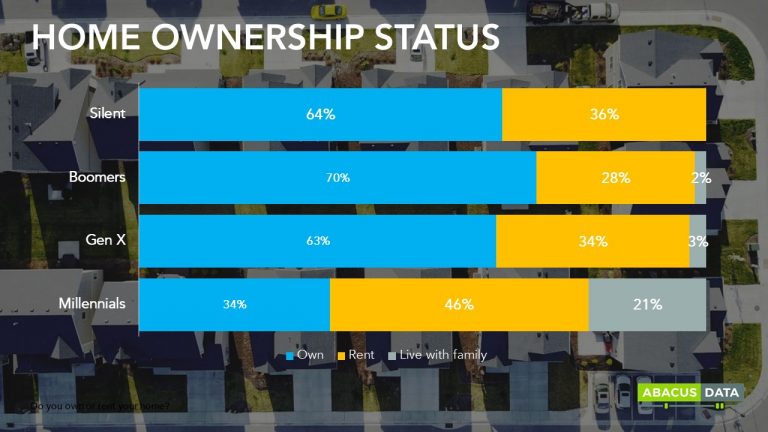
If more people share their cars, homes, and even dinner plates, fewer “things” will need to be produced. For example, our data shows us that only a third of millennials own their own home, choosing to rent or live at home with their parents instead. The same trend is true with cars; 36% of millennials neither own nor rent a car, whereas only 18% of boomers and Gen Xers do not own or rent a car. If your company produces goods that are traditionally owned by a single person or family, try the following exercise: take your current number of customers and subtract a third of them… the remainder is your new customer base after the sharing economy takes its portion. You can see how this trend of non-ownership can drastically change the global economy. Business models, regulations, and even societal conventions have to change to cope with the new super-charged sharing economy. Millennial culture is sharing culture and it looks like we will be living in a more “shared” world in the years to come.
At Abacus we strive to understand the nuances of generational change and how it impacts you and your business. The Canadian Millennials Report is the largest syndicated study of millennials in Canada. We survey 2,000 millennials twice a year on a range of topics including politics, social values, and consumer trends. If you are interested in learning more about this generation, reach out to us and we would be happy to connect.
Gone are the days of diligent church-going twenty-somethings, and after work drinks at the social club for the mid-career millennial employees. It’s apparent that millennials social lives are drastically different, and not just because of the high usage rates of social media apps such as SnapChat and Instagram used to communicate over the classic postal system. Private clubs, such as country clubs, have seen a 15% decrease since 2003 and if you walk into an annual meeting for organizations such as Lion’s Club, Kiwanis, and Rotary, you are likely to see more grey hair than not.
Organizations and groups with traditional memberships are seeing a decline in millennial attendance and participation. Is it plausible that there are financial and time restraints to millennials participation? Time and money are two things millennials don’t have a lot of, yet, that doesn’t seem to fit because even though country clubs require money, and organizations like rotary requires time, millennials are still forgoing other memberships opportunities like attending church services (services that range from 1-2 hours a week and requires no financial contribution). . So, what gives? Millennials are all about creating online communities, and Facebook specifically filters content to foster and strengthen online communities. So why are so many traditional member organizations not seeing the same growth in numbers?
We offer a few explanations and present the argument that Millennial members are not disappearing, but rather changing how and what they decide to become members of.
Cost
According to a study by Goldman and Sachs, price is more important for millennials than non-millennials and quality is slightly less important for millennials compared to non-millennial. This trend extends to millennials views on clubs and memberships. The Club Managers Association of America commissioned a study in 2016 to better understand the behaviours of millennials and club membership. They found that for two in three millennials (63%) the financial obligations of club membership were a barrier to signing up for a membership.
Social Values
The same study by the Club Managers Association of America found that while cost was seen as a barrier, it was not the biggest. Twenty-three per cent answered lifestyle fit as the biggest barrier to joining a club. Millennials still crave a sense of belonging among their peers like every other generation, but the way in which they can obtain the sense of belonging is shifting. Millennials still pay monthly fees (they can’t get enough of those subscription boxes, meal kits, and hot yoga memberships), but their likelihood to share the same values as traditional, institutional organizations is changing, and thus, the average millennials likelihood to become a member has changed as well.
The Goldman Sachs study reveals that a strong brand is not enough to draw millennials to purchase a product anymore. And when asked, only 10% said it was important to them to own a luxury handbag, which signifies as a status symbol. Instead, millennials take a more ethics-oriented approach when making spending decisions. According to a creative agency in the States, 64% of millennials would choose a socially-conscious brand over a luxury one. This is relevant to memberships that pride themselves on status, luxury, and exclusivity to promote their businesses and communities. These millennial values are not traditionally synonymous with clubs and institutions that rely on status, luxury, or event exclusivity.
Convenience
Last is the reason for almost any millennial behaviour, convenience. Many membership organizations of the past depended on the fact that social interactions almost always needed to take place in person. If people wanted to surround themselves with like-minded individuals, they signed up for the club or association where they could meet and interact with those individuals. Now with the internet, millennials can feel connected and surrounded by like-minded people no matter their physical location. Church worships are live-streamed, comment sections on Instagram photos are full of discussions with like-minded individuals, and there are even apps dedicated to people making friends with similar interests. With these online connections, millennials don’t need to waste their precious time driving out to the country club, or community centre.
The good news for traditional membership organizations is that millennials, as a generation, are social. It’s just the way in which they choose to connect that has changed and the market for memberships will have to adapt and restructure their programming to gain the money, time, and social lives.
At Abacus we strive to understand the nuances of generational change and how it impacts you and your business. The Canadian Millennials Report is the largest syndicated study of millennials in Canada. We survey 2,000 millennials twice a year on a range of topics including politics, social values, and consumer trends. If you are interested in learning more about this generation, reach out to us and we would be happy to connect.
As the May 16 Election Day approaches in Newfoundland and Labrador, a new survey of 700 eligible voters conducted by Abacus Data finds the Progressive Conservatives lead the incumbent Liberal Party by 5-points.
Here’s what we found:
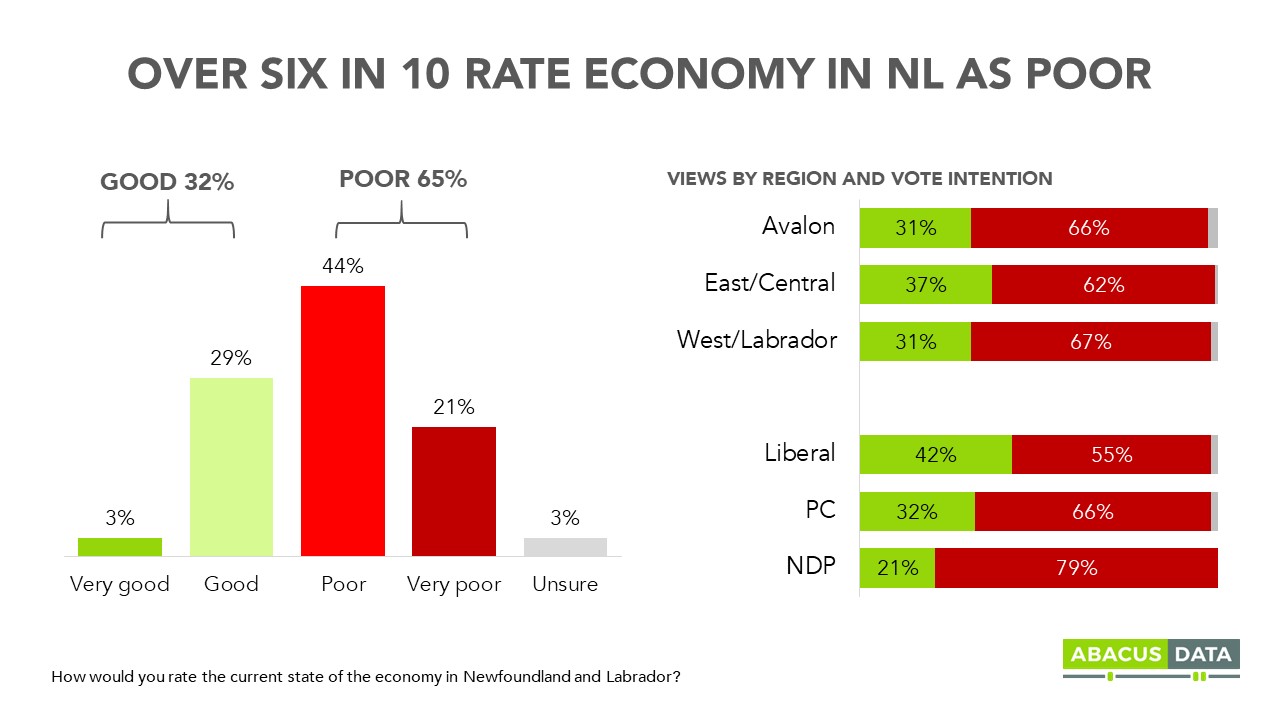
#1: A SLIGHT MAJORITY OF ELIGIBLE VOTERS FEEL THE PROVINCE IS HEADED IN THE WRONG DIRECTION AS 65% DESCRIBE THE PROVINCIAL ECONOMY AS POOR OR VERY POOR.
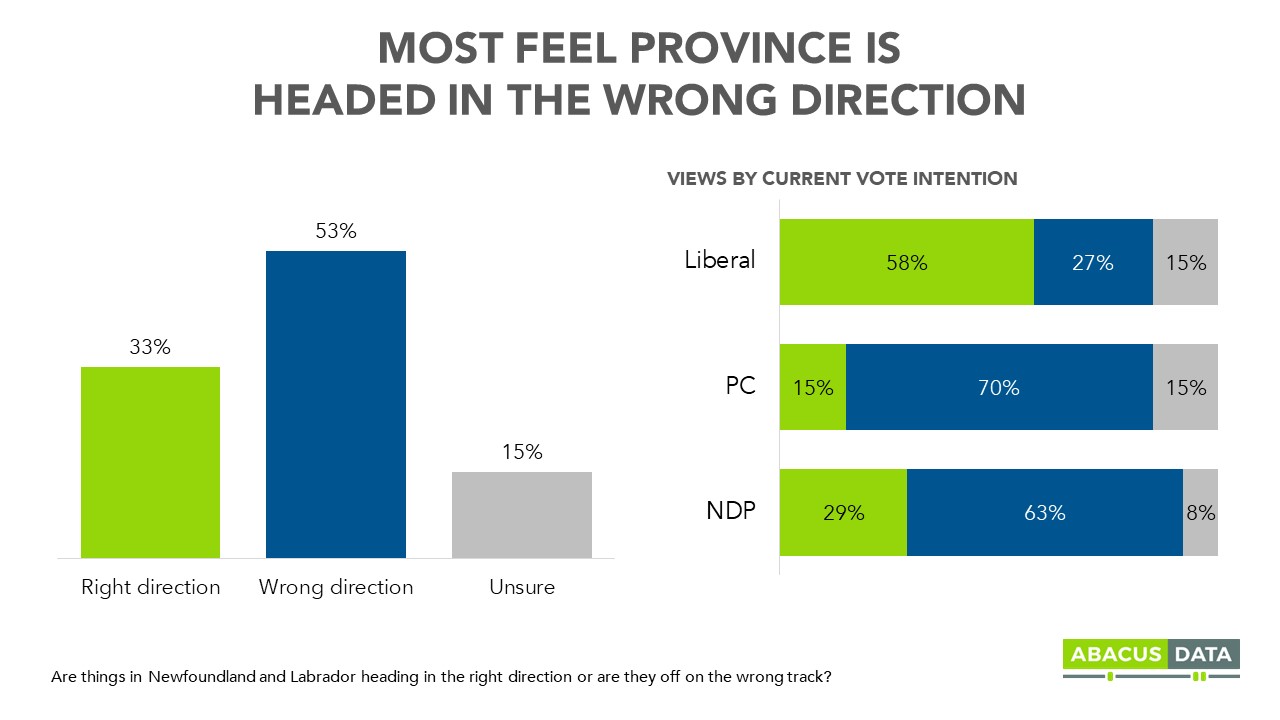
When asked to assess the direction of the province overall, 53% feel it is off on the wrong track compared with 33% who feel it’s headed in the right direction. Not surprisingly, Liberal supporters are more likely to think things are going in a positive direction, where most PC and NDP supporters think it’s headed in the wrong direction.
Negative assessments of the provincial economy seem to be a key driver in the negative mood overall. 65% of eligible voters in NL feel the economy is currently poor or very poor compared with 32% who feel it’s good or very good. Views are consistent across the province. Liberal supporters are slightly more optimistic about the economy when compared with NDP and PC supporters.
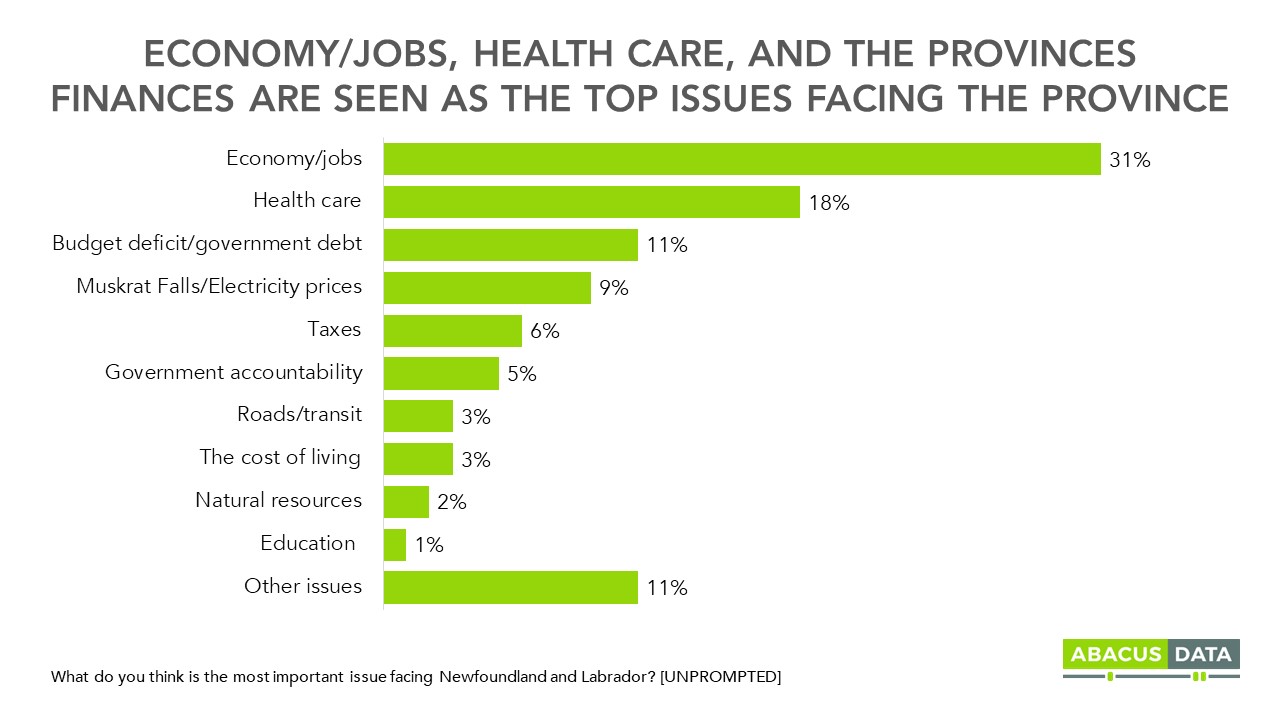
#2: THE ECONOMY, JOBS, AND HEALTH CARE ARE THE TWO MOST CITED TOP ISSUES FACING THE PROVINCE. PROVINCIAL FINANCES, MUSKRAT FALLS, ELECTRICITY PRICES, AND TAXES ROUND OUT THE TOP 5.
When asked to identify the top issue facing the province, unprompted, 31% said the economy or jobs was the top issue, followed by 18% who mentioned something related to health care and 11% who mentioned the state of the province’s finances. Another 9% mentioned Muskrat Falls or electricity prices while 6% mentioned taxes.
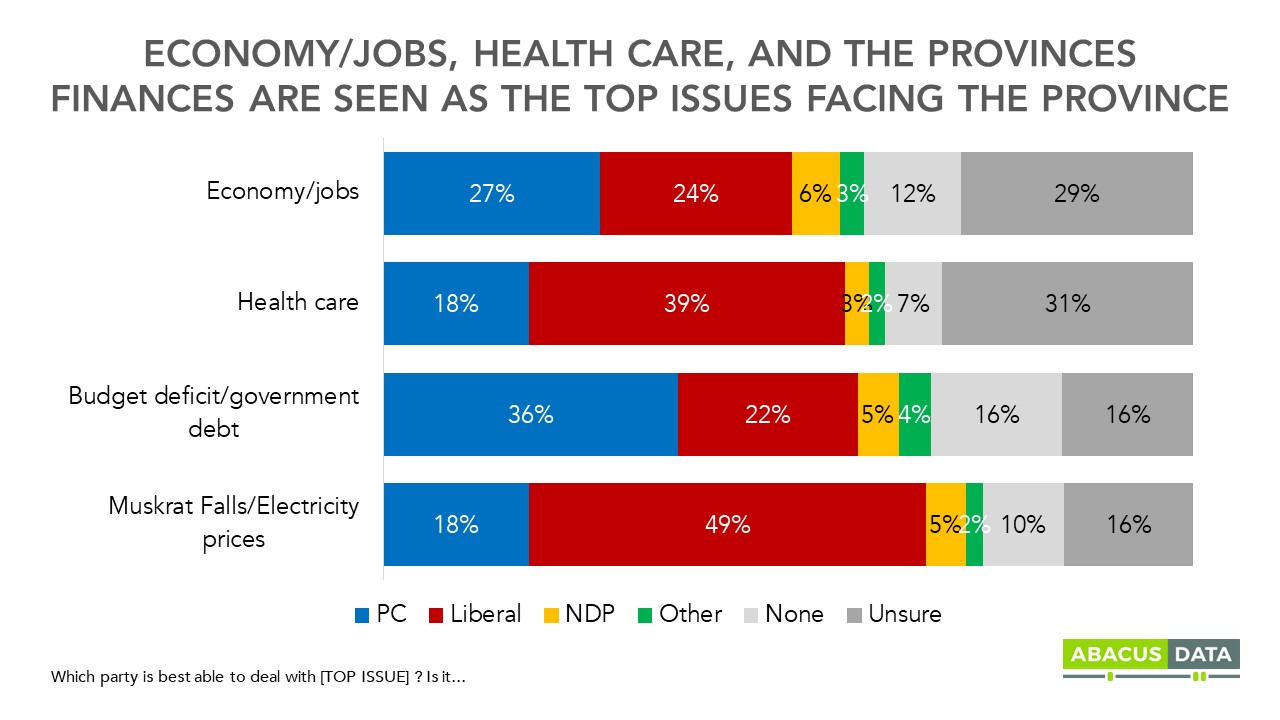
When asked which party is best able to deal with the issue they think is most important, the PCs and Liberals were close among those who said the economy and jobs was the top issue. The Liberals lead among those who care about health care while the PCs have an advantage among those concerned most about the province’s finances.
Of note, for all four of the top issues, at least a third of respondents either said none of the parties were best to deal with the issue or were unsure about which was best. This suggests there’s a high level of ambivalence about the choices voters have in the election.
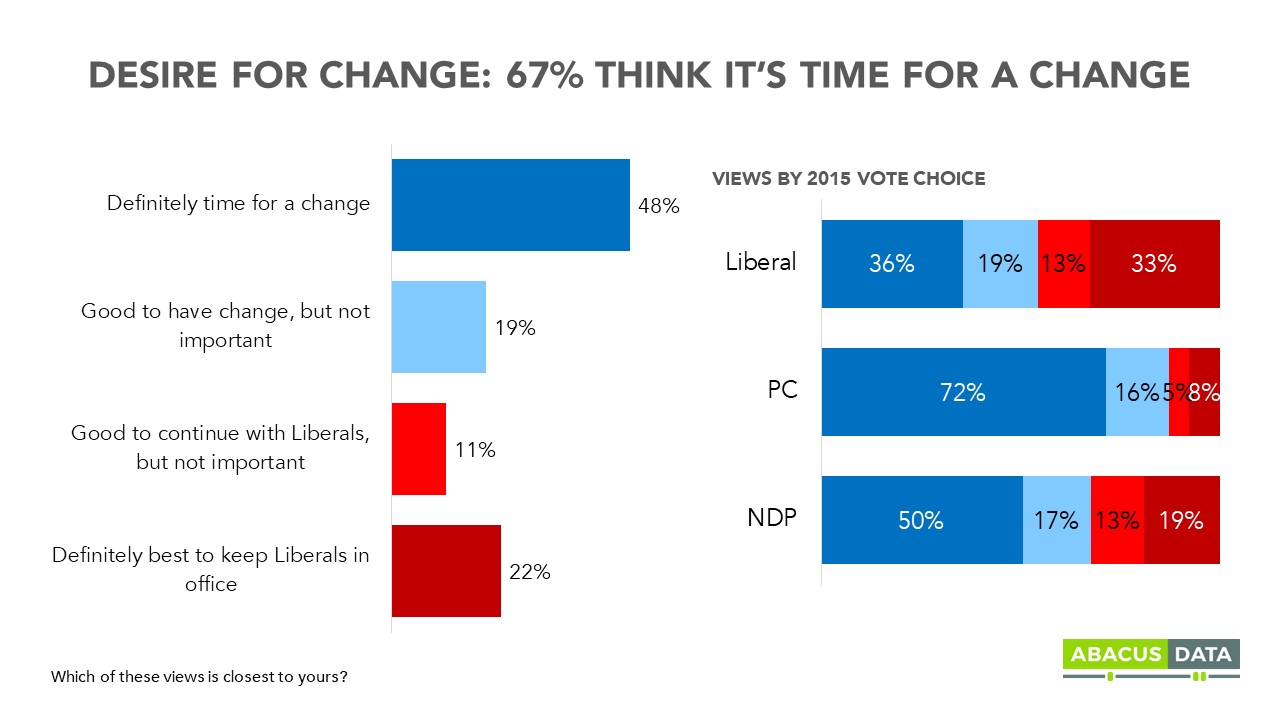
#3: TWO IN THREE ELIGIBLE VOTERS IN NL THINK IT’S TIME FOR A CHANGE, INCLUDING 48% WHO DEFINITELY WANT A CHANGE IN GOVERNMENT.
When asked whether it is time for a change in NL or whether the Liberals should be kept in office, 67% preferred a change in government, although less than half (48%) felt that it was definitely time for a change in government. In contrast, 22% felt that it was definitely best to keep the Liberals in office
Among those who say they voted Liberal in the 2015 provincial election, 36% think it is definitely time for a change in government while 33% think the government definitely should be re-elected. For the Liberals to win, they need to reinforce those who want them re-elected while convincing the 19% who want change but say it’s not that important to them to come back into the Liberal fold.
For comparison purposes, at the start of the 2018 Ontario election, 60% of voters felt it was definitely time for a change in government while 59% felt the same way at the start of the 2015 federal election. Dwight Ball and the Liberals face headwinds in their quest for another term but they don’t seem as strong as those faced by recent governments who ultimately were defeated.
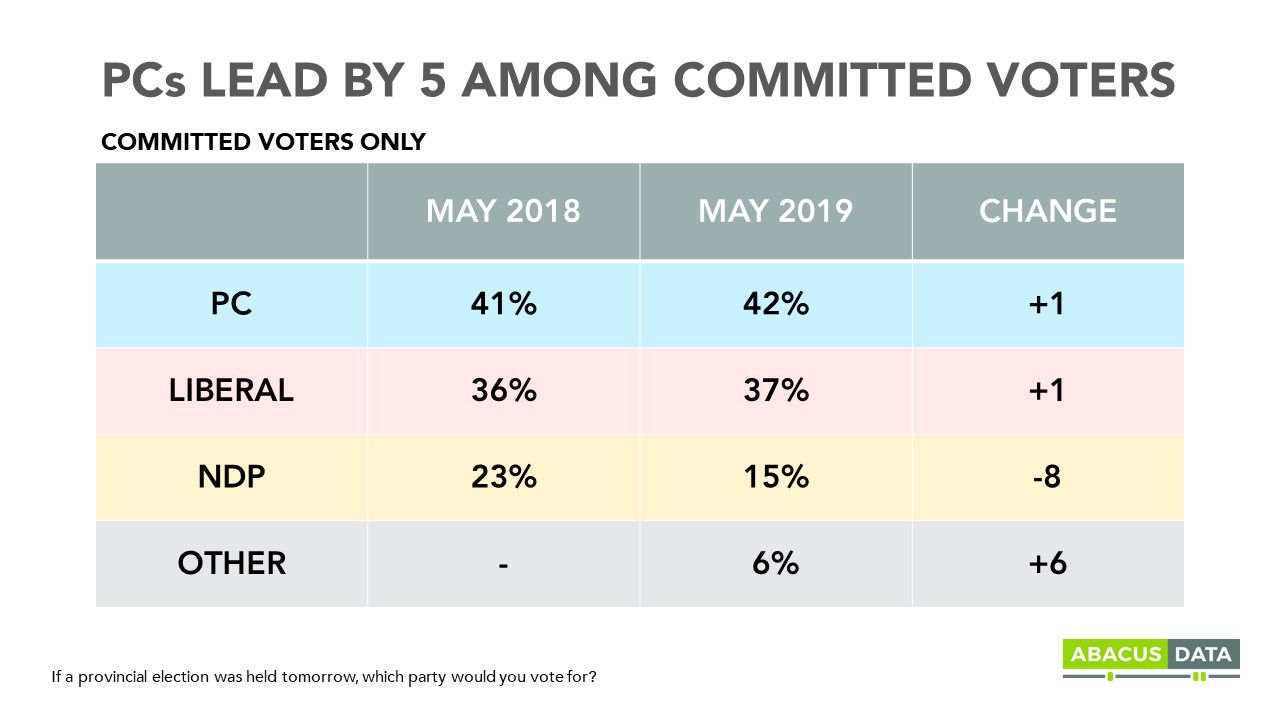
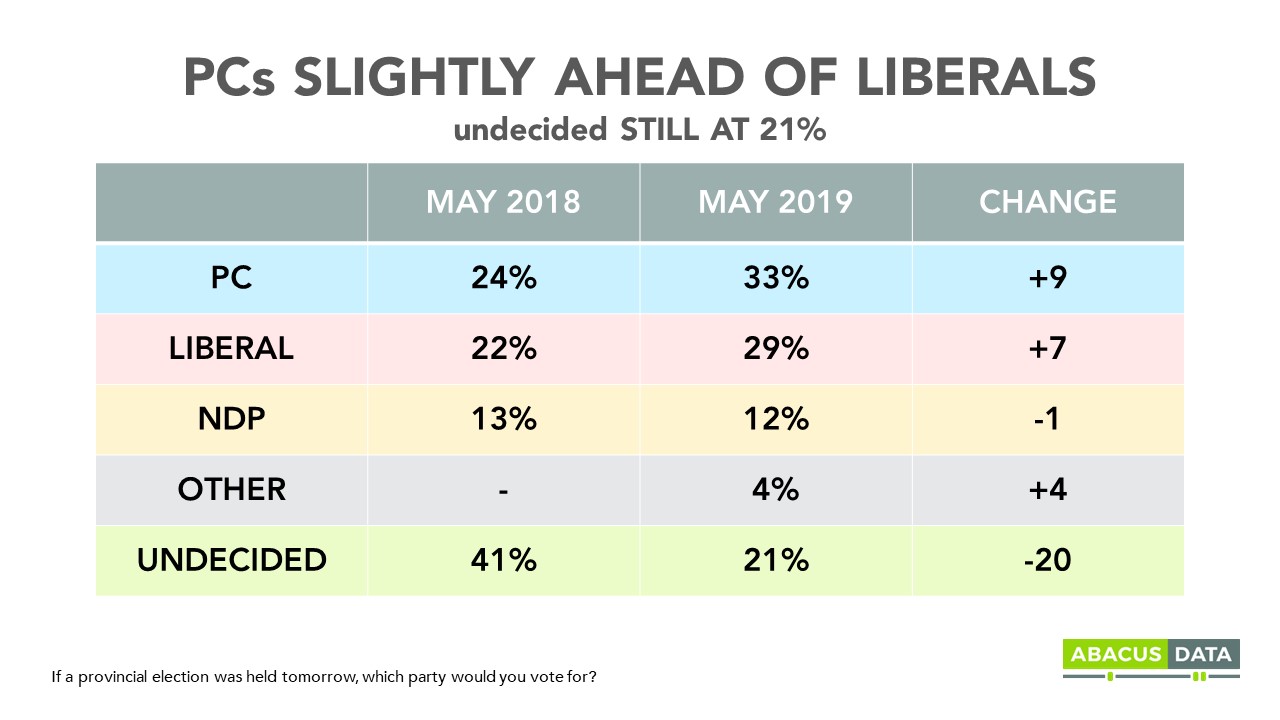
#4: ADVANTAGE PC: THE PCs LEAD BY 5 POINTS OVER THE LIBERALS AMONG COMMITTED VOTERS 42% TO 37% WITH THE NDP AT 15%. 21% OF ELIGIBLE VOTERS REMAIN UNDECIDED AT THIS POINT.
When asked how they would vote if the election was held at the time of the survey, 42% of committed respondents would vote PC with the Liberals 5-points back at 37%. 15% would vote NDP while 6% said they would support another party.
Compared with our survey conducted in May 2018, the ballot is largely unchanged for the two largest parties. The NDP vote share is down 8 while support for another party is up 6.
Given that the NDP is only running 14 candidates and the NL Alliance is running only 9 candidates, many respondents will not have a candidate for either party on their ballot and so we may be overestimating support for both parties.
As the PCs lead by 5, there are still many undecided voters. Overall, 21% of respondents say they are undecided – high for this stage of the campaign – but down 20 points from a survey we did a year ago.
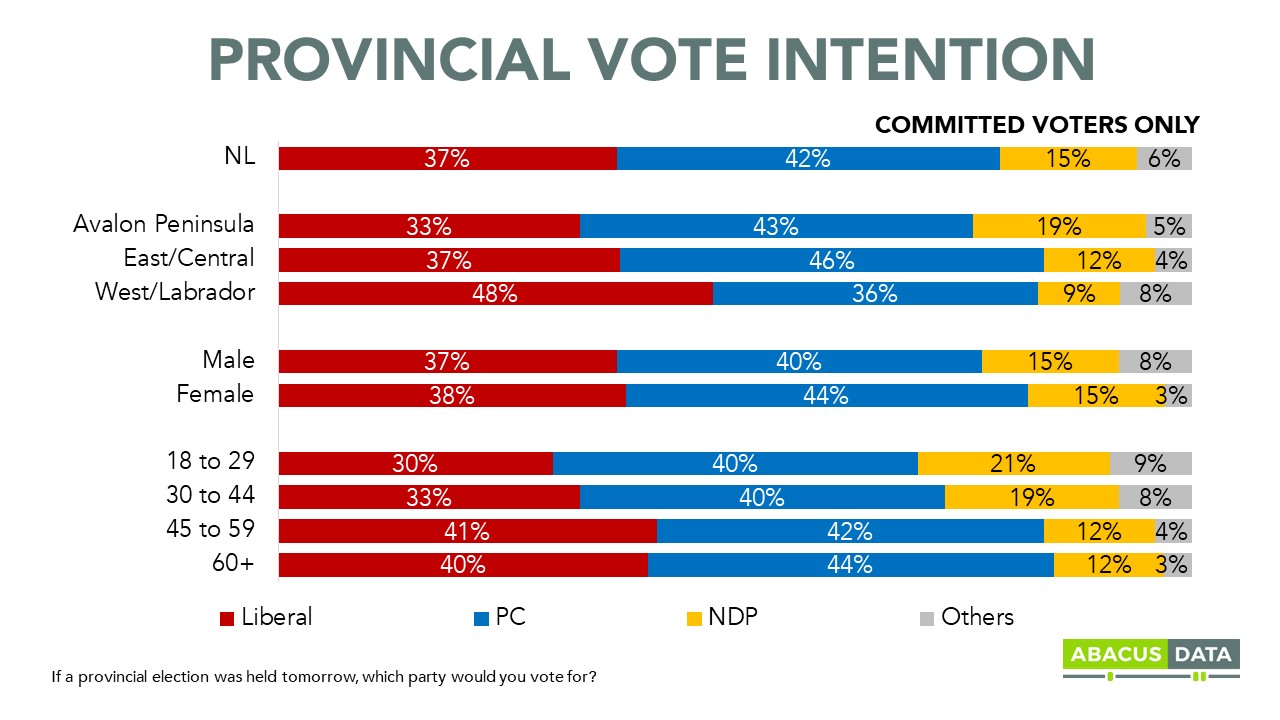
Regionally, the PCs lead on the Avalon Peninsula and in the east and central regions of the province while the Liberals lead in the western part of the province and in Labrador.
Demographically, the PCs lead among both men and women, and across all age groups, although the NDP does better among those under 45.
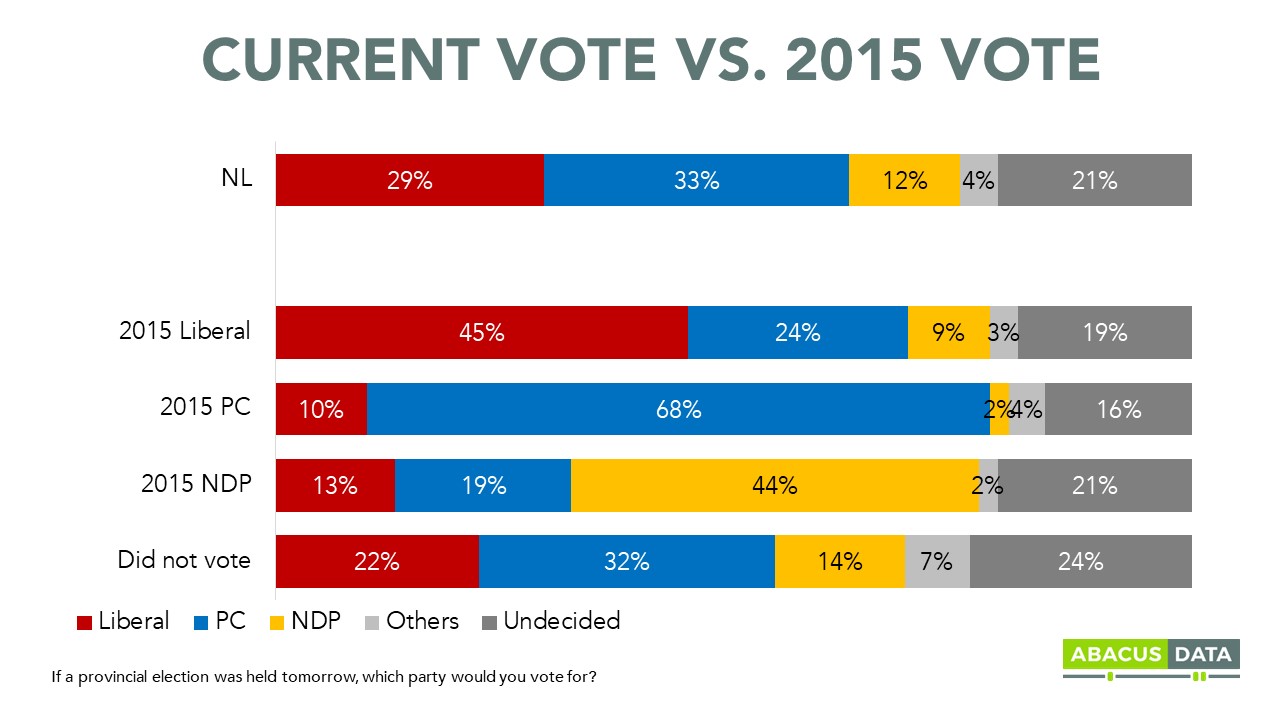
Half of those who say they voted Liberal in the 2015 provincial election now say they will vote for another party or are undecided. The same is true of those who voted NDP in 2015. In contrast, the PCs have held onto over two-thirds of their past vote.
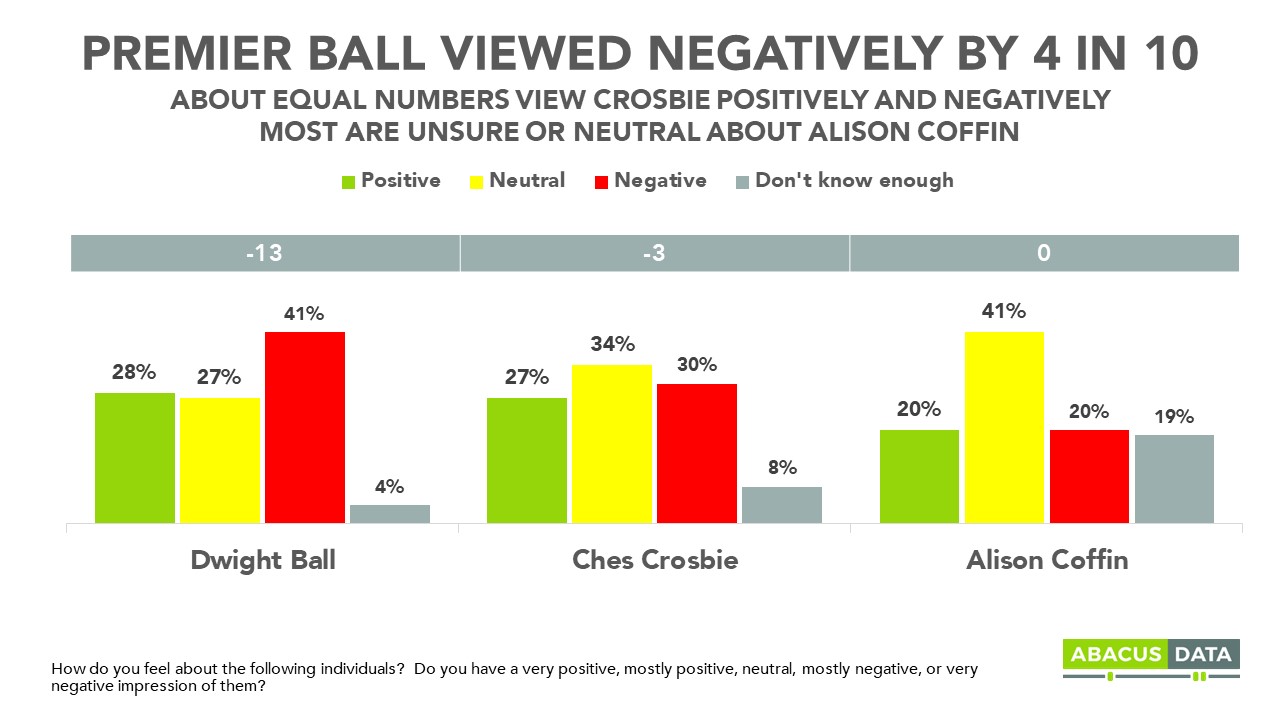
#5: 4 IN 10 HAVE A NEGATIVE VIEW OF DWIGHT BALL, HIGHER THAN BOTH CHES CROSBIE AND ALISON COFFIN.
When we ask about the three main party leaders, we find that no single leader is liked by a sizeable group of voters. Liberal Leader Dwight Ball has the highest negatives while NDP Leader Alison Coffin is not well known and those who do know of her mostly have a neutral impression.
PC Leader Ches Crosbie has a mixed image. 27% of eligible voters have a positive view of him while 30% have a negative view. One in three says their impression of the PC leader is neutral.
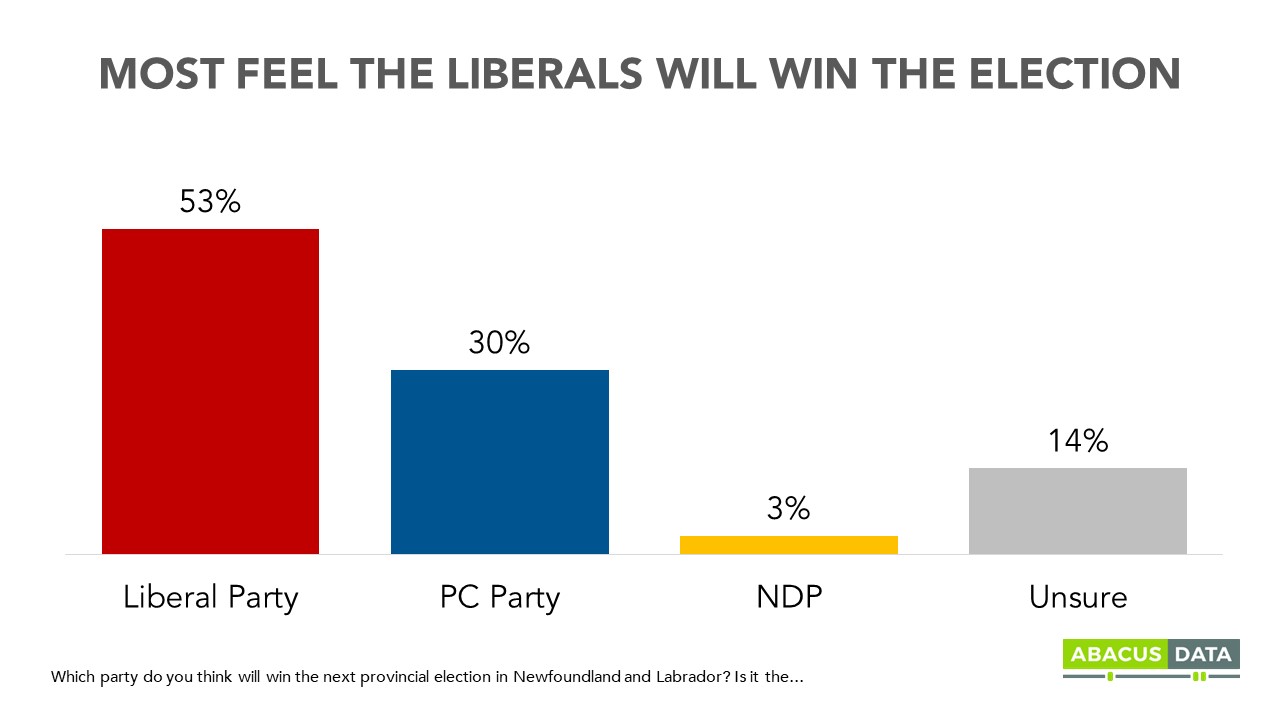
#6: DESPITE TRAILING THE PCs IN THE POLL, MOST ELIGIBLE VOTERS THINK THE LIBERAL PARTY IS GOING TO WIN THE PROVINCIAL ELECTION.
Most eligible voters in the province still expect the Liberals to win the election, despite the party trailing in the polls.
UPSHOT
With just over a week to go in the provincial election campaign, Ches Crosbie and the PCs have a small, but statistically significant, lead over the incumbent Liberals and Dwight Ball.
The PC lead is built on strong support on the Avalon Peninsula and in the eastern and central regions of the province. The party also finds support among all demographic groups.
Despite this lead, a few variables suggest that the election may still be too early to call.
First, none of the leaders are particularly well-liked and people haven’t formed much of an opinion of Mr. Crosbie. While Mr. Ball’s negatives are higher, his overall image is more positive than some recent premiers who have been defeated at the provincial level.
Second, as the NDP is only running candidates in 14 constituencies, it is difficult to predict how those who would normally vote NDP might vote without their preferred party on the ballot. 77% of NDP supporters would prefer a change in government, although only 66% say it’s definitely time for a change. At the same time, NDP supporters are just as likely to have a negative view of Mr. Ball as they are of Mr. Crosbie and so how they end up voting, if they do at all, may depend on which of the two men they would prefer as premier.
Finally, if over the next week, the debate turns more decidedly to the province’s health care system, the Liberals may benefit. If, on the other hand, voters increasingly frame their choice around who is best to manage the province’s finances, the PC support might grow. Given that many voters remain unsure who is best to manage the economy and that issue is most likely to be top of mind for voters, the party perceived to have the best plan to manage the economy may ultimately prevail.
METHODOLOGY
The telephone was conducted with 700 eligible voters in Newfoundland and Labrador between May 2 to 5, 2019. 65% of interviews were conducted on cell phones while 35% were conducted on landlines.
The margin of error for this study is +/- 3.8%, 19 times out of 20.
The data were weighted according to census data to ensure that the sample matched Newfoundland and Labrador’s population according to age, gender, educational attainment, and region. Totals may not add up to 100 due to rounding.
ABOUT ABACUS DATA
We are the only research and strategy firm that helps organizations respond to the disruptive risks and opportunities in a world where demographics and technology are changing more quickly than ever.
We are an innovative, fast-growing public opinion and marketing research consultancy. We use the latest technology, sound science, and deep experience to generate top-flight research-based advice to our clients. We offer global research capacity with a strong focus on customer service, attention to detail and exceptional value.
Find out more about how we can help your organization by downloading our corporate profile and service offering.
Don’t miss any of our releases and receive our weekly “Worth a Look” newsletter by signing up for our email list. We promise no more than 2 emails a week… unless there’s something really important we want to share.
Last week, we completed a nationally representative survey of 4,015 Canadians and explored their views on Canadian politics to update our regularly tracking.
Here is what we found:
MOOD OF THE COUNTRY
One in three Canadians feels that the country is heading in the right direction while 45% who say it is on the wrong track, unchanged from March but a big downward shift from December.
Across the country, Quebecers are the most positive (43% right direction) while Albertans remain the most unhappy (20% right direction). But probably the most revealing finding under the surface of this trend, is the fact that barely half (51%) of those who say they voted Liberal in 2015 feel the country is headed in the right direction, 30% think it’s off on the right track while 19% are unsure.
FEDERAL GOVERNMENT APPROVAL
Similarly, views of the federal government’s performance hit a new low in our latest survey. Today, 32% approve of the job the federal government is doing. For most of 2018 approval ranged between 42% and 45%.
CURRENT VOTING INTENTION
Voting intentions have been trending down from the Liberals and the Conservatives are currently ahead by three points nationally. Today, 34% would vote Conservative today compared with 31% for the Liberals. 17% would back the NDP while 9% would vote Green. For the Liberals, this represents a 7-point drop in 5 months, while the Conservatives are up slightly, but not much higher than our reading of public opinion at the end of 2018 and before the SNC-Lavalin controversy. Support for the NDP has remained very steady while the Greens have inched up from 7% in December to 9% today.
Regionally, the Conservatives hold a massive lead in the Prairies while the Liberals lead by double digits in Quebec and by four in BC. Ontario remains highly competitive while the margin between the Liberals and Conservatives in Atlantic Canada has closed from 26 points at the end of December to 5 points today.
Due to the large sample size in this study, we can also look at vote intention across different demographic and socioeconomic subgroups. Here’s what we find:
• The Conservatives lead by 7 points among men and are tied with the Liberals at 31% among women. • The Conservatives have an 8-point lead among Baby Boomers and a 4-point lead among Gen X. The Liberals lead by just 3 among Millennials, who are more likely than other generations to support the NDP or Green Party. • Conservatives have the largest lead among Boomer men (16 points) and Gen X men (10 points) while among Boomer women and Gen X women, the Liberals are more competitive. Among Millennial men, the Liberals lead by 3 over the Conservatives while among Millennial women, the Liberals are slightly ahead of the NDP with the Conservatives in third among this group. • The Green Party does best among Millennial women (16%) and worst among Boomer men (6%).
But perhaps more important than demographic analysis is the question of how motivated each party’s support group is. Focusing on those voters who say they are most motivated to vote in the upcoming election (about 62% of respondents), the Conservatives have an 8-point lead.
ACCESSIBLE VOTER POOLS
A critical factor for any party competing in an election is the size of the total accessible voter pool – how many people say they might consider supporting your candidates.
Right now the Conservative (50%) and Liberal Party (48%) have roughly equal sized accessible voter pools. The NDP has a slightly smaller pool at 44% of Canadians down significantly in Quebec over the past few months where only 35% would now consider voting NDP. The 48% number for the Liberals is the lowest we have seen since the 2015 election and down 19 points from its peak.
We’ve seen a marked rise in the number of Canadians open to voting for the Green Party. In July 2018, only 33% said they would be open to voting Green. Today, they are at 40% – the highest we have ever tracked them and only 4 points behind the NDP.
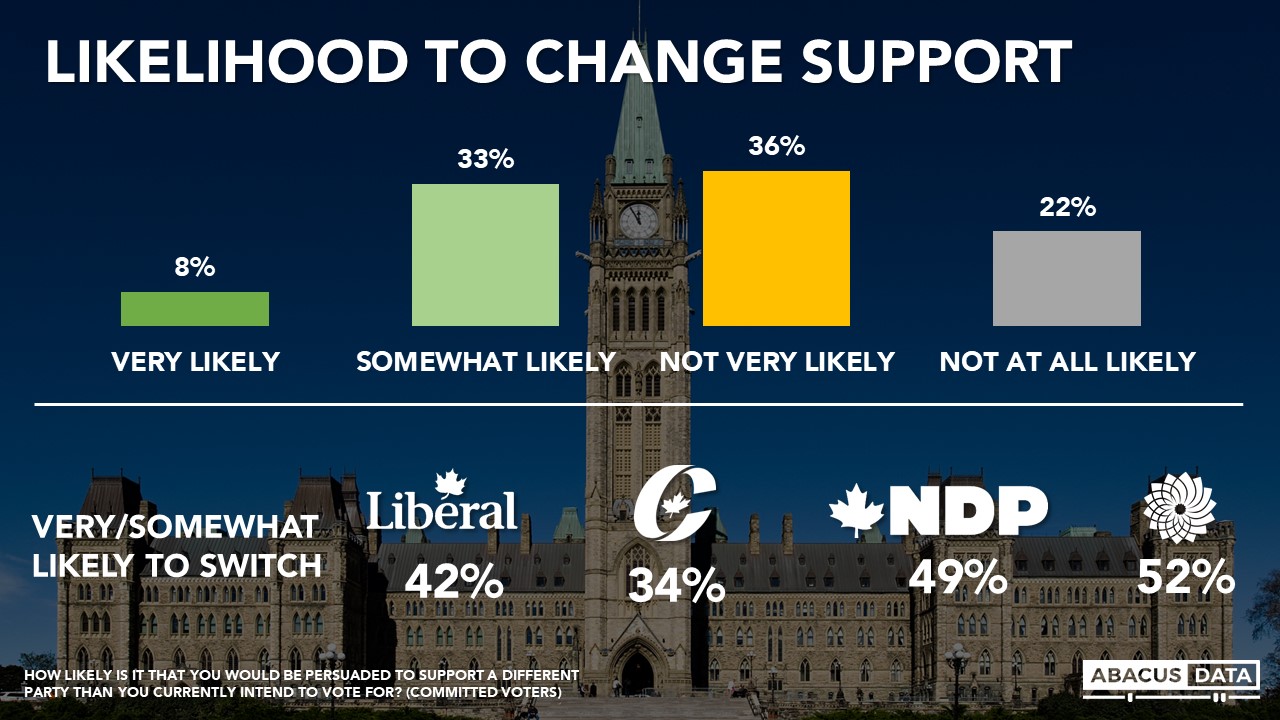
EXPLORING POTENTIAL VOLATILITY IN THE ELECTORATE
The extent to which vote intentions and accessible voter pools have shifted over the past few months demonstrates a relatively level of volatility within the electorate.
One way to measure this is to ask respondents how likely it is that they would switch their vote preference before voting in the October election. Overall, we find that 41% of respondents say they are either very (8%) or somewhat likely (33%) to be persuaded to support a different party than the one they currently intend to vote for. And a substantial portion of supporters of all parties says they could be persuaded to switch support – including half of current Green and supporters, 42% of Liberal supporters, and one in three Conservative supporters.
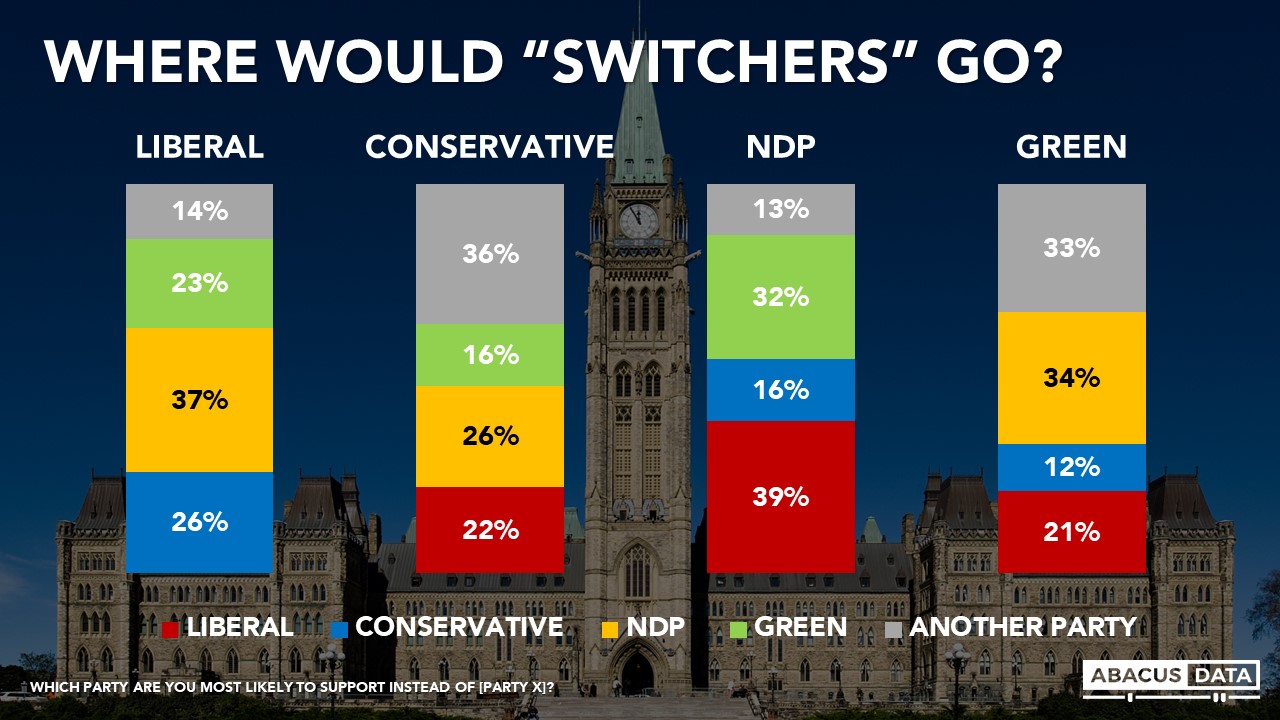
When we ask which party they might support if switched their preferences (their second choice in other words), we find:
• Disaffected Liberals would be more likely to vote NDP than Conservative, with the Green Party also seeing a lift. • Disaffected New Democrats would tend to help the Liberals, but the Greens would also benefit. • Disaffected Greens would be more likely to vote NDP than Liberal • Disaffected Conservatives would, remarkably, be more likely to vote NDP than Liberal.
These patterns show is limited second choice growth potential for the Conservatives, but a more serious signal to the Liberals that they are not as competitive on the left, centre or right than they have tended to be in the past.
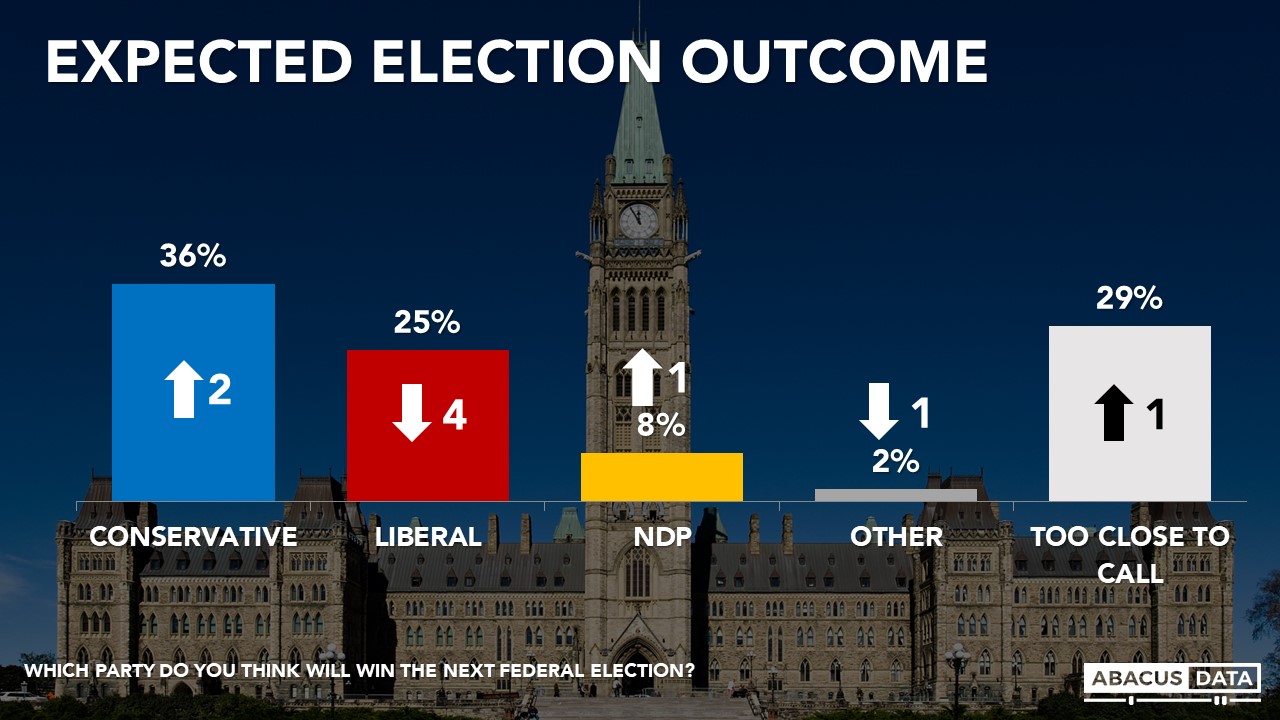
EXPECTED ELECTION WINNER
Canadians are more likely to think the Conservatives (36%) will win the next election than the Liberals (25%) while 3 in 10 think it’s too close to call. Since March, expectations of a Conservative win are up 2 while expectations of a Liberal win are down 4.
THE LEADERS
Today, almost half of Canadians have a negative view of the Prime Minister, about 10 points higher than at the end of 2018. This is also the first time in our tracking that we have seen two months in a row of net negative impressions of Mr. Trudeau.
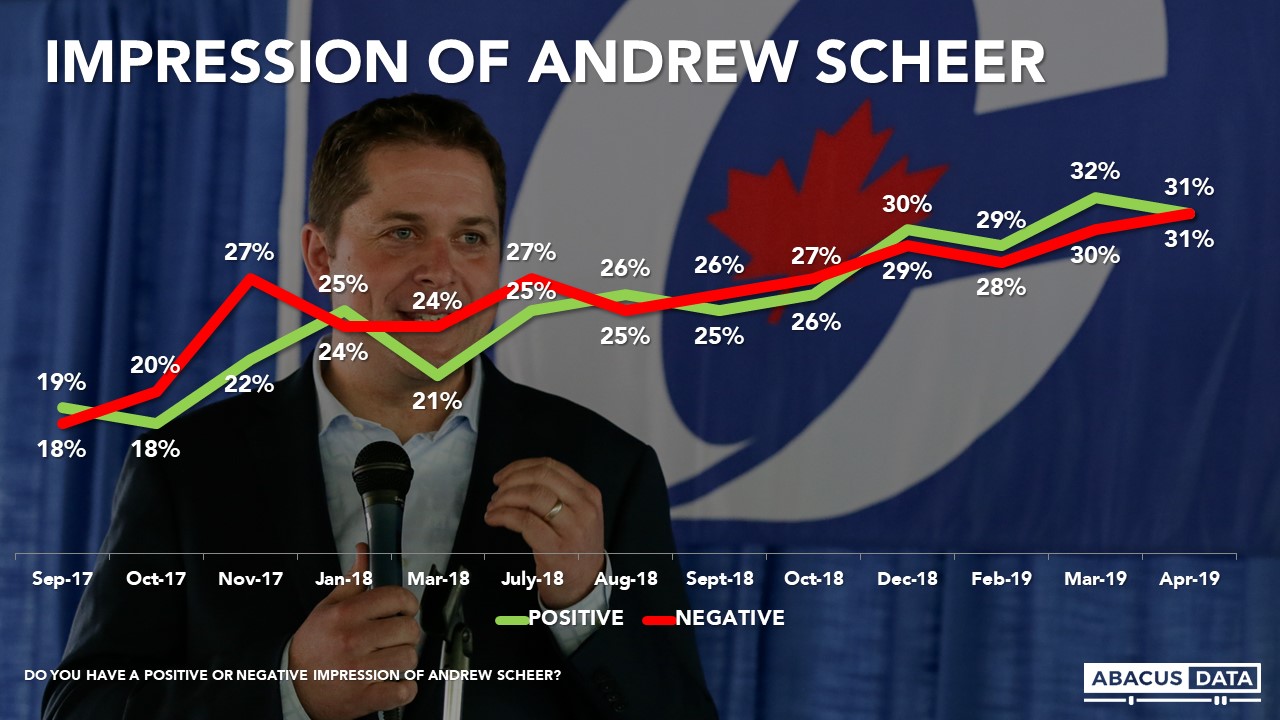
Canadians are getting to know Andrew Scheer more over time and his positive and negative impressions remain equal. Today 31% have a positive view of the Opposition Leader while 31% view him negatively.
Jagmeet Singh’s and Elizabeth May’s numbers have improved. For most of 2018 and early into 2019, Canadians who knew Mr. Singh were more likely to have a negative view of him than a positive one. That’s still the case today but the gap is much smaller.
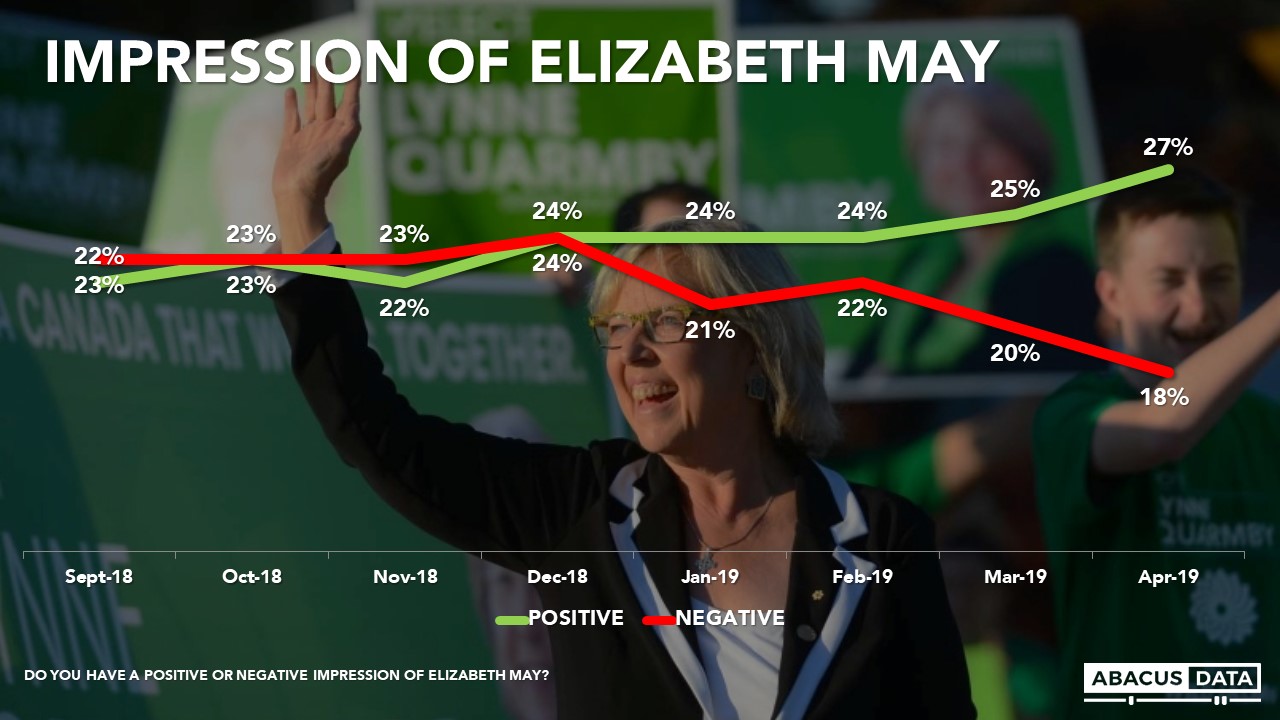
Today 27% of Canadians have a positive view of Ms. May while 18% view her negatively. Of four leaders of national parties, Ms. May has the most positive net score. In 2019, Ms. May saw growth in positives of 4 and a decline in negatives of 6.
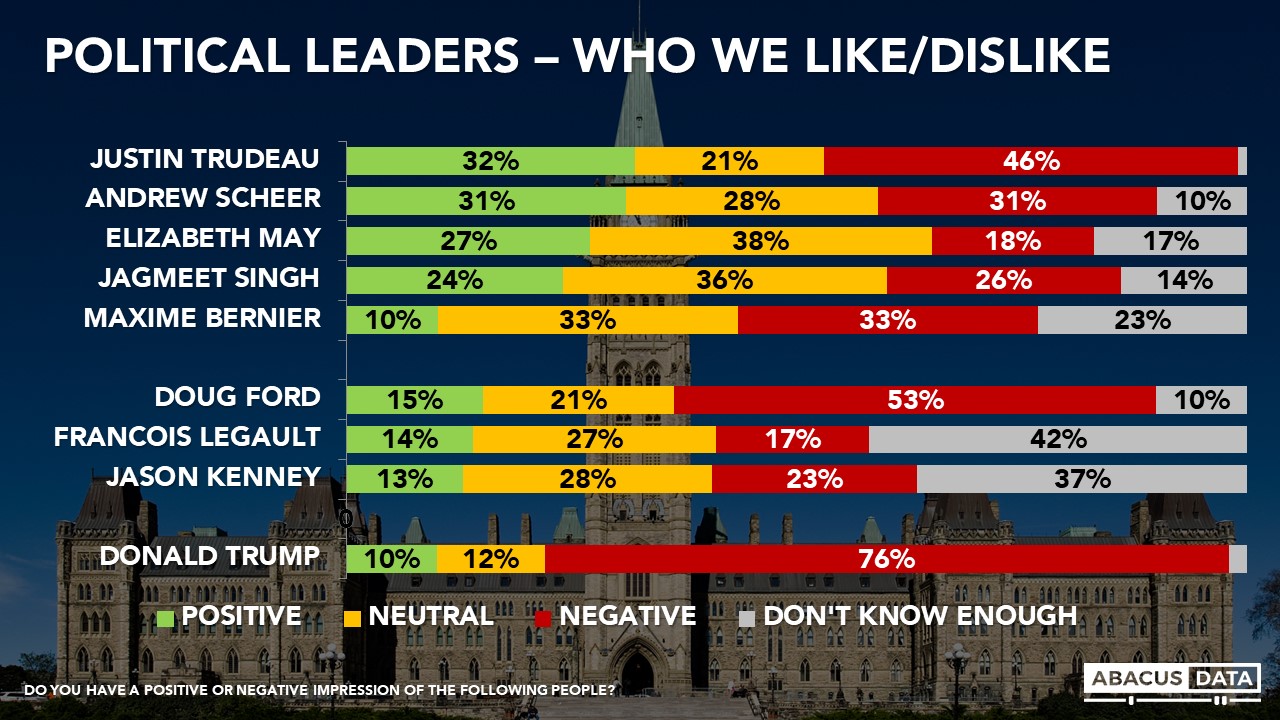
Finally, given that a number of provincial premiers have been active in debates about federal issues and Donald Trump looms large over everything, it’s worth looking at how Canadians view some of the provincial premiers and the US President to the federal leaders.
Mr. Trump remains deeply unpopular in Canada while Ontario Premier Doug Ford is viewed negatively by 53% of Canadians compared with 15% who view him positively. Mr. Ford has a greater profile nationally than Andrew Scheer, Elizabeth May, or Jagmeet Singh. Alberta Premier Jason Kenney is less well known nationally but has a net negative impression among those with an opinion.
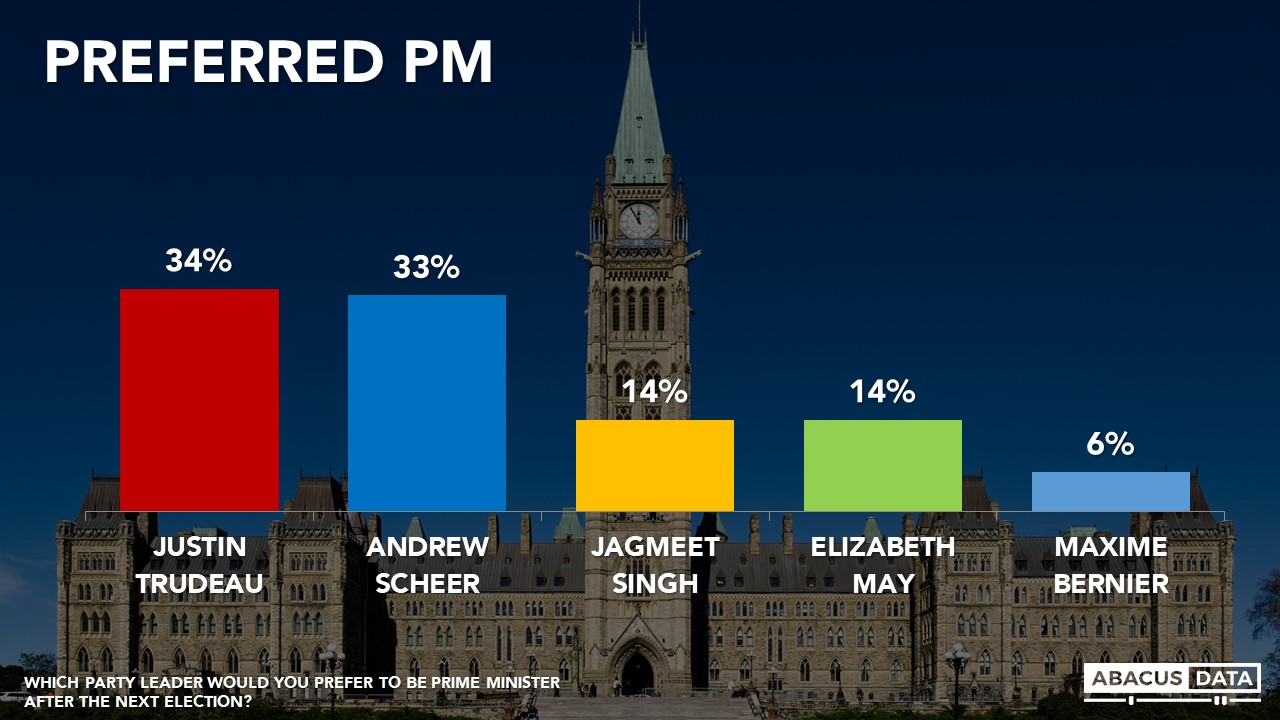
PREFERRED PRIME MINISTER
When we ask people who they would prefer to see as Prime Minister after the next election, 34% would prefer Mr. Trudeau compared with 33% who would prefer Mr. Scheer. Elizabeth May and Jagmeet Singh are tied at 14% each.
For Mr. Trudeau, this represents an 11-point drop since the end of January while Mr. Scheer, Ms. May and Mr. Singh are all up 4-points.
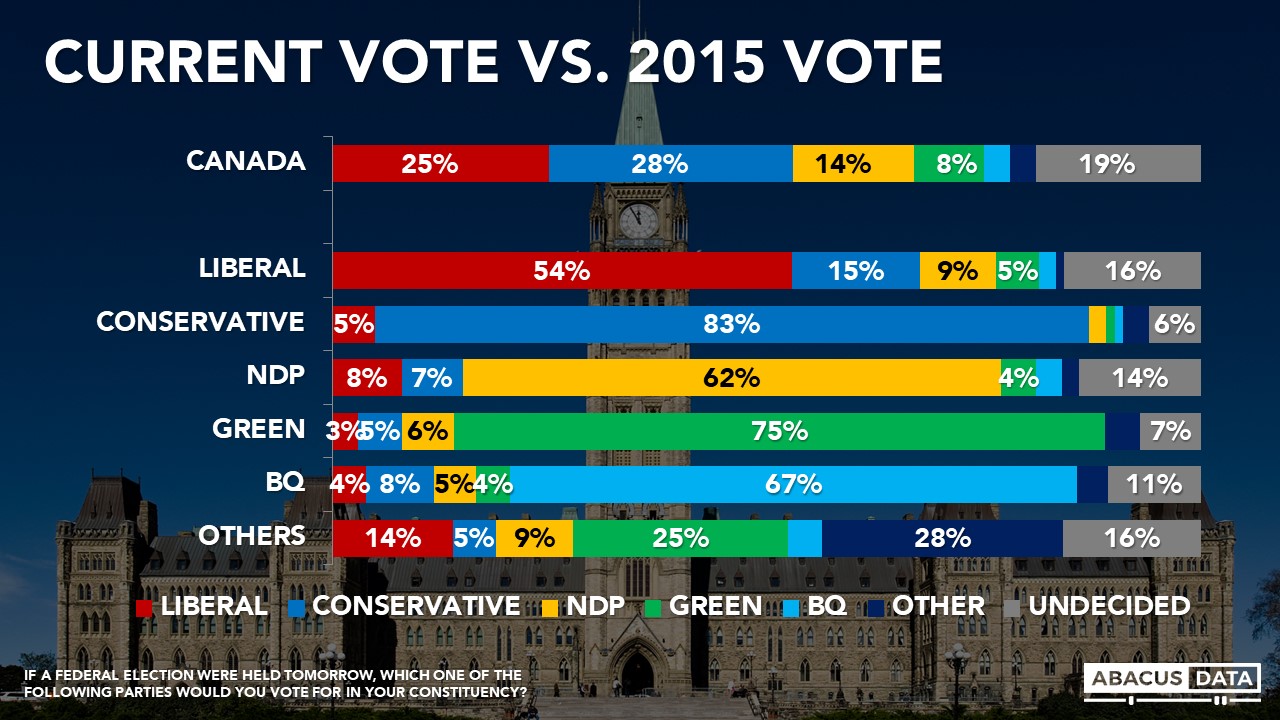
UNDERSTANDING THE LIBERAL SWITCHERS
The Liberal Party is trailing the Conservatives because a large portion (46%) of its past supporters are now supporting another party or are at least unwilling to commit to supporting the Liberals again this year.
By our estimates, 5% of the electorate are past Liberal voters who are now undecided, 4% are past Liberal voters who now support the Conservatives (LPC/CPC), and 2% are past Liberal voters who now support the NDP (LPC/NDP).
Thanks to the large sample size of this study (n=4,015), we can understand the opinions of each group and what might have caused them to defect from the Liberal fold.
Liberal to Conservative Switchers (4%) of the electorate.
Almost everyone in this segment (97%) wants to see a change in government and the vast majority (82%) have a negative view of Mr. Trudeau. 87% would prefer Mr. Scheer to become Prime Minister after the next election which is 13 points higher than the number of who have a positive view of the Conservative leader. Two-thirds think the country is headed on the wrong track.
To some extent, these voters are reluctant Conservatives. Only 28% have a positive impression of Doug Ford while 42% view him negatively. Just 18% like Mr. Trump while 72% dislike the US President. Less than half of them self-identify as Conservatives.
Geographically, they are spread about proportionally to the population. 35% live in Ontario, 26% in Quebec, 12% in Atlantic Canada, 11% in Alberta, and 10% in BC. In Quebec, 54% voted for CAQ while 28% for the Quebec Liberal Party. In Ontario, 54% voted PC, 27% voted Liberal and 12% voted NDP.
52% say they are extremely or very concerned about climate change, and 72% think the Conservatives want to make progress on climate change at about the right pace.
Economically, 28% are feeling confident about their personal economic situation, 36% are worried, while 27% are somewhere in the middle.
Demographically, 57% of this group is male, 43% female. They tend to be older than the rest of the country with 66% aged 45 and over. Only 11% are under the age of 30.
Despite saying they voted Liberal in 2015, only 28% are now open to voting Liberal. In contrast, 32% are open to voting NDP, 24% are open to voting Green.
For the Conservatives, this group accounts for much of its growth from 2015 to 2019. While about one in four is open to voting Liberal still, most have closed the door to even considering the Liberals again.
Liberal to NDP Switchers (2% of the electorate)
This group represents a more modest 2% of the electorate and right now while 70% want a change in government, 30% would prefer to see the Liberals re-elected.
Only 35% have a negative view of Mr. Trudeau while 33% view him positively. 74% have a positive impression of Mr. Singh while only 13% view Mr. Scheer positively. 61% would prefer Mr. Singh to become Prime Minister after the next election compared with 20% who would prefer Mr. Trudeau. About half (52%) think the country is headed off on the wrong track compared to 31% who feel things are headed in the right direction.
Looking at how they feel about other political leaders, only 4% have a positive impression of Doug Ford while 77% view him negatively. 3% like Mr. Trump while 91% dislike the US President.
Geographically, they are concentrated more in Ontario and BC and much less likely to be living in Quebec or Atlantic Canada. In Ontario, 71% voted for the NDP in the last provincial election while 19% voted Liberal. Only 5% voted for Doug Ford and the PCs.
38% self-identify as New Democrat, 33% as Liberal, while 22% don’t identify with any party.
76% say they are extremely or very concerned about climate change and 54% would prefer to see an ambitious plan to fight climate change. Right now, 36% think the Liberals do not want to act quickly enough on climate change while 56% think they want to make progress at the right pace. 76% think the Conservative do not want to act quickly enough.
Like Liberal/Conservative switchers many say anxiety about the cost of living will drive their vote but more indicate that concerns about severe service cuts could be an important driver in whether they vote and who they vote for.
Economically, 39% are feeling confident about their personal economic situation, 32% are worried, while 29% are somewhere in the middle.
Demographically, 56% of this group is female, 44% female. They tend to be younger than the rest of the country with 59% under the age of 45. Only 13% are over 60.
Although this group says they will vote NDP today if an election was held, 68% are still open to voting Liberal. Over half (57%) would consider voting Green while 21% would consider voting Conservative.
For the Liberals, this group is critically important to re-election in 2019. Most are open to voting Liberal. Most dislike Mr. Ford and Mr. Trump and live in important battlegrounds of BC and Ontario.
For the NDP, this groups represents the type of voter they need to attract more of. Those who voted Liberal in 2015 but are mostly disappointed with the performance of the government and live in regions of the country where the NDP can make up for potential losses in Quebec.
Liberal to Undecided (5% of the electorate)
This group represents 5% of the electorate. Four in ten think the country is on the wrong track compared to 31% who feel things are headed in the right direction. Half want to see a change in government while half would prefer to see the Liberals re-elected. 29% have a negative view of Mr. Trudeau while 31% view him positively.
50% would prefer Mr. Trudeau to be Prime Minister after the next election followed, notably by 19% for Ms. May, 14% for Mr. Scheer, and 8% for Mr. Singh.
Only 5% have a positive impression of Doug Ford while 71% view him negatively. 6% like Mr. Trump while 90% dislike the US President.
Geographically, they are spread about proportionally to the population. 38% live in Ontario, 19% in Quebec, 14% in Atlantic Canada, and 14% in BC. In Ontario, 33% voted for the NDP in the last provincial election while 28% voted Liberal and 20% voted PC.
Most of this group doesn’t identify with a political party. 57% are unaligned while 31% identify as Liberal, 6% Conservative, and 3% NDP.
68% say they are extremely or very concerned about climate change and 60% would prefer to see an ambitious plan to fight climate change. Right now, 30% think the Liberals do not want to act quickly enough on climate change while 54% think they want to make progress at the right pace. 58% think the Conservatives do not want to act quickly enough while 39% think they want to make progress at the right pace.
Concerns about climate change, service cuts, and cost of living are the strongest vote drivers for this group.
Economically, 44% are feeling confident about their personal economic situation, 23% are worried, while 34% are somewhere in the middle.
Demographically, 54% of this group is female, 46% male. They tend to be younger than the rest of the country with 59% under the age of 45. Only 13% are over 60.
This group will likely be important in deciding the next election. In 2015, all of them said they voted Liberal but today they are undecided. And many are open to voting for most of the main political parties. 79% would consider voting Liberal, 61% NDP, 50% Conservative, and 50% Green. This group makes up many of the “swing voters” who are not aligned closely with one party or another but can decide close elections.
UPSHOT
According to Bruce Anderson: “The Trudeau government came to office with high hopes and high expectations, in the time of a popular progressive President, Barack Obama. Today, the world is a different place, with populist right of centre leaders in the news and winning elections.
Their challenges are partly a product of losing control of the agenda this year as self-inflicted internal disputes have dominated news about what the government is up to.
But below that surface, the challenge may be more about life in a time when politics wants to be more polarized. Picking a lane looks more necessary than ever, but is a challenge for a party that has been able to win elections by owning the centre line. Progressive voters are restless for a champion they can count on to fight the right with fire, while centre-right voters are feeling like their views matter too little to this government.
Today, the Liberals are splitting centre-left votes with the Green Party and the NDP, splitting centre votes with everyone except Max Bernier, and losing touch with centre -ight voters.
The results are promising for Conservatives, but so far their improved opportunity seems more about avoiding trouble, than building popularity or a bigger pool of potential voters. A sustained lead in the polls will mean that voters will spend more time evaluating them, which carries the potential of greater rewards but also more risk.
The sleeper story in this survey is the role of the climate issue and the interest in the Green Party. We’ll continue to watch that space closely.”
According to David Coletto: “With five months to go before the next election, the landscape has clearly shifted. The SNC-Lavalin controversy altered many Canadians perceptions and impressions of not only the Prime Minister, his government, and his party, but also the general direction of the country.
The Conservatives now have the advantage electorally. They have the largest pool of accessible voters, a three-point lead nationally among all committed voters, and a larger 8-point lead among those most motivated to vote.
The Liberals, unlikely only a few months ago, have a leader with the highest net negatives, a smaller voter pool to draw on, and only about half of their previous 2015 voters currently committed. They have gone from frontrunners to underdogs in less than half of year.
The NDP’s support in our polls has remained remarkably stable but with only 11% in Quebec, many of those seats it held onto in Quebec will likely be gone. Jagmeet Singh is still disliked by more people than the number who like him and half of its current supporters are saying they are likely could be persuaded to vote for another party.
Finally, the Greens, beyond the Conservatives, probably have the most to be optimistic about from these numbers. The accessible voter pool is the largest it has ever been in our tracking. They are polling close to double digits nationally and their leader has the highest net positive rating of any of the federal party leaders. They also pulled off a historic byelection win yesterday in BC.
But while this snapshot tells us one story, it also suggests that things can quickly change over the coming months. The Liberal brand has been damaged and more Canadians are looking for an alternative to the government they currently have. But many haven’t yet really considered the alternatives and what an alternative government and Prime Minister might mean to the issues they are most concerned about. Until that start to happen during the formal campaign period, much of the numbers from this survey could change, and change substantially.”
“There seems to be, I think, at least in the numbers, evidence that the @CanadianGreens are connecting, that people are paying, maybe, more attention and I think last night’s result will add fuel to that fire and that momentum,” said @Colettod#cdnpolipic.twitter.com/CiAfoyGN56
“Some of the fundamentals that might help propel the Greens forward and make historic gains seem to be developing in these numbers for them,” says @AbacusDataCA’s David Coletto on tonight’s episode of @PTP_CPAC at 8PM ET.
Our survey was conducted online with 4,015 Canadians aged 18 and over from April 23 to 30, 2018. A random sample of panelists was invited to complete the survey from a set of partner panels based on the Lucid exchange platform. These partners are double opt-in survey panels, blended to manage out potential skews in the data from a single source.
The margin of error for a comparable probability-based random sample of the same size is +/- 1.5%, 19 times out of 20. The data were weighted according to census data to ensure that the sample matched Canada’s population according to age, gender, educational attainment, and region. Totals may not add up to 100 due to rounding.
ABOUT ABACUS DATA
We are the only research and strategy firm that helps organizations respond to the disruptive risks and opportunities in a world where demographics and technology are changing more quickly than ever.
We are an innovative, fast-growing public opinion and marketing research consultancy. We use the latest technology, sound science, and deep experience to generate top-flight research-based advice to our clients. We offer global research capacity with a strong focus on customer service, attention to detail and exceptional value.
Find out more about how we can help your organization by downloading our corporate profile and service offering.
Don’t miss any of our releases and receive our weekly “Worth a Look” newsletter by signing up for our email list. We promise no more than 2 emails a week… unless there’s something really important we want to share.
80% of millennials want to own a home. 80% is a staggering figure, especially when we are routinely told that millennials are a generation of perennial renters, opting to pay rent over paying down a mortgage. Now, the stereotype of the eternal renter is not unfairly painted, currently, only 27% of millennials own the homes they live in. The remaining 73% either rent (40%) or live with their parents (33%). So why the discrepancy between desire and attainment?
To understand this better let’s remove the wheat from the chaff. While 80% of millennials hope to be homeowners one day only 43% are looking to buy a home in the next 5 years. So using that as our benchmark we are going to look at these ‘in-market’ millennials who are on the prowl for a place to call their own and to understand what’s stopping them from fulfilling their dream of a home sweet home.
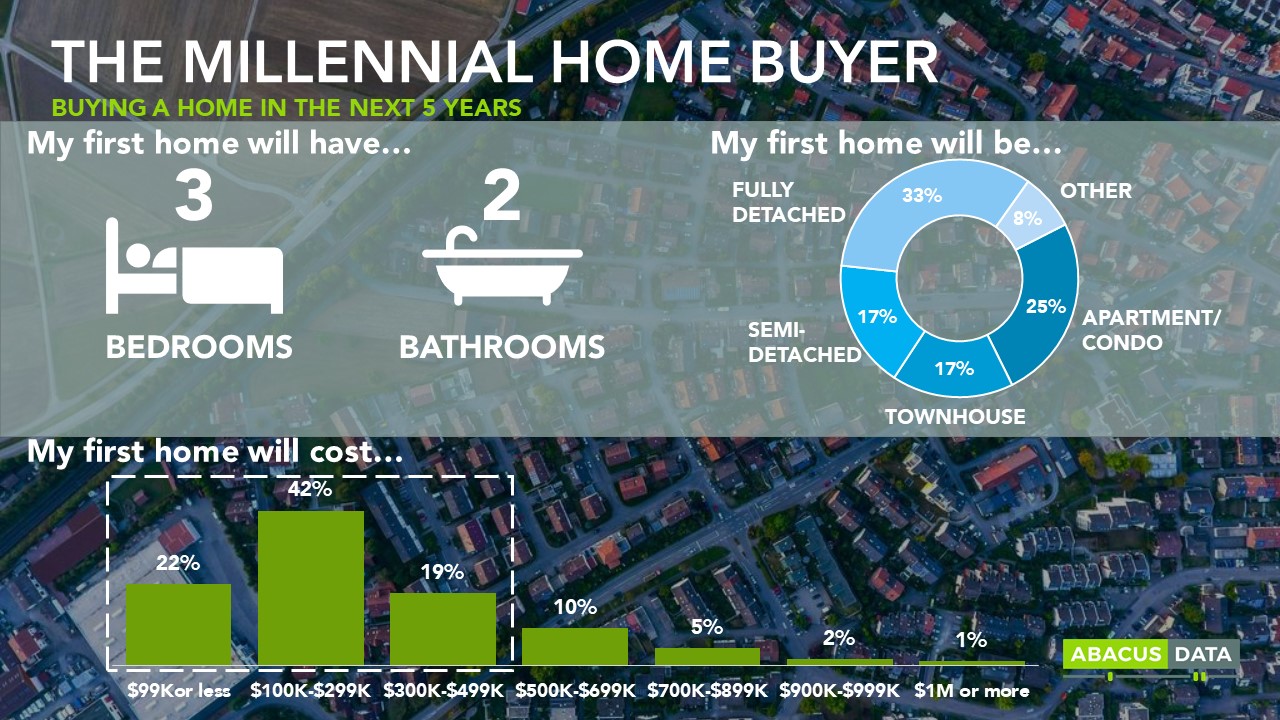
IN-MARKET MILLENNIALS First, let’s get to know these millennials a little better. In-market millennials (those looking to buy a home in the next 5 years) are made up of an equal number of singles and those who are in long-term relationships. For their first home, a third are looking to move into a fully detached home while a quarter are seeking-out apartments or condominiums. A much smaller number of millennials want to stay in townhomes or semi-detached homes (17% each). When we look at the average in-market millennial we find that she would like her first home to have 3 bedrooms and 2 baths, all for the sweet price of $300,000 or less.
For those who are familiar with the price of an average home in Canada you will have done the math and realized that her desire is a tall order to fill. Perhaps if this millennial lives in Atlantic Canada or the Prairies she could find her dream home. However, if she wanted to live in the hot housing markets of Vancouver, Toronto, or Montreal, she will find a stark reality facing her.
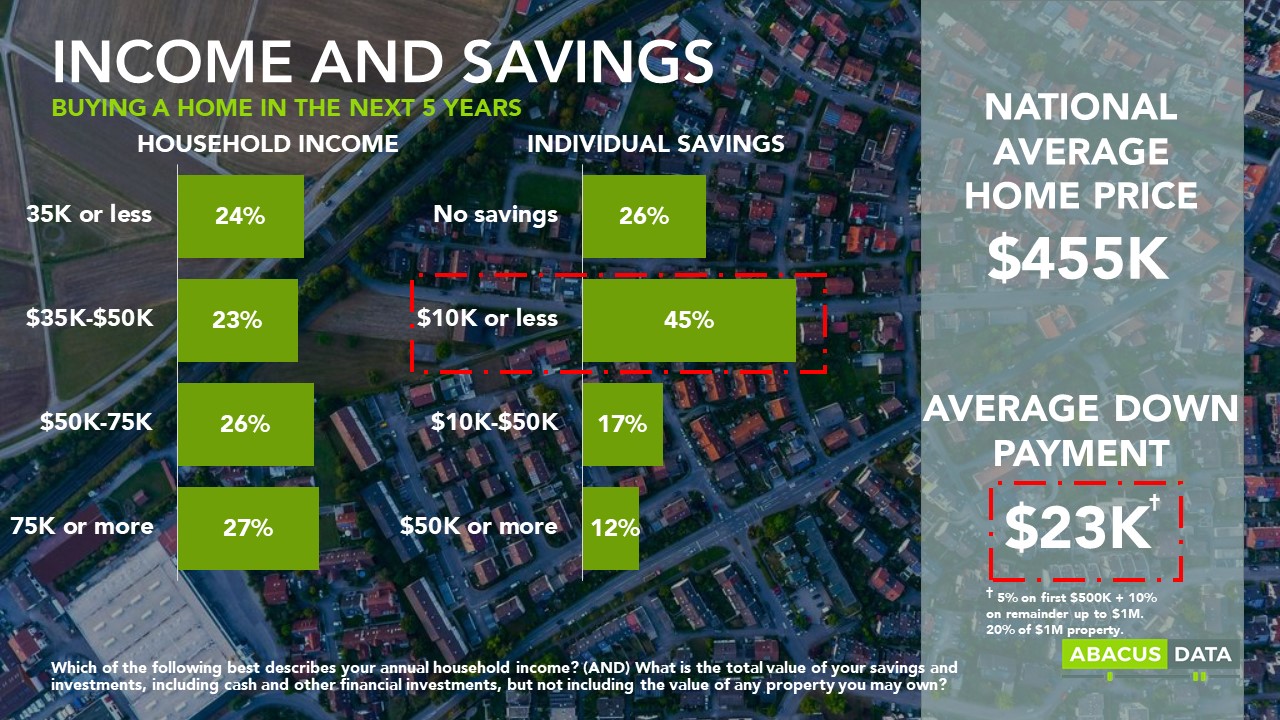
The average price of a home in Canada according to MLS is $455,000 meaning that with the current mortgage rules the minimum down payment for a typical Canadian home would be approximately $23,000. This might seem like a reasonable sum for our home-seeking millennial, however, with an income of $75,000 or less and a savings account of only $10,000, a $23K price tag can quickly become unattainable. This is the case for nearly three-quarters of all in-market millennials in Canada.
Low wages and limited savings seem to be some of the largest stumbling blocks that prohibit millennials making the leap from rented accommodations or chez mom and dad to a home of their own. Nevertheless, 27% of millennials have managed to make that down payment and are now homeowners. So how did over a quarter of this cohort manage to purchase their first home?
HOME OWNERSHIP Nearly half of the current millennial homeowners make over $75,000 and many make over $100,000 a year. This is significantly higher than non-home owners and confirms that there is a correlation between higher income and home ownership.
However, as mentioned above, income only explains how half of these millennials purchased their home, which leaves the other half up for questions. To answer this, we turn to their parents. Parents of current homeowners are 10% more likely to have household incomes of around $100,000 or more. What we also see is that regardless of their own personal income, millennials with wealthier parents are nearly 11% more likely to own their home. This suggests two things. The first is that if mom or dad are well-off you are more likely to follow in their financial footsteps and that also includes homeownership. Secondly, for those who make less but have parents with the means to assist, the bank of mom and dad is open for business.
Where does this leave millennials who lack parental assistance and make an average millennial income ($62,500 or less) with a typical savings account ($10,000 or less)? Most will not be able to own a home without government assistance, the help of alternative lenders, or significantly more time to save.
With persistently high property prices home ownership seems to be the privilege of the wealthy and well-positioned and millennials who work for depressed wages will have to keep waiting and saving until they can finally afford the home of their dreams.
At Abacus we strive to understand the nuances of generational change and how it impacts you and your business. The Canadian Millennials Report is the largest syndicated study of millennials in Canada. We survey 2,000 millennials twice a year on a range of topics including politics, social values, and consumer trends. If you are interested in learning more about this generation, reach out to us and we would be happy to connect.
Part two of a two-part series on Augmented Reality (AR) trends. See part one about AR and retail stores here.
Augmented reality is transforming how Canadians interact with cultural and entertainment spaces, but these spaces have to go further.
Over a third of Canadians have already used AR and most are using it for entertainment.
Many Canadians are hungry for more and more novel ways to explore the technology and are even experimenting with AR on their own.
Physical spaces of recreation and knowledge such as theatres, galleries, arenas, museums and landmarks are searching for relevancy in a digital world. They have an opportunity with AR to blend their physical environments with digital technology to attract new and younger visitors.
However, truly implementing AR is not as simple as offering a new exhibit, but also about changing the fundamental nature of these institutions from one-directional communication towards a bi-directional model of audience interaction and involvement.
It’s time for the gamification of knowledge and information, and AR is the perfect entry point to this model.
AR isn’t confined to culture and entertainment disruption either. See the pdf at the bottom of this page for a short story-deck with some exciting stats and potential applications for different industries, including retail, museums and tourism, and entertainment facilities.
This article only scratches the surface of our study. For a comprehensive deck with an in-depth breakdown of all our findings please email Maciej Czop, Senior Research and Communications Consultant at Abacus Data
The Real-World Versus the Living Room Couch
In an era of intense digital connectivity and stay-at-home entertainment, brick-and-mortar centres of recreation and knowledge such as theatres, galleries, arenas, museums and landmarks are anxious to entice people out of their homes and into the community.
As the world continually splinters into competing distractions and offerings, the marketplace for our attention becomes more heated. More venerable institutions, who traditionally display static exhibits and pieces of significant historical and cultural importance, are especially vulnerable to cultural shifts and waning popularity.
One step towards staving off irrelevance currently being explored is an attempt to leverage augmented reality (AR) to attract visitors. This usually comes in the form of interactive exhibits that engage audiences through both the physical and digital worlds simultaneously.
Although it’s been mostly flying under the radar, AR technology is quickly approaching an inflection point. The latest wave of AR devices on the market point to hardware that is powerful enough, cheap enough, and (maybe most importantly) visually attractive enough to make mass-adoption feasible and leave the industry poised to explode in popularity.
Luckily for proprietors of cultural and entertainment spaces, there’s no need for expensive infrastructure spending or waiting for mass tech-adoption to make overtures into the AR world. The vast majority of Canadians don’t need to spend another dollar on cutting-edge technology to enjoy the engagement afforded by AR, they already carry an AR gateway everywhere they go: Their smartphones.
AR Is Already Here and Its More Popular Than You Think
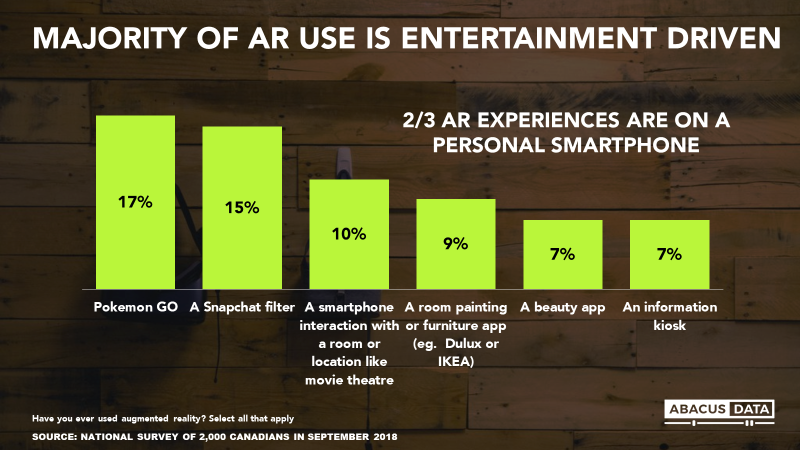
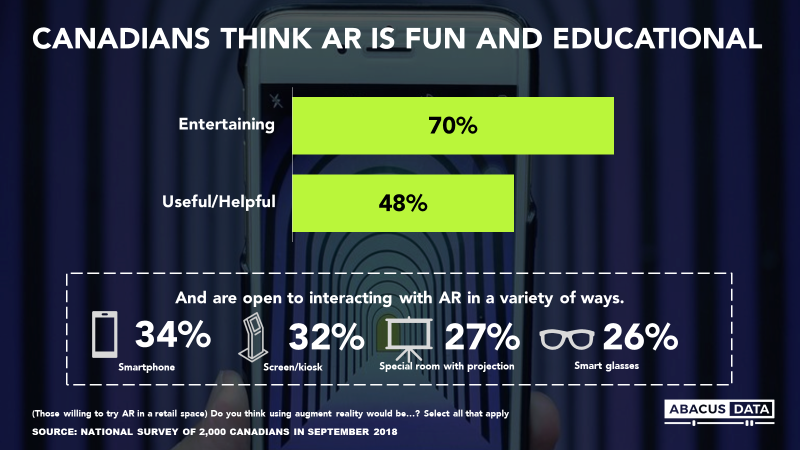
OK, but this stuff is niche for geeks and kids right? Actually,a massive number of Canadians are already using AR. Just over a third (35%) of all Canadians have used augmented reality, and this number rockets to half (49%) of 30-44-year-olds and almost 7 in 10 (69%) 18-29-year-olds.
AR use seems to be an antithesis to stay-at-home entertainment. It’s being driven by apps and games that get people out of their houses and compel them to interact with their community: 17% of Canadians have used AR through Pokémon GO and 1 in 10 have interacted with AR through a room like a movie theatre.
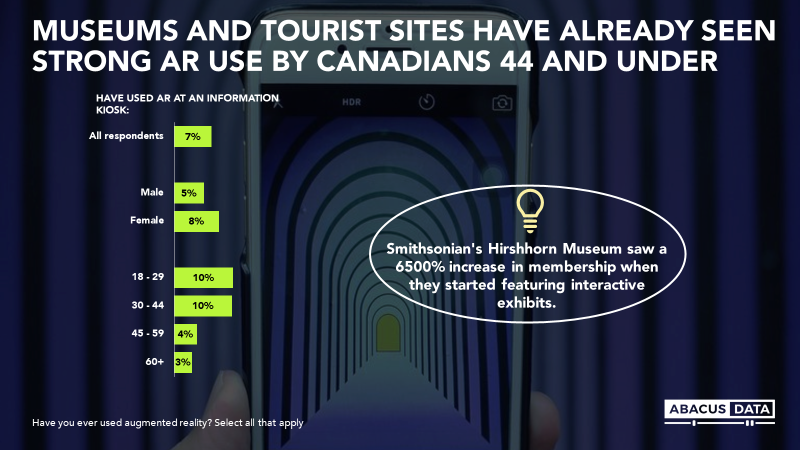
Museum and tourism AR numbers slightly lag those of purely game-focused AR but are still significant, as 1 in 10 Canadians under 45 have already used AR at an information kiosk.
Many Canadians Are Thirsty for Novel Entertainment
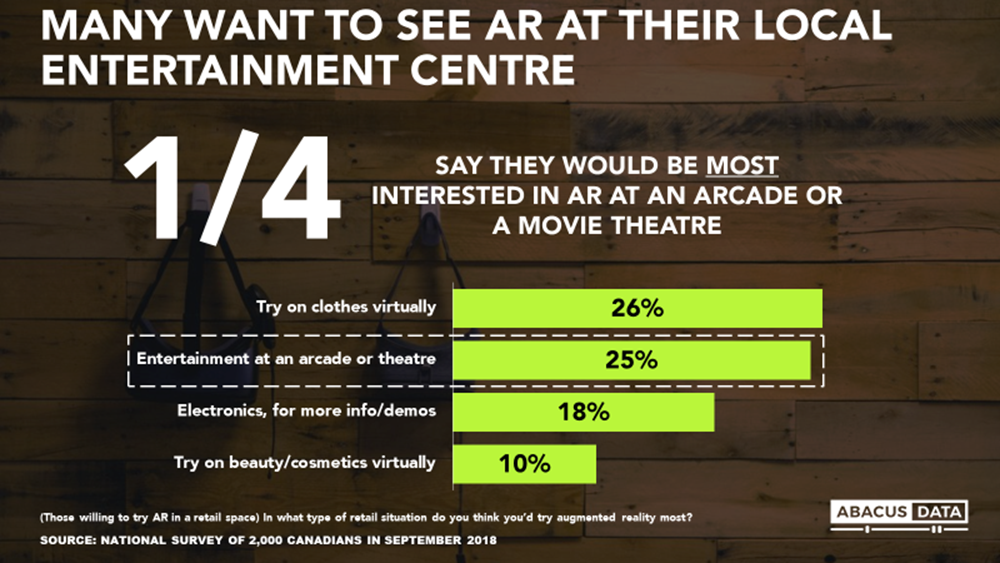
We also asked Canadians what they’d be most interested in using AR for in the future. While the majority of Canadians are most eager about AR benefits in retail and shopping, 1 in 4 are excited about AR as an entertainment option.
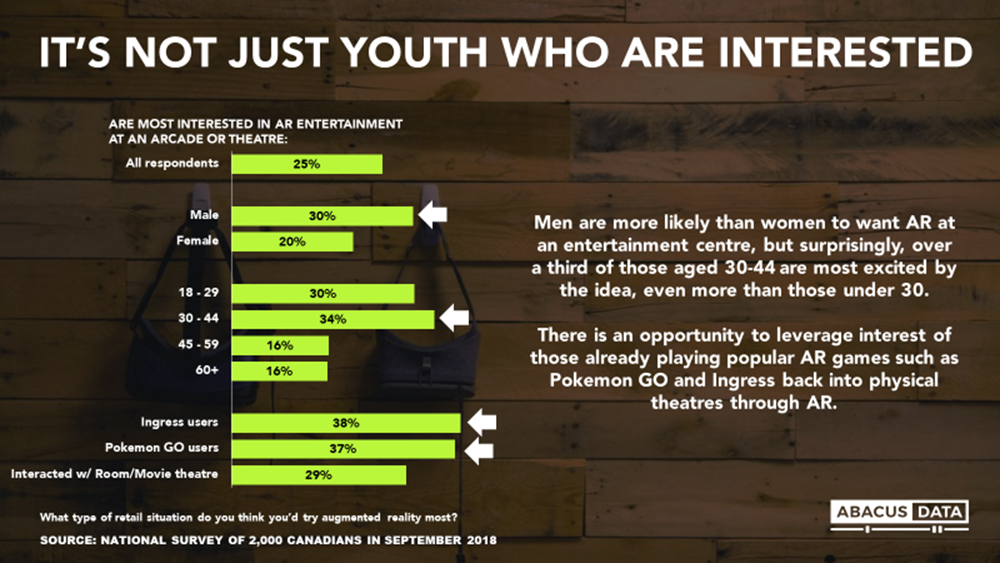
It’s not just the amount of people looking for more AR entertainment locations that’s interesting, it’s also the type of people eager to experience these scenarios that raises eyebrows: over 3 in 10 are 30-44 year-olds, even beating out those under 30. Perhaps less surprisingly, men (30%) are significantly more likely to want AR in their theater than women (20%).
Our findings show that those who have already tried AR games such as Pokémon Go and Ingress, another (less popular) location-based mobile game, are the likeliest potential market for AR integration into cultural and entertainment spaces, hinting at a high satisfaction and replay-ability with the technology.
Perhaps most importantly, 7 in 10 Canadians see the value in having AR for entertainment and half of Canadians believe the technology is helpful.
Ready-made Canadian AR Audiences Are Already Available for Cultivation
Despite the rise of high-quality at-home digital entertainment options, many Canadians still desire and pursue more novel experiences. Recently, this has been driving them to explore innovations that combine the digital-world with the real-world. In fact, a third of Canadians are already spending their leisure time experimenting and interacting with their physical environments through AR through personal smartphones.
Our research indicates that attracting those who already use popular AR apps such as Pokémon GO and Ingress is a strategy that should pay off dividends as these Canadians have already bought-into the technology and are actively seeking new ways of experiencing and engaging with it. Partnering with these types of AR apps would allow administrators of physical spaces to access ready-made and motivated audiences and leverage the culture of AR to entice them to visit their physical spaces. This type of partnership may also help circumvent technical challenges that AR implementors face, such as platform integration.
Moving from One-Directional and Static to Interactive and Engaging
AR could be a revolution in helping to attract and engage new visitors to cultural and entertainment spaces, especially piquing the interest of youth to experiment with combining more traditional spaces with novel technology, making the old new again. Sites around the world from MoMA, to the National Gallery of Canada, to the Eiffel Tower have already hosted interactive, augmented-reality exhibits where Instagram-sharing is encouraged.
However, so far overtures into AR have been mostly ad-hoc one-offs, such as special exhibits or temporary events. The traditional experience of one-directional expression by curators and non-participatory consumption by audiences is still very much the norm.
The quest for relevance will likely require spaces to make concerted and systematic efforts, not only to integrate AR throughout a visitor’s experience, but to also change their fundamental nature towards a bi-directional model of audience interaction and involvement.
In other words, institutions cannot rely on just broadcasting the same old information through a new communications channel. They must also experiment with how to leverage the ability of audiences to input and modify their digital environment, to understand things in new ways, and to become active participants in a story. This gamification of knowledge and information is a natural evolution and fit for AR and cultural spaces.
AR isn’t confined to retail disruption either. Here is a short story-deck with some exciting stats and potential applications for different industries, including retail, museums and tourism, and entertainment facilities.
This article only scratches the surface of our study. For a comprehensive deck with an in-depth breakdown of all our findings please email Maciej Czop, Senior Research and Communications Consultant at Abacus Data.
Methodology
The survey was conducted online with 2,000 Canadian residents aged 18 and over from September 15th to 20th, 2018. A random sample of panelists were invited to complete the survey from a set of partner panels based on the Lucid exchange platform. These partners are typically double opt-in survey panels, blended to manage out potential skews in the data from a single source.
The Marketing Research and Intelligence Association policy limits statements about margins of sampling error for most online surveys. The margin of error for a comparable probability-based random sample of the same size is +/- 2.19%, 19 times out of 20.
The data were weighted according to census data to ensure that the sample matched Canada’s population according to age, gender, educational attainment, and region. Totals may not add up to 100 due to rounding.
In June of 2018, a study was released saying 54% of millennials expect to be a millionaire someday. For a generation that is riddled with student debt, heavily relies on their parent’s basements well into adulthood, and face increasing tuition rates and housing costs, that’s a lot of optimism. Many news outlets say this finding proves millennials are “delusional” about their future prospects. But where does this delusion come from? Our research and insights here at Abacus Data has unveiled a couple of possible answers as to why millennials see a six-figure future.
The growth and promise of careers in digital industries
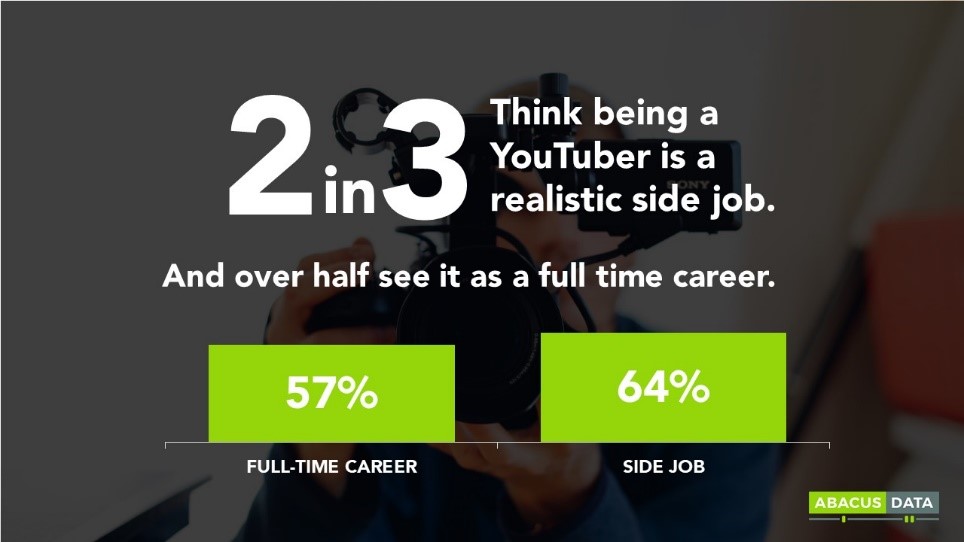
One of the biggest and most visible new career paths in the online world is being a YouTuber. Earlier this month we shared an article about the business of partnerships between YouTube stars and billion-dollar businesses. The money in the industry is real, and the premise of being a YouTube sensation seems easy, with little to no entry costs to the industry. Our data shows this assumption to be more or less true. In our study of millennials, we found two-thirds see YouTube as a realistic side job.
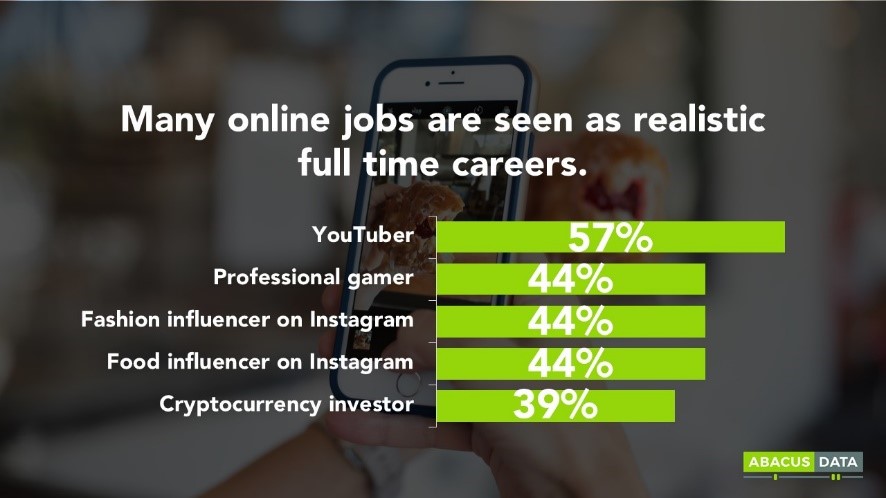
The same low-entry cost applies to many other up and coming careers that rely on the digital world. Many jobs that are founded on online business models did not exist ten years ago and are now seen as very viable careers. Nearly half of Millennials see cryptocurrency investors, Instagram influencers, professional gaming, and YouTube as realistic full-time careers and side jobs. Whether it is easy to actually get rich in one of these careers is a completely different story, but what matters is that millennials believe there are an increased number of ways to make millions without relying on a traditional ladder-climbing organization.
Let’s not forget that these possible careers are legitimized by the many success stories of their millennial peers. At 20 years old, Kylie Jenner’s net worth is close to $1 billion. And then there is Mark Zuckerberg who created a company so successful (worth around $536 billion) that it makes Kylie’s net worth look like nothing. These success stories motivate young millennials to dream big, and be optimistic about their future, even if in reality these success stories are few and far between and this optimism is misplaced.
The rise of the ‘side hustle’
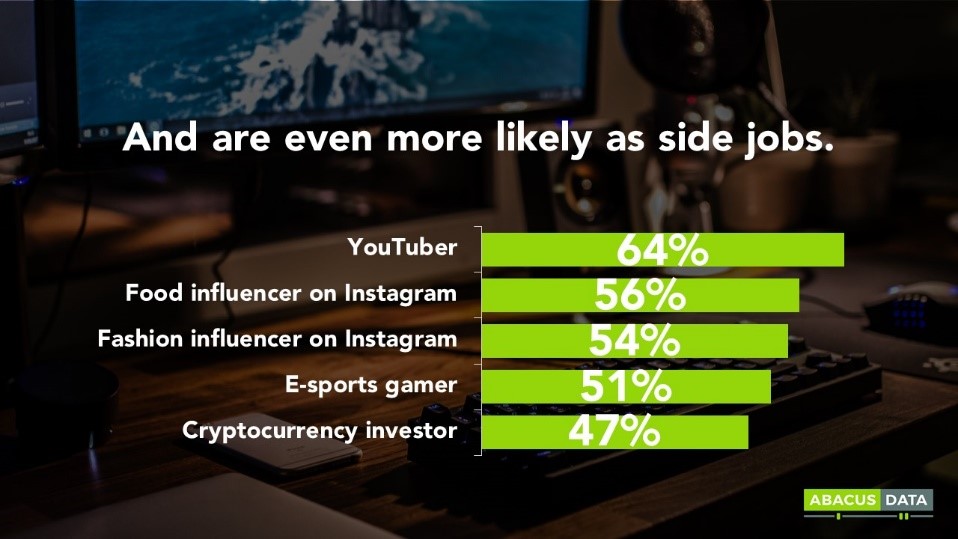
What’s a more popular millennials trend than avocado toast? Side hustles. The Millennials are entrepreneurial and use side hustles to gain an additional income outside their main revenue stream (to pay for their avocado toast). According to a study by Bankrate, 28% of millennials are pursuing a side hustle as a way to bring in additional income. And according to our data, there are many possible streams to gain additional income. Two in three believe being a YouTuber as good side jobs, but more surprisingly, over half think food and fashion influencers on Instagram are likely side hustles. Perhaps the seemingly increasing number of ways to make money, and ease of creating a second or third income stream also contributes to the optimism of wannabe millionaire millennials.
Increased education
Though it may not contribute to the actual number of successful people, it’s likely that the increase in education also contributes to the optimism among millennials. According to Universities Canada, there has been a 209% increase in full-time enrollment in universities since 1980. Millennials are dutifully checking the boxes necessary to achieve success, as per the checklist used by their parents in the 80s.
Linkages between optimism and education have been found in research. While the study is not millennial specific, research from the University of Michigan’s Survey of Consumers linked higher education to greater optimism in the year ahead, and in the next five years. This last point is complex, and could very likely be unpacked further, but we think this is a very probable cause of the optimism of millennials.
While it remains to be seen whether Millennials will achieve the levels of success they dream of, there are some very strong arguments for why they may feel so optimistic about their future prospects. The number of career possibilities is growing, pursuing more than one income stream seems as easy as setting up a social media account, and millennials are dutifully educating themselves at rates double their parent’s generation. Whether or not these reasons will actually lead to millennial millionaires is an entirely different post!
At Abacus we strive to understand the nuances of generational change and how it impacts you and your business. The Canadian Millennials Report is the largest syndicated study of millennials in Canada. We survey 2,000 millennials twice a year on a range of topics including politics, social values, and consumer trends. If you are interested in learning more about this generation, reach out to us and we would be happy to connect.