The media has picked up on efforts to present a kinder, refreshed, genteel Doug Ford, but the public has yet to notice.
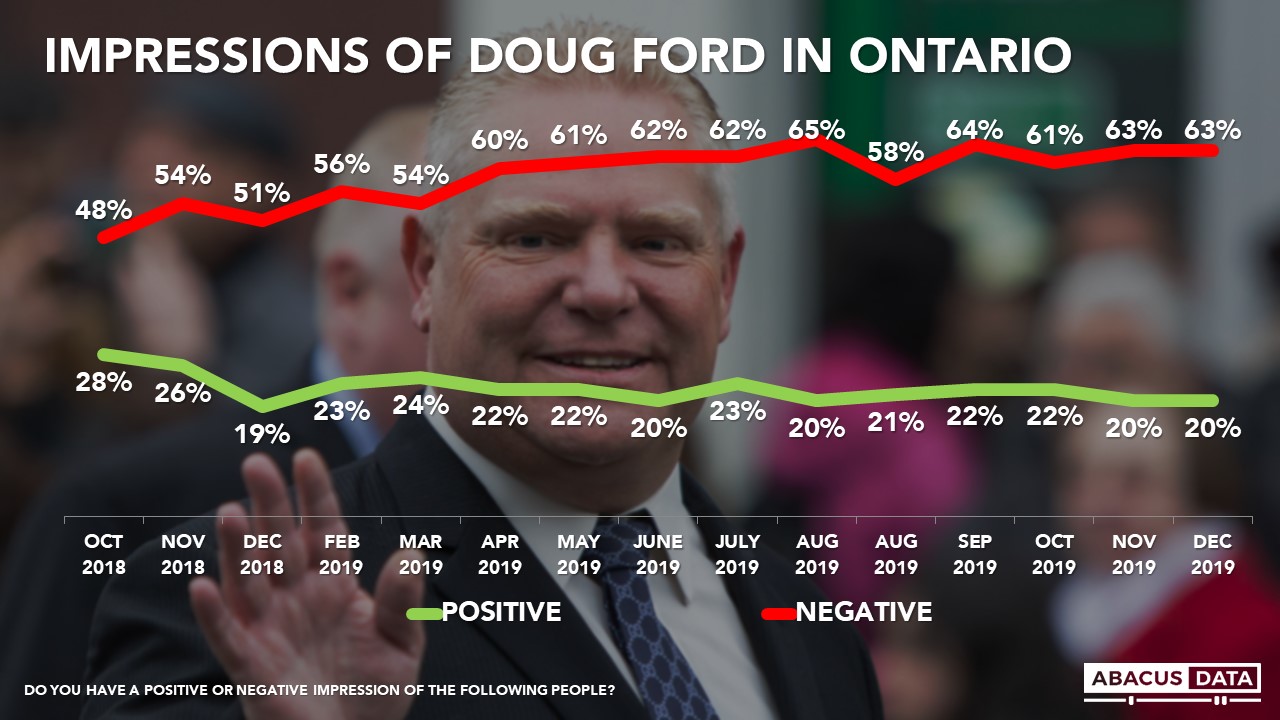
Impressions of the Ontario Premier have been relatively stable since April 2019 when his negatives first reached the ~60% disapproval threshold and ~20% positive, a dynamic that has not shifted for some time.
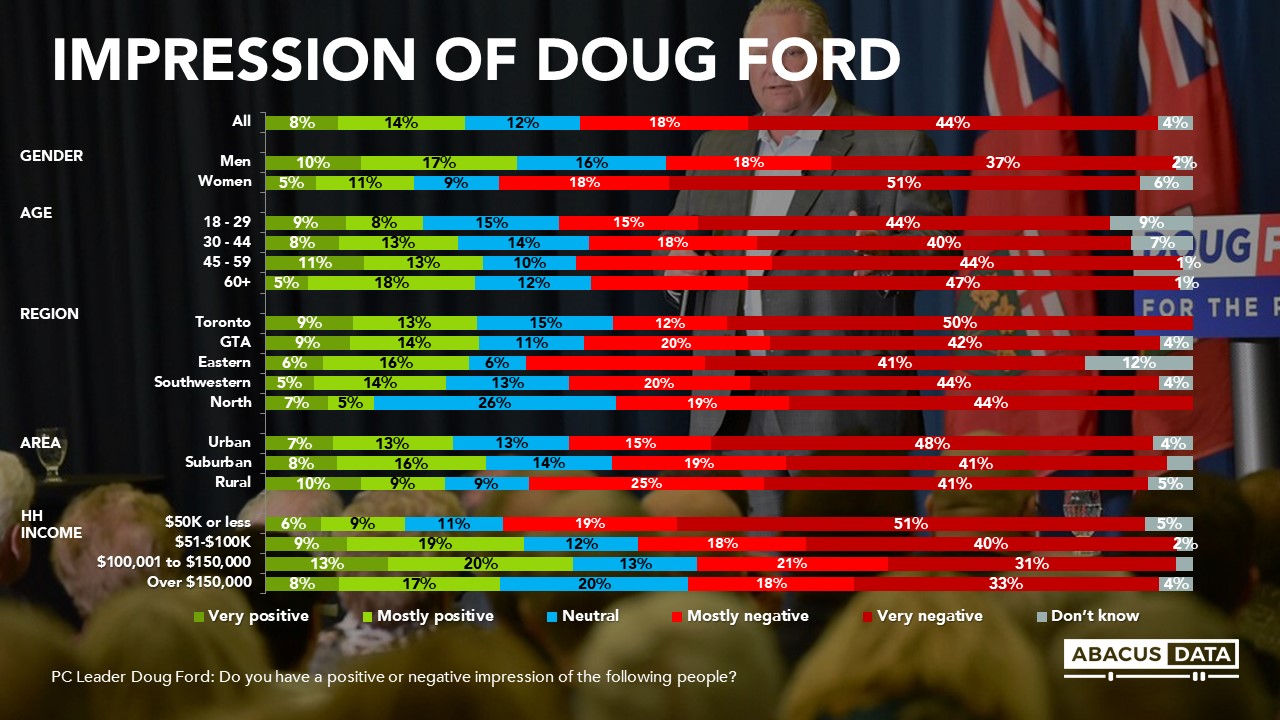
Today, 44% of Ontarians report having a very negative impression of the premier, while another 18% describe their view as mostly negative. Nearly everyone has an opinion on Ford– only 4% suggest they don’t know enough to have a view.
Though a fresh face and renewed approach by the Premier would take some time to take root, there has been relatively little traction so far from a public opinion standpoint.
Men particularly drive support for the premier while women tend to have a much dimmer view of the premier. His support is more robust in suburban areas of the province, though there is no edge for the premier in the 905 or significant differences between Toronto voters and the wider GTA.
Income is by far the biggest correlate of views of the premier, with those in households under $50K or less having a significantly more negative view of the premier than those in higher income brackets.
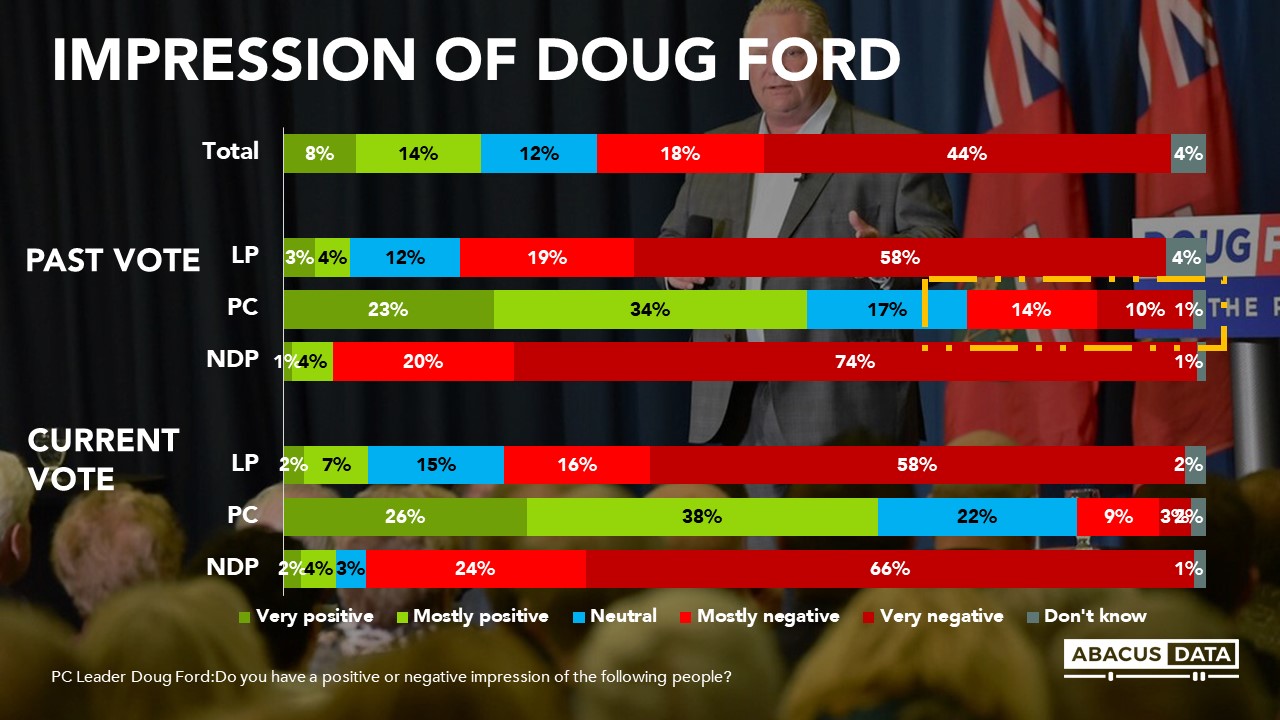
One in four previous Ford voters now has a negative view of the premier, not compensated by previous OLP and ONDP voters who continue to dislike the premier.
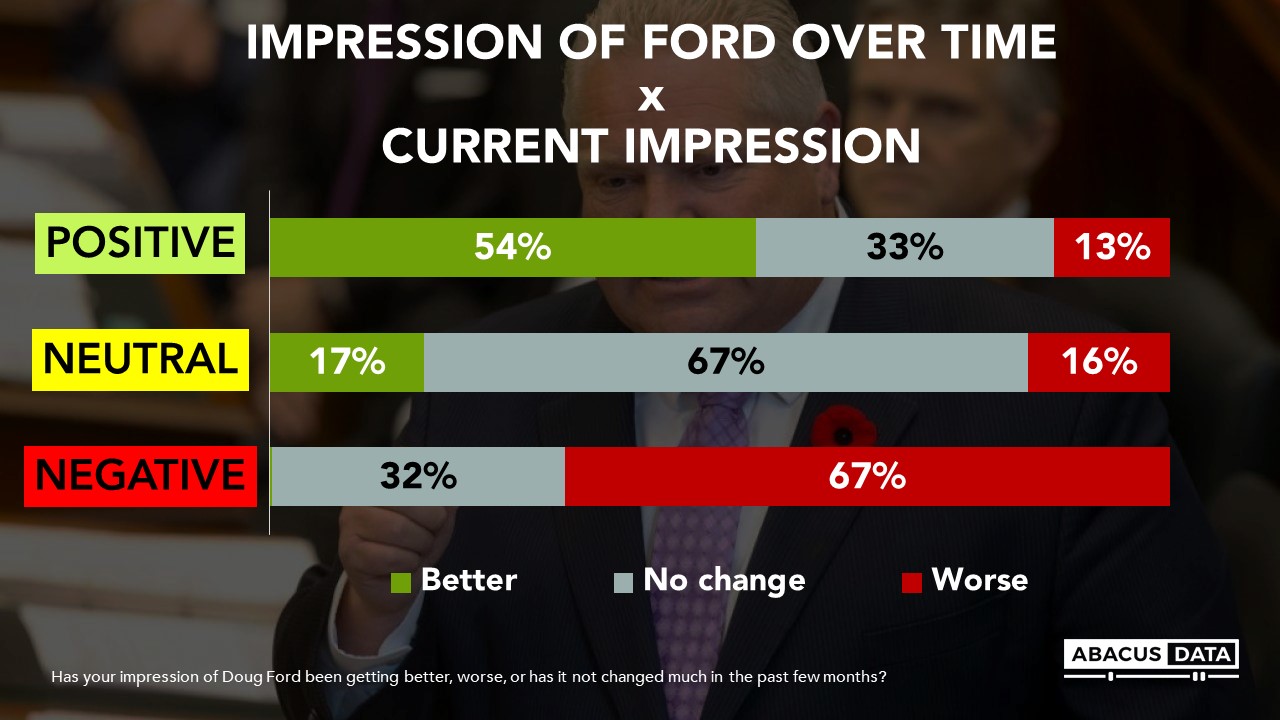
In fact, when we specifically ask Ontarians whether their impression of Doug Ford has been getting better, worse, or not changed much in the past few months, only 14% suggest it has gotten better while 47% have stated his reputation has gotten even worse.
This momentum is mostly among those who already feel negatively about the premier, 67% of whom say their impression is getting worse still. Fans of the Premier report feeling more positively about him, while those who are neutral feel mostly the same. In other words, the only impact of the last few months has been further polarization of the electorate.
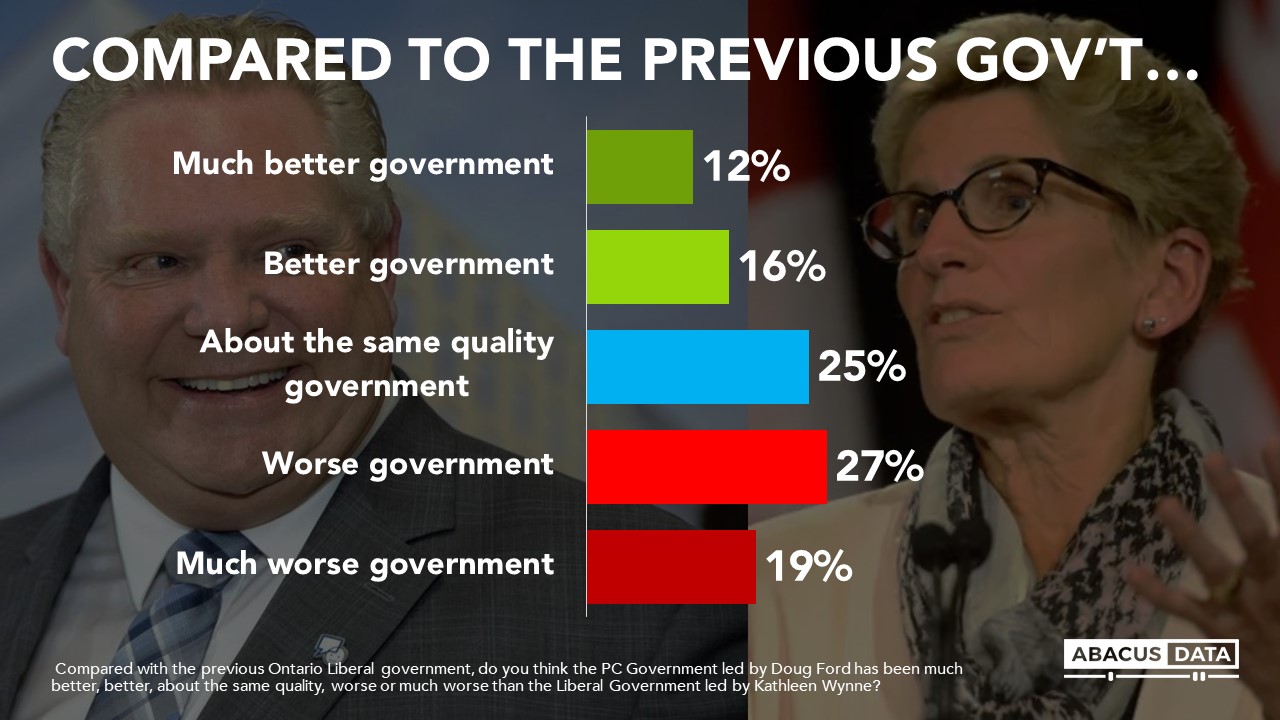
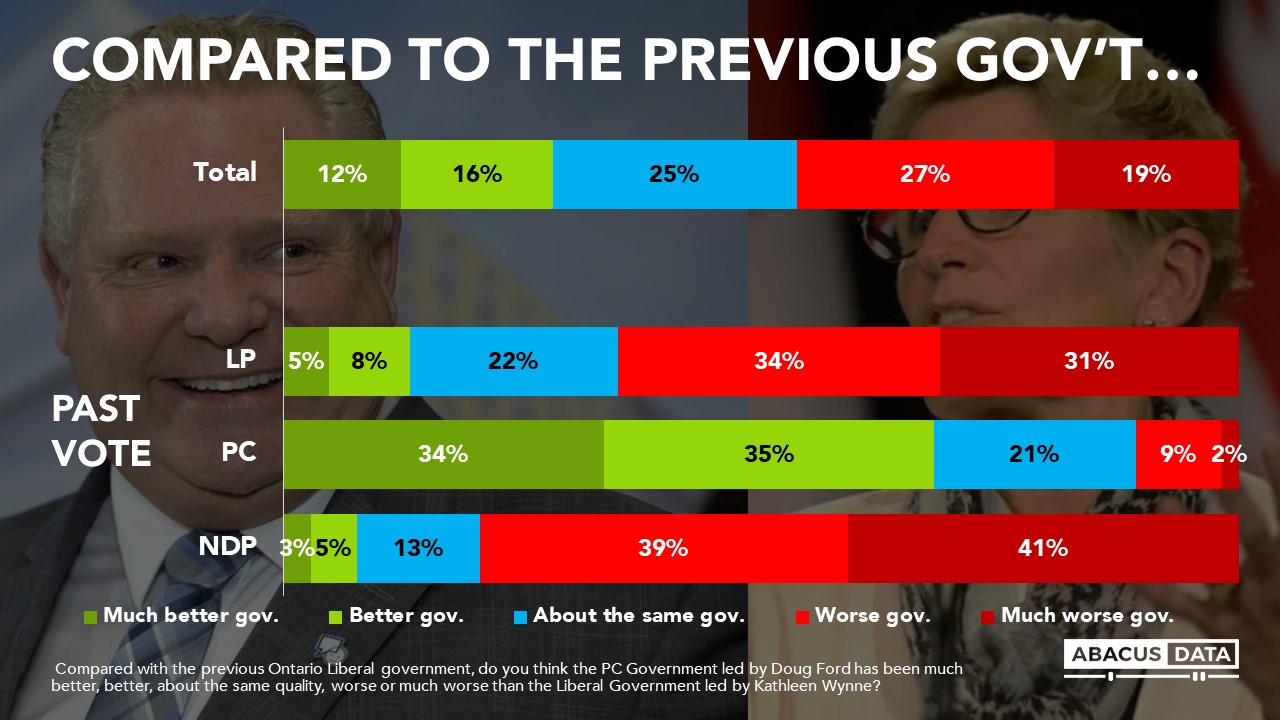
While just under half of Ontarians believe the Ford government is much worse than the preceding Wynne administration, there continues to be little buyer’s remorse on the part of 2018 Ontario PC voters. Those who voted PC in 2018 believe Premier Ford is offering a better government than his predecessor, with one in three even suggesting a “much better” government.
There even appears to be some small conversion on the part of past progressive voters. One in ten of past Liberal and New Democrat voters believe that Ford is delivering a better government than his predecessor. This gain should be balanced against the 11% of PC voters who feel they got a worse government when they voted Ford in.
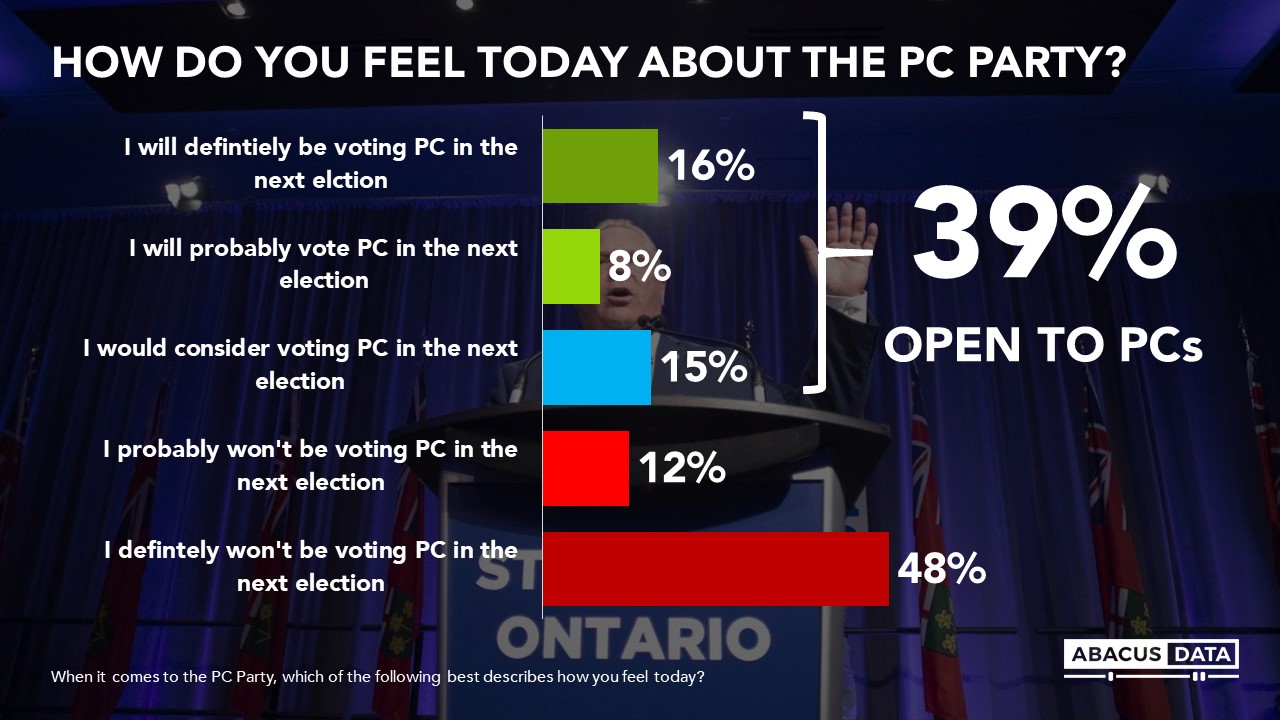
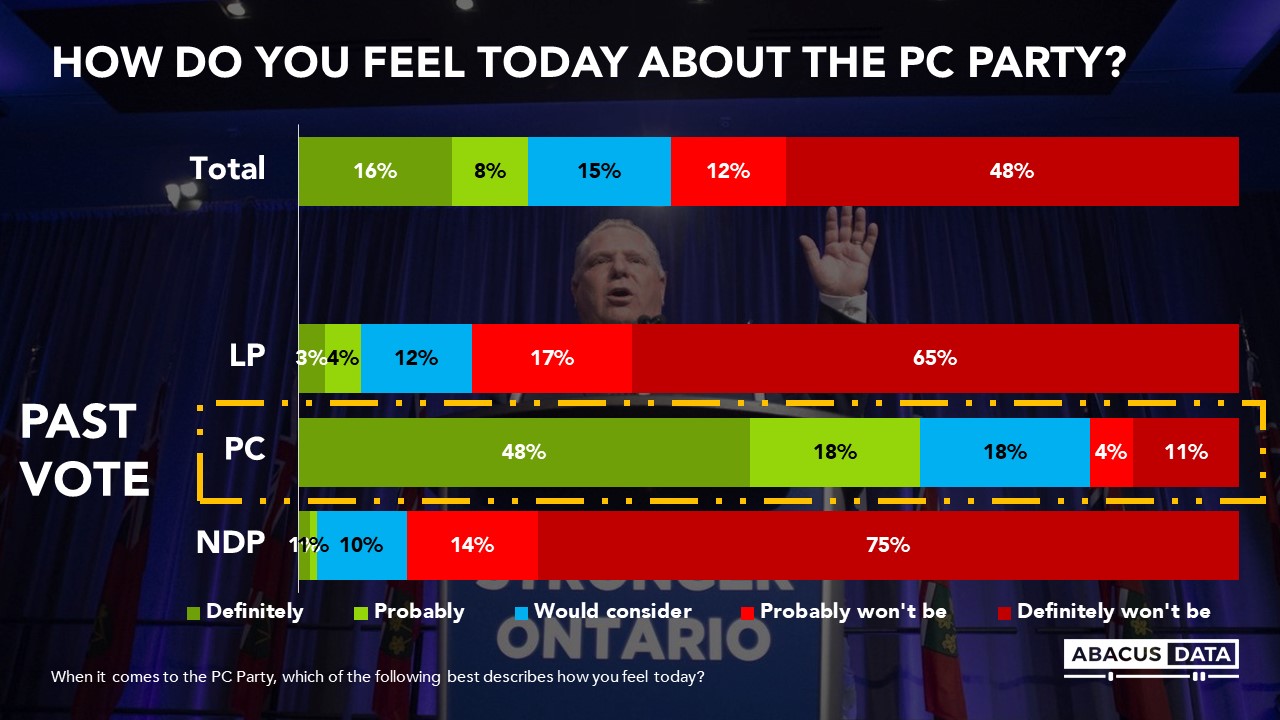
In total today, 26% would definitely or probably vote PC in the next election while an additional 15% would consider it, suggesting a similar coalition of votes still exists for the premier (39%) as came through on election day (40% PC vote share in 2018).
THE UPSHOT
While the media has reported on a more contrite, polished and collaborative Ford following Prime Minister Trudeau’s reelection, voters have yet to notice, though this does not mean they never will. Baggage from his first year in government coupled with current high-profile turmoil around the teacher’s strike and Hamilton LRT cancellation is no doubt unhelpful.
Things have not gotten worse for the premier – those who already dislike him are becoming more disillusioned, but his winning coalition of 40% of Ontarians open to voting PC is still intact, despite the turmoil. An austerity agenda will be a hard sell in the friendliest of political environments, even absent backtracking on infrastructure investments and full out war with the province’s teachers. If there’s a time for Premier Ford to make unpopular decisions and begin a journey to a brand refresh for his government, this is it.
METHODOLOGY Our survey was conducted online with 570 Ontarians aged 18 and over from December 12 to 16, 2019. A random sample of panellists was invited to complete the survey from a set of partner panels based on the Lucid exchange platform. These partners are double opt-in survey panels, blended to manage out potential skews in the data from a single source.
The margin of error for a comparable probability-based random sample of the same size is +/- 4.1%, 19 times out of 20. The data were weighted according to census data to ensure that the sample matched Canada’s population according to age, gender, educational attainment, and region. Totals may not add up to 100 due to rounding.
ABOUT ABACUS DATA
We are the only research and strategy firm that helps organizations respond to the disruptive risks and opportunities in a world where demographics and technology are changing more quickly than ever.
We are an innovative, fast-growing public opinion and marketing research consultancy. We use the latest technology, sound science, and deep experience to generate top-flight research-based advice to our clients. We offer global research capacity with a strong focus on customer service, attention to detail and exceptional value.
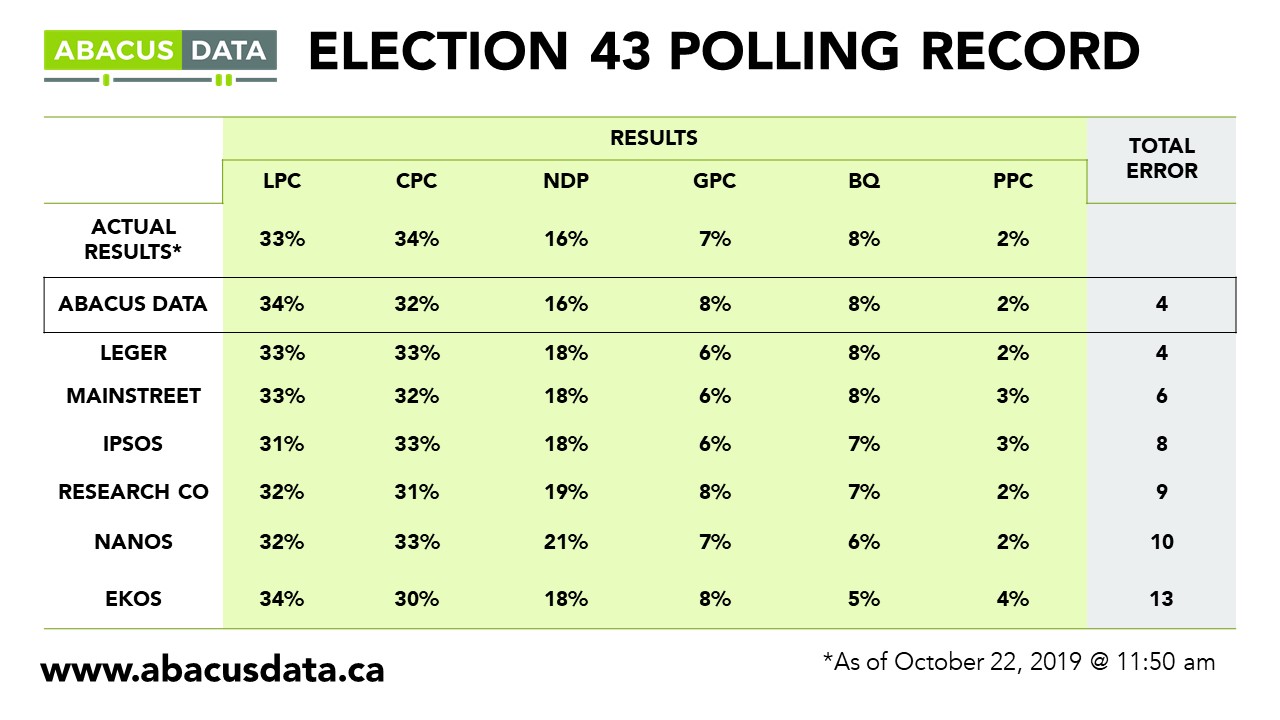
We were one of the most accurate pollsters conducting research during the 2019 Canadian Election.
Abacus Data Bulletins are short analyses of public opinion data we collect. For more information or media interviews, contact Bruce Anderson or David Coletto.
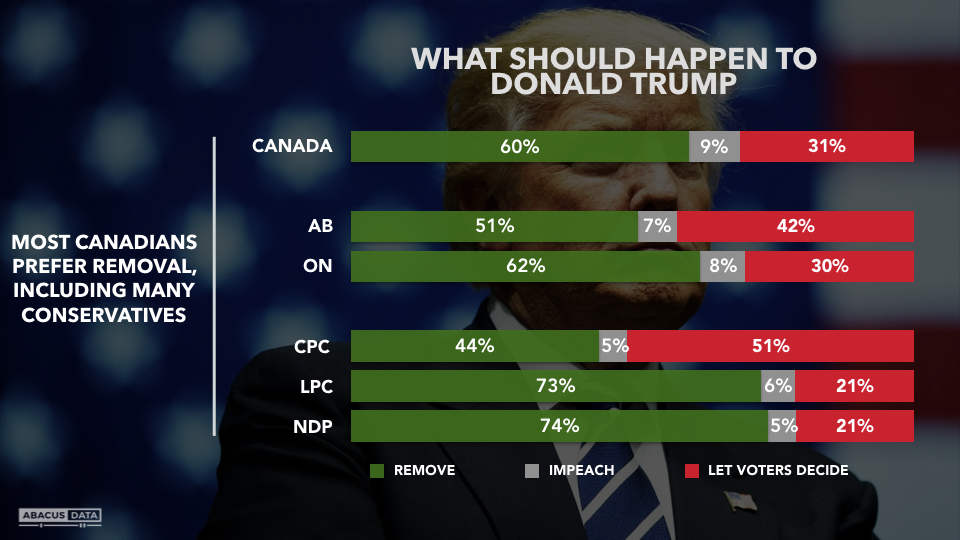
If it were up to a majority of Canadian voters, President Trump would be both impeached and removed from office, according to our latest nationwide opinion data. Fully 60% say they would prefer to see him impeached and removed, another 9% just impeached. A minority (31%) would prefer to let US voters decide his future next November.
This view is relatively consistent across demographic and regional lines, and even among Conservative voters and Alberta residents, where Mr. Trump has generally had above-average support, significant numbers would like to see America replace Mr. Trump.
Our survey was conducted online with 2,137 Canadians aged 18 and over from December 13 to 19, 2019. A random sample of panellists was invited to complete the survey from a set of partner panels based on the Lucid exchange platform. These partners are double opt-in survey panels, blended to manage out potential skews in the data from a single source.
The margin of error for a comparable probability-based random sample of the same size is +/- 1.8%, 19 times out of 20. The data were weighted according to census data to ensure that the sample matched Canada’s population according to age, gender, educational attainment, and region. Totals may not add up to 100 due to rounding.
ABOUT ABACUS DATA
We are the only research and strategy firm that helps organizations respond to the disruptive risks and opportunities in a world where demographics and technology are changing more quickly than ever.
We are an innovative, fast-growing public opinion and marketing research consultancy. We use the latest technology, sound science, and deep experience to generate top-flight research-based advice to our clients. We offer global research capacity with a strong focus on customer service, attention to detail and exceptional value.
We were one of the most accurate pollsters conducting research during the 2019 Canadian Election.
With Christmas around the corner, we decided to ask Canadians about how they do (or don’t) celebrate the “most wonderful time of the year” (in our opinion). We replicated some questions we asked back in 2012 to see what’s changed. Interesting, a lot has.
Here’s what we found:
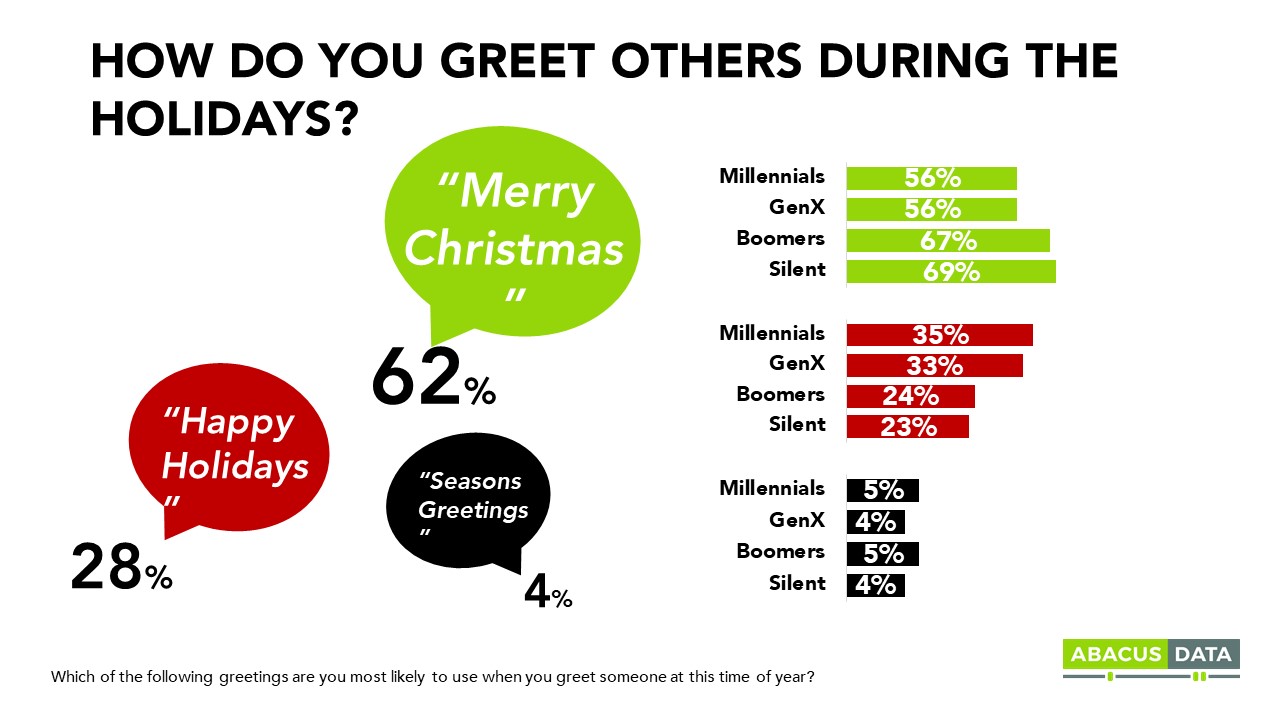
Canadians are more likely to use Merry Christmas to greet one another this holiday season (62%) but it’s down 10-points from 2012.
28% report being most likely to say Happy Holidays (vs. 20% in 2012) and Seasons Greetings at 4%. Of those who report celebrating Christmas as a secular holiday, 61% will most likely greet others with Merry Christmas – 30% with Happy Holidays.
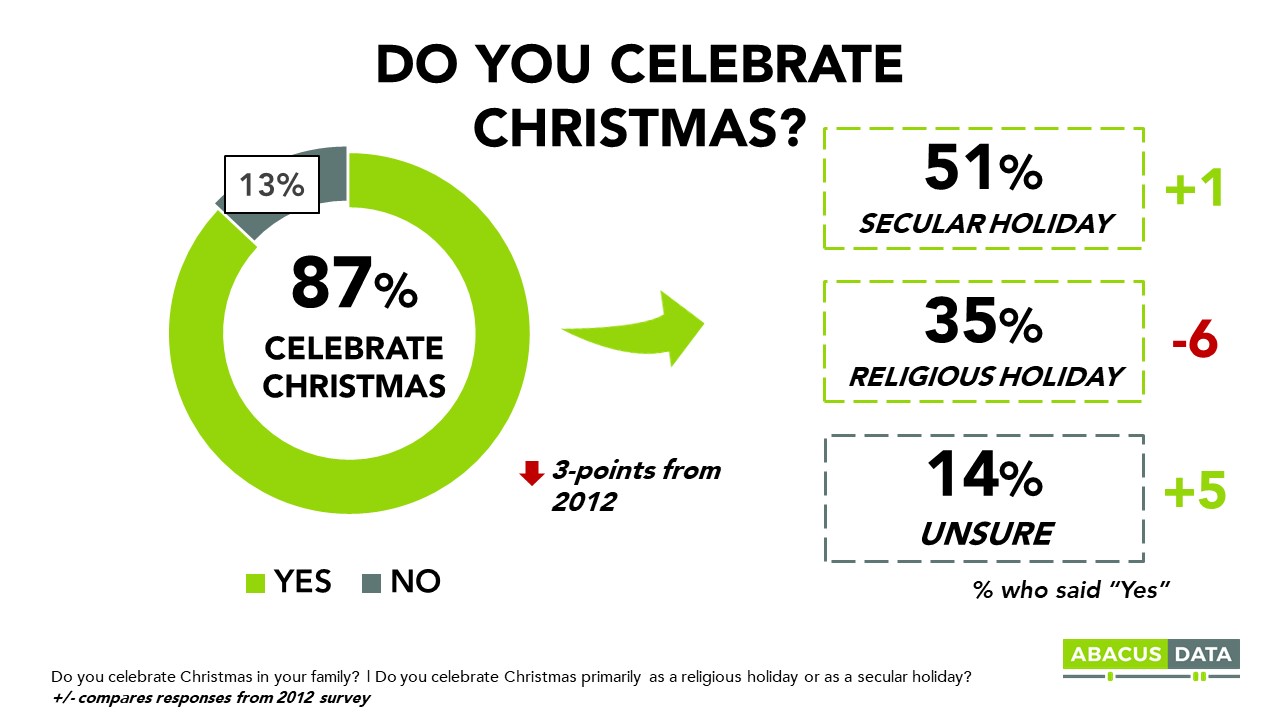
Christmas is broadly celebrated across the country. 87% of Canadians surveyed say they celebrate Christmas in their family – down 3-points from 2012.
However, since 2012, we see a shift away from Christmas being celebrated as a religious holiday, and a slight increase in Christmas being celebrated as a secular holiday. Overall, about half (51%) of Canadians celebrate Christmas primarily as a secular holiday – a 1-point increase from 2012 – and 35% celebrate Christmas as a religious holiday, down 6-points from 2012. Nearly two in 10 (14%) are unsure.
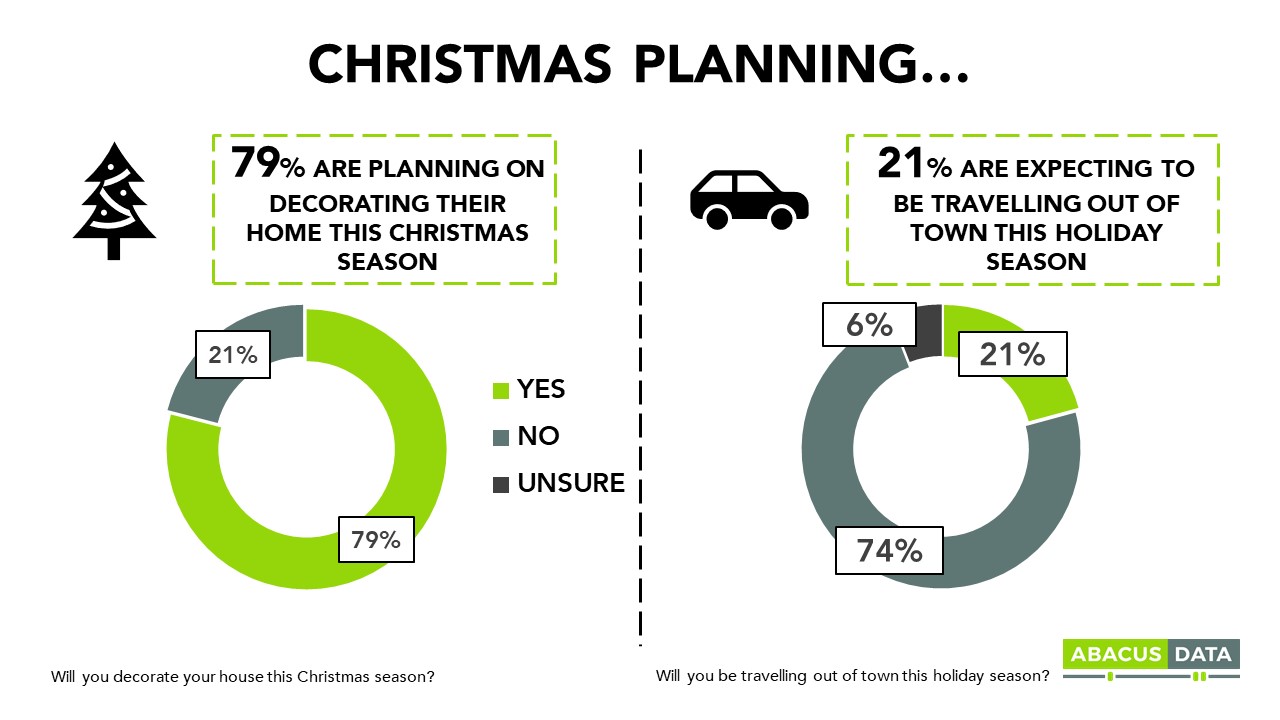
Eight in 10 (79%) Canadians are planning to decorate their home this Christmas season – a 4-point decrease from 2012.
Two in 10 (21%) are expecting to travel out of town this holiday season – 74% are not travelling out of town and 6% are unsure.
Roast turkey is most likely to find its way onto Canadians’ table for Christmas dinner with 64% reporting they plan to serve that most Christmas of foods but down from 75% in 2012.
Roast chicken has increased in popularity at 11%, an increase of 7-points from 2012. Millennials are much more likely to expect to eat a roasted chicken for Christmas dinner, as well as more likely to be eating an alternative vegetarian meal. Older cohorts are far more likely to be eating a traditional Christmas roasted turkey. This increase in vegetarian alternatives for Christmas dinner is in line with recent findings where 51% of Canadians have either reduced or are considering reducing the amount of meat they eat.
A majority of Canadians (58%) are expecting to spend about the same amount that they spent on gifts last year – up 3-points from 2012. A quarter is expecting to spend less this year (31% in 2012 vs. 24% this year).
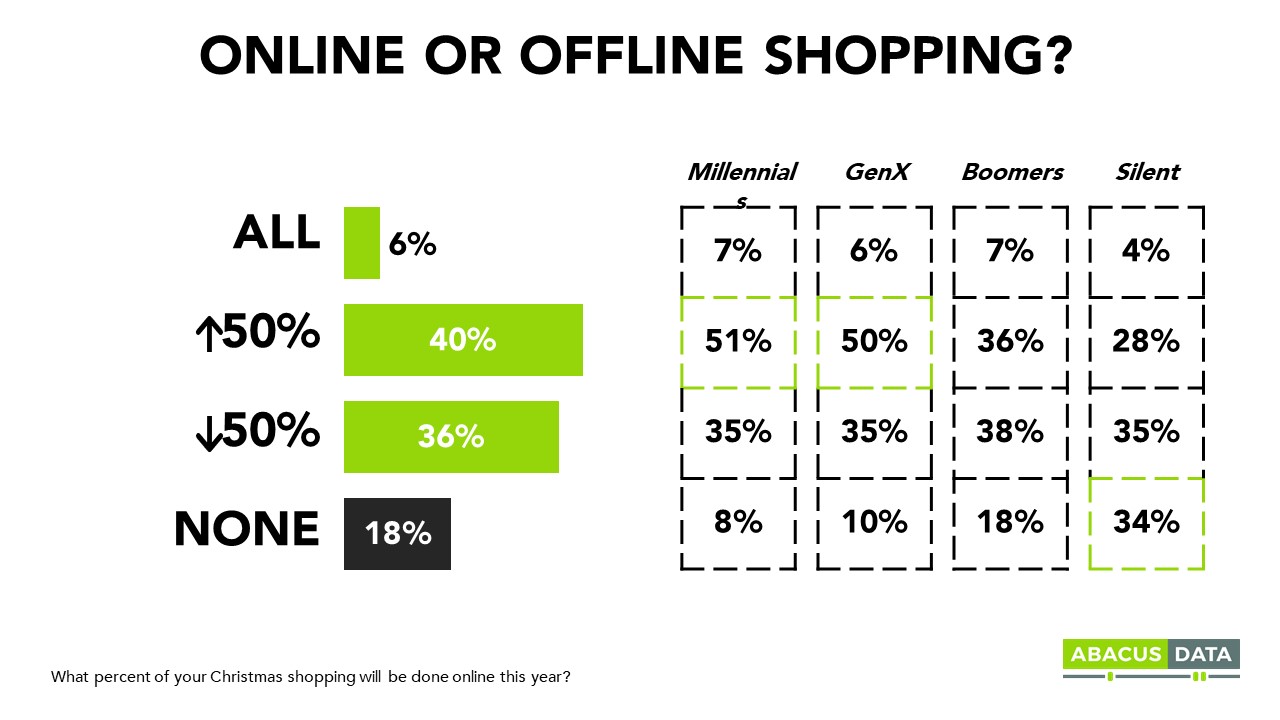
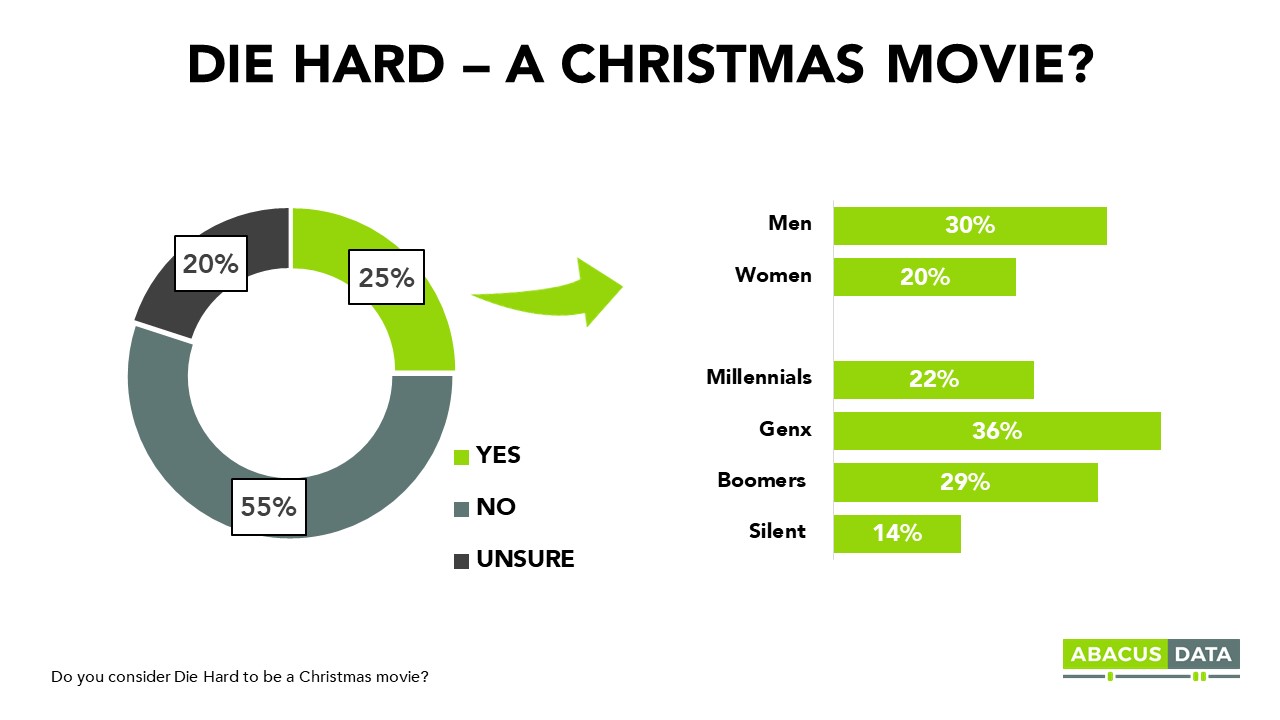
When we asked about shopping habits this Christmas, four in 10 (40%) expect to do the majority of their Christmas shopping online, only 6% expect to do all of their shopping online. Younger cohorts – 51% Millennials and 50% GenX – are likely to do more than 50% of their shopping online. Two in 10 (18%) Canadians don’t think they will do any of their Christmas shopping online – almost twice as many in the Silent generation (34%). Like other movies set at Christmastime, there has been a debate about whether or not Die Hard is, in fact, a Christmas movie. We set out to find some answers, and here is what we found: A quarter of Canadians (25%) consider Die Hard to be a Christmas movie – 55% do not and 20% are unsure. There is a lean towards males (30%) and those 30-44 (36% GenX).
UPSHOT
Most Canadians continue to celebrate Christmas. But like everything else, Christmas is also changing. What we eat, whether we celebrate Christmas as a secular or religious holiday, and how we shop are all shifting thanks to changing demographics and technology. In a way, the Christmas experience across Canada parallels changes we have been tracking in other aspects of life, work, politics, and business.
METHODOLOGY
Our survey was conducted online with 1,500 Canadians aged 18 and over from December 12 to 16, 2019. A random sample of panellists was invited to complete the survey from a set of partner panels based on the Lucid exchange platform. These partners are double opt-in survey panels, blended to manage out potential skews in the data from a single source.
The margin of error for a comparable probability-based random sample of the same size is +/- 2.1%, 19 times out of 20. The data were weighted according to census data to ensure that the sample matched Canada’s population according to age, gender, educational attainment, and region. Totals may not add up to 100 due to rounding.
ABOUT ABACUS DATA
We are the only research and strategy firm that helps organizations respond to the disruptive risks and opportunities in a world where demographics and technology are changing more quickly than ever.
We are an innovative, fast-growing public opinion and marketing research consultancy. We use the latest technology, sound science, and deep experience to generate top-flight research-based advice to our clients. We offer global research capacity with a strong focus on customer service, attention to detail and exceptional value.
We were one of the most accurate pollsters conducting research during the 2019 Canadian Election.
Earlier this week, we completed a national survey of 1,500 Canadians and updated our federal political tracking. While not much has changed since Canadians voted on October 21, the results point to some of the strengths and weaknesses facing parties and their leaders amid the minority parliament.
Here’s what our data show.
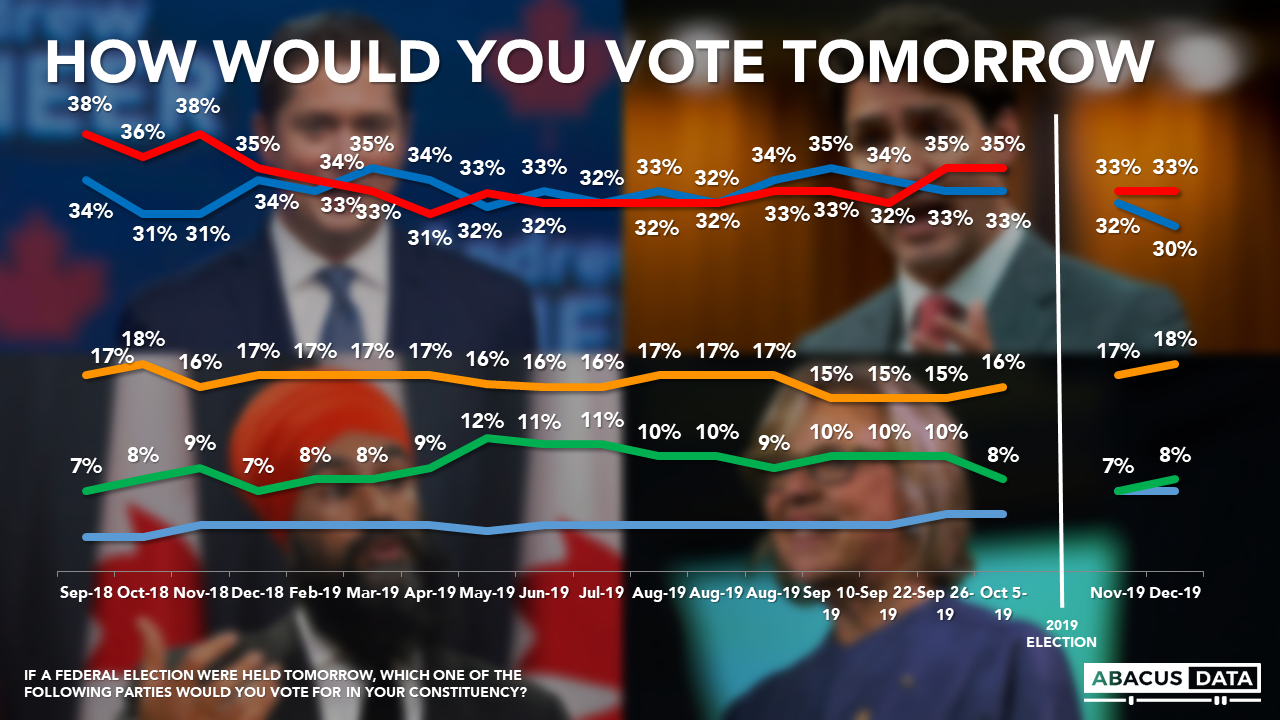
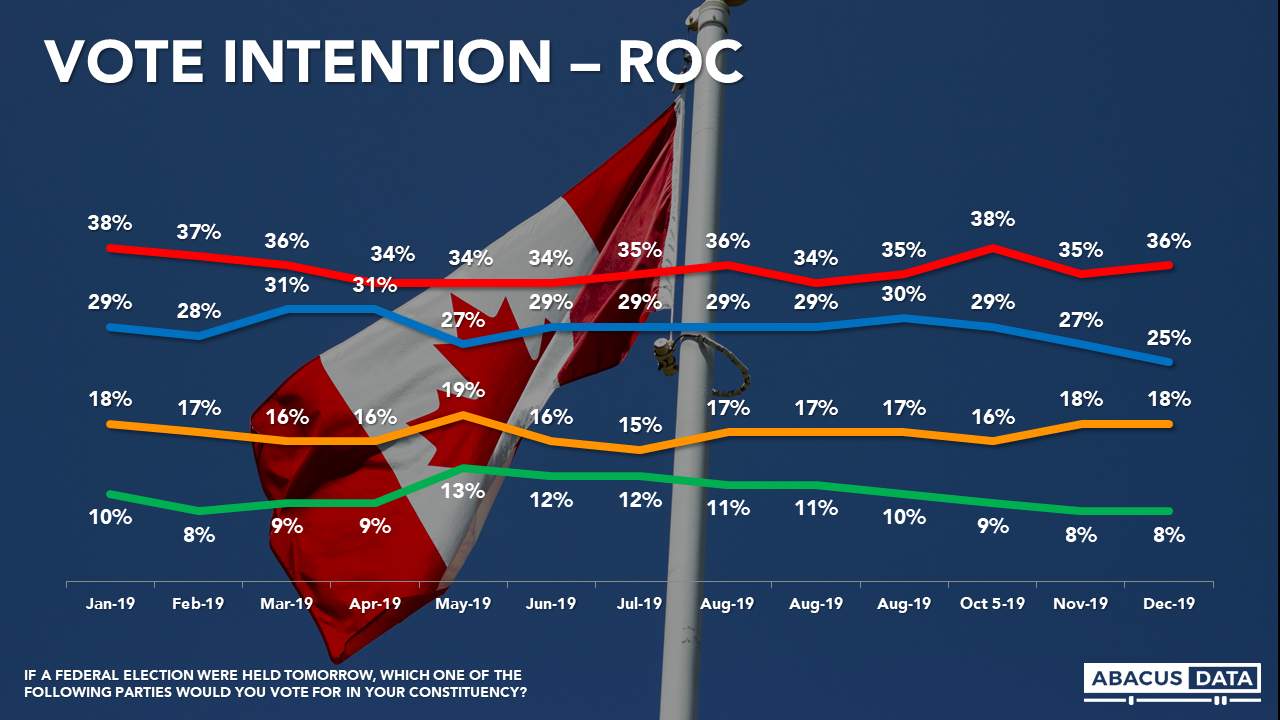
1. The national race remains tight with the Liberals ahead of the Conservatives by 3-points. Since the election, the Conservatives are down 4-points to 30% while the Liberals are steady at 33%. The NDP is at 18% nationally.
2. Regionally, the Liberals have a wide lead in Atlantic Canada, an 8-point lead in Ontario, and are statistically tied with the BQ in Quebec (31% for the BQ vs. 29% for the Liberals). The Conservatives have a wide lead in Alberta and the prairies while the NDP and Liberals are statistically tied in BC. We have the Conservatives at 21% in BC.
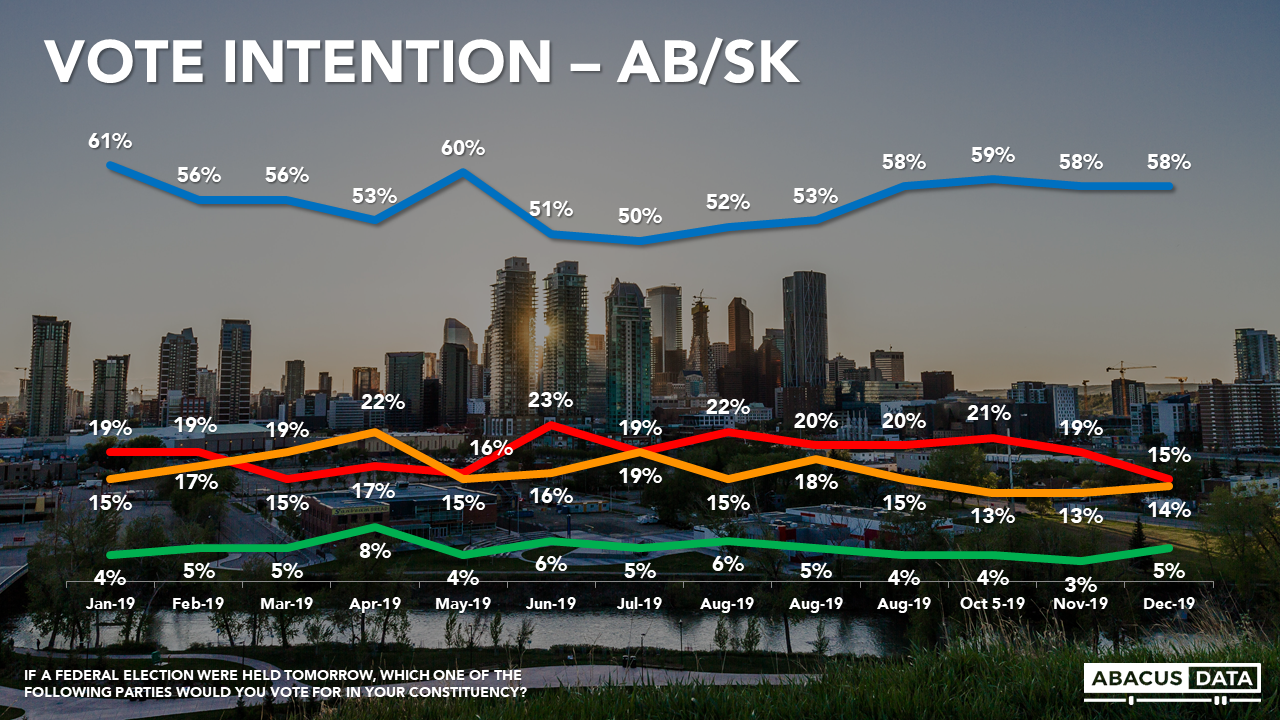
3. If we divide the country between Alberta/Saskatchewan and the rest of the country, the Liberals lead the Conservatives by 11-points outside of AB/SK (36% to 25%) while the Conservatives now lead by 43% over the Liberals in Alberta and Saskatchewan. The differences between these two regions have grown since the election.
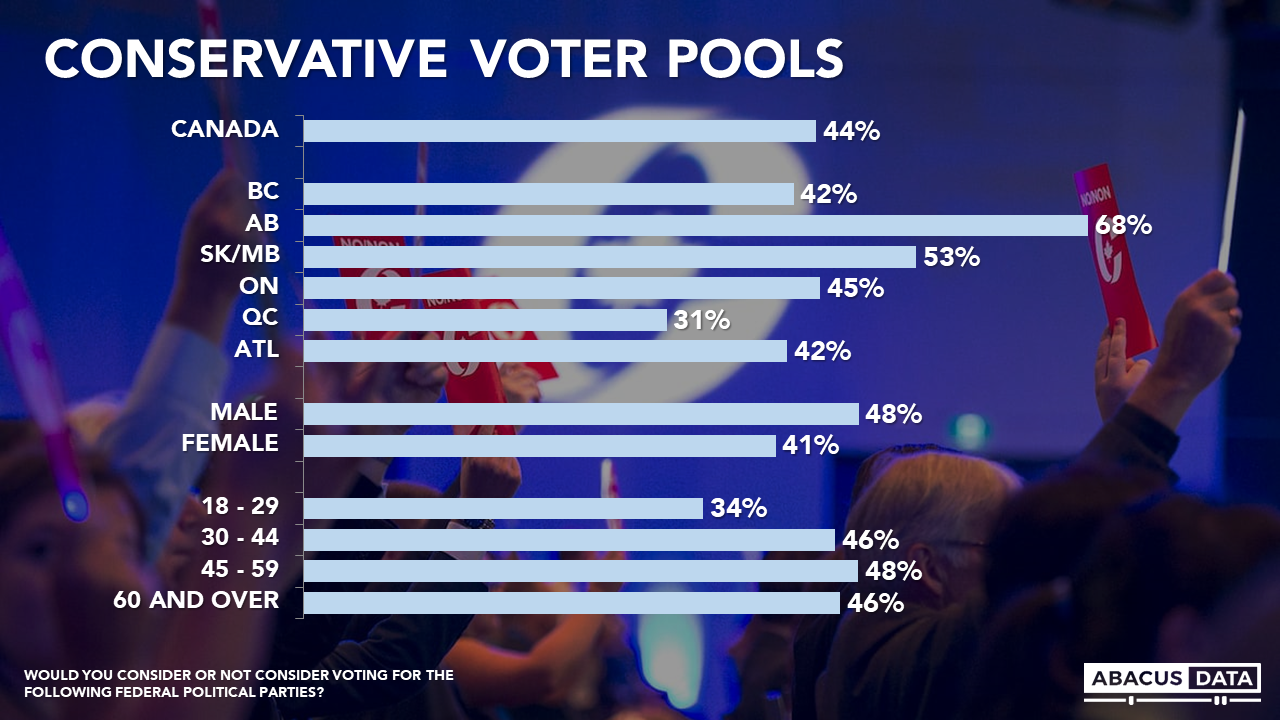
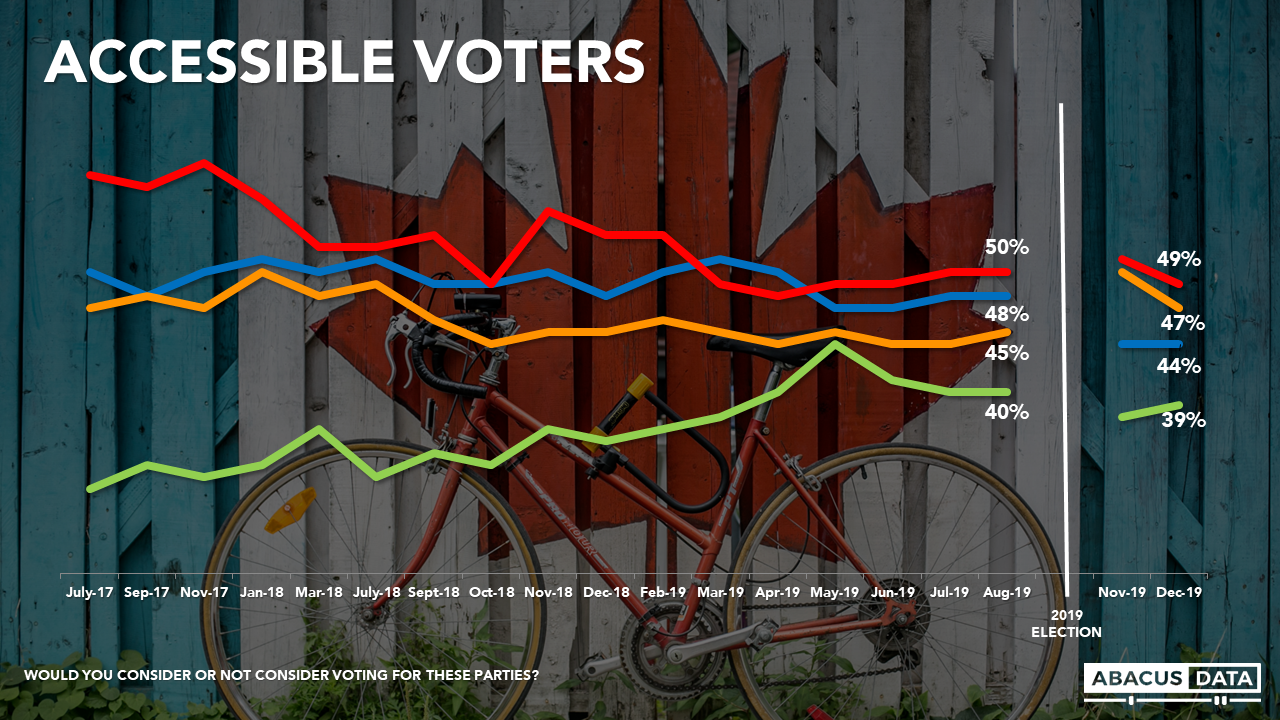
4. The Liberal Party has the largest pool of accessible voters, with 49% saying they would consider voting Liberal, unchanged from the end of August before the campaign started, and 5-points more than would consider voting Conservative. 44% would consider voting Conservative, down 4 from the start of the 2019 campaign. 47% would consider voting NDP, 39% would consider voting Green, while 46% of Quebecers would consider voting BQ.
5. For the Conservatives, its accessible voter pool is largest in Alberta (68%) and smallest in Quebec (31%). 45% of Ontarians are open to voting Conservative while 42% in BC and Atlantic Canada feel the same way. The party also needs to find a way to appeal to younger Canadians as only 34% of those aged 18 to 29 would even consider voting Conservative, 13-points lower than those aged 30 and over.
6. The federal government’s approval rating has improved slightly since the end of the election campaign. In April 2019, 32% approved compared with 48% who disapproved. Today, 39% approve and 43% disapprove. Approval is higher in Atlantic Canada (49%), Ontario (44%), Quebec (38%), and BC (37%) and lower in Alberta (26%).
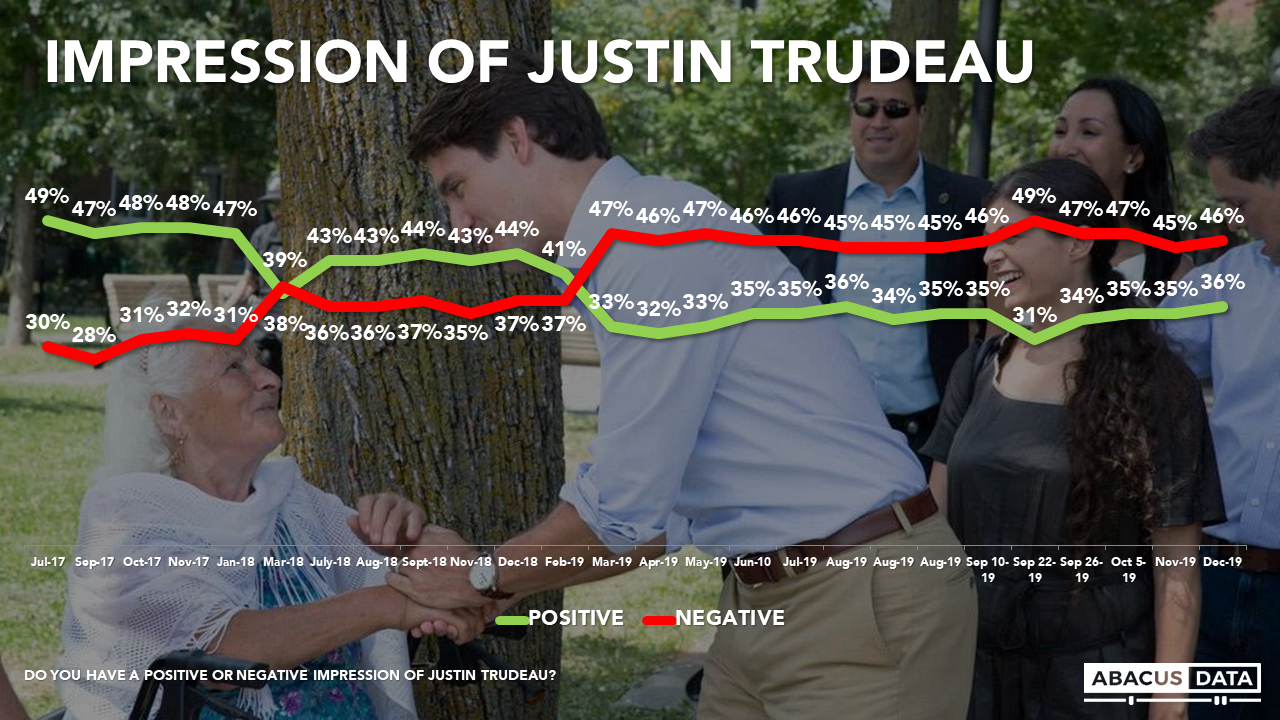
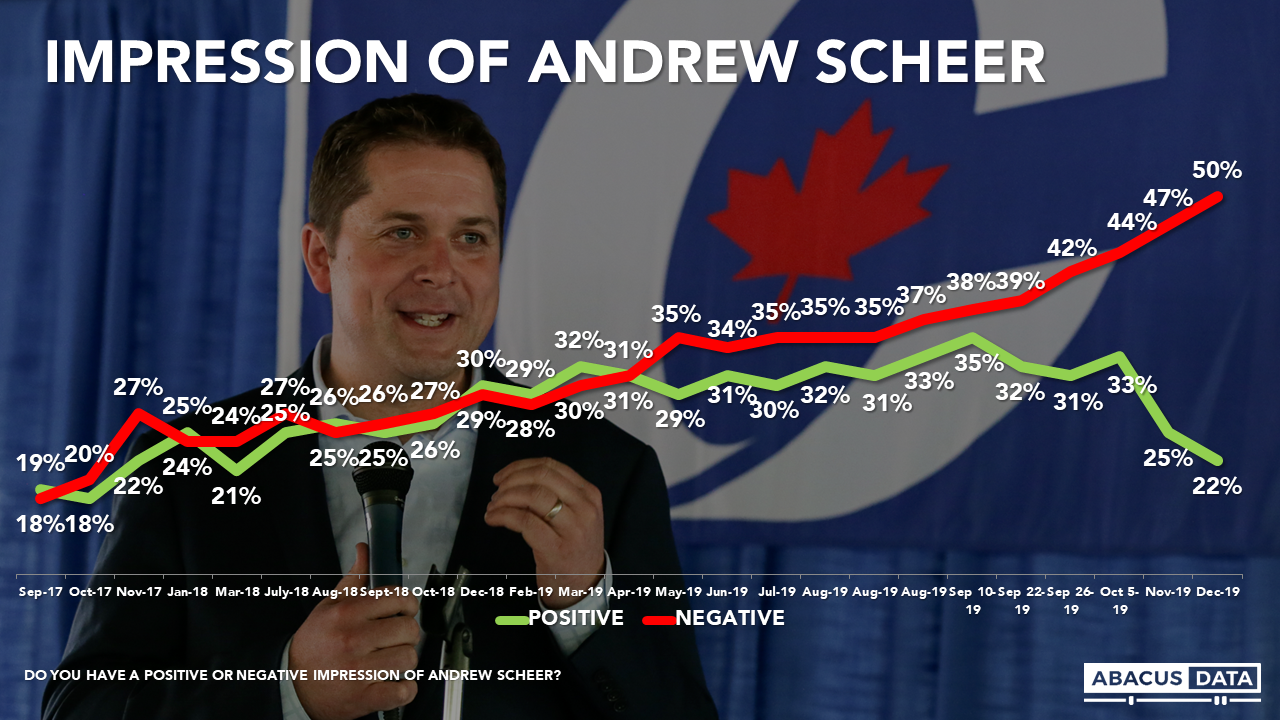
7. Impressions of Prime Minister Trudeau are consistent from last month, with 36% viewing him positively and 46% negatively. Mr. Scheer ends his time as Conservative leader with even more negative numbers. Today, only 22% have a positive impression of him, down 11 points since early October and down 3 from last month. 50% of Canadians have a negative view of Mr. Scheer.
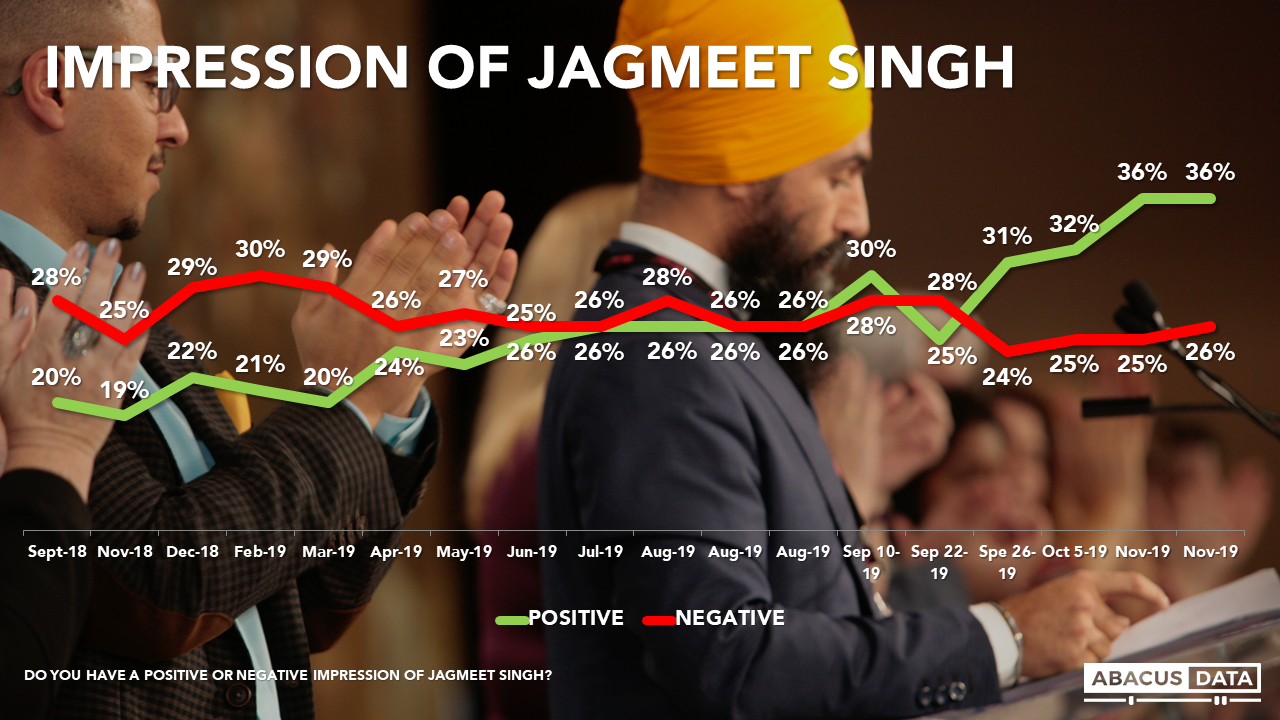
8. Mr. Singh’s numbers remain more positive than the other party leaders. 36% have a positive view of him compared with 26% who have a negative view. He’s particularly popular with those under 30 (44% positive vs. 12% negative), while those 60 and over are more likely to have a negative view of the NDP leader (28% positive, 34% negative).
UPSHOT
According to Bruce Anderson: “The trend line on public views of Andrew Scheer reinforces that the Conservative leader was struggling to find a positive connection with voters, and winning a renewed mandate would have been difficult.
Mr. Scheer’s positive ratings sagged to a level last seen a year and a half ago, but at that time, his negatives were half what they are today. In this survey, only 40% of Albertans and just 63% of Conservative voters expressed a positive view of Mr. Scheer.
Looking ahead, the Conservative Party’s accessible voter pool has declined to just 31% in Quebec, just 34% among under 30 voters, and 41% among women – thresholds that make it very difficult to put together a winning electoral coalition. As the party begins the search for a new leader, the conundrum of how to win the base, versus how to win the country is perhaps clearer than ever. There are few voters to the right of where the party stands today – many more to the left. The Party’s 43 point advantage in two provinces can create an echo chamber effect that drives policy and rhetorical choices, which could worsen the 11 point gap to the Liberals in the rest of the country. The positioning of the Conservatives on social equality and climate change will likely be central to this battle for the role of Conservative leader – and for reasons that are evident in these polling trends.”
According to David Coletto: “As 2019 comes to an end, Canadians continued to hold mixed feelings about the federal government and their political leaders. The federal government’s approval rating is up slightly, Mr. Trudeau’s personal numbers are holding steady but still more negative than positive, and the Liberals have the largest pool of accessible voters.
For the Conservatives, Mr. Scheer’s resignation provides the party to reset and assess its offering to Canadians. Mr. Scheer is now substantially less popular than he was at the start of the campaign. 50% of Canadians have a negative view of him, while only 22% view him positively, including just over half (56%) of those who voted Conservative in October. The party has a smaller pool of accessible voters than both the Liberals and NDP, something its new leader needs to expand if the party hopes to win. The focus needs to be on younger voters and Quebecers as two-thirds of those groups would not even consider voting Conservative today.
For the NDP, Mr. Singh remains the most popular leader nationally. So his strategy in 2020 should continue to focus on building on that goodwill and leveraging it expand support and appeal. While 59% of those aged 18 to 29 would consider voting NDP, Mr. Singh and the party has to find a way to appeal to older Canadians, especially Boomers who are 22-points less likely to consider voting NDP than those under 30.”
DATA GRAPHICS
METHODOLOGY
Our survey was conducted online with 1,500 Canadians aged 18 and over from December 12 to 16, 2019. A random sample of panellists was invited to complete the survey from a set of partner panels based on the Lucid exchange platform. These partners are double opt-in survey panels, blended to manage out potential skews in the data from a single source.
The margin of error for a comparable probability-based random sample of the same size is +/- 2.1%, 19 times out of 20. The data were weighted according to census data to ensure that the sample matched Canada’s population according to age, gender, educational attainment, and region. Totals may not add up to 100 due to rounding.
ABOUT ABACUS DATA
We are the only research and strategy firm that helps organizations respond to the disruptive risks and opportunities in a world where demographics and technology are changing more quickly than ever.
We are an innovative, fast-growing public opinion and marketing research consultancy. We use the latest technology, sound science, and deep experience to generate top-flight research-based advice to our clients. We offer global research capacity with a strong focus on customer service, attention to detail and exceptional value.
We were one of the most accurate pollsters conducting research during the 2019 Canadian Election.
What consumer attitudes tell us about potential shifts in consumer behaviour in Canada towards plant-based alternatives.
This past May, Beyond Meat Inc. started trading shares on the Nasdaq stock exchange. Its stock was initially priced at $25 USD and within a few months, it gained over 800% topping out at $235 before coming back and settling at around $75 USD with a market capitalization of $4.6 billion.
With all the hype and interest in this emerging market, we wanted to explore the potential for the meatless market in Canada and understand the potential for plant-based diets. At the same time, we also wanted to explore the risk to those who produce food products, and the opportunity to those in foodservice and retail. The data was used as part of today’s Sysco Canada’s Webinar Wednesday.
For the study, we interviewed 2,000 Canadian consumers aged 18 and over from November 12 to 17, 2019. The sample is representative of the Canadian population.
FOOD IS TOP OF MIND
Food and how it is made are top of mind to most Canadians. Half of Canadians today are thinking about the quality of their diets, all the time, or regularly. Add in those who think of the quality of their diets at least occasionally, and the number increases to 9 in 10 Canadians.
At the same time, Canadians are also preoccupied with climate change and wanting to know where their food comes from. And the youngest consumers, those aged 18 to 29 are the most likely to be thinking about these things (more to come shortly on the generational divides).
Food is increasingly becoming more than just sustenance. It’s about identity, belonging, and purpose. The rise of the “foodie” culture and growing interest in how food is produced and its impact on our health and environment is growing.
TO MEAT OR NOT TO MEAT
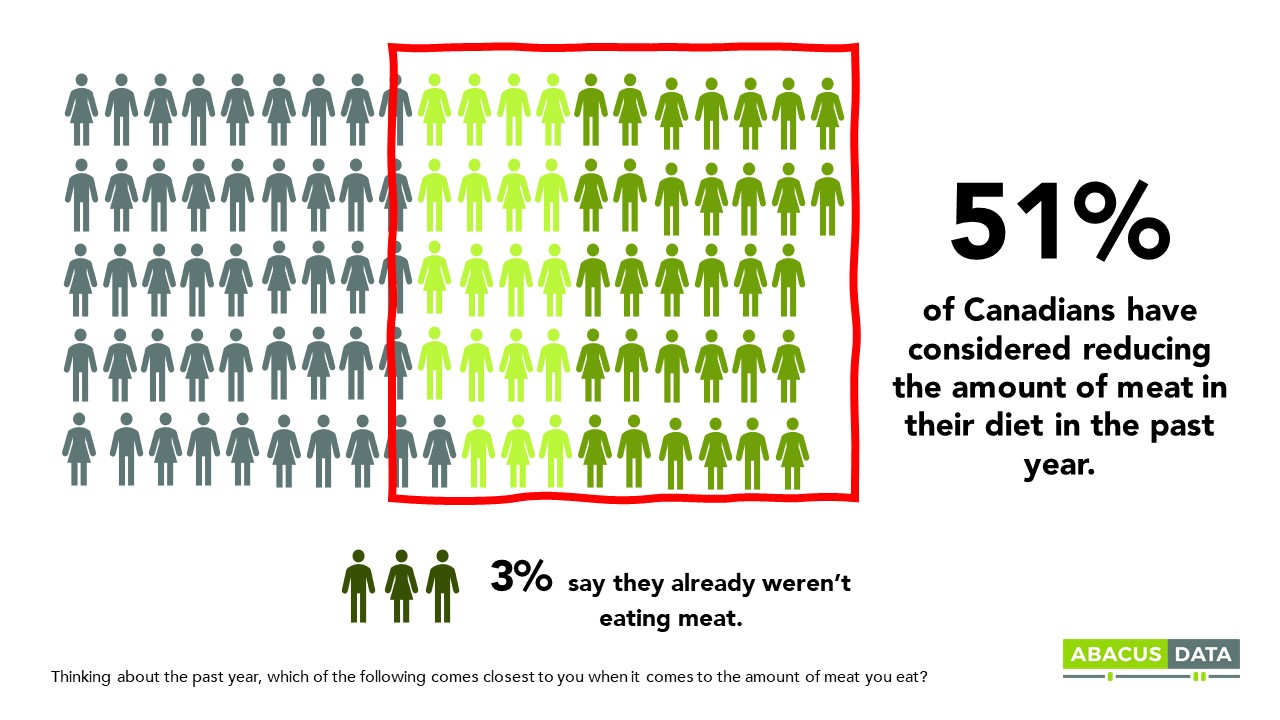
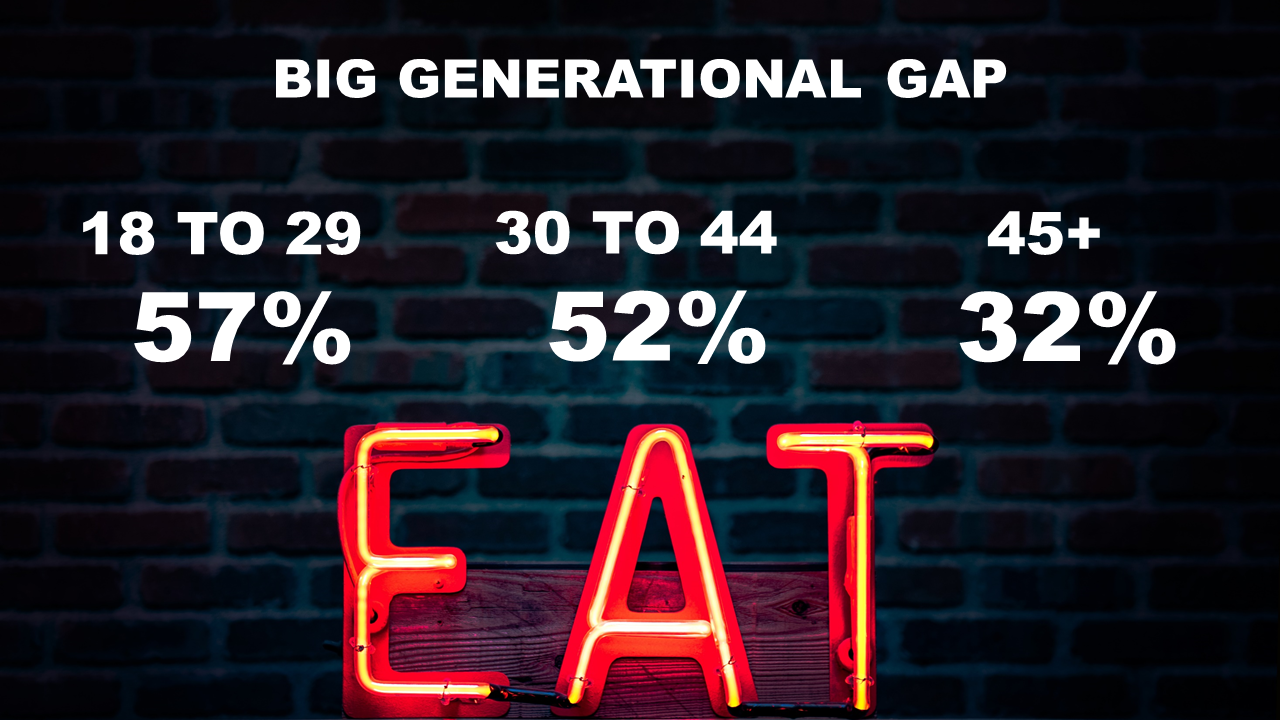
Almost all Canadians eat meat. But many Canadians report either reducing the amount they eat or are thinking about reducing the amount of meat they eat (51% total). We estimate that about 1.5 million Canadian adults have reduced the amount of meat they ate the past year, according to self-reporting.
A minority (41%) say they have not reduced the amount of meat they consume, nor have they thought about reducing the amount of meat they are eating within the past year.
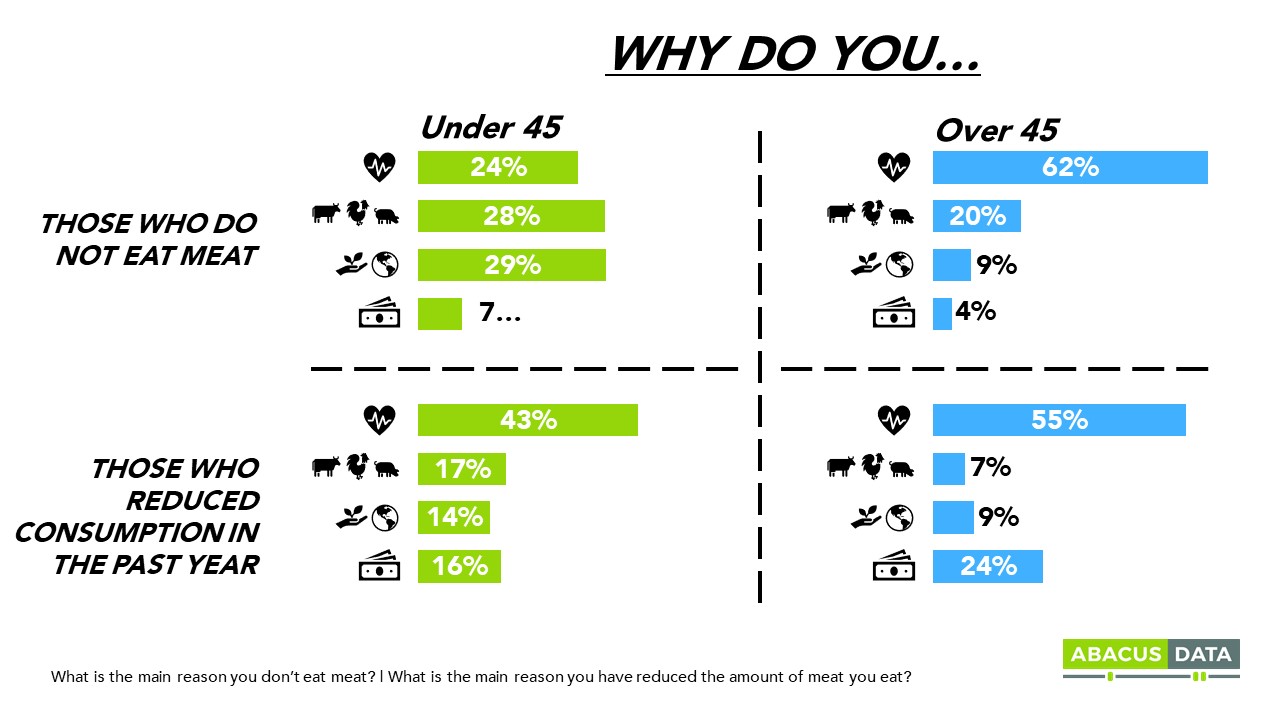
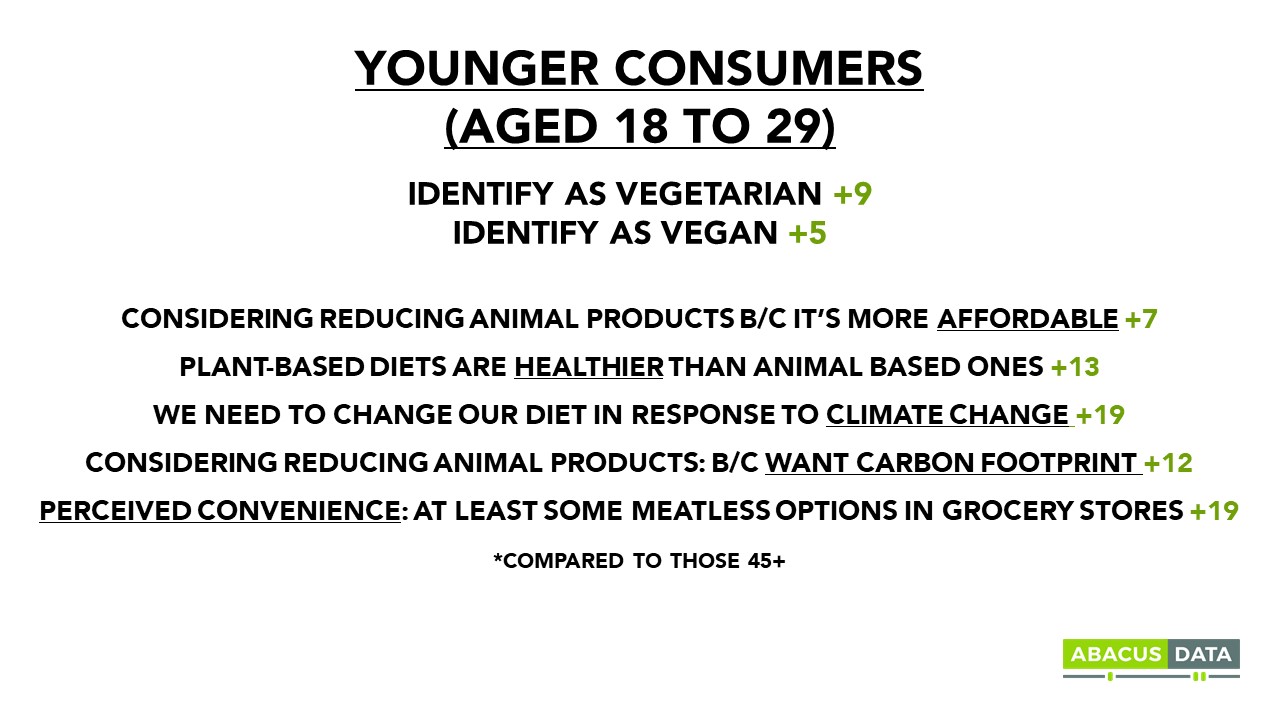
When Canadians were prompted about reasons why they either do not eat meat or have reduced their consumption, four factors were most prevalent: health considerations, concerns about the treatment of animals, climate change, and affordability. Most striking was the gap between generations – specifically under and above 45 years of age.
Health is a major factor for reducing consumption of meat or eliminating it altogether from their diet for those over 45 while climate change and the treatment of animals are more important for younger consumers.
Approaching the topic slightly differently finds similar attitudes. 44% agree they should be eating less meat (only 27% say the same about dairy though). And when asked about how their habits fit with an identity, 8% identify as a vegetarian, and 4% as a vegan.
The generational differences in habits alone are steep. 7% of younger consumers (18 to 29 years) aren’t eating meat, compared to just 1% of those 60+. And for this demographic, not eating meat is more than a behaviour, it’s an identity. Those age 18 to 29 are three times more likely to identify as a vegetarian, compared to those 45+; and twice as likely to identify as a vegan.
THE MARKET FOR MEATLESS ALTERNATIVES IS BIG
When we ask consumers how likely, if at all, they are to purchase foods that look and taste like meat, but only contain plant-based products, 42% say they are certain or likely to, representing 12.3 million adult consumers. But there’s a big generational divide. Over half of those under 45 years old say they are likely to purchase meatless alternatives compared with about a third of those aged 45 and over.
COMPARING MEAT AND MEATLESS ALTERNATIVES
Having more choices in the marketplace may not be enough to stimulate a change of behaviour. Our research finds perceived nutritional value, environmental impact, cost, social pressures and taste all play a role in a possible shift to alternatives.
Health Considerations
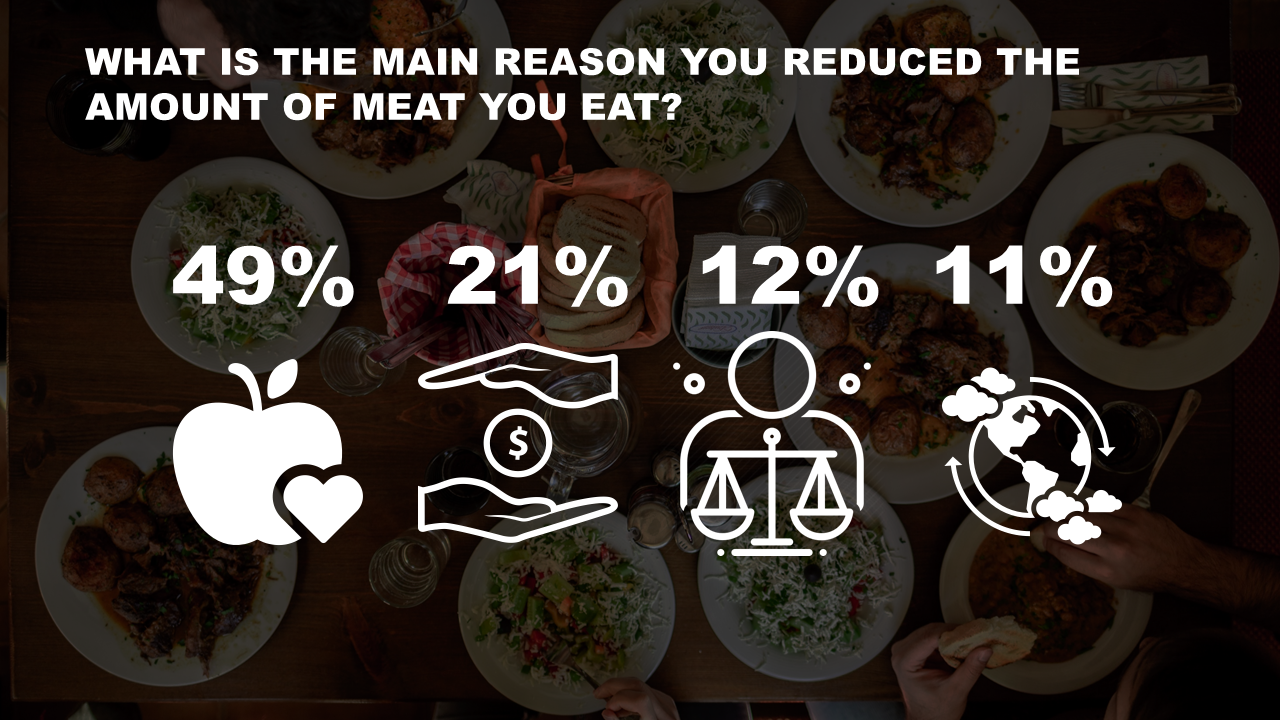
Health is the most cited reason for reducing meat/dairy intake. 47% of Canadians report that health benefits of reducing meat or dairy consumption are a consideration for changing the amount they consume. When we asked those who say they reduced meat consumption this past year what the primary reason was, unprompted, 49% cite health concerns. At the same time, 1 in 5 says instructions/advice from their doctor would be a major consideration. Health as a major consideration for reducing meat/dairy intake ranks higher than the treatment of animals, affordability, and availability of alternatives.
For the most part, when considering switching diets, Canadians have positive impressions of plant-based and vegan diets. 55% feel that plant-based diets are healthier than animal-based ones, and slightly less (41%) feel the same about vegan diets (we split the sample and the impact of language – vegan vs. plant-based – is a fascinating subplot in the data).
Millennials feel more strongly than other generations about the health benefits of vegan and plant-based diets (63% of millennials say plant-based diets are healthier than animal-based diets and 51% say vegan diets are healthier than animal-based diets).
That said, one in three have ‘no confidence’ that plant-based products are healthier for you than meat products. Although, when asked whether a dish with meat or meatless alternatives would be healthier or the same amount it’s a tie- 34% say the dish with meat, 33% dish with meatless alternative, 34% both equally. Unsurprisingly, younger Canadians are more confident that meatless alternatives are healthier (40% of those 18-29 compared to 28% of those 60+).
Environment & Climate Change
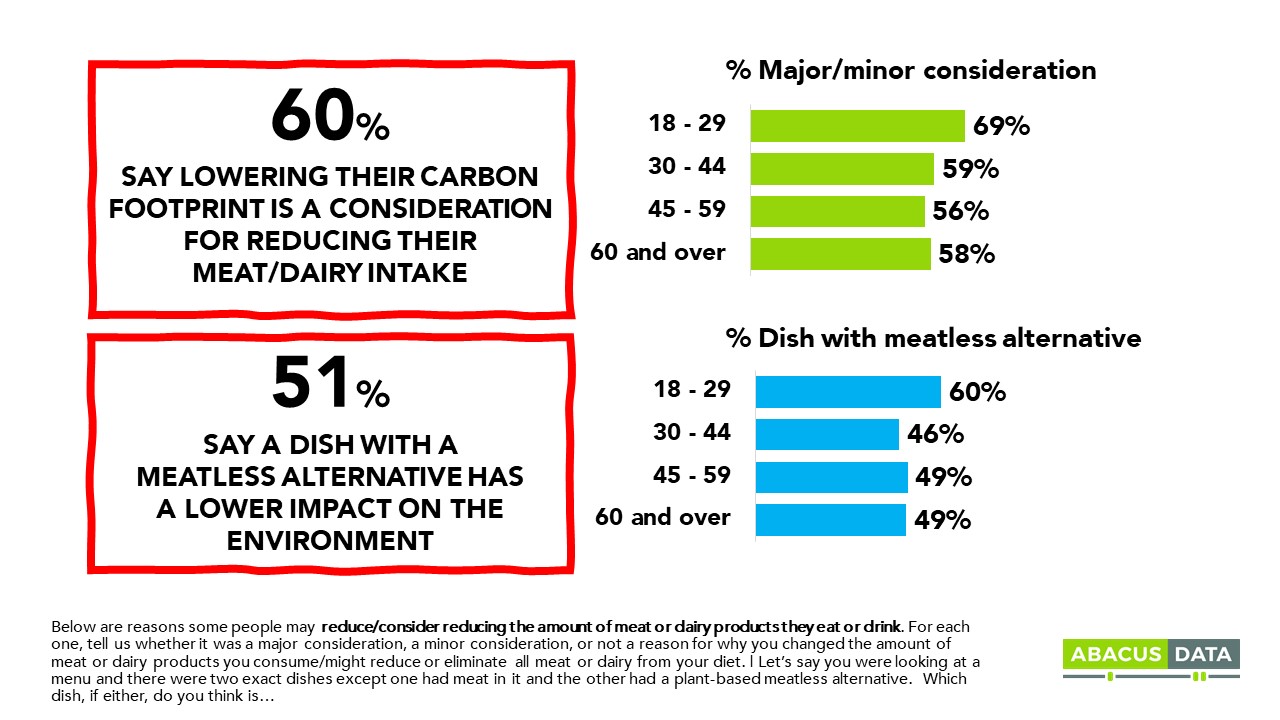
In a general sense, there’s a broad understanding that there is a link between the production of animal-based food products and climate change. About six in ten Canadians agree to some extent that we need to change our diets in response to climate change with 11% strongly agreeing with this view. For those who have already started changing their behaviour, many identify climate change as a factor. When asked why they don’t eat meat or have reduced their consumption, many mentioned the environment or climate change as their primary reason. Moreover, 60% regarded wanting to lower their carbon footprint as a consideration for reducing their meat or dairy intake.
But not everyone is convinced that plant-based meat alternatives have less of an impact on climate change. 62% have at least some confidence that plant-based products have a smaller carbon footprint than meat products but only 12% are completely confident that this is the case. Producers of these products have more work to make their case of the environmental benefits of these products.
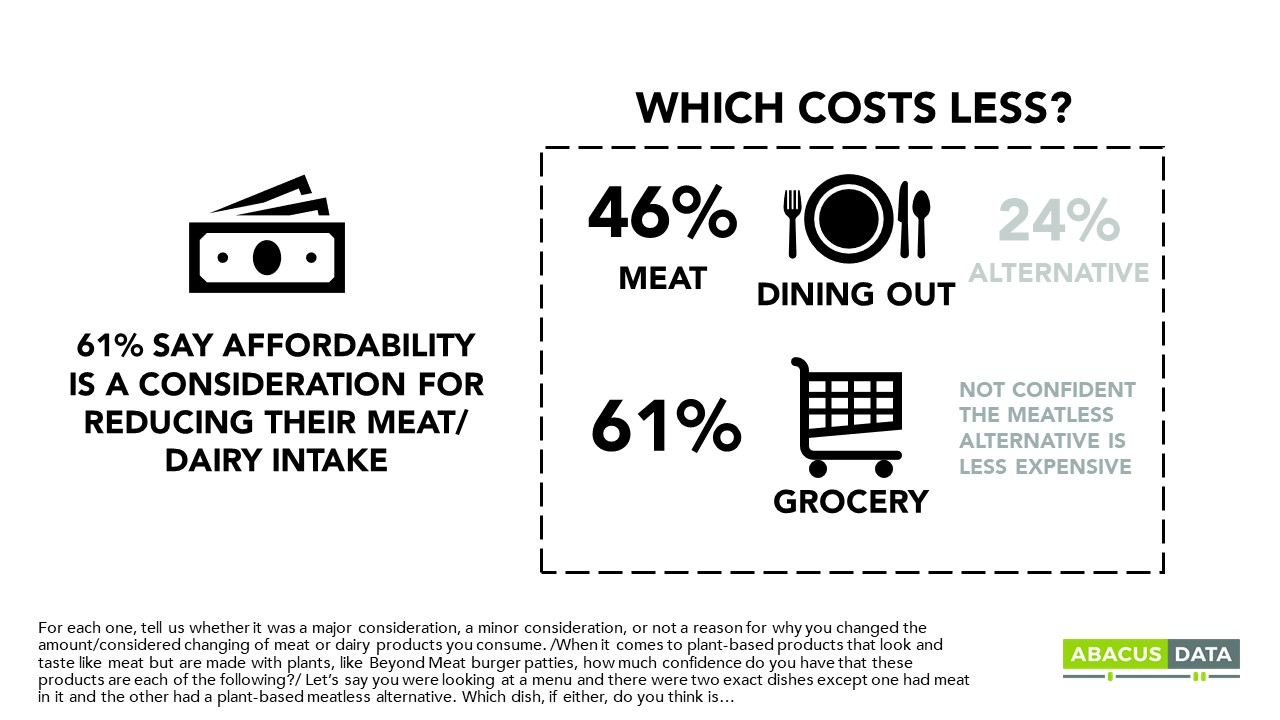
Affordability
Cost is a major consideration for people thinking about making the switch to meat alternatives. 26% say affordability is a major consideration, and another 35% say it’s a minor one when making a decision to reduce meat/dairy consumption. For younger Canadians (18-29), this jumps to 35% who say it’s a major consideration.
That said, when the cost is in question, meat-based products are still more likely to be perceived as affordable when compared to meatless alternatives. 62% of Canadians have little to no confidence that the plant-based version would cost less than a meat-based product.
There is a generational divide here too. Younger Canadians are more confident choosing a meatless alternative will lead to savings at the grocery store, and 33% of younger consumers say dishes with meat alternatives are the cheaper option at a restaurant, compared to just 21% of those 45+.
Social Pressure
Beyond cost, health, and environmental considerations, a less obvious but perhaps more important factor lurks to shift consumer behaviour over time: social pressure and ethical considerations.
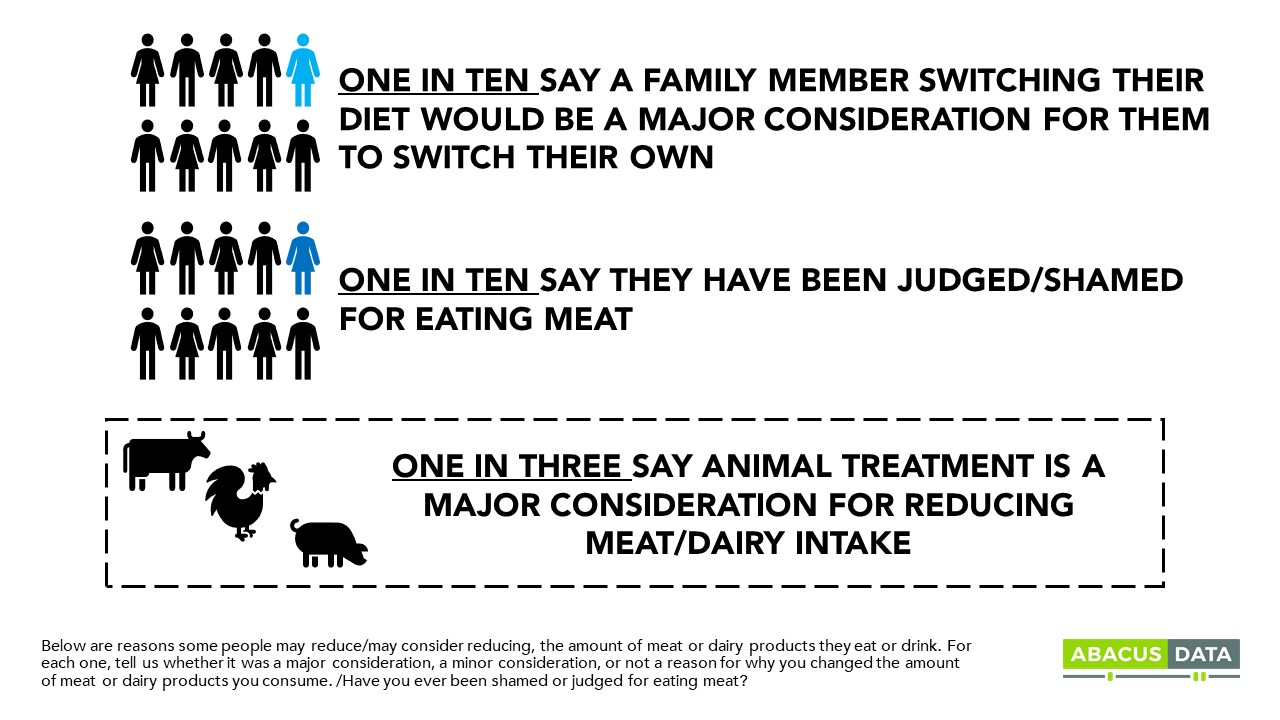
On one end of the spectrum, one in ten say a family member switching their diet would be a major consideration for them to change their own.
A more extreme version of social pressure is shaming or judgment and 9% of Canadians report being shamed/judged for eating meat with almost 1 in 5 younger consumers reporting being shamed by others for their food choices – eating meat.
The ethical pressures (no doubt in part due to the abundance of Netflix specials about the topic) are also pushing people to reconsider what they eat. One in three says the treatment of animals is a major consideration for them to reduce the amount of meat they eat.
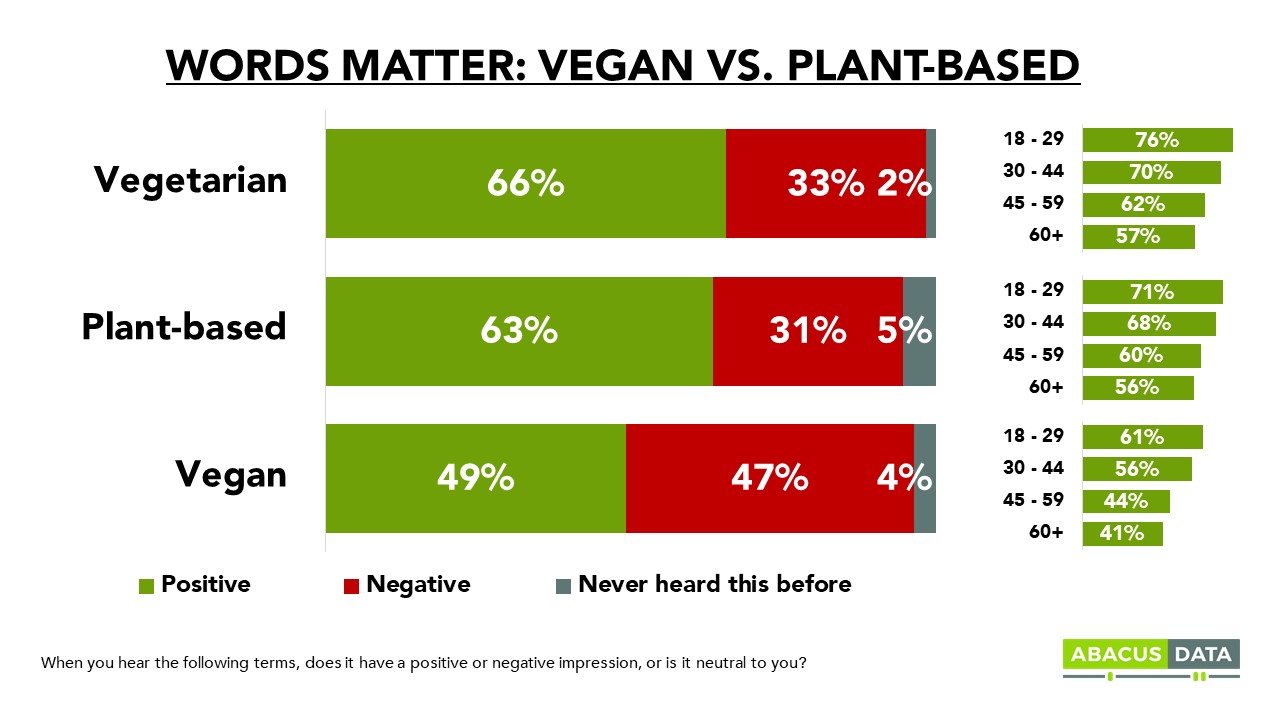
That doesn’t mean that those who do eliminate these products are free from scrutiny. The word ‘vegan’ carries a negative impression for half (47%) of consumers, 16-points higher than the term “plant-based”. Describing products and dishes as plant-based may find a wider audience than those described as vegan.
Younger Canadians are much more likely to view these terms with a positive view, compared to their older counterparts. Interestingly, the term ‘plant-based’ has a much more tepid response from Canadians. Only 31% of Canadians have a negative impression of ‘plant-based’.
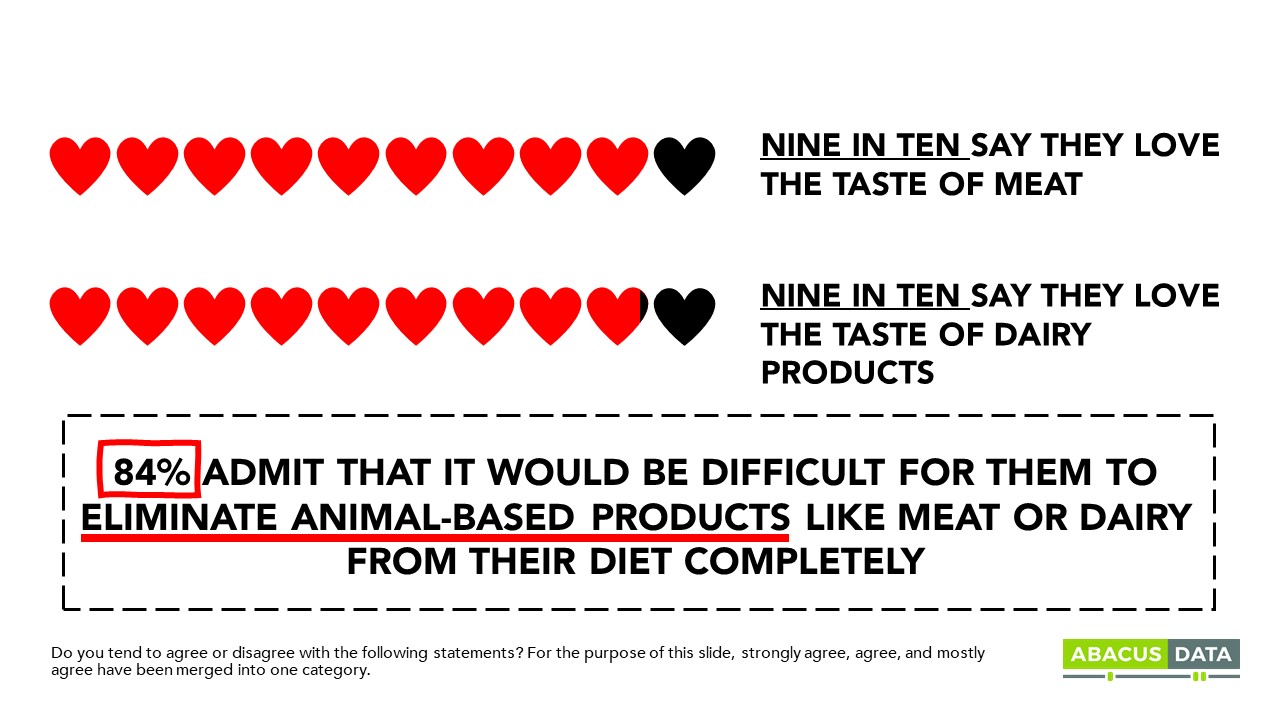
But meat tastes good right?
Despite a large number of consumers reducing the amount of meat they are consuming or many more considering a switch, taste is not a factor in that decision. Almost all Canadians (90%) agree they love the taste of meat and the taste of dairy products. When we ask consumers to consider two meals, one with meat and one with alternatives, far more say they meal with meat will taste better. Even young Canadians admit they love the taste of meat and dairy products. So a shift in preferences is not a shift in taste, but a response to both health considerations (for older consumers) and environmental and ethical ones (for younger consumers).
KEY TAKEAWAYS
The results of this study raise several points worth considering for those in the foodservice, retail, and agri-food sectors.
1- A large number of consumers are aware of the impact of the food choices they make – both on climate change and on animal welfare. Those concerns are likely to become more intense over time, especially as generational change continues to transform the market.
2- Health considerations are most important for older consumers who are looking to reduce the amount of meat they consume and find more balance in their diets.
3- Social pressure is an area to watch closely. The reaction to single-use plastics (straws) and the feeling of being “judged” for carrying around a drink container with a straw has forced consumers to be more sensitive to that issue. The same can happen to diet choices and a tipping point can develop that causes a rapid shift in consumption.
4- Ultimately, most Canadian consumers love the taste of meat and animal-based food products. They find comfort in them. They make them feel good and are perceived to be more satisfying that meatless or plant-based alternatives.
5- All this points to a potentially large and growing market for these plant-based alternatives. About 12.3 million Canadians (42%) say they are likely to purchase a meatless alternative meat product.
6- It also suggests a clear consumer demand for products that are more “hybrid” in nature. Think burgers that are half meat, half plant-based products. Consumers seeking to reduce their meat consumption may not want to eliminate those products completely from their diets but they may seek alternatives that allow them to get the enjoyment of meat without the health considerations and ethical/environmental judgement that might come with consuming them. Most feel it will be very difficult to eliminate all meat or animal-based products from their diets, but there’s an intent and willingness to reduce. Most Canadians already say they have or have considered reducing the amount of meat they eat.
7 – Most important in this data, in our opinion, is the deep generational divides on many of the attitudes and intentions. Millennials and Generation Z will not only force the market to react, but they may apply subtle or more aggressive pressure on their parents and loved ones to change their behaviour as well. The potential for generational contagion is real and could further accelerate shifts in consumer preferences.
Our sense is that the shift towards meatless alternatives is not a fad but a developing trend. As concern about climate change grows, so too will demand for food products that generate less carbon. That could mean growth in meatless/plant-based products and also increased expectations that those producing meat and animal-based food products will reduce their carbon footprints.
METHODOLOGY
Our survey was conducted online with 2,000 Canadians aged 18 and over from November 25 to 29, 2019. A random sample of panellists was invited to complete the survey from a set of partner panels based on the Lucid exchange platform. These partners are double opt-in survey panels, blended to manage out potential skews in the data from a single source.
The margin of error for a comparable probability-based random sample of the same size is +/- 2%, 19 times out of 20. The data were weighted according to census data to ensure that the sample matched Canada’s population according to age, gender, educational attainment, and region. Totals may not add up to 100 due to rounding.
ABOUT ABACUS DATA
We are the only research and strategy firm that helps organizations respond to the disruptive risks and opportunities in a world where demographics and technology are changing more quickly than ever.
We are an innovative, fast-growing public opinion and marketing research consultancy. We use the latest technology, sound science, and deep experience to generate top-flight research-based advice to our clients. We offer global research capacity with a strong focus on customer service, attention to detail and exceptional value.
We were one of the most accurate pollsters conducting research during the 2019 Canadian Election.
With the recent launch of both Disney+ and Apple TV Plus, the streaming wars are heating up. The market is saturated with all your favourite tv shows and movies accessible at the click of your mouse. It begs the question of whether there is enough room in the market or money in our pockets to supplement our forever-rotating list of top fav streaming sites.
In the wake of new industry players, we asked Canadians about what streaming services they subscribe to and how that compares with cable/satellite.
Here is what we found:
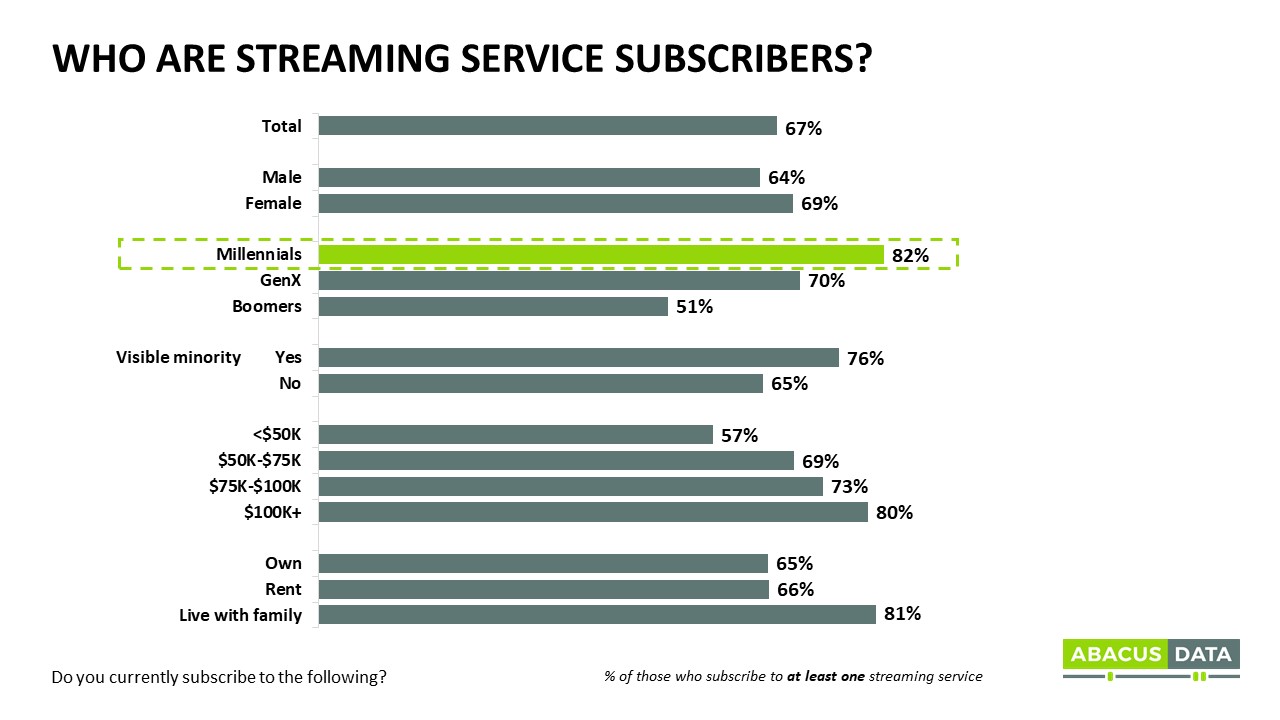
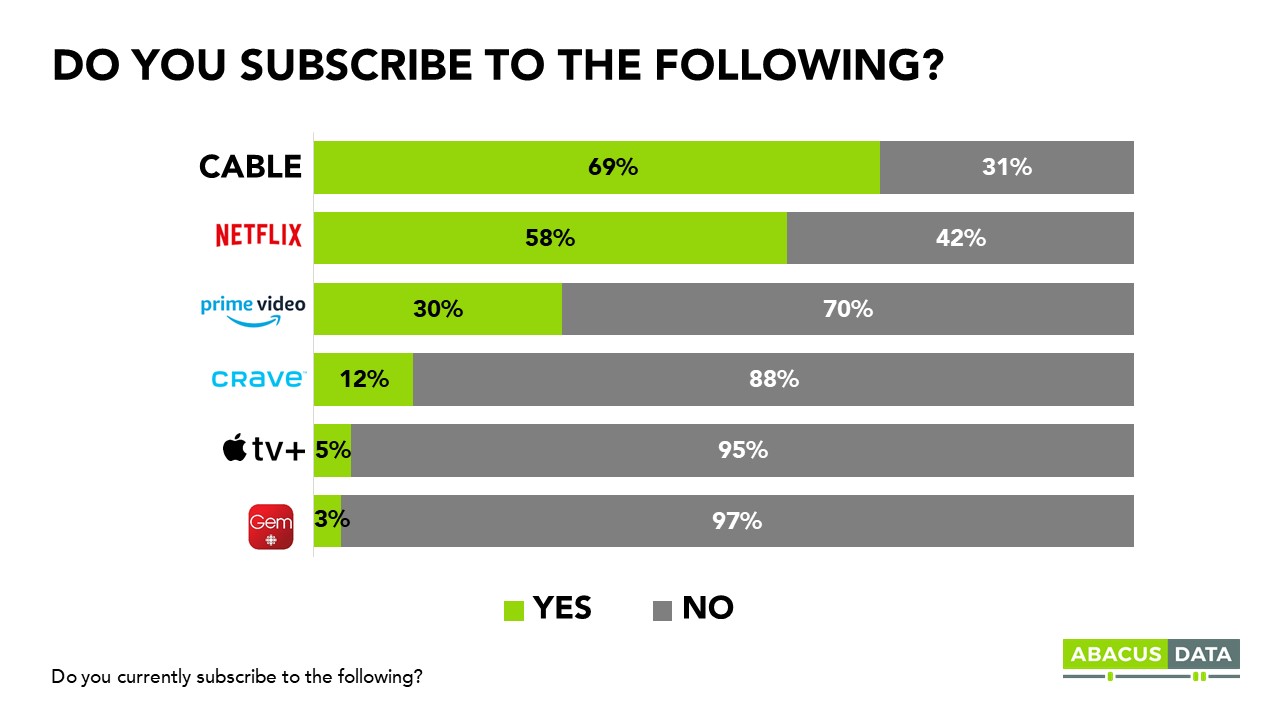
Almost seven in ten Canadians (67%) reported being subscribed to at least one streaming subscription service.
Just 12% of respondents are subscribed to only one streaming service.
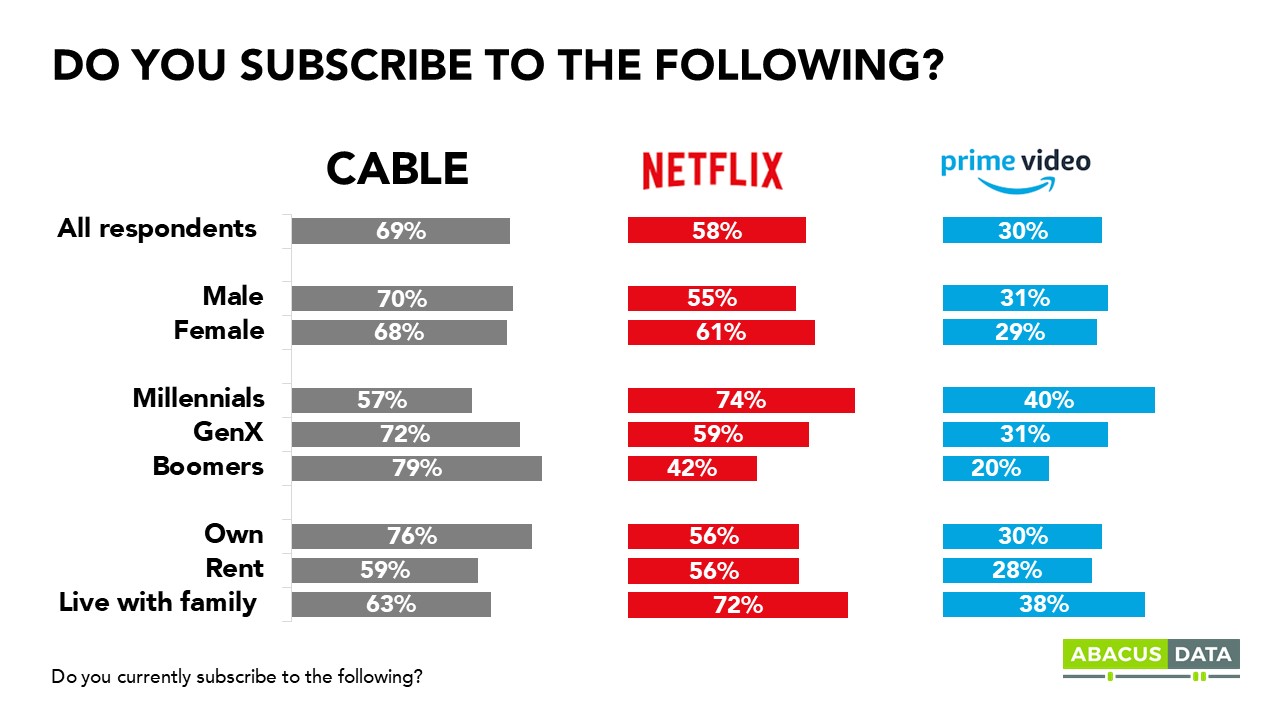
Seven in 10 Canadians (69%) are currently subscribed to cable or satellite TV. This segment tends to be older (79% Boomers), with the potential to have a higher salary and own their home.
It is more likely that Canadians have a combination of multiple streaming service subscriptions and cable or satellite TV, than one or the other.
Two-thirds (66%) of those who are subscribed to either cable or satellite TV are also subscribed to at least one online streaming subscription service. Only 23% have at least one monthly streaming subscription and no cable or satellite TV.
Among cable and satellite subscribers
54% are also subscribed to Netflix.
29% have a subscription to Prime Video.
25% have only cable/satellite TV and no other subscriptions.
Six in 10 (58%) Canadians reported that they are currently subscribed to Netflix. This group is more likely to be female, suburbanites, higher in education and income, and younger (Millennials & those living with family). One-third (30%) of respondents have subscriptions to Prime Video – with similar demographic tendencies to Netflix.
Netflix and Prime Video appear to be comfortably the market leaders. Netflix is one of the world’s first online streaming subscription services and has over 148 million subscriptions worldwide. Netflix has been inherited through families and has an endless range of movies, TV shows, documentaries, and Netflix original content. Those who subscribe to the hugely popular Amazon Prime are automatically awarded a subscription to Prime Video (subscriptions can also be purchased individually). These two streaming services have accumulated massive bases of subscribers with many years’ head start. They are not likely to be dropping out of the running anytime soon.
Although the streaming market is saturated with subscription services, Canadians are likely to have a rotating lineup of their favourites – heavy competition means it’s more challenging to remain on someone’s roster than to be initially selected.
As is the case with many new/modern services, Millennials are the first to recognize the value of subscription streaming services – they are cost-effective and cheaper than cable or satellite TV, and you don’t have to abide by traditional viewing schedules. Being able to consume content whenever, wherever, and however you want is very Millennial-friendly. Eight in ten (82%) of Millennials subscribe to at least one streaming service: 74% are subscribed to Netflix and 40% are subscribed to Prime Video.
As generations continue to mature, we can expect to see a progressive increase in the number of subscribers to streaming services, which could shift the proportion of tv/cable subscribers and online streaming subscribers – lessening the market share for tv/cable subscribers. The streaming market is becoming saturated and competition more intense. Netflix is the market leader in Canada, but Prime is growing thanks to the other perks of membership.
Disney+ enters the market with a strong catalogue of content and Canada’s largest generation (millennials) well into childbearing years and Baby Boomers increasingly becoming grandparents. With content for young and old, Disney+ has the content, now it needs to compete for that share of time and wallet content producers and distributors are continuing the compete for.
METHODOLOGY
Our survey was conducted online with 3,000 Canadians aged 18 and over from November 12 to 17, 2019. A random sample of panellists was invited to complete the survey from a set of partner panels based on the Lucid exchange platform. These partners are double opt-in survey panels, blended to manage out potential skews in the data from a single source.
The margin of error for a comparable probability-based random sample of the same size is +/- 1.79%, 19 times out of 20. The data were weighted according to census data to ensure that the sample matched Canada’s population according to age, gender, educational attainment, and region. Totals may not add up to 100 due to rounding.
ABOUT ABACUS DATA
We are the only research and strategy firm that helps organizations respond to the disruptive risks and opportunities in a world where demographics and technology are changing more quickly than ever.
We are an innovative, fast-growing public opinion and marketing research consultancy. We use the latest technology, sound science, and deep experience to generate top-flight research-based advice to our clients. We offer global research capacity with a strong focus on customer service, attention to detail and exceptional value.
We were one of the most accurate pollsters conducting research during the 2019 Canadian Election.
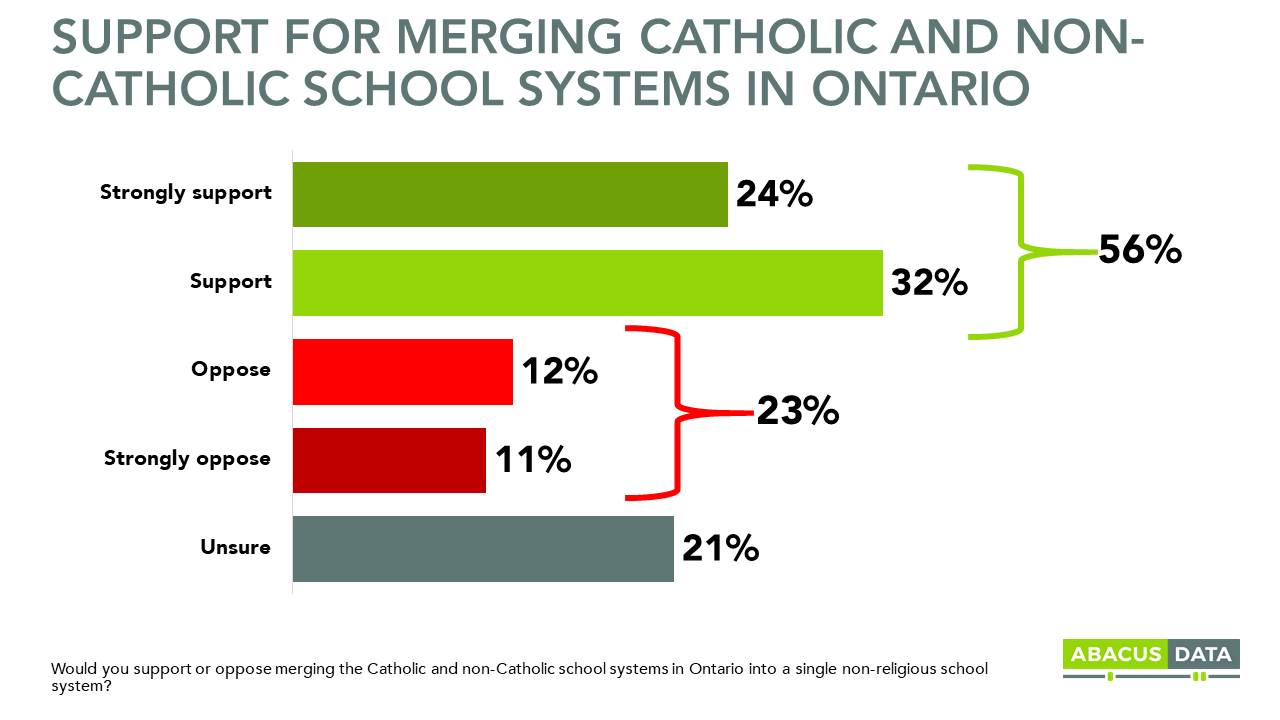
A slim majority (56%) of Ontarians support merging the separate (Catholic) and public school systems in Ontario into a singular publicly-funded school system. One in four strongly support the idea, while only one in ten are strongly opposed.
The question of what to do with the separate school system has been fertile ground for debate as increasing secularization in Canadian society has led many to question the logic of faith-based school funding, especially for a single faith.
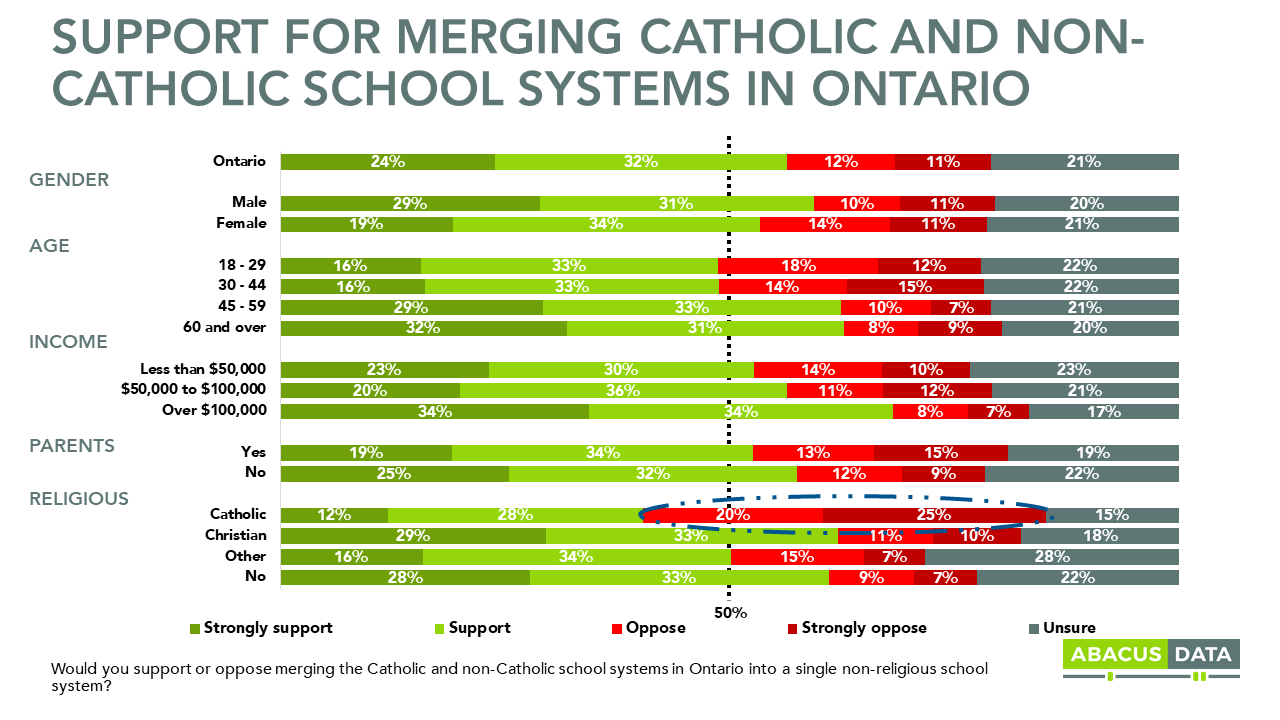
Support for merging systems is supported by all demographic groups, but particularly Ontarians over the age of 45 who have been exposed to years of debate on the issue. Both parents of children at home and childless Ontarians alike are similarly in majority support of consolidating the systems, though parents with children at home – and with kids likely in one of the public school systems, are more likely to oppose consolidation.
By far the biggest opposition comes from Ontario’s Catholic population, constituting 30% of the population. A majority of Ontario Catholics either oppose system consolidation (45%) or are unsure (15%). Still, even 40% of Catholics in Ontario believe there should be a single public school system.
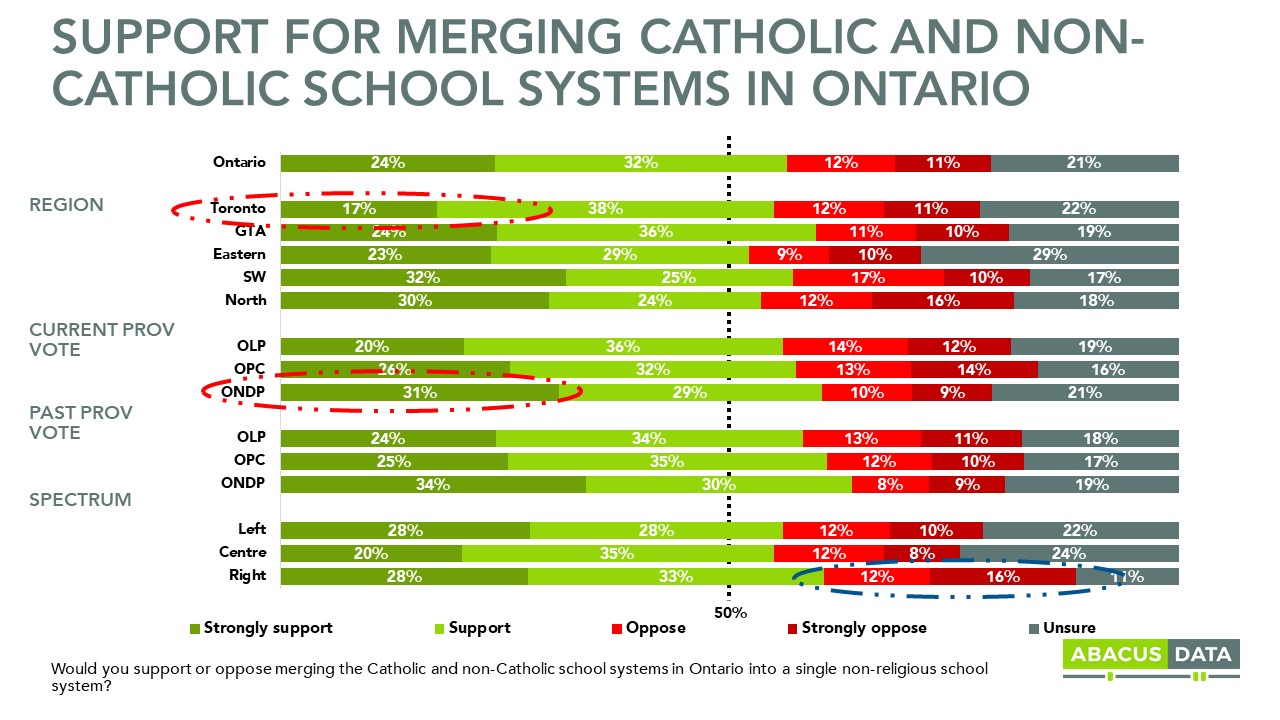
Support for consolidation is softest in Toronto, where only 17% of voters strongly support consolidation, although 55% support the idea overall.
Politically, there is very little variation – voters and vote groups of all political stripes support a single school system, though there appears to be an extra premium for consolidation among NDP voters particularly.
As this issue reemerges in the context of the Ontario Liberal Party leadership and the party focused on renewal and a refresh, it may be fertile ground for a re-litigation of how we fund education in the province.
METHODOLOGY
Our survey was conducted online with 785 Ontarians aged 18 and over from November 12 to 17, 2019. A random sample of panellists was invited to complete the survey from a set of partner panels based on the Lucid exchange platform. These partners are double opt-in survey panels, blended to manage out potential skews in the data from a single source.
The margin of error for a comparable probability-based random sample of the same size is +/- 3.6%, 19 times out of 20. The data were weighted according to census data to ensure that the sample matched Ontario’s population according to age, gender, educational attainment, and region. Totals may not add up to 100 due to rounding.
ABOUT ABACUS DATA
We are the only research and strategy firm that helps organizations respond to the disruptive risks and opportunities in a world where demographics and technology are changing more quickly than ever.
We are an innovative, fast-growing public opinion and marketing research consultancy. We use the latest technology, sound science, and deep experience to generate top-flight research-based advice to our clients. We offer global research capacity with a strong focus on customer service, attention to detail and exceptional value.
We were one of the most accurate pollsters conducting research during the 2019 Canadian Election.
We are very excited to announce that Megan Ross has joined our team as a Senior Analyst.
Prior to joining Abacus Data, Megan worked at H&K and the Gandalf Group as a research analyst.
“Megan will play a critical role in our research operation, working with our team to execute research projects to the standard Abacus Data has become known for,” said Abacus Data CEO David Coletto. “Megan’s energy and curiosity stood out the moment I met her. She’ll fit right in with our team.”
Megan maintains a keen interest in polling, as well as the ins and outs of all public policy – she has previously specialized in health care, cannabis policy, municipal affairs, and provincial affairs.
Megan holds a Bachelor of Cognitive Science Honours from Carleton University, and has a post-graduate certificate in Market Research and Business Intelligence.
Born and raised in Ottawa, Megan loves spending time with her family (especially her nephew), exploring all the great activities Ottawa has to offer including hitting the city’s endless paths with her rollerblading or hiking throughout Gatineau Park.
We are the only research and strategy firm that helps organizations respond to the disruptive risks and opportunities in a world where demographics and technology are changing more quickly than ever.
We are an innovative, fast-growing public opinion and marketing research consultancy. We use the latest technology, sound science, and deep experience to generate top-flight research-based advice to our clients. We offer global research capacity with a strong focus on customer service, attention to detail and exceptional value.
We were one of the most accurate pollsters conducting research during the 2019 Canadian Election.
The post-election discussion in Canadian politics has centred a lot on the relationship with Alberta. With that in mind, we decided to take a look at where attitudes currently stand.
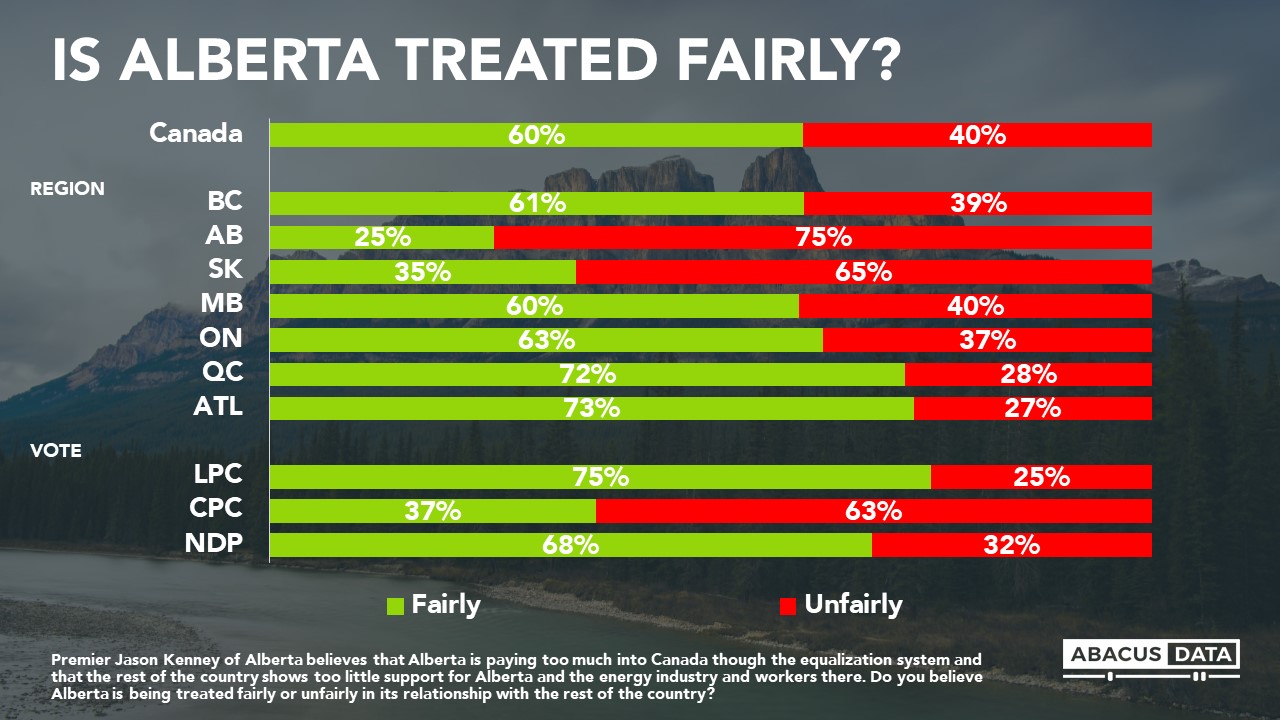
• Right now, 75% of Albertans think the province has been treated unfairly by the rest of the country, in terms of energy and equalization policies. However, in the rest of the country, most people feel Alberta has been treated fairly, including almost two-thirds or more of those living east of Manitoba.
• This perception is closely linked to partisanship. Most Liberal and NDP voters feel Alberta is treated fairly, while two out of three Conservative voters say Albertans have been treated unfairly.
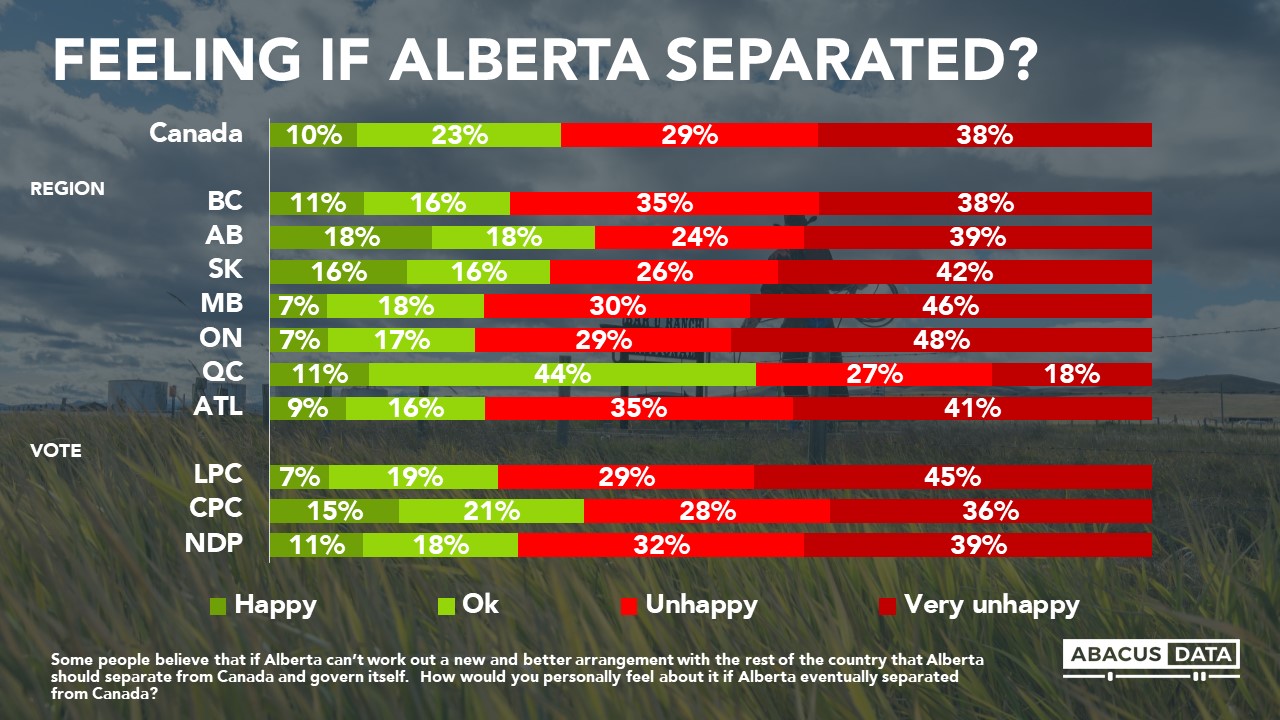
• Frustration and feelings about fair treatment are widespread in Alberta, but at this point, most reject the idea of separating from Canada. While 75% of Albertans say the province has been treated fairly, just 18% say they would be happy if the province separated. Another 18% said they would be “ok” with that outcome. 24% would be unhappy and 39% very unhappy.
• In the rest of the country, substantial majorities would be unhappy if Alberta were to separate, except in Quebec. Among those in Quebec, 11% would be happy to see Alberta exit, and another 44% said they would be ok with that outcome, while 45% would be unhappy.
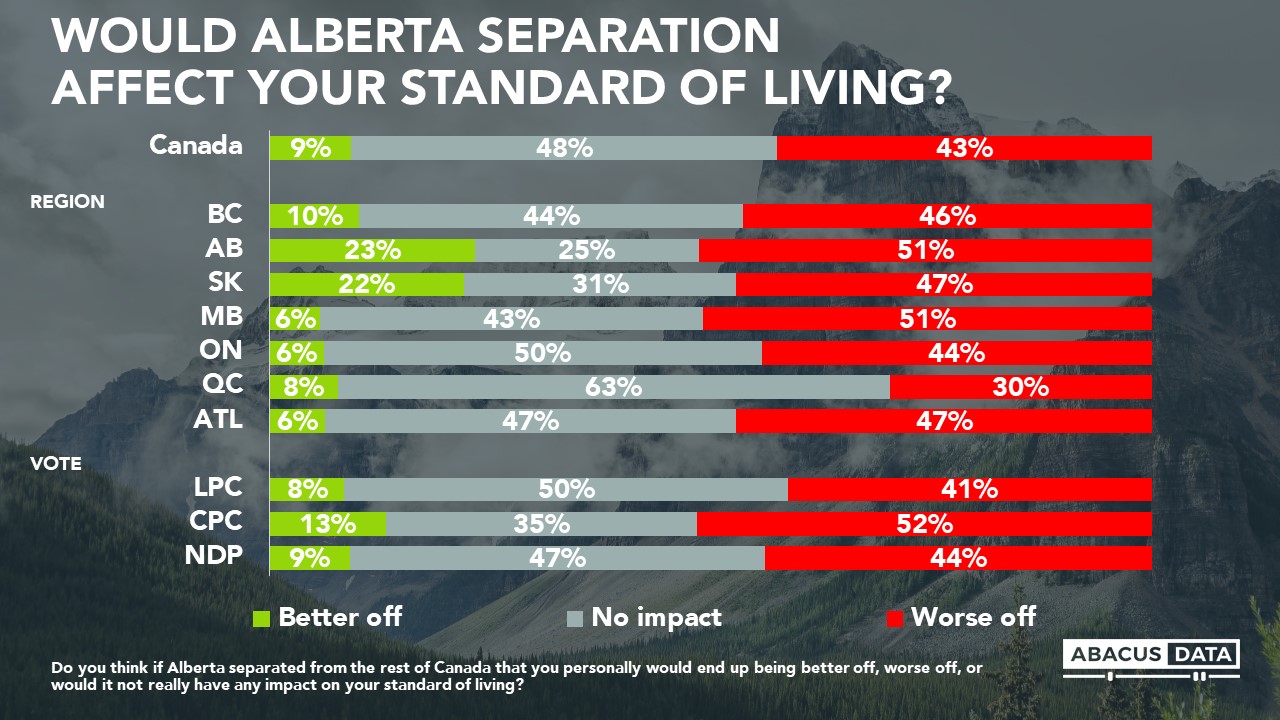
• While some who call for Alberta to exit the federation argues Albertans would be better off outside than inside Canada, Albertans generally do not agree. Only 23% of Albertans think their standard of living would improve; twice as many think it would suffer.
• In the rest of the country, roughly 40% think their standard of living would suffer if Alberta left, except in Quebec, where only 30% feel that way.
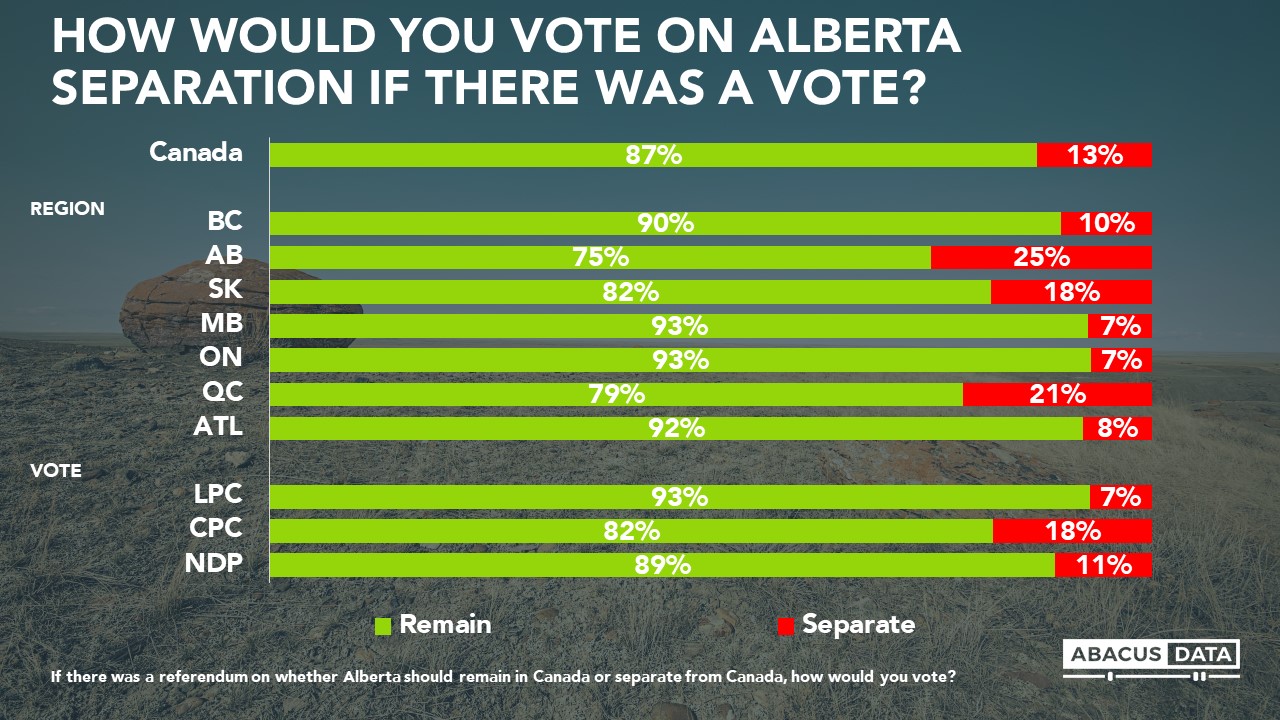
HOW WOULD YOU VOTE: ALBERTA SHOULD LEAVE OR REMAIN?
If Canadians were to vote on whether Alberta should stay or leave, 87% in the rest of the country would want Alberta to stay, from a high of 93% in Ontario to a low of 79% in Quebec.
In Alberta, 25% would vote to leave. Greater support for separation is found among the province’s UCP supporters (39%) and Alberta’s federal Conservative voters (37%). Alberta New Democrats show only 11% support for separation.
UPSHOT
According to Bruce Anderson: “The conversation about how Alberta has been treated is polarizing. Most in Alberta think they are treated badly, but the rest of the country is not convinced at this point. Right now, Alberta separatism has a range of 25% to 36% support, assuming that people who say they are ok with that outcome remained of that view. Alberta separatists are convinced the province would be better off – but other people in the province think their standard of living would decline.
The risks of greater polarization are clear. The skirmishing between BQ leader Blanchet and Alberta Premier Kenney belies a gulf in sentiment between Quebecers and Albertans over oil, pipelines and climate change.
Quebecers seem unlikely to support more pipelines or to soften concern about climate change based on Mr. Kenney telling them they depend on Alberta’s generosity, or even in the face of the risk of Alberta separatism.
Albertans are likely to be more angered at Mr. Blanchet’s shrugging off the fiscal and energy contributions Alberta has made, and the challenges that the province’s oil patch is facing today.
To bridge the divide, a thoughtful debate about the economic contribution of Alberta or the math of equalization will provide only part of a solution. Many (including many in Alberta) also will want to know that Alberta under Mr. Kenney’s leadership recognizes a global desire to shift to lower-carbon forms of energy and fight climate change, and has ideas to bring to that conversation.
Our research has shown for several years that Canadians – including Albertans – believe it essential to have a plan for economic success in a world where oil use begins to decline and where renewable energy sources become more economical and widespread.”
According to David Coletto: “National unity is once again front and centre in our political debate. While most Canadians don’t feel that Alberta is being treated unfairly, there is a sizeable minority outside of Alberta who does, including among Liberal and NDP supporters.
The one in four Albertans who would vote to separate from Canada is in line with research we conducted earlier this year and has not materially increased since the federal election.
Politically, the data highlights the challenge facing the federal Conservative Party and the United Conservatives in Alberta. With a sizeable portion of their supporters favouring separation, the risk of alienating other voters and splitting the movement so soon after unity should not be understated.”
METHODOLOGY
Our survey was conducted online with 3,000 Canadians aged 18 and over from November 12 to 17, 2019. A random sample of panellists was invited to complete the survey from a set of partner panels based on the Lucid exchange platform. These partners are double opt-in survey panels, blended to manage out potential skews in the data from a single source.
The margin of error for a comparable probability-based random sample of the same size is +/- 1.79%, 19 times out of 20. The data were weighted according to census data to ensure that the sample matched Canada’s population according to age, gender, educational attainment, and region. Totals may not add up to 100 due to rounding.
ABOUT ABACUS DATA
We are the only research and strategy firm that helps organizations respond to the disruptive risks and opportunities in a world where demographics and technology are changing more quickly than ever.
We are an innovative, fast-growing public opinion and marketing research consultancy. We use the latest technology, sound science, and deep experience to generate top-flight research-based advice to our clients. We offer global research capacity with a strong focus on customer service, attention to detail and exceptional value.
We were one of the most accurate pollsters conducting research during the 2019 Canadian Election.
There’s been a lot of talk about whether the Conservative Party of Canada should stick with Andrew Scheer as its leader into the next election, whenever that will be. The Conservative Party will have a vote to decide whether to hold a leadership race this spring.
Here’s what our latest polling finds on the question:
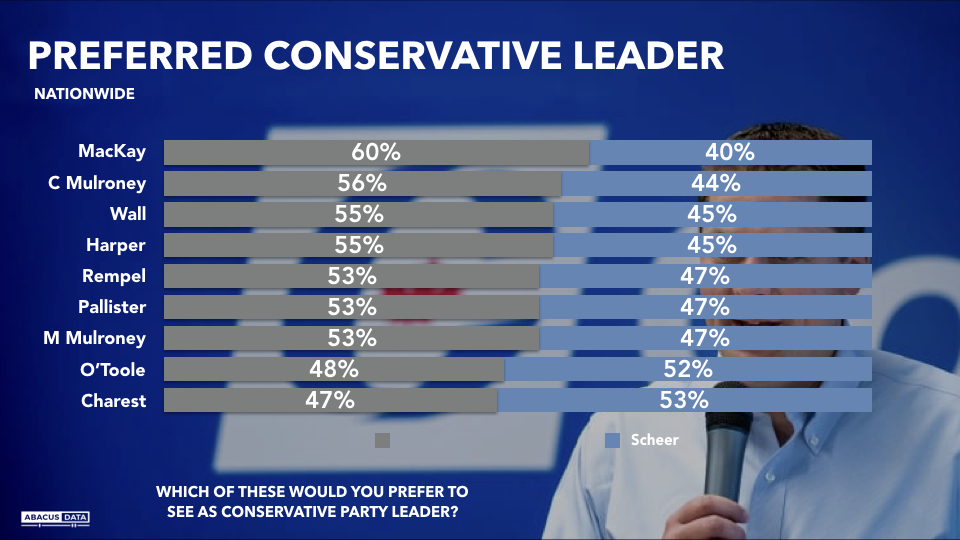
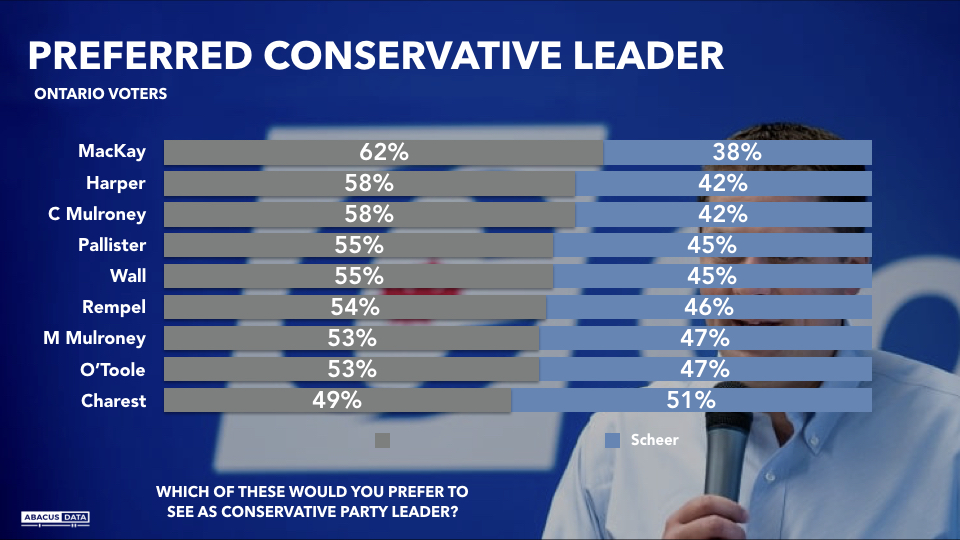
Of nine possible alternative leaders of the Conservative Party, Canadians prefer 7 of the 9 to Andrew Scheer. Five are 8 points or more ahead of Andrew Scheer, including two of Brian Mulroney’s children, Stephen Harper, Brian Pallister, Brad Wall and Peter MacKay. Across the country, 60% would prefer Peter MacKay to Mr. Scheer.
In Ontario, the province where Conservatives most fell short of their goals in the last election, 8 of the nine names have more support than Mr. Scheer. MacKay, Harper and Caroline Mulroney have the largest advantage over Mr. Scheer.
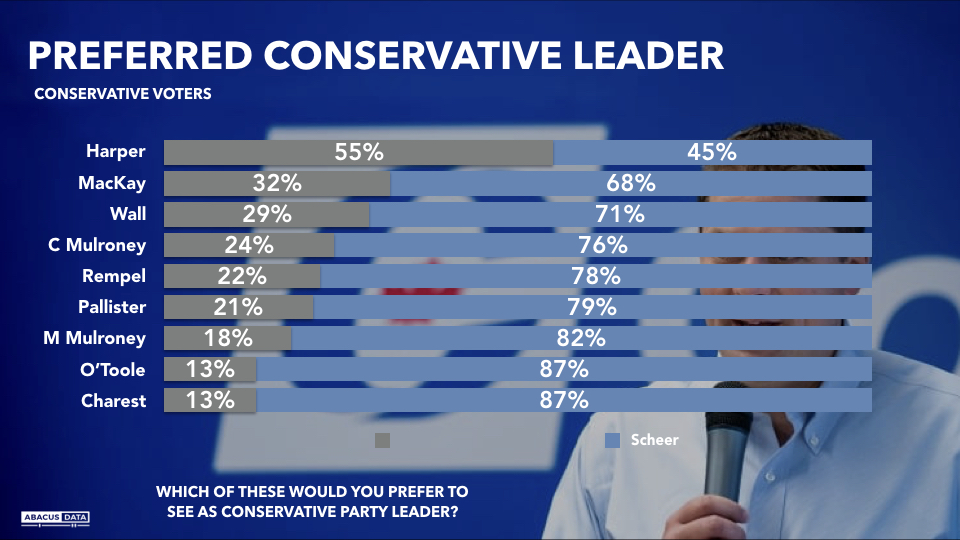
However, the choice of leader will ultimately reflect the preferences of Conservative Party members. Among Conservative voters, Mr. Scheer is preferred to eight of the nine names, the only exception being Stephen Harper. However, his lead over MacKay, Wall, Caroline Mulroney, and Brian Pallister may not be as large as incumbents might hope for or expect.
UPSHOT
According to Bruce Anderson: “Public comments from leading Conservatives reveal that there’s obviously some restiveness in the Conservative Party today. To some extent, this reflects a belief that the party could have formed a government and fell short of that goal. But there are different factions within the conservative movement in Canada, some reflecting conservative social values, some western alienation, some a pro-oil perspective, while others want a party that embraces climate action and a broad inclusive value system. Leadership tensions can be a surrogate for these schisms, beyond whether Andrew Scheer campaigned as well as people hoped for. The Conservative leader may find it necessary to make clear choices and stake out some ground – hoping for incumbency to protect him may prove riskier.”
According to David Coletto: “Our test of potential alternatives to Mr. Scheer finds none, except for Mr. Harper, are preferred over Mr. Scheer among those who voted Conservative in the last election. This should give him some comfort, especially since Conservative members will ultimately decide whether to initiate a leadership election.
But beyond the Conservative universe, Scheer’s performance against Mr. MacKay, Ms. Mulroney, or Mr. Wall should give Conservatives some pause to reflect on why Mr. Scheer failed to break-through and whether it is a question of leadership, tone, or party positioning.”
METHODOLOGY
Our survey was conducted online with 3,000 Canadians aged 18 and over from November 12 to 17, 2019. A random sample of panellists was invited to complete the survey from a set of partner panels based on the Lucid exchange platform. These partners are double opt-in survey panels, blended to manage out potential skews in the data from a single source.
The margin of error for a comparable probability-based random sample of the same size is +/- 1.79%, 19 times out of 20. The data were weighted according to census data to ensure that the sample matched Canada’s population according to age, gender, educational attainment, and region. Totals may not add up to 100 due to rounding.
ABOUT ABACUS DATA
We are the only research and strategy firm that helps organizations respond to the disruptive risks and opportunities in a world where demographics and technology are changing more quickly than ever.
We are an innovative, fast-growing public opinion and marketing research consultancy. We use the latest technology, sound science, and deep experience to generate top-flight research-based advice to our clients. We offer global research capacity with a strong focus on customer service, attention to detail and exceptional value.
We were one of the most accurate pollsters conducting research during the 2019 Canadian Election.