Softening of Trudeau government approval concentrated in Alberta and Ontario
December 21, 2016

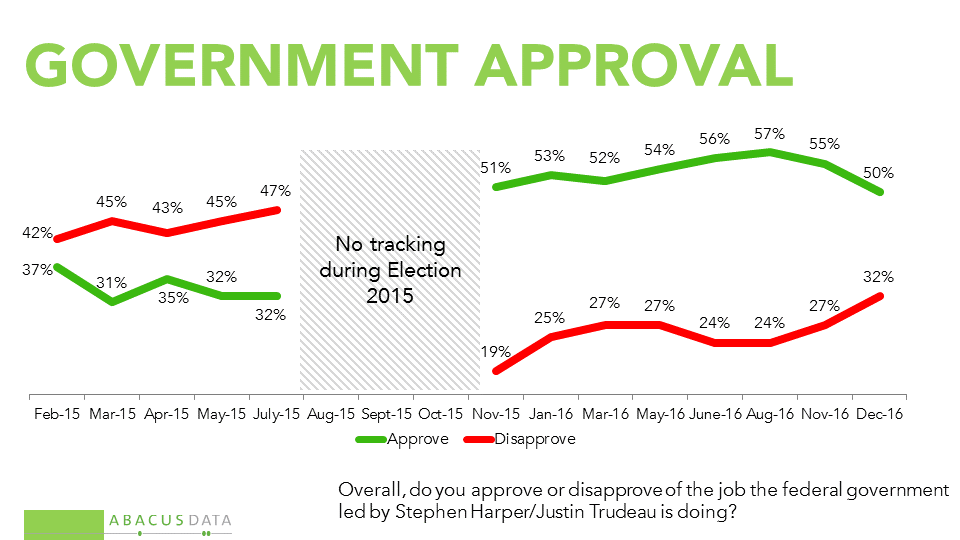
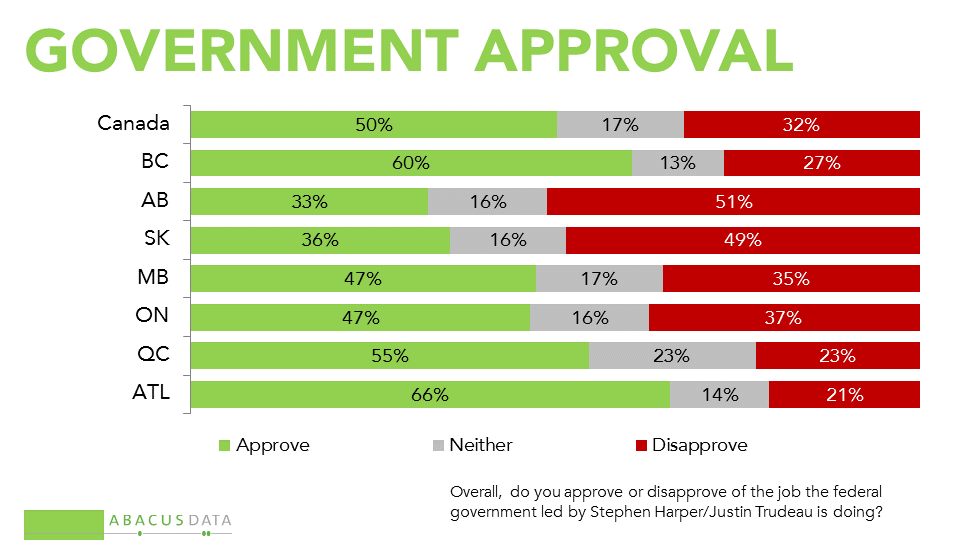
As 2016 winds down, approval of the performance of the Trudeau government sagged a bit to 50%, in line with the numbers achieved at this point last year, but down from the levels seen earlier in the year. 32% disapprove of how the government is doing.
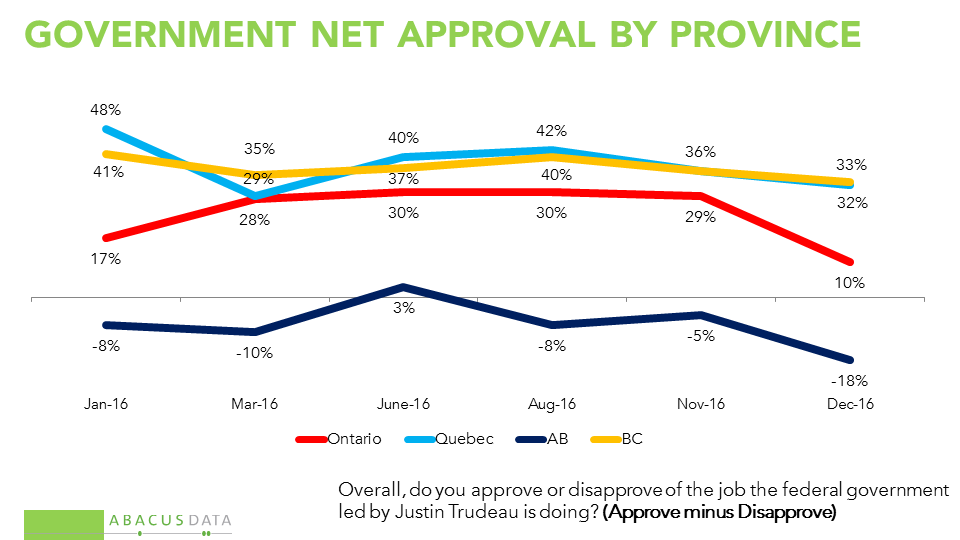
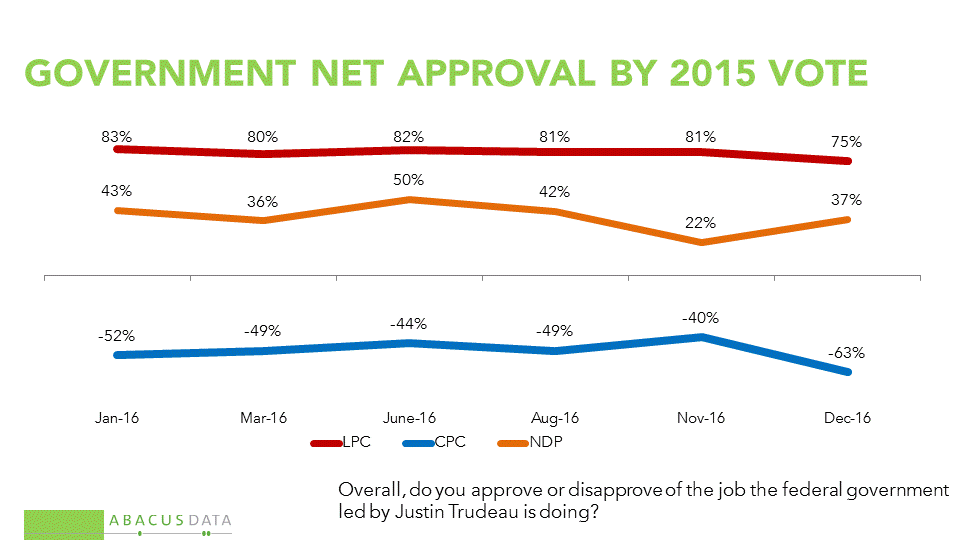
The sliding approval rating is largely attributable to opinion shifts in Ontario and Alberta, and among Conservative voters. Liberal and NDP voters remain about as satisfied as they have been with the performance of Mr. Trudeau’s government. Quebec and BC show considerably less fluctuation.

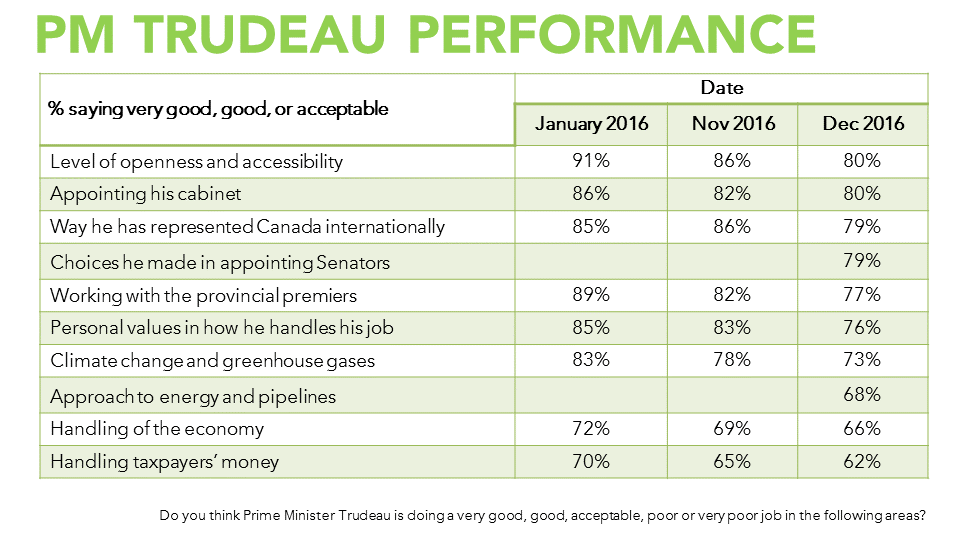
When asked to rate the performance of Prime Minister Trudeau on a range of policy files, the results show:
• All 8 items that we track back to January show some deterioration in approval levels.
• The worst rated item (handling taxpayers money) still found a majority (62%) saying that they find the performance of the government “acceptable” or better.
• On 6 of the 10 items measured more than 3 in 4 voters said the Prime Minister was doing an acceptable or better job.
• The top-rated items were for Mr. Trudeau’s openness and acceptability, his cabinet choices, his appointments to the Senate, the way he has represented Canada internationally, the way he works with the provinces and his personal values.
• Two out of three (68%) deem acceptable or better the PM’s approach to energy and pipelines and almost 3 out of 4 (73%) say the same thing about the government’s approach to climate change and greenhouse gases.
Some regional differences worth nothing:
• Albertans are 19 points more likely than average to give Ottawa poor marks on climate change and greenhouse gases.
• Albertans are 15 points more likely than average to give Ottawa poor marks on energy and pipelines.
• On handling the economy, at least six in ten give Trudeau passing marks in every part of the country except for Alberta (44%) and Saskatchewan (51%).
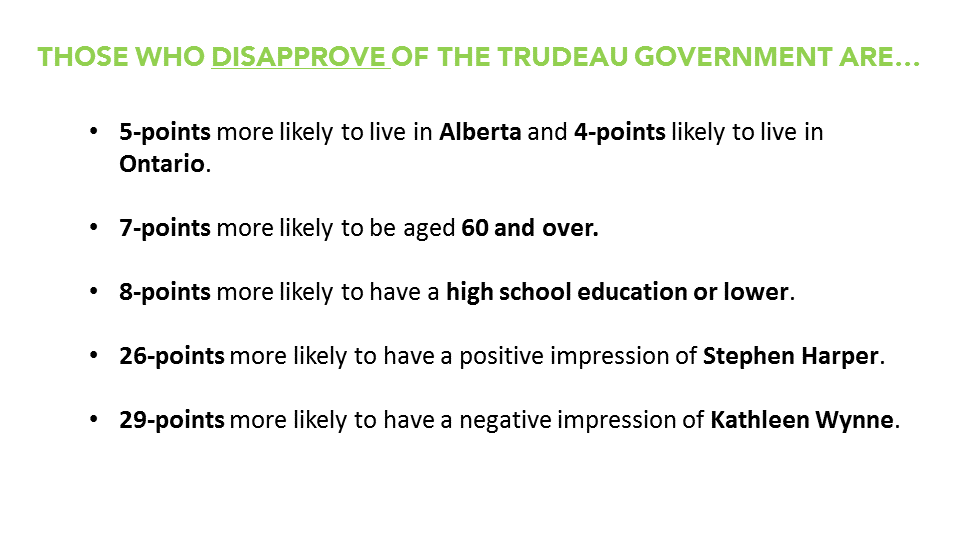
Of the people who disapprove of the Trudeau government at year end, here’s what else we know:
• 60% voted Conservative in 2015, 15% voted NDP, and 9% voted Liberal.
• They are 7-points more likely to be 60 or older, and 7 points more likely to have a high school or lower education.
• They are more concentrated in Alberta (15% vs 10% of the population) and Ontario (42% vs 38%).
• Of those living in Ontario, 96% have a negative impression of Ontario Premier Kathleen Wynne, 29-points higher than all Ontarians we surveyed.
• 53% have a positive impression of Stephen Harper, 26-points higher than average.
• 31% have a positive impression of Kevin O’Leary and 9% have a positive impression of Kellie Leitch (56% did not know enough about her to have an opinion).
When it comes to their reaction to various decisions or events related to the Trudeau government:
• Trans Mountain approval – 25% say the decision made them feel better about Trudeau government, 18% say it made them feel worse.
• They were 22 points more upset with the Northern Gateway pipeline rejection – 42% said that decision made them feel worse about the government.
• They are 29 points more upset with Liberal fundraising – 56% say it made them feel worse about the government.
• They are 29 points more upset with Mr. Trudeau’s statement on Castro’s death – 59% say it made them feel worse about the government. 29-points higher than average.
• They were 17 points more upset with the Mydemocracy.ca online consultation – 31% say it made them feel worse about the government
According to Bruce Anderson:
“An in-depth examination of what’s underneath the surface of these trends makes it clear that the headwinds experienced by the Trudeau government are mostly linked to unhappiness on the right side of the spectrum, in Alberta and in Ontario. Kathleen Wynne is a point of friction for swing voters in Ontario, and her current standing in the public opinion appears to be affecting the Liberal brand at a national level.
In Alberta, Mr. Trudeau’s standing is affected by an economy still reeling from oil price declines. His climate change policy mix has hardened the view of Alberta conservatives towards his government, something only partly mitigated by his approval of 2 of 3 pipeline proposals.
While political conditions at the end of the fall are not as favourable for the government as they were earlier in the year, they remain relatively robust. In terms of the dynamics that carry the greatest potential political consequences, continued good results in Quebec and BC will be welcome news for the government, while the political fortunes of Premier Wynne will be a factor to watch closely. “
According to David Coletto:
“Canadians remain quite satisfied with the performance of the federal government generally and the Prime Minister specifically. Although assessments of its performance have weakened, those who disapprove are disproportionately Conservative voters living in Alberta and Conservative-leaning Ontarians who are very displeased with Kathleen Wynne and the Ontario Liberal government.
What we see then is a trend towards polarization by ideology. Those on the left and centre of the political spectrum still hold the Trudeau government in high regard. Over 80% of those who voted for Mr. Trudeau and the Liberals and most NDP voters approve of the government’s job performance.
Those on the right, who voted Conservative in 2015, have become consolidated in opposition to the government. Our earlier survey showed that they were most likely to react negatively to news about Liberal fundraising and the PM’s statement on Castro’s death.
But as long as the government keeps centrist and progressive voters happy, it will continue to command strong approval numbers as we have seen throughout its first year in office.”
METHODOLOGY
Our survey was conducted online with 1,848 Canadians aged 18 and over from December 12 to 14, 2016. A random sample of panelists was invited to complete the survey from a large representative panel of over 500,000 Canadians.
The Marketing Research and Intelligence Association policy limits statements about margins of sampling error for most online surveys. The margin of error for a comparable probability-based random sample of 1,848 is +/- 2.3%, 19 times out of 20.
The data were weighted according to census data to ensure that the sample matched Canada’s population according to age, gender, educational attainment, and region. Totals may not add up to 100 due to rounding.
ABACUS DATA INC.
We offer global research capacity with a strong focus on customer service, attention to detail and value-added insight. Our team combines the experience of our Chairman Bruce Anderson, one of Canada’s leading research executives for two decades, with the energy, creativity and research expertise of CEO David Coletto, Ph.D.