For over five weeks now, Canadians have been told to #StayHome and physically distance themselves from others because of the COVID-19 pandemic. So much of how they live, work, learn, and play has been upended, altered, and disrupted.
Earlier this week, my spouse and I were talking about how surreal this has all been and how different the experience would be had the pandemic happened ten years ago. We both agreed that these past six weeks would have been far more isolating and challenging because it would be harder to connect with family, more challenging to work remotely and almost impossible to get food, household goods, or anything really, delivered to our homes. Moreover, could our internet networks even handle today’s demand five years ago?
This week Abacus Data conducted a national public opinion survey commissioned by Shaw Communications to explore how Canadians are using the internet during the COVID-19 pandemic.
Here is what we found:
DEMAND FOR CONNECTIVITY SOARS: 7 IN 10 CANADIANS REPORT USING THE INTERNET MORE NOW THAN BEFORE THE PANDEMIC WITH 41% REPORTING 3 HOURS OR MORE OF SCREEN TIME DAILY.
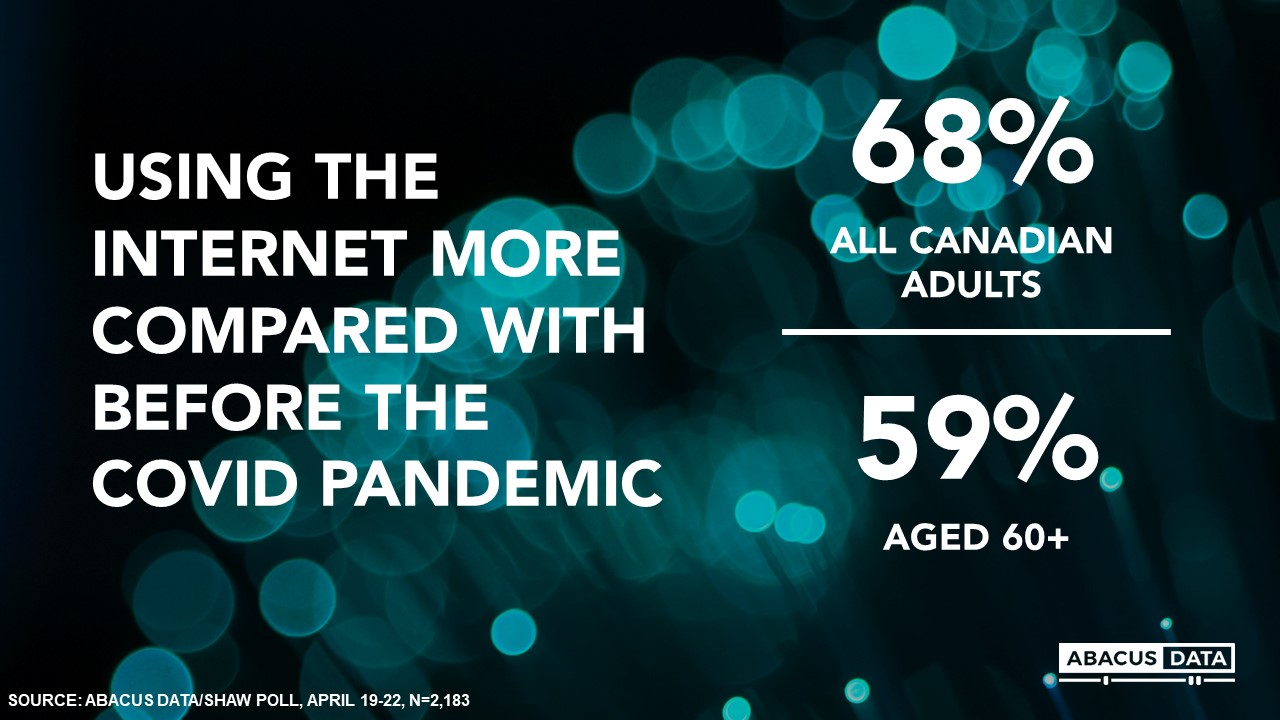
While Canadians are driving, going out, and physically seeing family and friends less than usual, most report using the internet more during the pandemic than before. 68% reporting using the internet more, including 27% (about 8.1 million), who say they are using it much more than usual.
Increased internet use crosses all demographic, regional, and socio-economic groups, including: • 80% of those aged 18 to 29 and 59% of those aged 60 and older • 71% of women and 64% of men • 74% of university students and 80% of college students • 81% of those working at home or attending school remotely
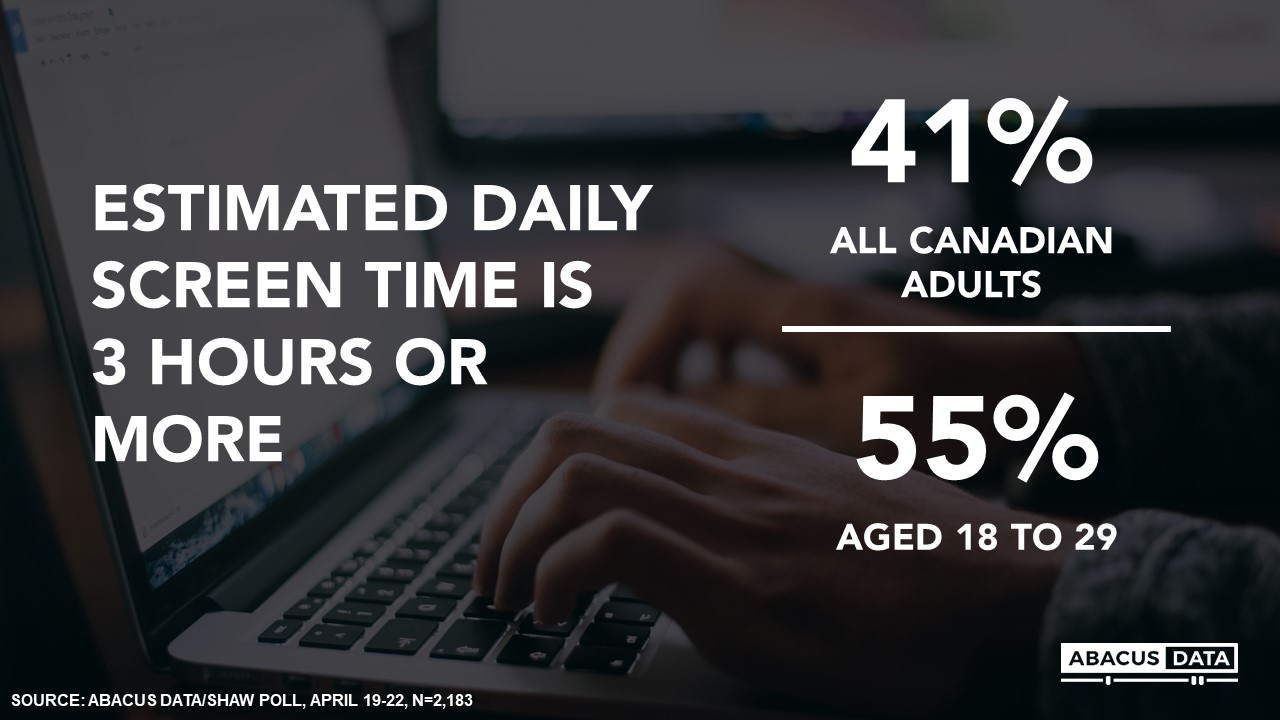
The increased internet use has meant that 41% of Canadians, including 55% of those aged 18 to 29 are spending 3 hours or more consuming content through or interacting with a screen.
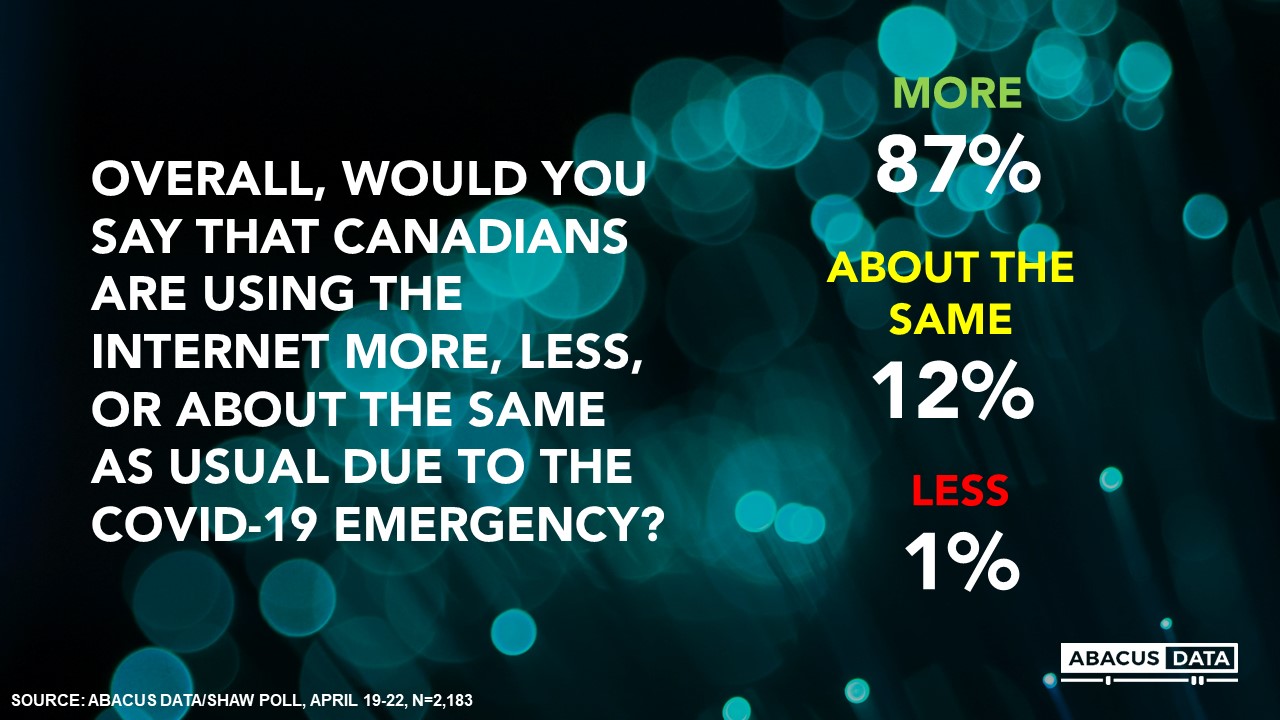
At the same time, 84% of Canadians believe that other Canadians are using the internet more than usual due to the COVID-19 pandemic. There is a broad recognition that the internet is being used more and playing a more central role in Canadians’ lives than it did before.
WHAT CANADIANS DID ONLINE THIS PAST WEEKEND?
This past weekend, millions of Canadians were using the internet to watch movies, connect with family and friends, pray, and stay in shape.
We asked how often, if at all, respondents used the internet to do several activities this past weekend.
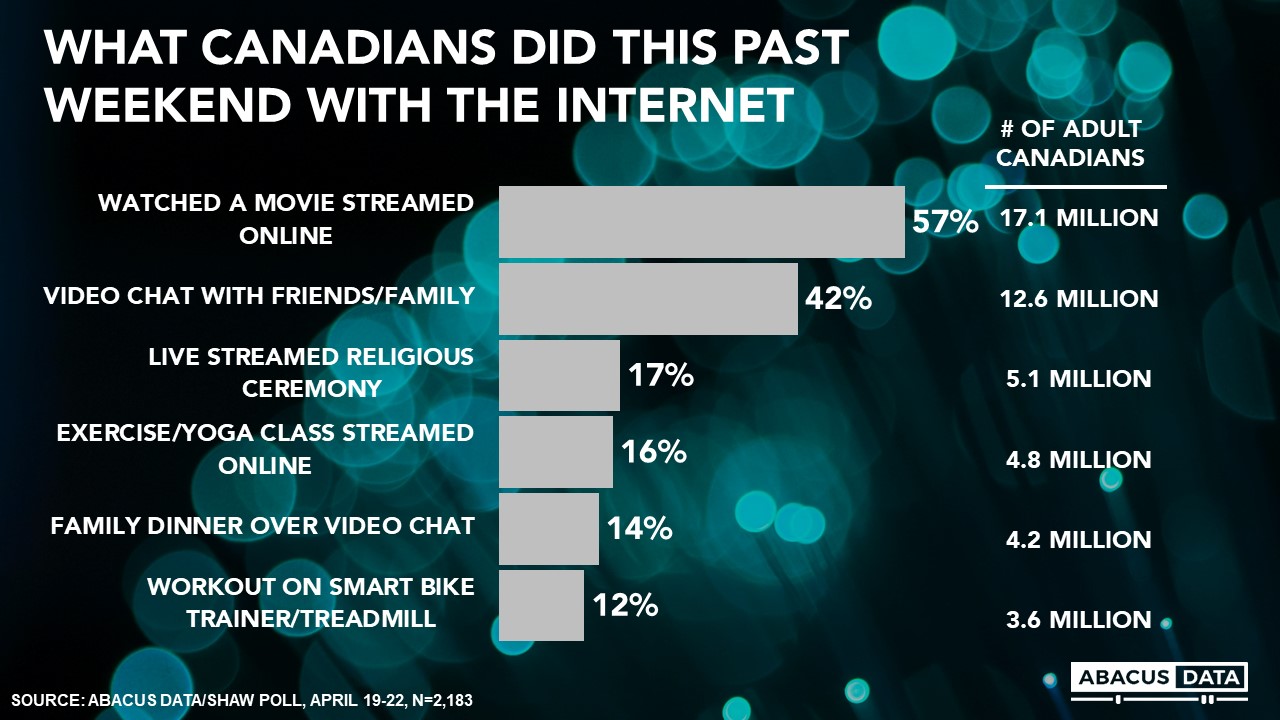
57% or about 17.1 million said they watched a movie streamed online. 42% or 12.6 million connected with friends or family over a video chat. 5.1 million or 17% watched a religious ceremony over a live stream while 14% gathered together with family and had dinner over a video chat.
Millions of Canadians were also staying active using the internet. 16% reported doing an exercise or yoga class streamed online while 12% or 3.6 million did a workout on a smart bike trainer or treadmill.
CANADIANS ARE STAYING IN TOUCH, LEARNING, PLAYING, AND WORKING WITH THE INTERNET
The internet is being used by most Canadians to stay informed about the pandemic (76%), to check in with family and friends (77%), and to socialize with friends. 27% report using the internet to hold virtual parties with friends regularly or occasionally.
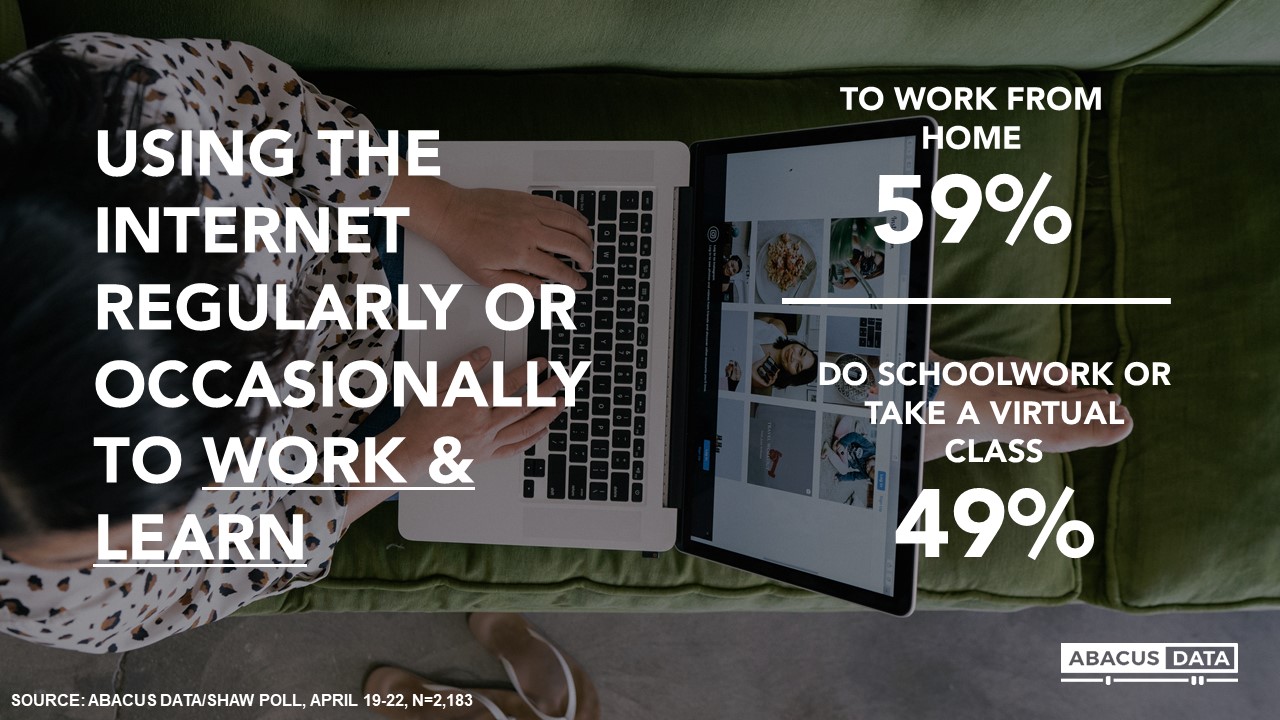
For those who can work and learn remotely, the internet enables them to stay connected and be productive. 59% of Canadians report using the internet to work from home, 49% are doing schoolwork or learning using virtual classes or courses.
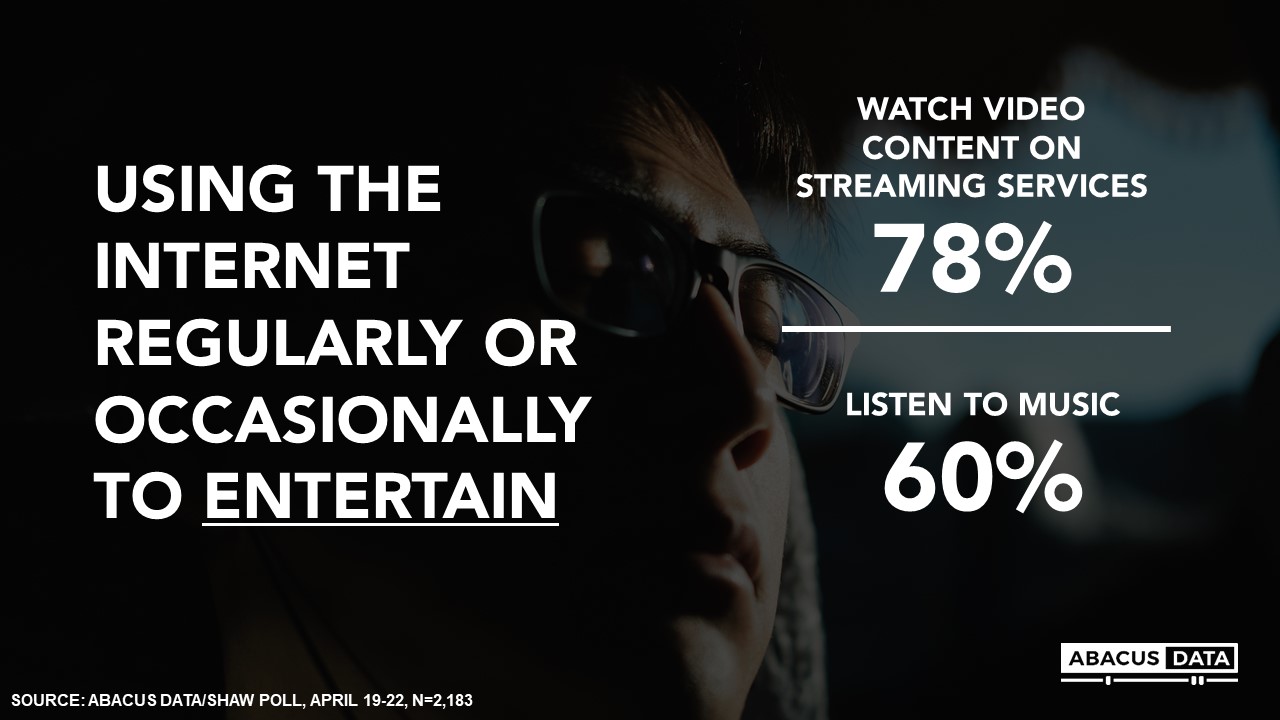
Millions are also using the internet to watch or listen to videos or music. 78% reporting using the internet to watch videos regularly or occasionally while over half (60%) are listening to music over the internet at least sometimes.
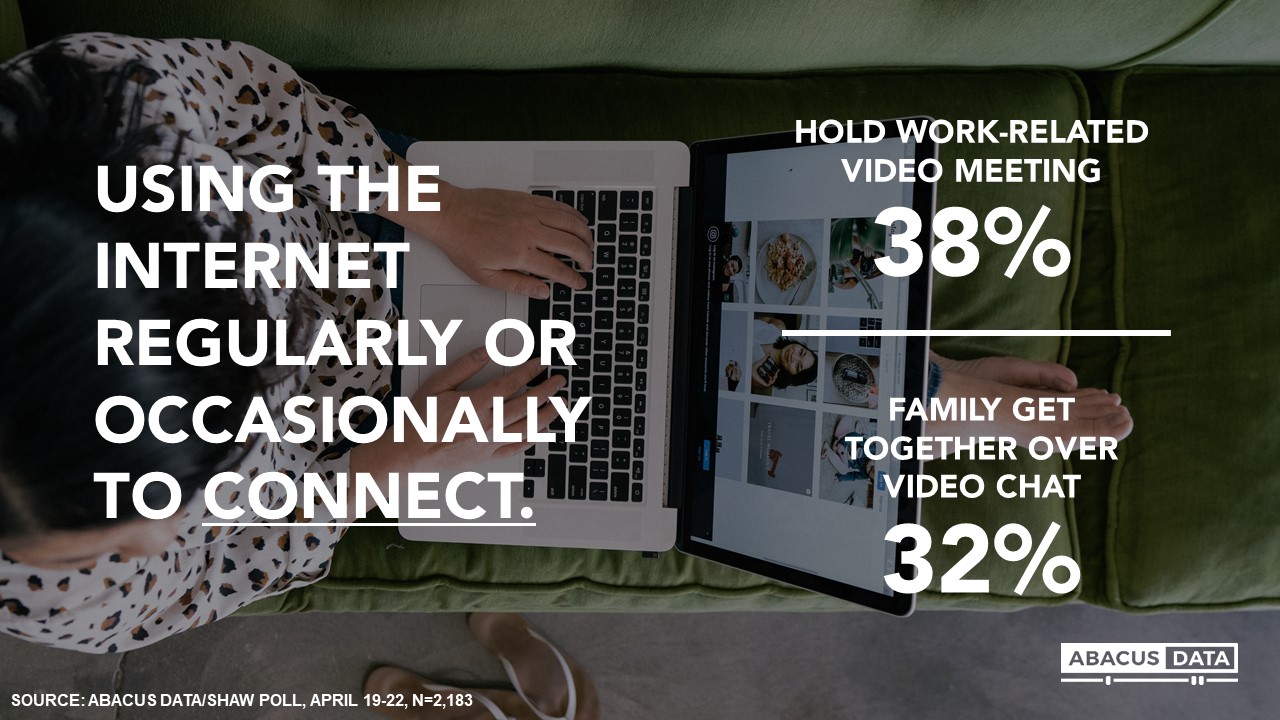
Video chats are also helping us to stay connected with family, workmates, and clients. 38% of Canadians are using the internet to hold work-related video meetings regularly or occasionally, while 32% are holding family get-togethers by video chat.
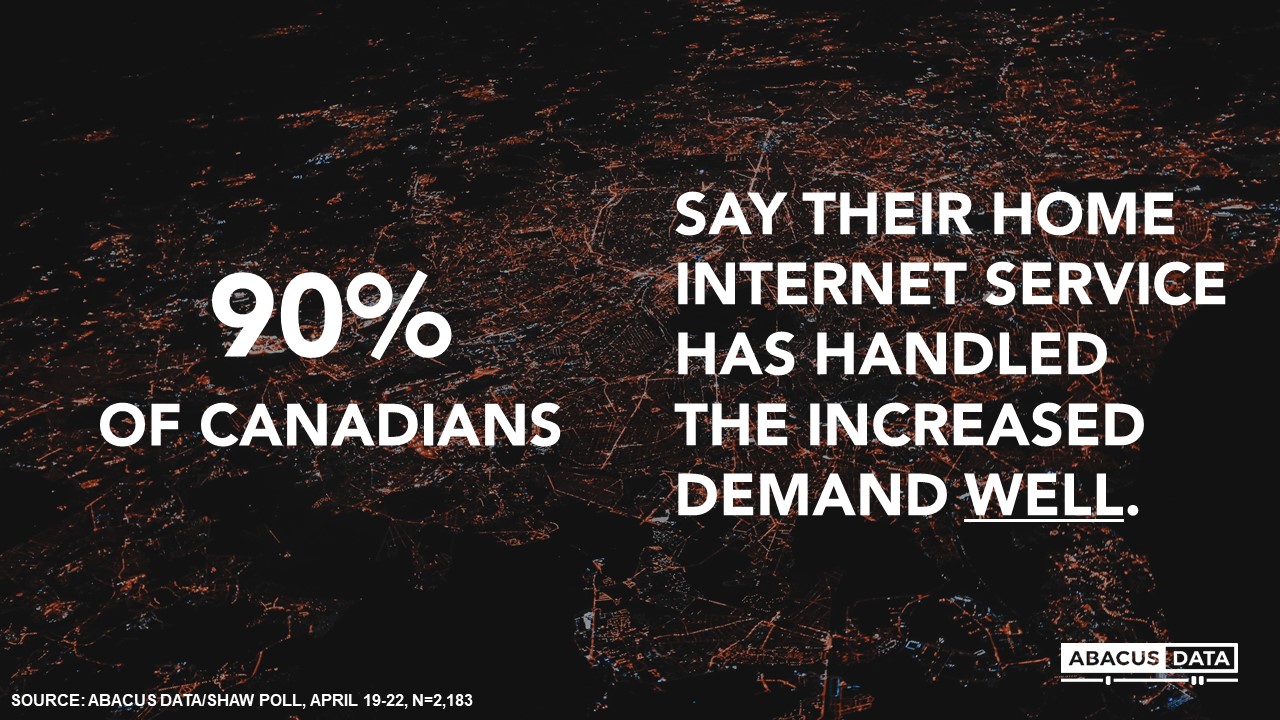
90% SAY THEIR HOME INTERNET NETWORK HAS HANDLED THE INCREASED DEMAND WELL.
Despite the substantial increase in internet use during the pandemic, 9 in 10 Canadian home internet customers say their home internet service has handled the increased demand well, with only 10% having negative perceptions about the performance of their networks.
Perceptions are relatively consistent across the country, with 89% in Western Canada, 87% in Ontario, 94% in Quebec, and 92% in Atlantic Canada reporting that their home internet service has handled the increased demand well.
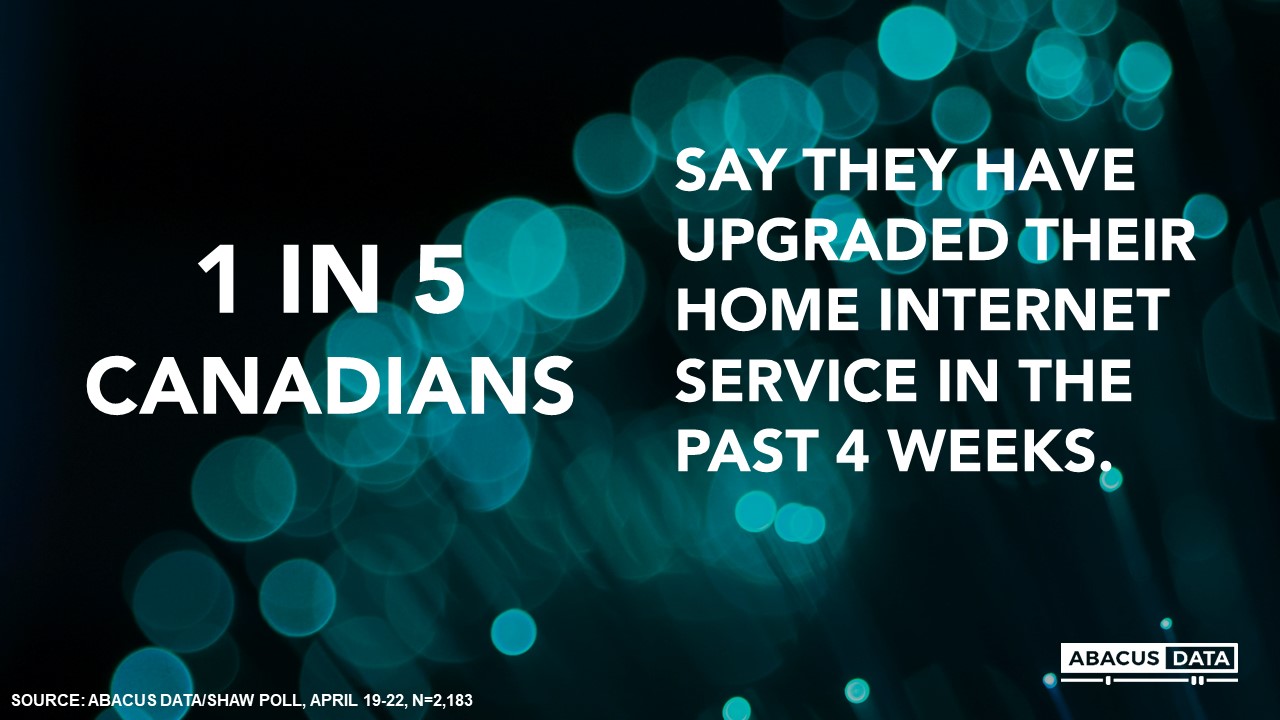
1 IN 5 HOME INTERNET SERVICE SUBSCRIBERS HAVE UPGRADED THEIR INTERNET SERVICE
The pandemic and its impact on internet use have also caused 1 in 5 Canadians to upgrade their home internet service over the past four weeks. Upgrading was consistent across Canada (18% in Western Canada, 21% in Ontario, 18% in Quebec, and 16% in Atlantic Canada).
Those under the age of 45 were more likely to upgrade their home internet service (27%) than those aged 45 and over (12%).
UPSHOT
The COVID-19 pandemic has caused widespread worry, anxiety, and loneliness for millions of Canadians who are stuck at home and isolated from their loved ones and usual activities.
But a high-speed internet connection has meant that millions have been able to keep working, learning, and connecting with those important in their lives. Many Canadians are doing things they wouldn’t usually be doing because of their home internet connection. It has also allowed governments, businesses, and non-profits to rapidly create seamless tools and applications for Canadians to apply for emergency aid programs, set up e-commerce businesses, and raise money for worthy causes.
Many are finding comfort and focus by streaming music through their homes. Millions are breaking bread with family and friends over a video chat. Small business owners are staying connected with their clients through video conferencing or selling their products or services through e-commerce platforms managed from their homes.
While a screen cannot replace the feeling of connecting and socializing in person, it has helped Canadians cope, react, and respond to the unprecedented challenge created by the COVID-19 outbreak. Millions are using the internet more today than ever before.
And almost all Canadians believe that their home internet connection has managed the extra demand on the network well, and millions have upgraded their service in response to the new demand they are putting on their home networks.
For video interviews by Skype or Zoom or audio interviews, please contact David at 613-884-4730 or david@abacusdata.ca
METHODOLOGY
Our survey was conducted online with 2,183 Canadians aged 18 and over from April 19 to 22, 2020. A random sample of panellists was invited to complete the survey from a set of partner panels based on the Lucid exchange platform. These partners are double opt-in survey panels, blended to manage out potential skews in the data from a single source.
The margin of error for a comparable probability-based random sample of the same size is +/- 2.3%, 19 times out of 20. The data were weighted according to census data to ensure that the sample matched Canada’s population according to age, gender, educational attainment, and region. Totals may not add up to 100 due to rounding.
ABOUT ABACUS DATA
We are the only research and strategy firm that helps organizations respond to the disruptive risks and opportunities in a world where demographics and technology are changing more quickly than ever.
We are an innovative, fast-growing public opinion and marketing research consultancy. We use the latest technology, sound science, and deep experience to generate top-flight research-based advice to our clients. We offer global research capacity with a strong focus on customer service, attention to detail and exceptional value.
We were one of the most accurate pollsters conducting research during the 2019 Canadian Election.
Abacus Data Bulletins are short analyses of public opinion data we collect. For more information or media interviews, contact David Coletto.
As COVID-19 causes mass disruption to the labour force, worried Canadians’ minds turn to the basic products they need to live out what may come to be a uniquely difficult period in their lives.
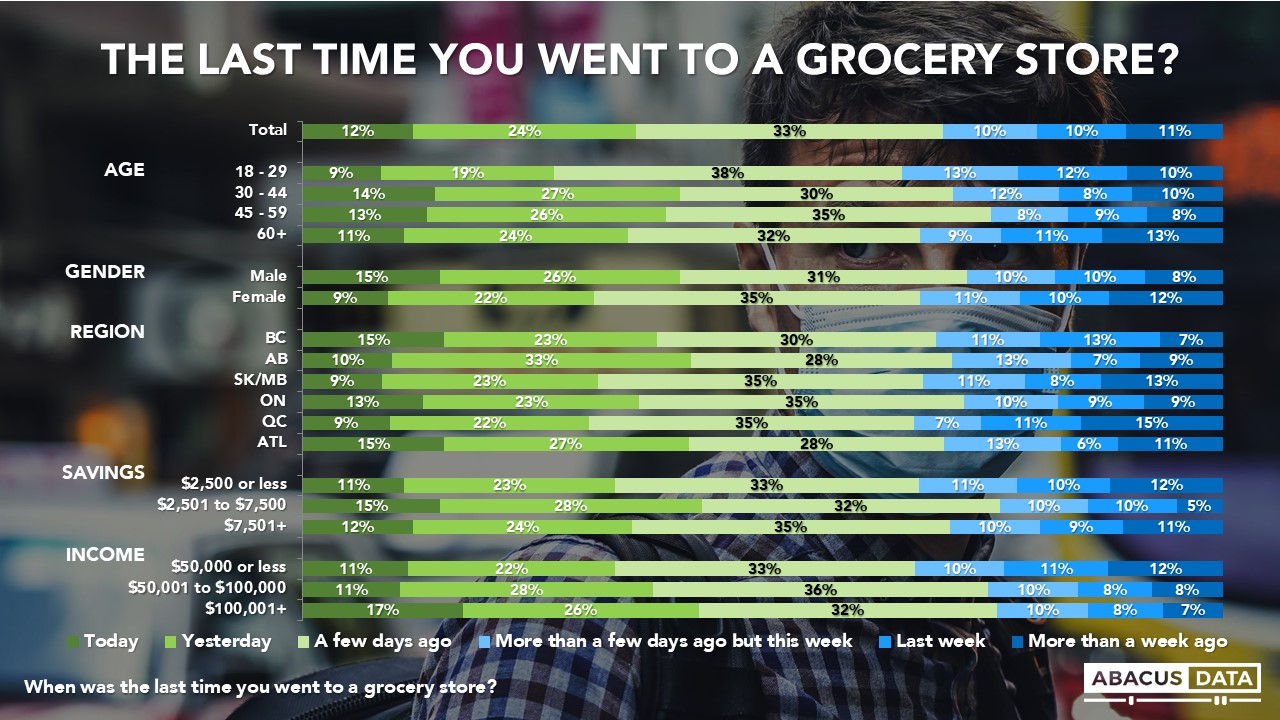
In the past week, families flocked to grocery stores as a result of the COVID-19 coverage. Few – 1 in 10 had not yet shopped while coverage of the crisis and signals from the government were significantly ramping up in severity. Those with financial capacity and higher incomes were more likely to go to others, but households across the country and income spectrum were busy preparing.
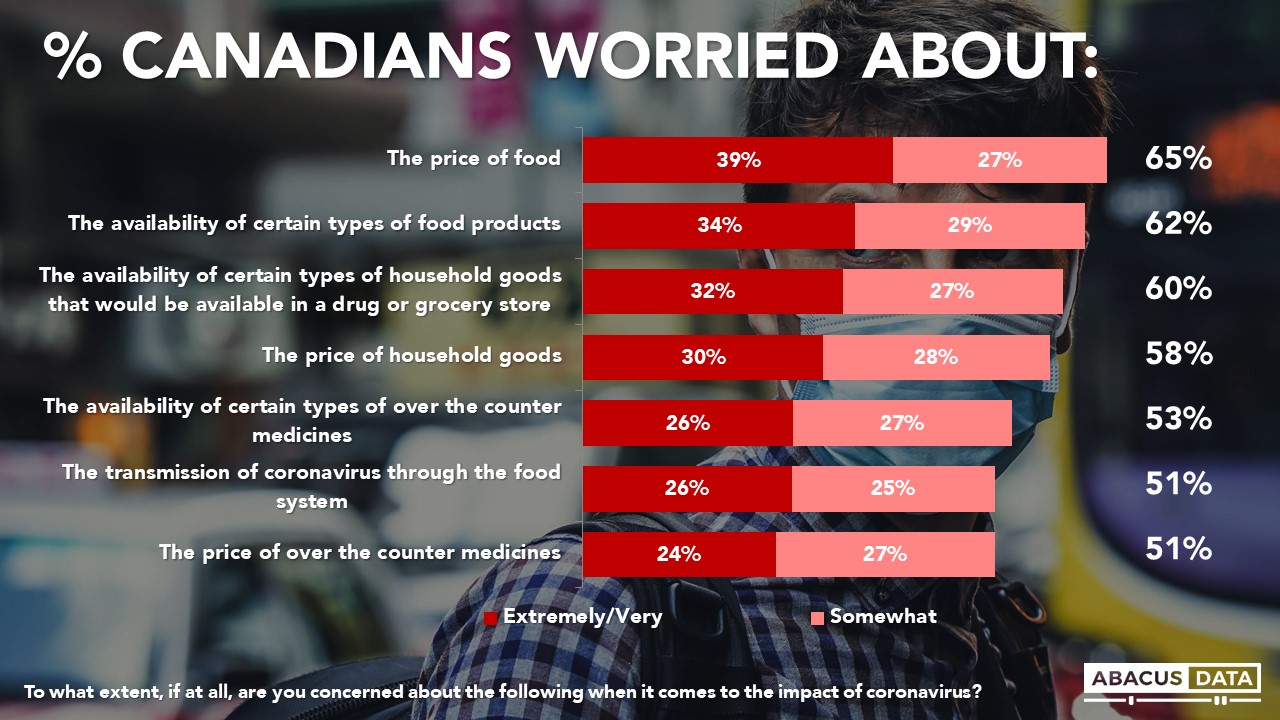
The affordability anxiety brought on by this crisis is not just driven by lost income, but also by the perceived impact of COVID-19 on the affordability of household necessities.
About 2 in 3 Canadians are concerned COVID-19 will impact the price of food and household goods – even higher among lower-income households.
Despite assurance from several levels of government that all is well with the supply chain, about 2 in 3 Canadians are concerned COVID-19 will impact the availability of food or household products.
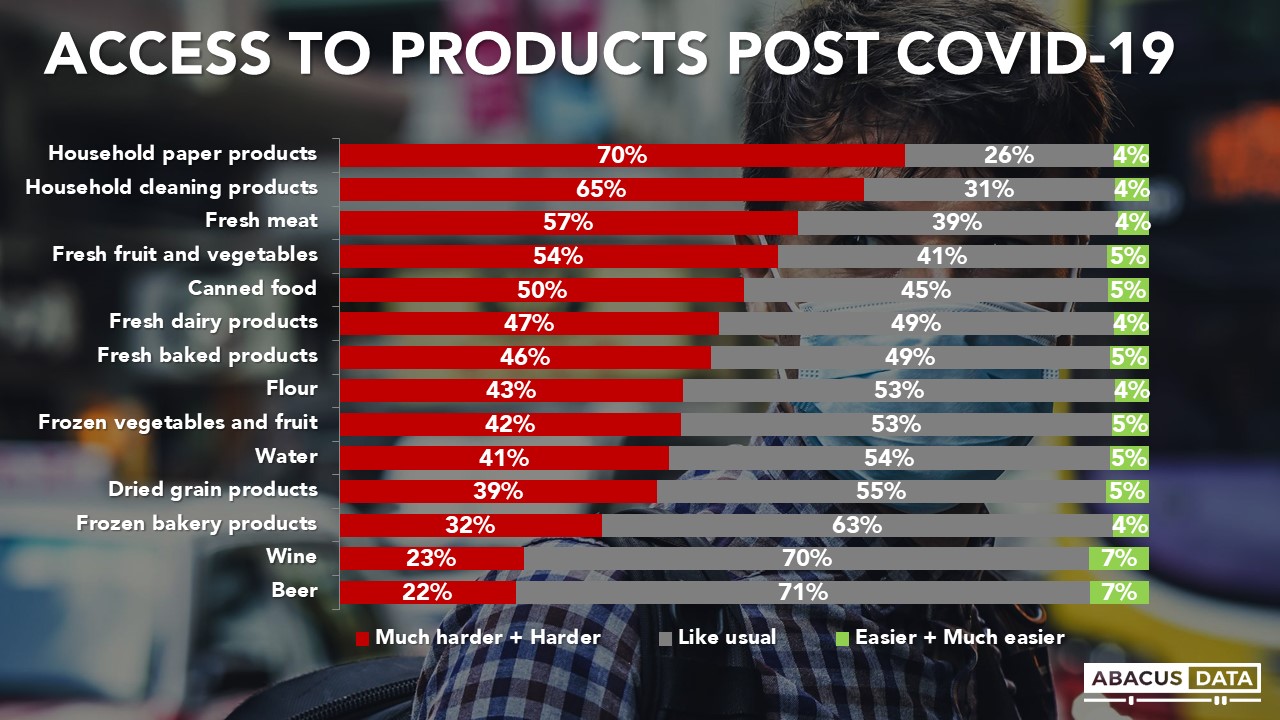
The anxiety is particularly acute with household paper and cleaning products, with around 7 in 10 believing they will be now harder to get.
Many Canadians worry about ease of access to fresh produce and meat as a result of COVID-19, while around half of Canadians are concerned about frozen and canned foods. Few are worried about beer or wine availability.
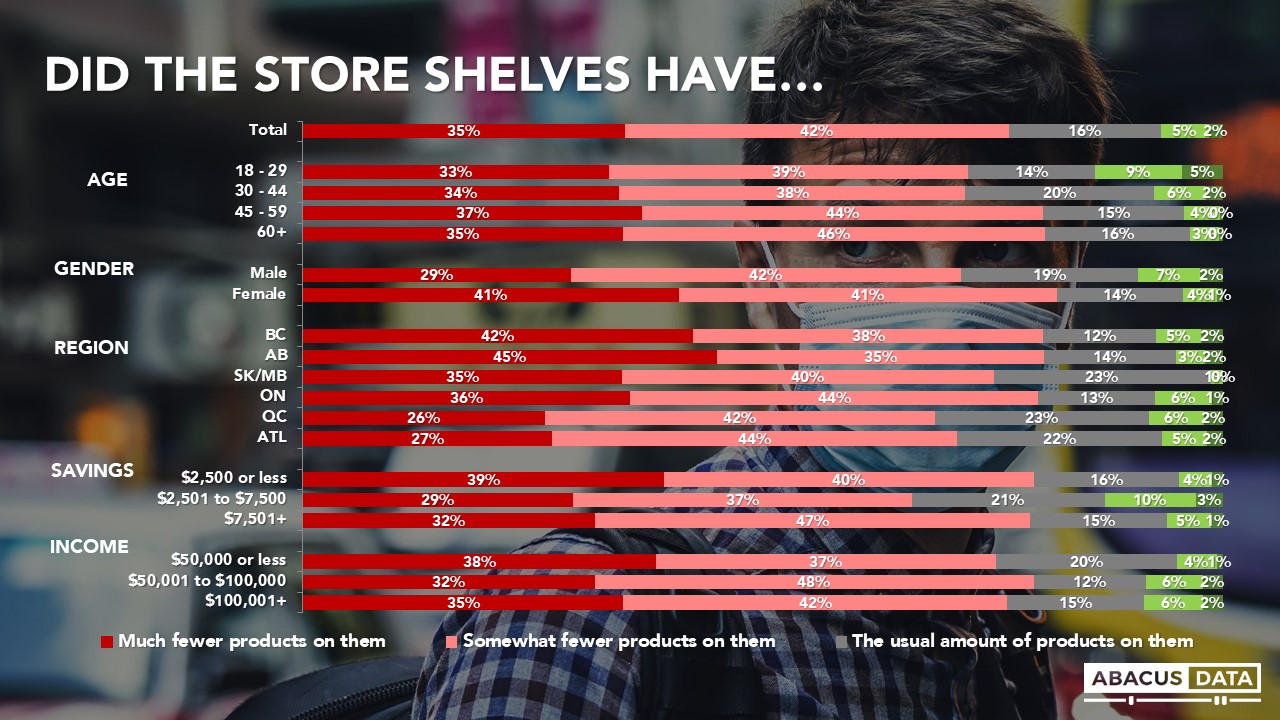
CANADIANS SEEING EMPTY SHELVES AND STOCKING UP
This concern is based on the experiences Canadians have going to stores and seeing empty shelves. 77% of Canadians say when they went for groceries, the shelves were emptier than usual. This has been particularly acute in Alberta and BC, where just under half of the shoppers noted much fewer products on shelves.
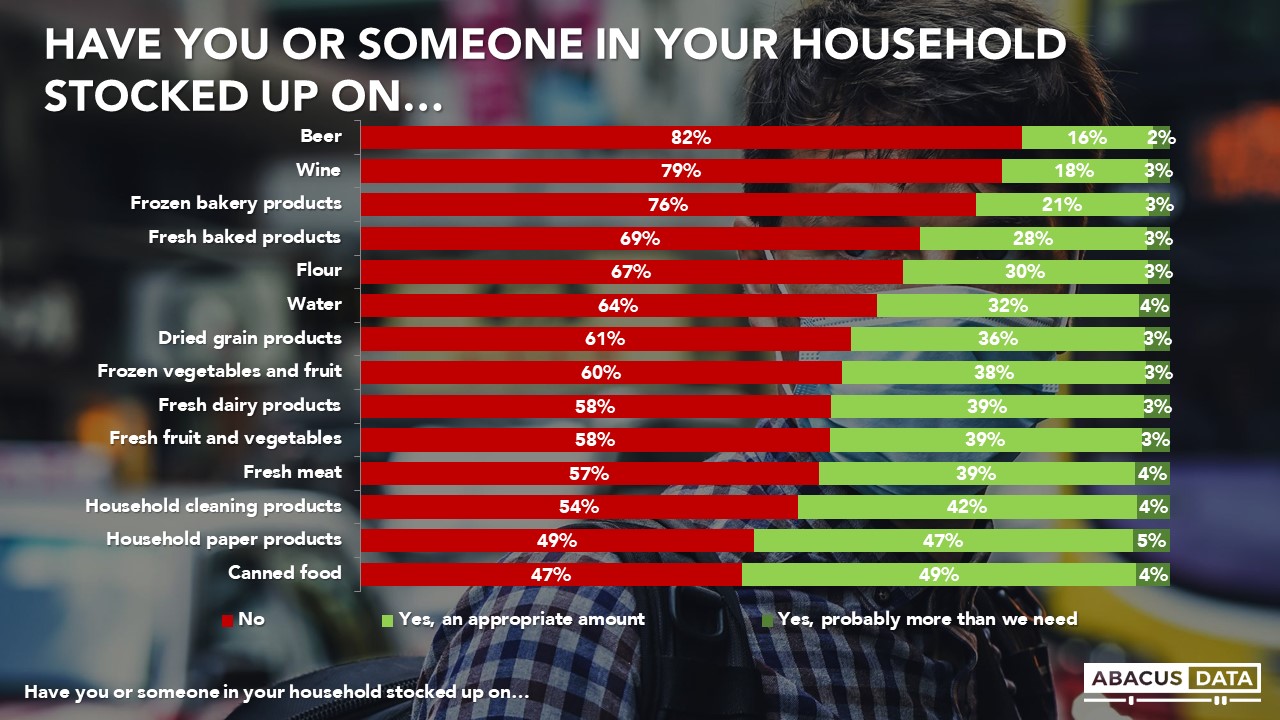
And so, it should come as no surprise that Canadian households are stocking up because of the uncertainty caused by the COVID-19 epidemic. They are particularly stocking on exactly those products they expect to be scarce – household paper, cleaning products, canned foods, and fresh meat and vegetables.
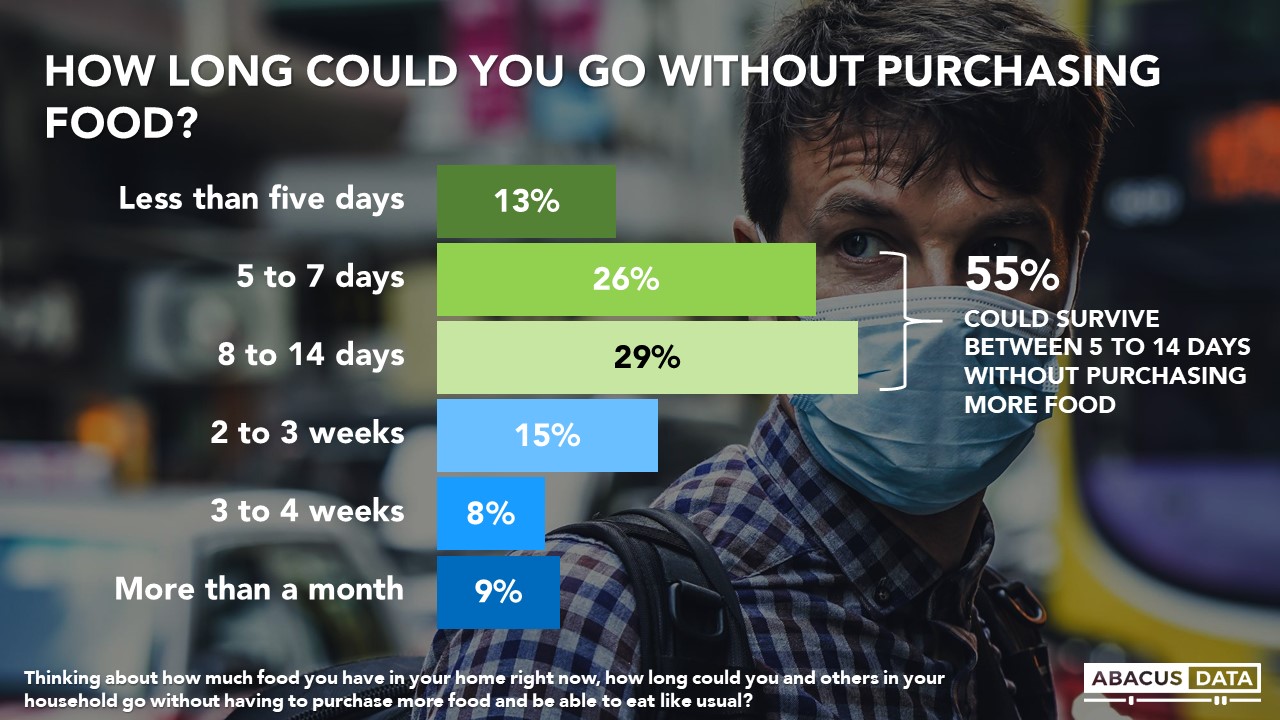
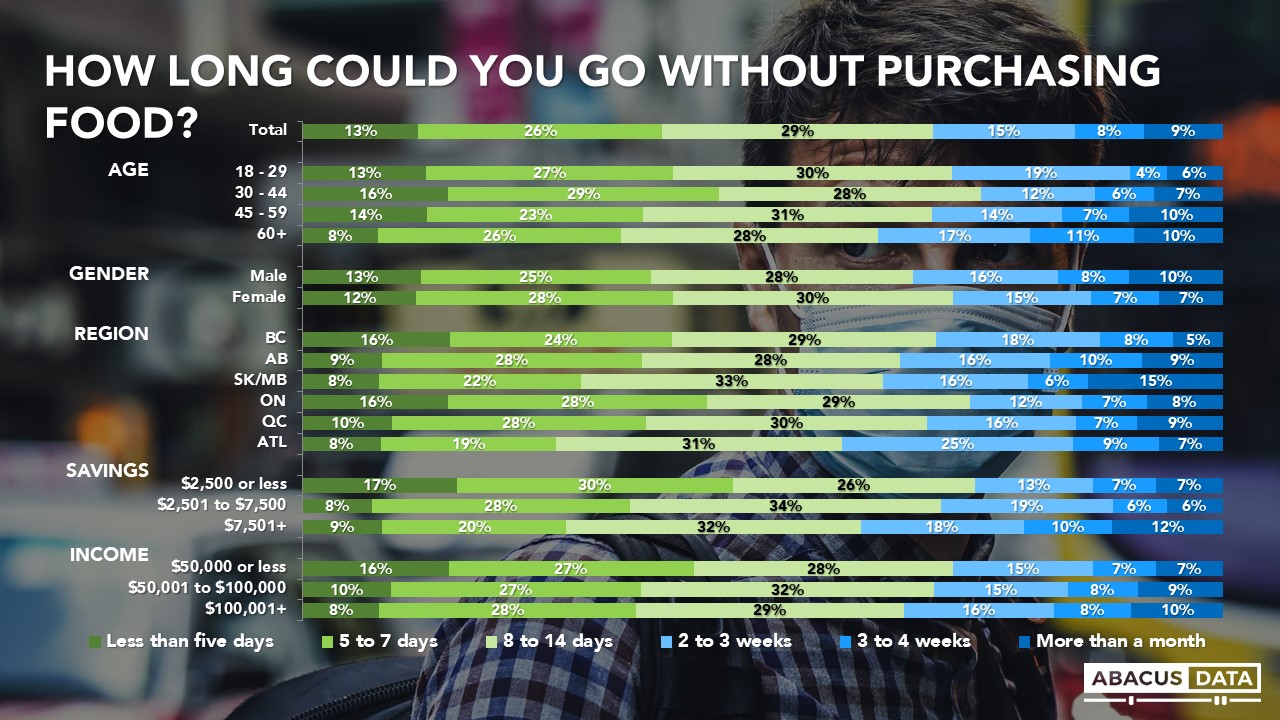
HOW LONG WILL THEY LAST?
How prepared when it comes to food are households if they are required to quarantine in their homes? A third of Canadian households believe they can manage 2+ weeks while still eating as usual based on their existing stores, with one in ten reporting the ability to survive more than a month. Most are somewhere in the 5-14 day range, considering the food they have in their home right now.
37% of Canadians could only survive fewer than 7 days, however, this number shoots up to half of households with lower incomes and fewer savings.
THE UPSHOT
With government and public health officials signalling the increasing severity of COVID-19, Canadians are certainly concerned and unsure of how to handle the day to day provisions of their lives under these uncertain circumstances. Supply issues covered by the news and showing up in our social feeds (think toiler paper and hand sanitizer) likely add fuel to the fire of already changing behaviour. While few consumers look like they’re stockpiling for the long-long term, many are feeling anxious and believe they should be, ultimately concerned about the availability of basic goods they’ll need to outlive a public health crisis of this magnitude. If the crisis worsens over time, concerns about food security and the supply chain are likely to increase. We will continue to monitor it.
METHODOLOGY
Our survey was conducted online with 2,309 Canadians aged 18 and over from March 20 to 24, 2020. A random sample of panellists was invited to complete the survey from a set of partner panels based on the Lucid exchange platform. These partners are double opt-in survey panels, blended to manage out potential skews in the data from a single source.
The margin of error for a comparable probability-based random sample of the same size is +/- 2.1%, 19 times out of 20. The data were weighted according to census data to ensure that the sample matched Canada’s population according to age, gender, educational attainment, and region. Totals may not add up to 100 due to rounding.
ABOUT ABACUS DATA
We are the only research and strategy firm that helps organizations respond to the disruptive risks and opportunities in a world where demographics and technology are changing more quickly than ever.
We are an innovative, fast-growing public opinion and marketing research consultancy. We use the latest technology, sound science, and deep experience to generate top-flight research-based advice to our clients. We offer global research capacity with a strong focus on customer service, attention to detail and exceptional value.
We were one of the most accurate pollsters conducting research during the 2019 Canadian Election.
Abacus Data Bulletins are short analyses of public opinion data we collect. For more information or media interviews, contact David Coletto.
*Note: In an earlier version of this release, some of the data in the charts below were incorrect. They have been correct.
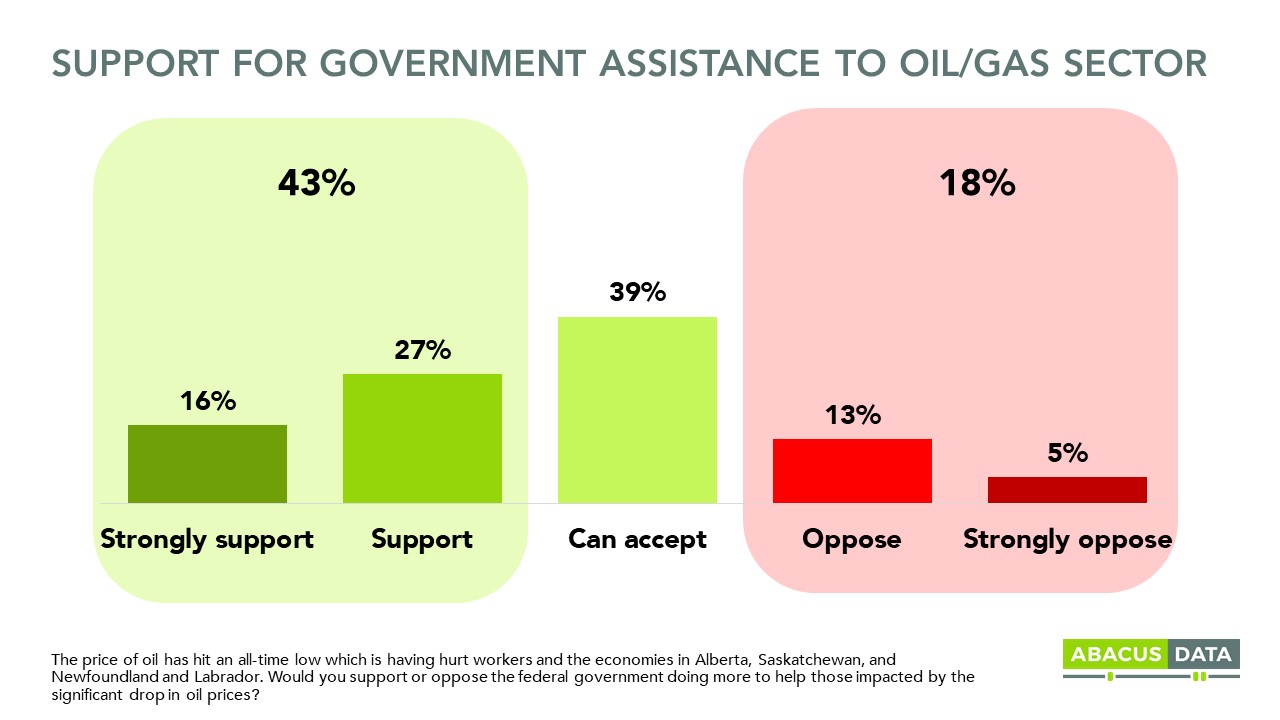
As the federal government considers different policy measures to support hard-hit sectors of the economy, the oil industry in Canada is facing unique headwinds caused by global competitive dynamics. We measured the appetite of Canadians to see federal measures to support the sector given the dramatic drop in oil prices.
In keeping with the general desire of Canadians to see government policy used to support a staggering economy, most are willing to go along with a support package for this sector. Outright opposition is only 18%, declared support is 43%, and the plurality says a support package is something they can accept.
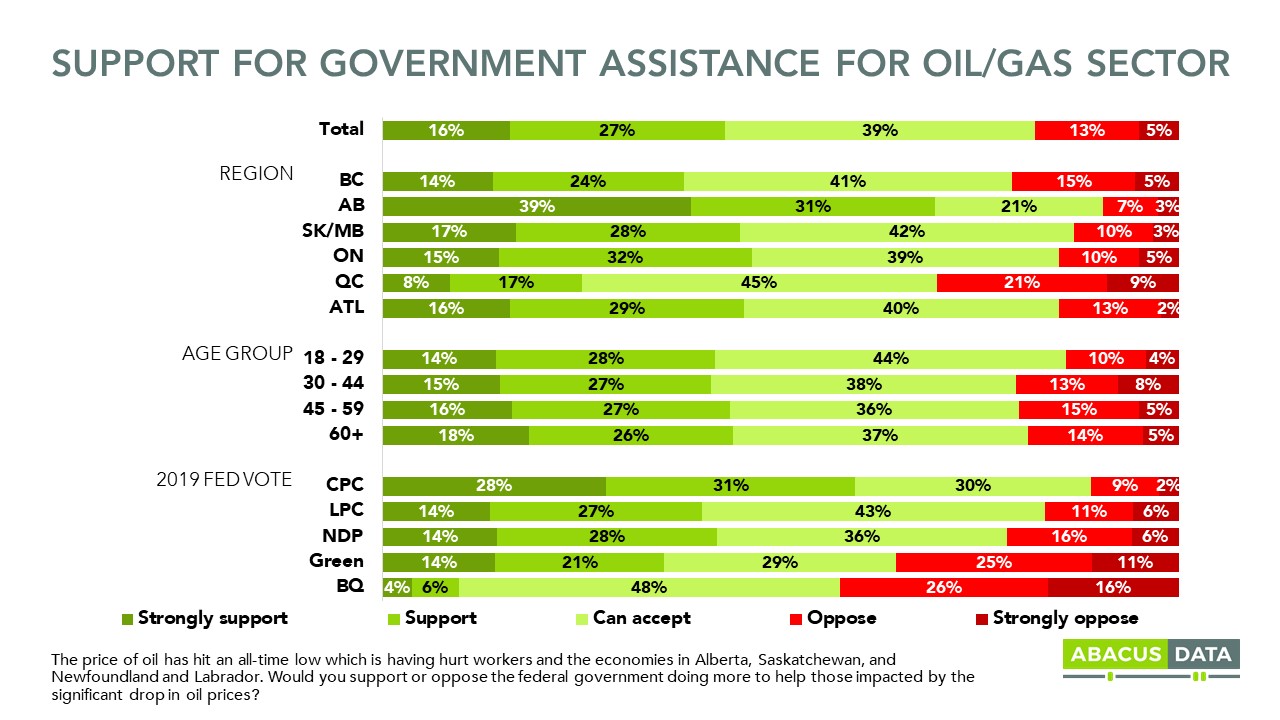
While one might expect sharp regional differences on this question, it is striking that this is not the case right at the moment. The number of Albertans who are willing to support an oil assistance package is much higher than other regions, but there’s clear majority acceptance in all regions of the country, even in Quebec that has traditionally been the province that has the most hesitancy about oil.
There are often sharp partisan differences when it comes to policy related to oil but not on this question, not right now. NDP supporters are almost as likely as Conservatives to support or accept a package. Only BQ voters (and our cell size suggests some caution be used in interpreting this result) are significantly below average in their support for a package.
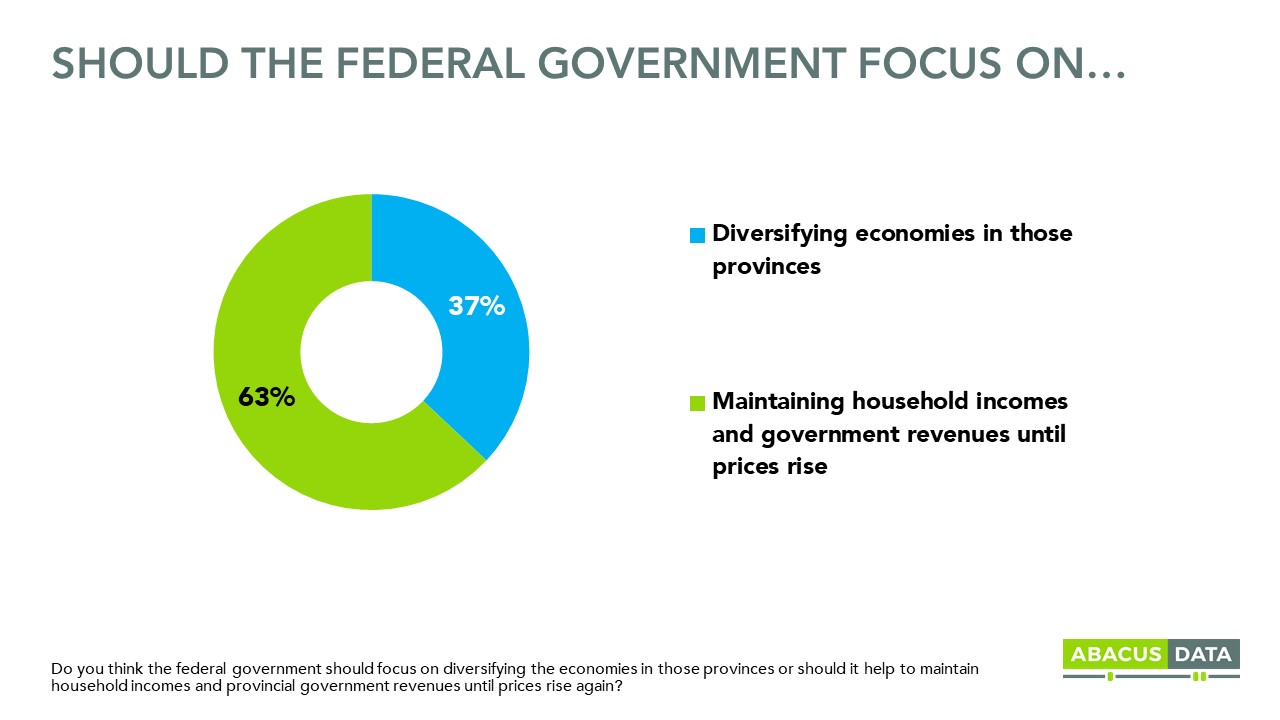
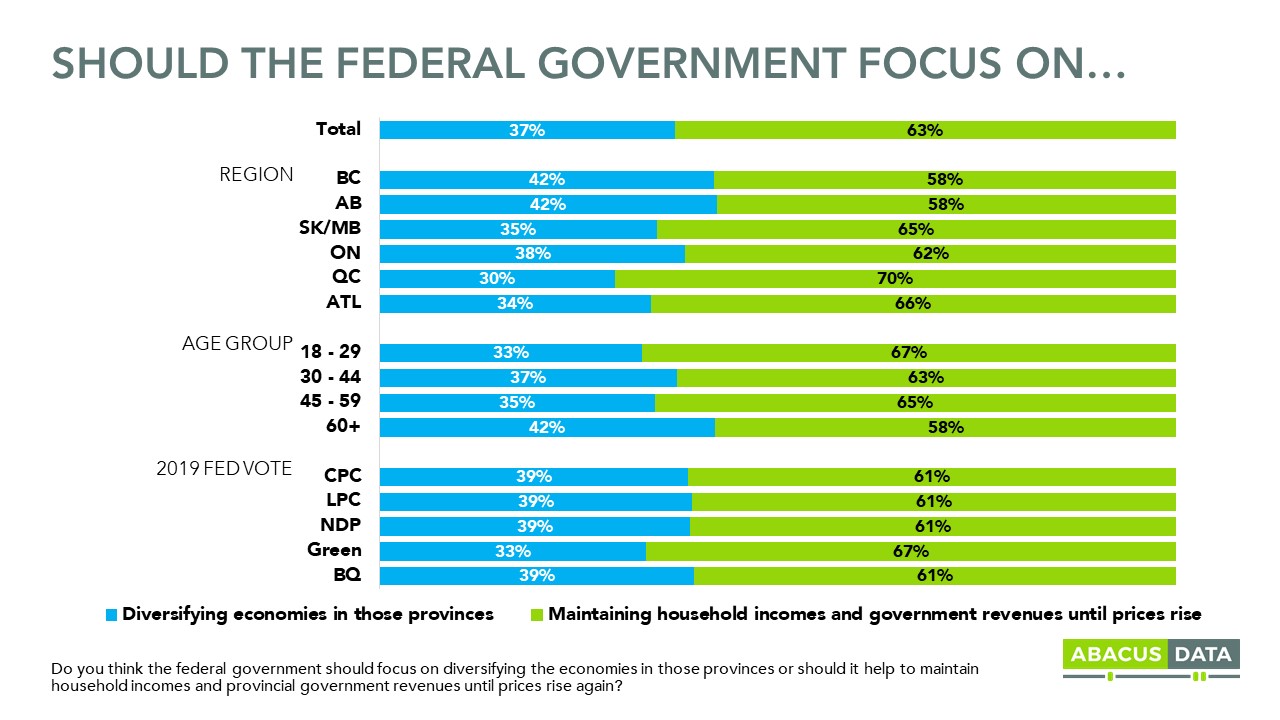
When asked if the focus of a relief package should be on maintaining incomes or diversifying the economy, the general preference was for maintaining incomes (63%) until prices rise, but it bears noting that 37% favour a push for diversification, including 42% in Alberta, and 39% among Conservative voters.
THE UPSHOT
According to Bruce Anderson: ”Health anxiety and economic trauma have created a new normal in terms of policy preferences – and very rapidly. Gone are sharp regional and party lines around oil and gas, replaced by a desire to see one another get through this challenging time and to expect governments to intervene as needed to help.
What is probably unique about support measures to deal with the collapse of oil prices is some uncertainty about what is the best way to support Albertans, and whether the solutions should feel like a bet on a product that can be volatile and may have a challenging future, even when the Covid crisis is behind us. There’s a slight warning signal to policymakers contemplating support – the public will want measures that help people, and not necessarily steps designed to help shareholders or bet on the long term future of oil.”
METHODOLOGY
Our survey was conducted online with 2,309 Canadians aged 18 and over from March 20 to 24, 2020. A random sample of panellists was invited to complete the survey from a set of partner panels based on the Lucid exchange platform. These partners are double opt-in survey panels, blended to manage out potential skews in the data from a single source.
The margin of error for a comparable probability-based random sample of the same size is +/- 2.1%, 19 times out of 20. The data were weighted according to census data to ensure that the sample matched Canada’s population according to age, gender, educational attainment, and region. Totals may not add up to 100 due to rounding.
ABOUT ABACUS DATA
We are the only research and strategy firm that helps organizations respond to the disruptive risks and opportunities in a world where demographics and technology are changing more quickly than ever.
We are an innovative, fast-growing public opinion and marketing research consultancy. We use the latest technology, sound science, and deep experience to generate top-flight research-based advice to our clients. We offer global research capacity with a strong focus on customer service, attention to detail and exceptional value.
We were one of the most accurate pollsters conducting research during the 2019 Canadian Election.
Abacus Data Bulletins are short analyses of public opinion data we collect. For more information or media interviews, contact David Coletto.
Earlier today, we released data from a comprehensive survey looking at how the COVID-19 epidemic has impacted Canadians’ state of mind.
Over the next few days, we will also dig deeper to explore how the COVID-19 outbreak is impacting specific groups of Canadians.
Given that we are close to the end of the month, and for many Canadians rent payments are coming due, exploring the views and perceptions of Canada’s renters seemed timely.
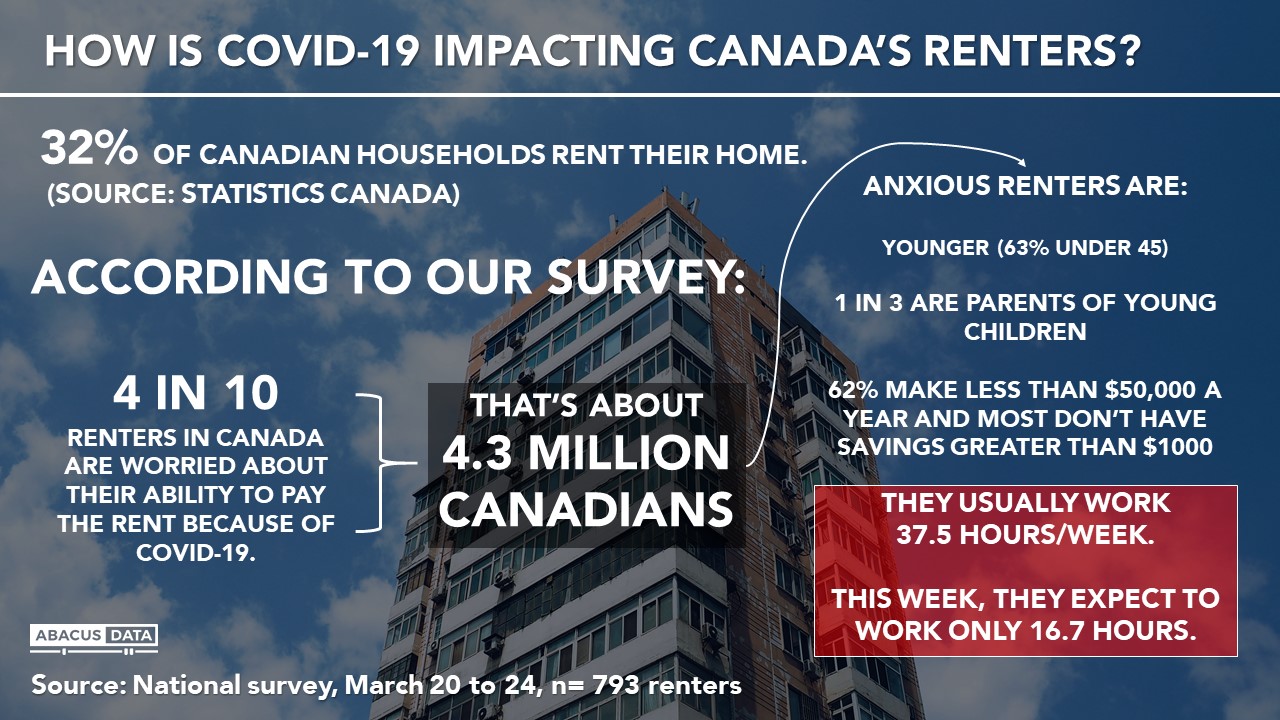
According to the 2016 census and Statistics Canada, 32% of Canadian households rent. 36% of our sample of Canadians 18+ rent their home so the numbers are in line and consistent.
Here’s a snapshot of what we found:
4 in 10 Canadian renters are worried about being able to pay their rent. 26% are really worried that they will be unable to pay their rent. Another 14% say they are somewhat worried. That means 4.3 million Canadians are worried about their ability to pay their rent.
Who are the anxious renters?
They represent about 14% of the population.
They are younger (63% are under the age of 45).
They are more likely to be female (55%) than male (45%).
1 in 3 are parents of children in early childhood, elementary, or secondary school.
They are from lower-income households. 62% live in households that make less than $50,000 a year.
They don’t have much savings to fall back on. 66% say they have less than $1000 in savings that they can easily access.
Among those who work, they typically work 37.2 hours a week but in the current week, the average expected hours of work drops to 16.7 (down more than 55%).
While more are employed in a permanent full-time position, 27% are either self-employed, freelance, working part-time, or on a contract. 14% report being unemployed currently. 7% are retired and 7% are stay-at-home parents.
43% pay more than $1,000 a month in rent. 48% pay between $500 and $1,000 while 8% pay less than $500 a month.
They are much more concerned about the COVID-19 epidemic than other Canadians. 62% are either extremely worried or worried a lot compared to 36% of other Canadians.
64% are really worried about not being able to pay their bills over the next month.
THE UPSHOT
The data is quite clear: millions of Canadian renters are feeling anxious about their ability to pay their rent because of the COVID-19 epidemic. Among those employed, they report usually working on average 37.5 hours a week. But this week, the average dropped 55% to 16.7 hours.
METHODOLOGY
Our survey was conducted online with 2,309 Canadians aged 18 and over from March 20 to 24, 2020. A random sample of panellists was invited to complete the survey from a set of partner panels based on the Lucid exchange platform. These partners are double opt-in survey panels, blended to manage out potential skews in the data from a single source.
The margin of error for a comparable probability-based random sample of the same size is +/- 2.1%, 19 times out of 20. The data were weighted according to census data to ensure that the sample matched Canada’s population according to age, gender, educational attainment, and region. Totals may not add up to 100 due to rounding.
ABOUT ABACUS DATA
We are the only research and strategy firm that helps organizations respond to the disruptive risks and opportunities in a world where demographics and technology are changing more quickly than ever.
We are an innovative, fast-growing public opinion and marketing research consultancy. We use the latest technology, sound science, and deep experience to generate top-flight research-based advice to our clients. We offer global research capacity with a strong focus on customer service, attention to detail and exceptional value.
We were one of the most accurate pollsters conducting research during the 2019 Canadian Election.
Abacus Data Bulletins are short analyses of public opinion data we collect. For more information or media interviews, contact Bruce Anderson or David Coletto.
On Monday, we completed a comprehensive survey on how Canadians are feeling and reacting to the COVID-19 outbreak. Over the next few days, we will be releasing findings from that study. In this bulletin, we explore the anxiety caused by the epidemic.
Here are the key findings:
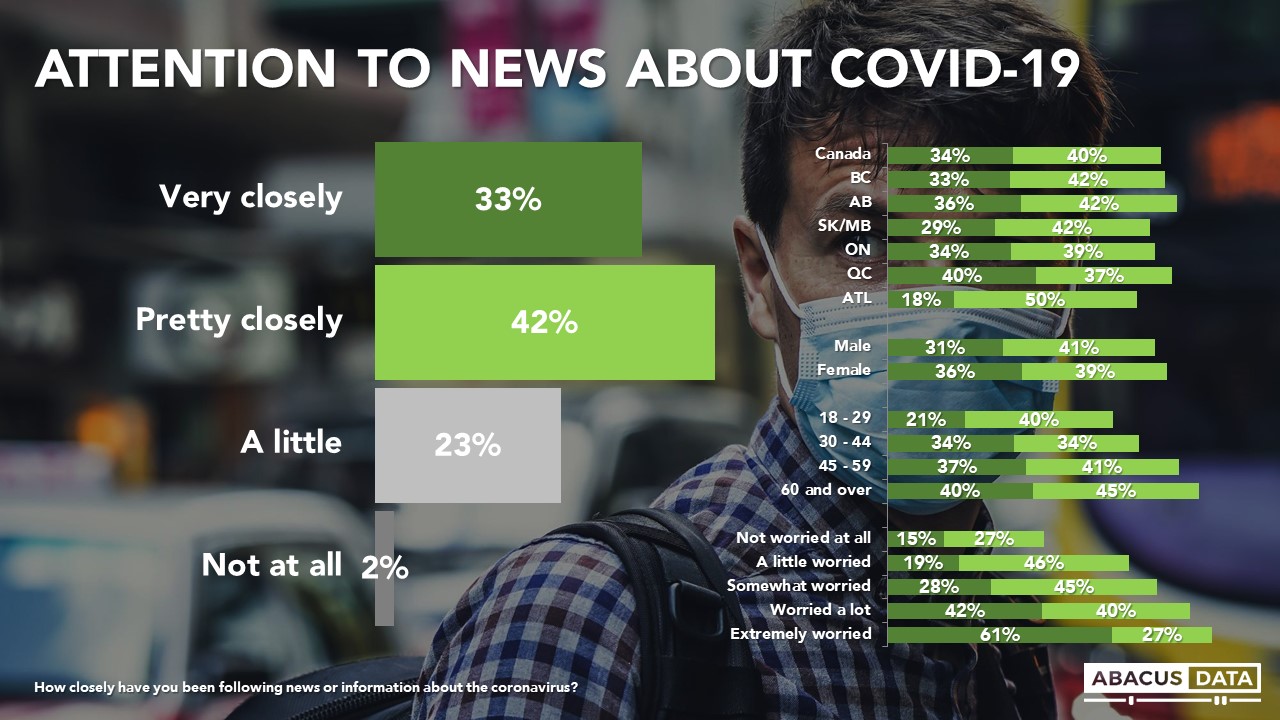
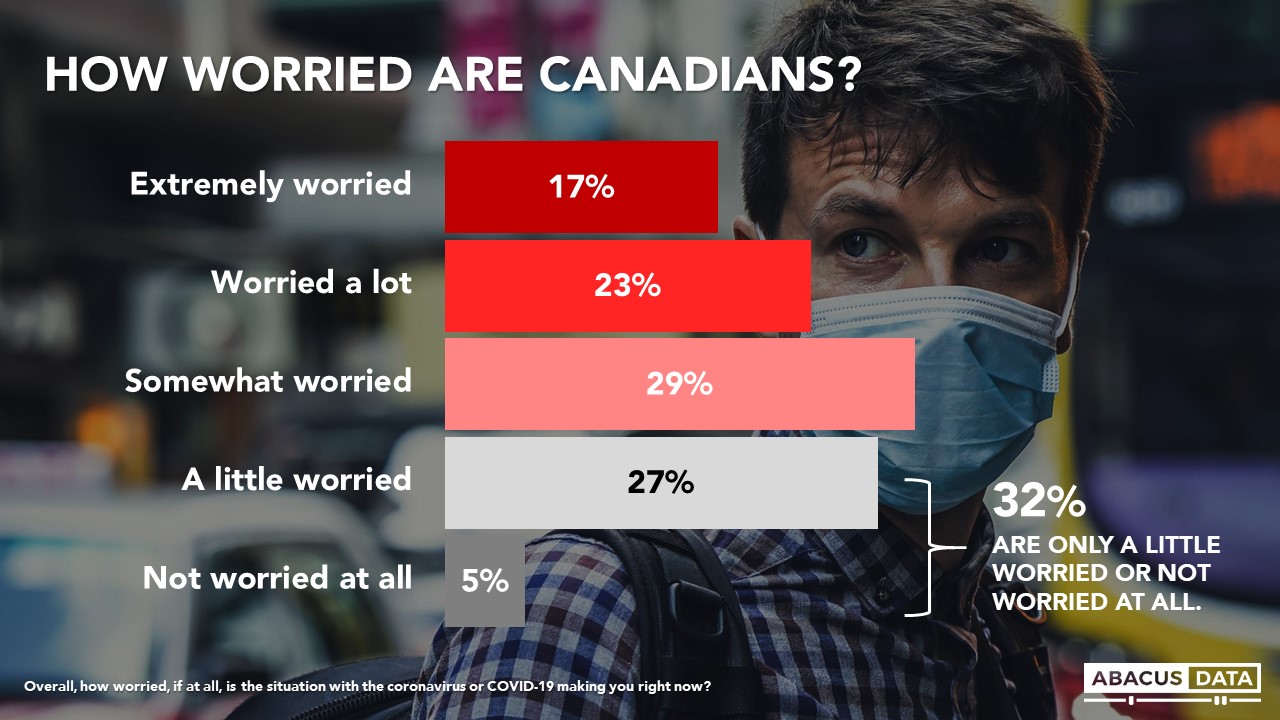
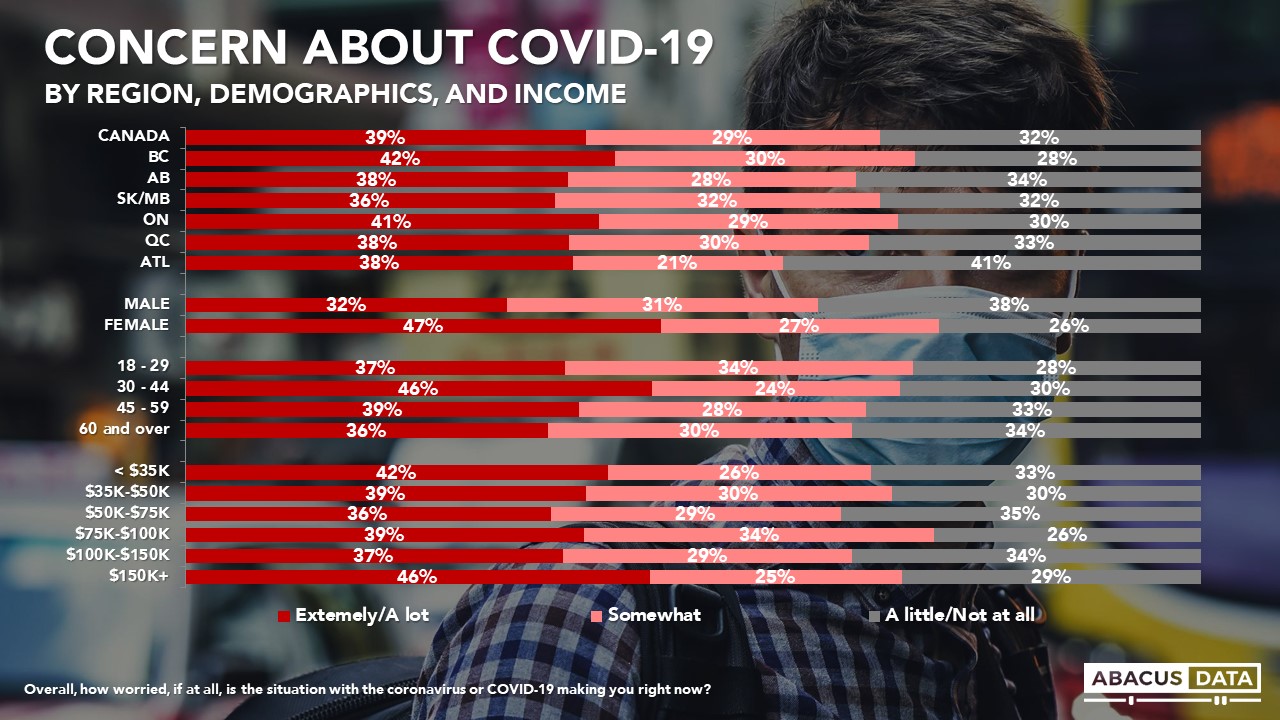
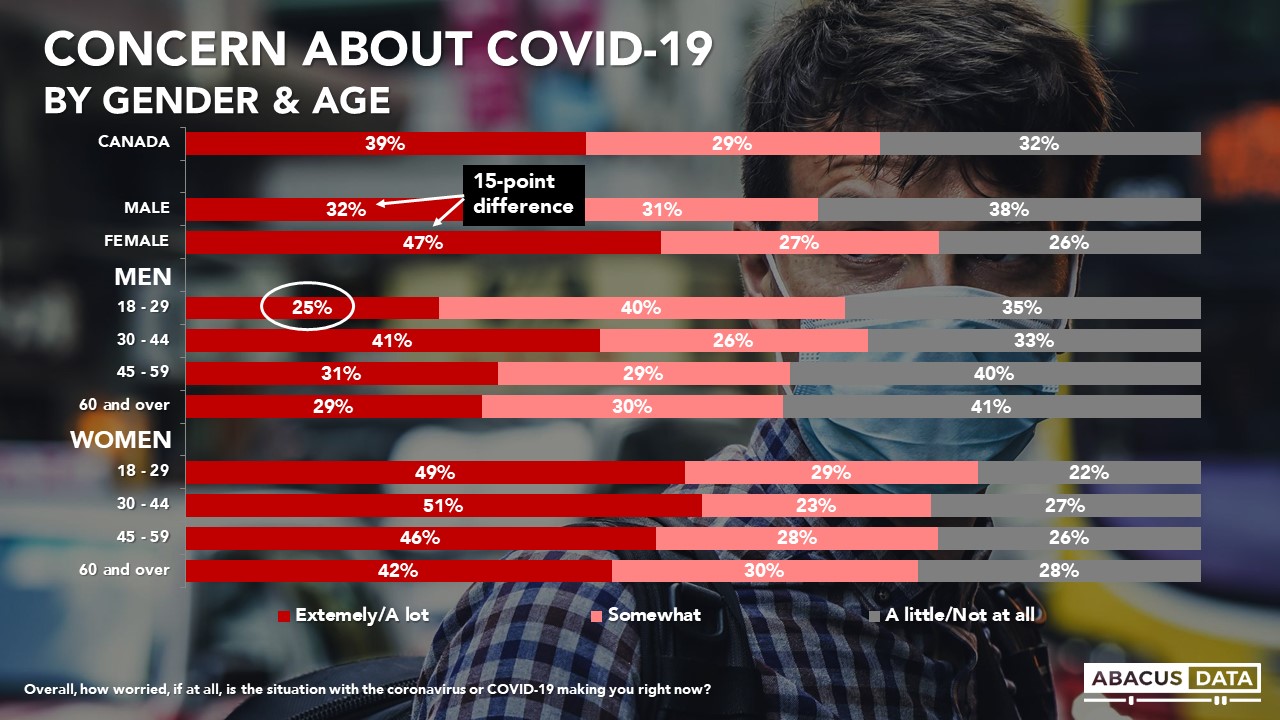
75% are following news or information about the outbreak either closely, and 69% are worried. Fully 40% say they are worried a lot or extremely worried (about 12 million Canadian adults). Men, especially younger men, are less concerned than women.
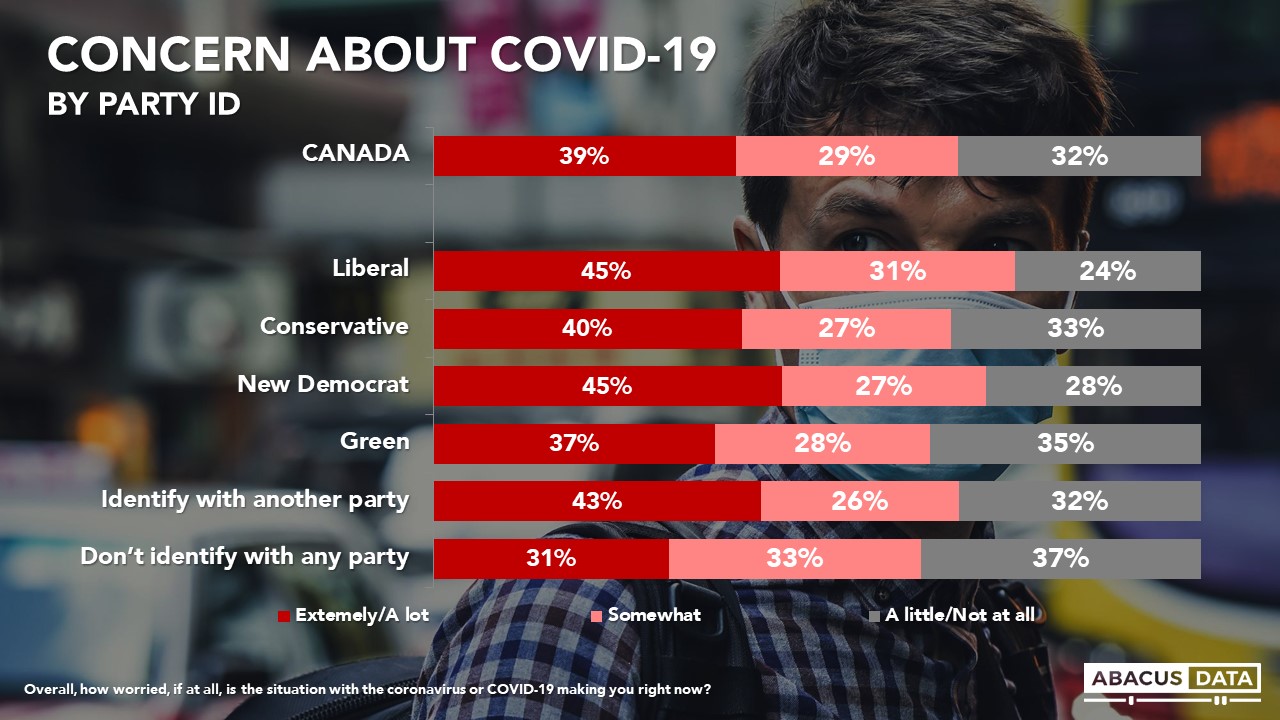
At this point, partisanship is not a major driver of overall concern about COVID-19 in Canada. Almost equal numbers of Liberal, Conservative, and New Democratic partisans reporting being extremely worried or worried a lot about COVID-19 although Conservatives are slightly more likely to report being not that concerned about the epidemic.
Most Canadians (55%) now believe they or someone they know will contract the coronavirus, a 27-point increase from a survey we conducted two weeks ago.
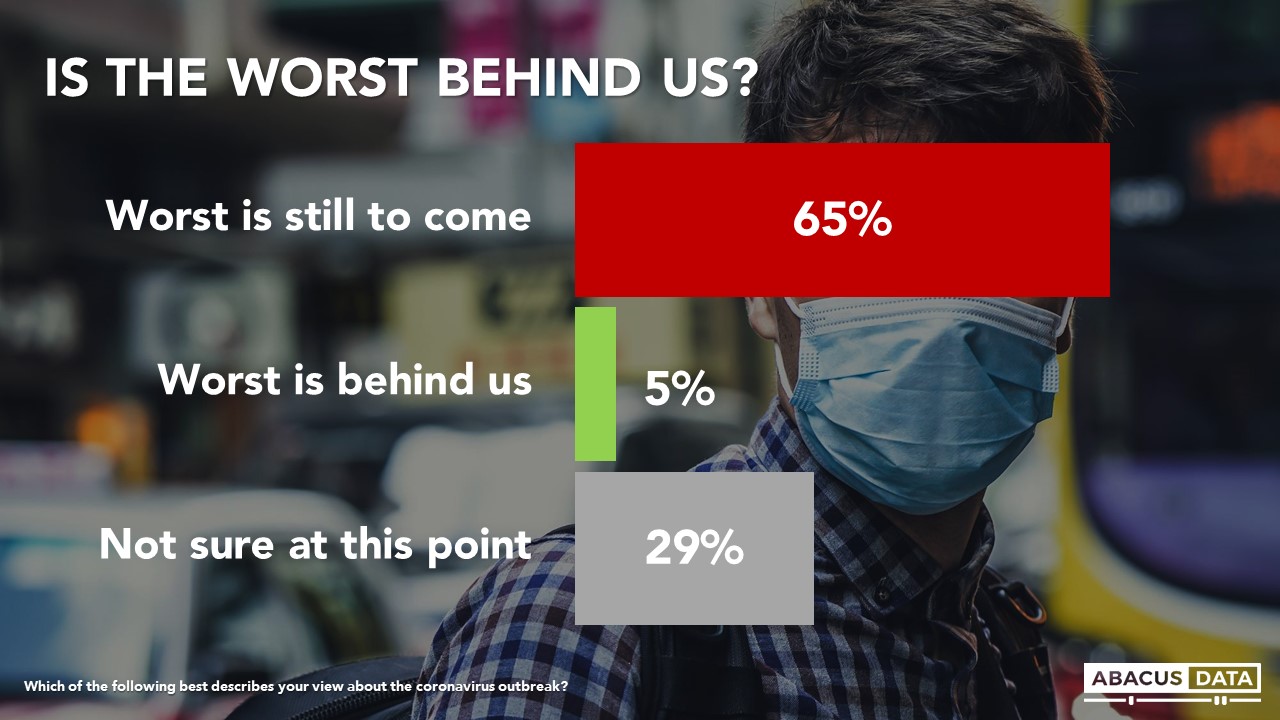
Most (65%) feel that when it comes to COVID-19, the worst is still to come.
Most (55%) feel that it will take 2 to 3 months or more before they will be able to live their lives more or less as they did before although many are unsure at this point.
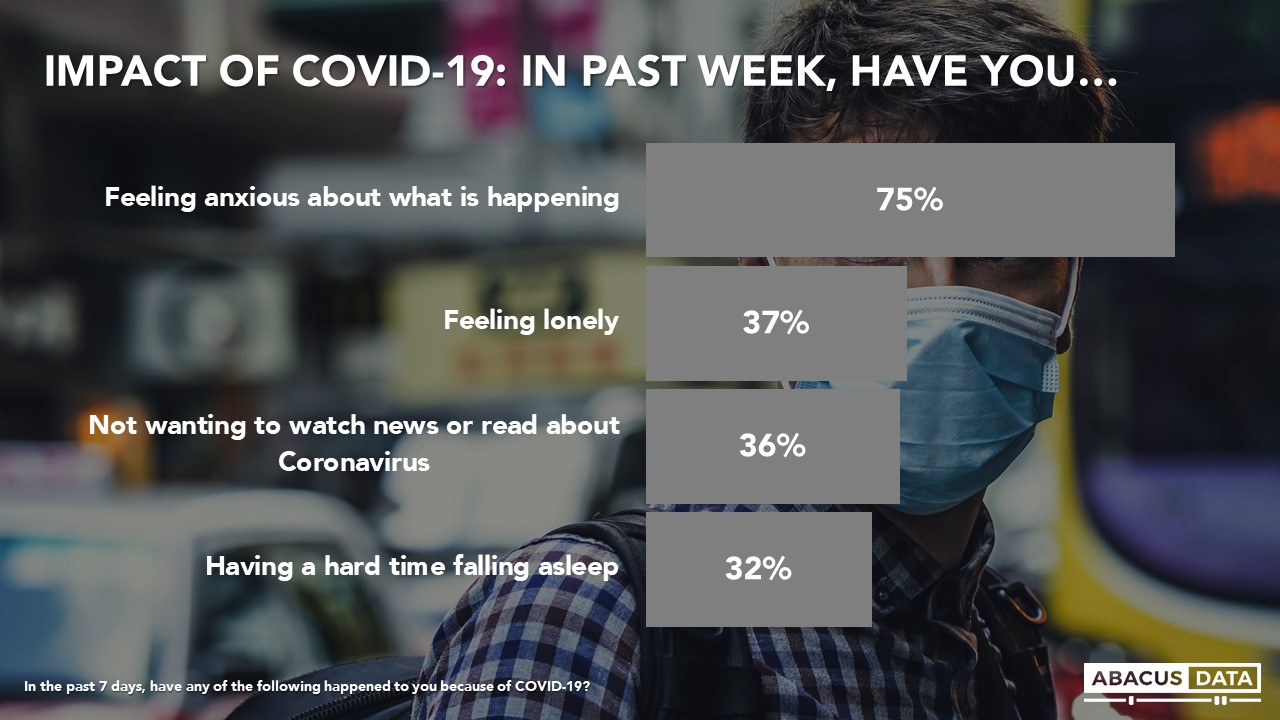
There are widespread impacts on mental health. 75% report feeling anxious, 37% feel lonely, and 32% say they are having a hard time falling asleep because of COVID-19. One in three (36%) report not wanting to watch the news or read about the virus because it makes them more anxious. Women, younger Canadians, and those in single-person households are more likely to report mental health strains of this sort.
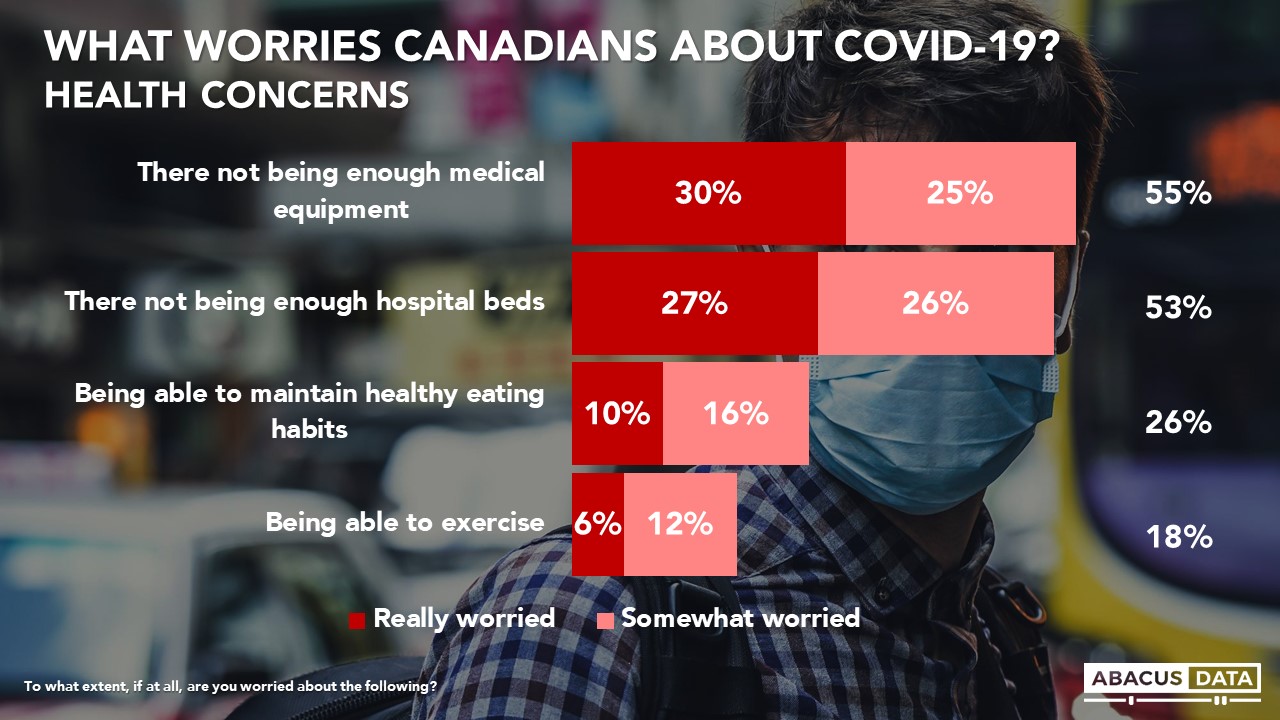
In addition to financial concerns, half of Canadians are worried that there will not be enough medical equipment or enough hospital beds to handle the crisis.
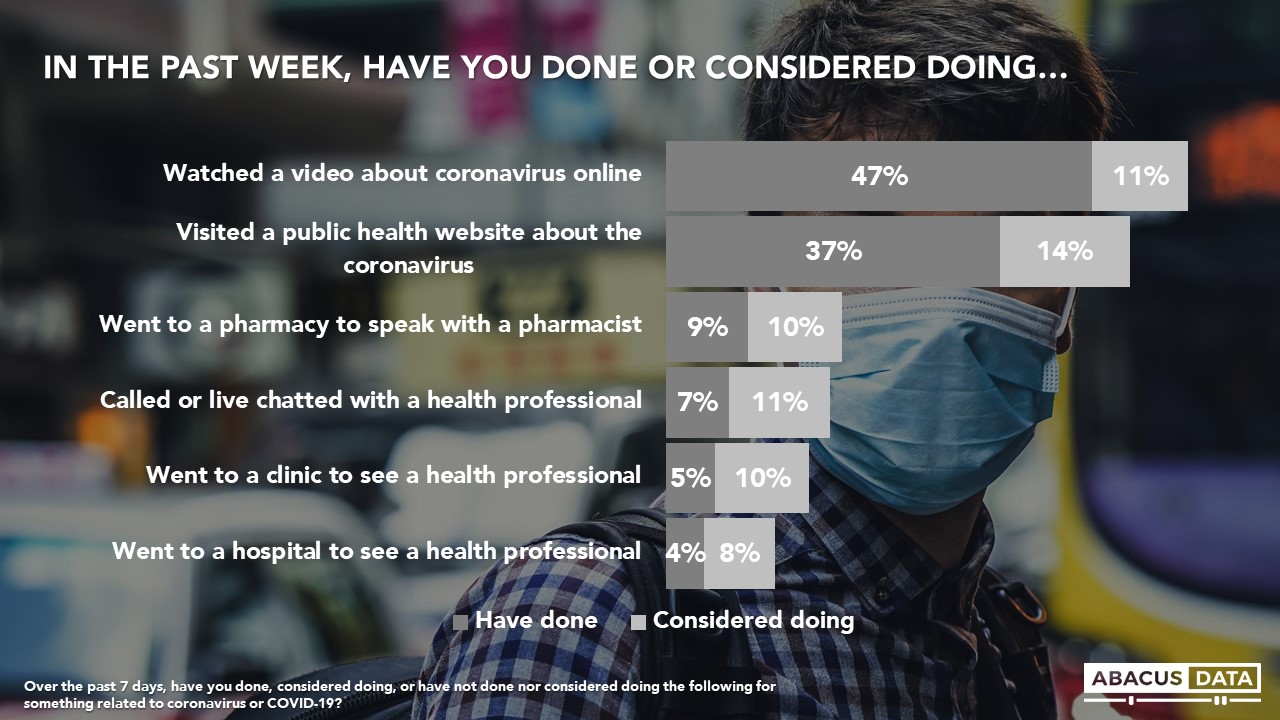
To date, 47% of Canadians reporting watching an online video about coronavirus and 37% have visited a public health website about the virus. Millions of Canadians have visited a pharmacy to speak with a pharmacist (9%), called or live chatted with a health professional (7%) or gone to a clinic to see a health professional about COVID-19 (5%). 4% report going to a hospital already to see a health professional. Millions more are considering doing so in the future.
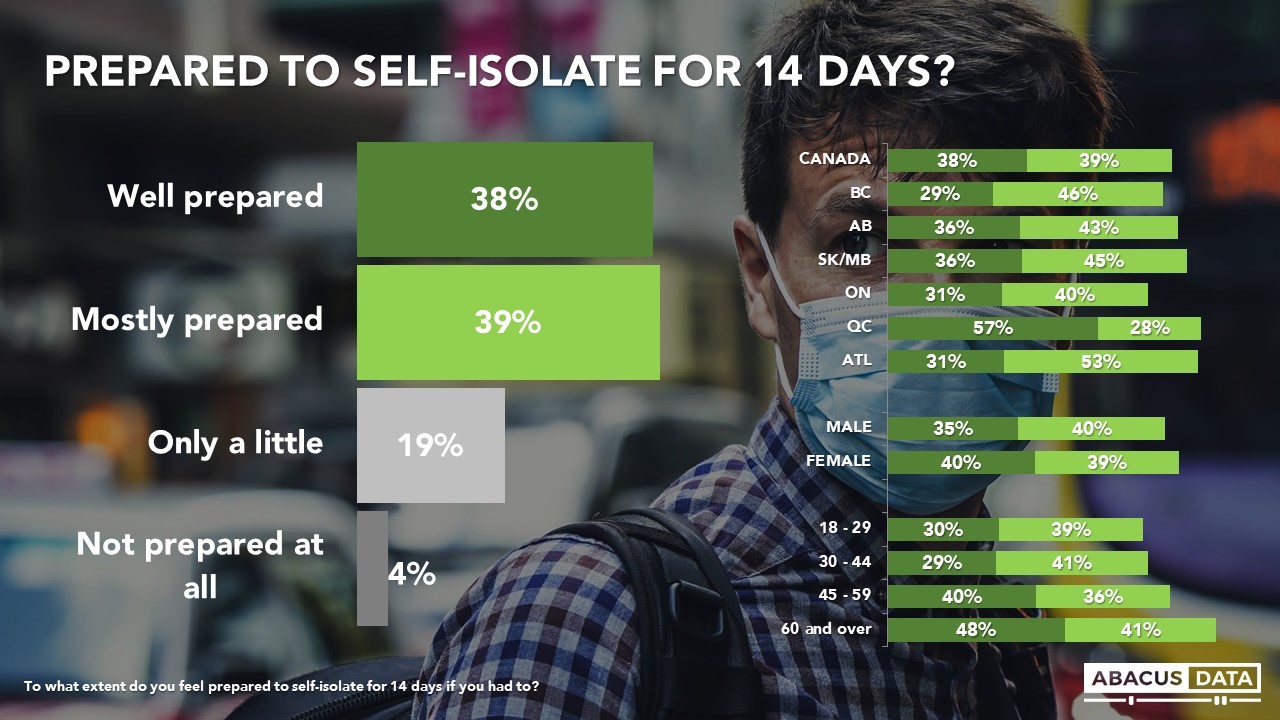
Most Canadians (77%) feel they are at least mostly prepared if they are required to self-isolate for 14 days. In the event of a full, mandatory lock-down, like in Italy, most continue to say they are mostly prepared (71%), but 29% say they are only a little prepared (21%) or not at all prepared (8%). For context, that 8% represents about 2.4 million Canadians.
THE UPSHOT
According to Bruce Anderson: ”No one in Canada has experience with a situation like this – where financial collapses surround us, and the prospect of a health system collapse looms large. Isolation means people are consuming large amounts of information about the crisis, which is helping them prepare, but also driving high levels of anxiety and making it clear that economic health, physical health but also mental health will be challenges for the country in the days ahead.
According to David Coletto: ”It’s clear that the COVID-19 outbreak is unprecedented on so many levels. The level of attention Canadians are paying to the issue, the deep seated and broad concern people have, and the uncertainty around how long it will disrupt their lives.
Our data also points to a growing mental health impacts. Millions report not being able to sleep well, feeling lonely and anxious, while some have even considered turning off the news because of how it makes them feel. The impact is broad and deep.
Most troubling is the varied reaction among different groups of Canadians. Men, especially young men, are less concerned. They are less likely to be distancing themselves from others, and less likely to think the epidemic will last for longer..
As a rapidly evolving issue, perceptions and views will undoubtedly change, but the big picture of our state of mind is profoundly concerning. Canadians are feeling anxious, worried, and uncertain about how this will turn out. Most still feel the worst is ahead of us, and many are unprepared to self-isolate or be locked down.”
METHODOLOGY
Our survey was conducted online with 2,309 Canadians aged 18 and over from March 20 to 24, 2020. A random sample of panellists was invited to complete the survey from a set of partner panels based on the Lucid exchange platform. These partners are double opt-in survey panels, blended to manage out potential skews in the data from a single source.
The margin of error for a comparable probability-based random sample of the same size is +/- 2.1%, 19 times out of 20. The data were weighted according to census data to ensure that the sample matched Canada’s population according to age, gender, educational attainment, and region. Totals may not add up to 100 due to rounding.
ABOUT ABACUS DATA
We are the only research and strategy firm that helps organizations respond to the disruptive risks and opportunities in a world where demographics and technology are changing more quickly than ever.
We are an innovative, fast-growing public opinion and marketing research consultancy. We use the latest technology, sound science, and deep experience to generate top-flight research-based advice to our clients. We offer global research capacity with a strong focus on customer service, attention to detail and exceptional value.
We were one of the most accurate pollsters conducting research during the 2019 Canadian Election.
Over the next few months, our team will be exploring public attitudes, opinions, and reported behaviour on a range of topics related to the COVID-19 outbreak.
This week we will release some results from a large national survey we are currently fielding which should be completed by the end of today (Monday March 23).
In the meantime, if you have any questions about our research or how we can help support your work during this difficult time, please reach out to me or Yvonne.
We are committed to conducting high-quality research to help guide decisions during this challenging time for all of us.
At the end of last year, we conducted a national survey of 5,000 Canadian adults for Co-operatives and Mutuals Canada that explored public attitudes about the economic system, broader public concerns, and what role co-operatives could play in alleviating those concerns. The survey also sought to profile cooperative members in Canada.
The survey finds that there is a wide audience for the cooperative business model and a big opportunity for the Co-operative and Mutual Sector to expand and connect with Canadians who seek more control and influence over decision making and want organizations they interact with to invest back in the communities they live in.
The results will be of value to anyone working in the Co-operative and Mutual Sector, policymakers and elected officials, and interested citizens concerned about the direction of the economic system and the rise of polarization and populism in Canada and around the world.
POWER TO THE PEOPLE
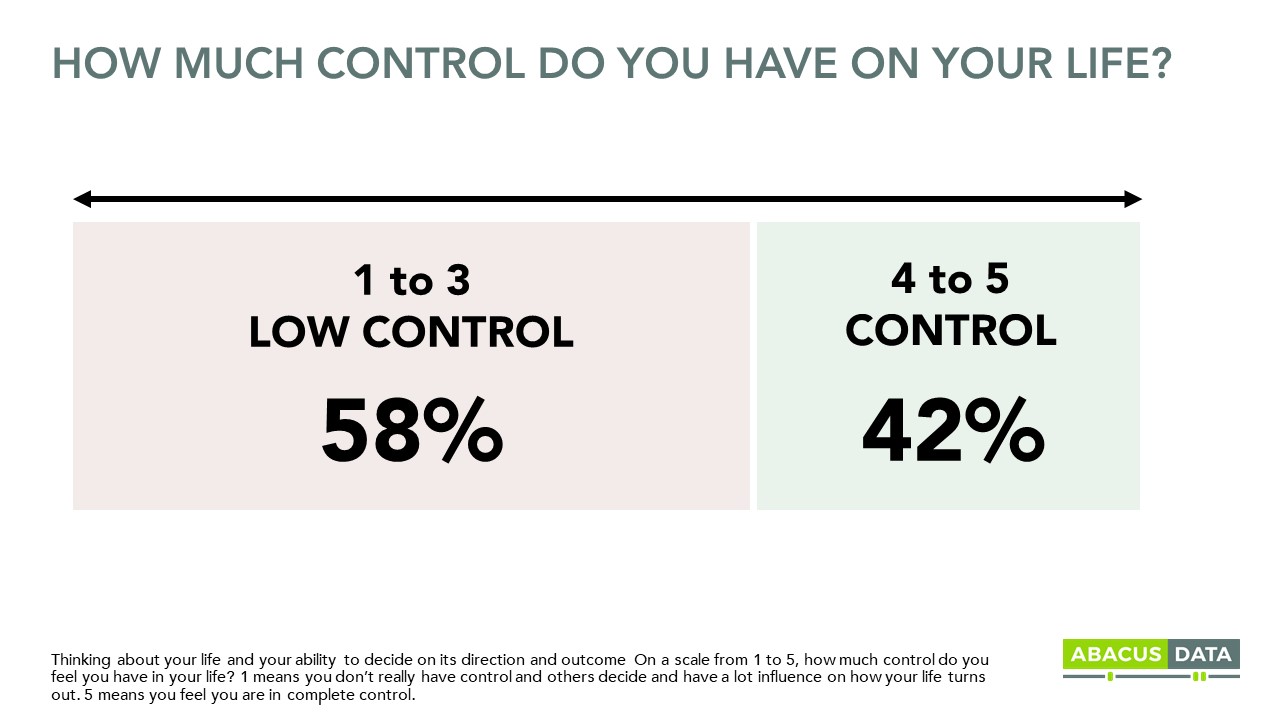
The feeling of vulnerability, powerlessness, or not being sufficiently in control over one’s life forms the basis for much of the anxiety in society today.
More than half of Canadians (58%) don’t feel in control over their lives and younger Canadians are more likely to feel this way.
This feeling is strongly related to other attitudes. Those with a sense of powerlessness are more likely to feel the country is headed in the wrong direction, are less satisfied with their lives, and are more likely to feel that the economic system is rigged against them.
This sense can lead to resentment, anti-establishment, anti-system, and anti-immigration sentiment. It can divide people and increase support for populist and authoritarian leaders who offer control, order, and stability, but often propose policies that do little to change the economic or social outcomes for those feeling most anxious.
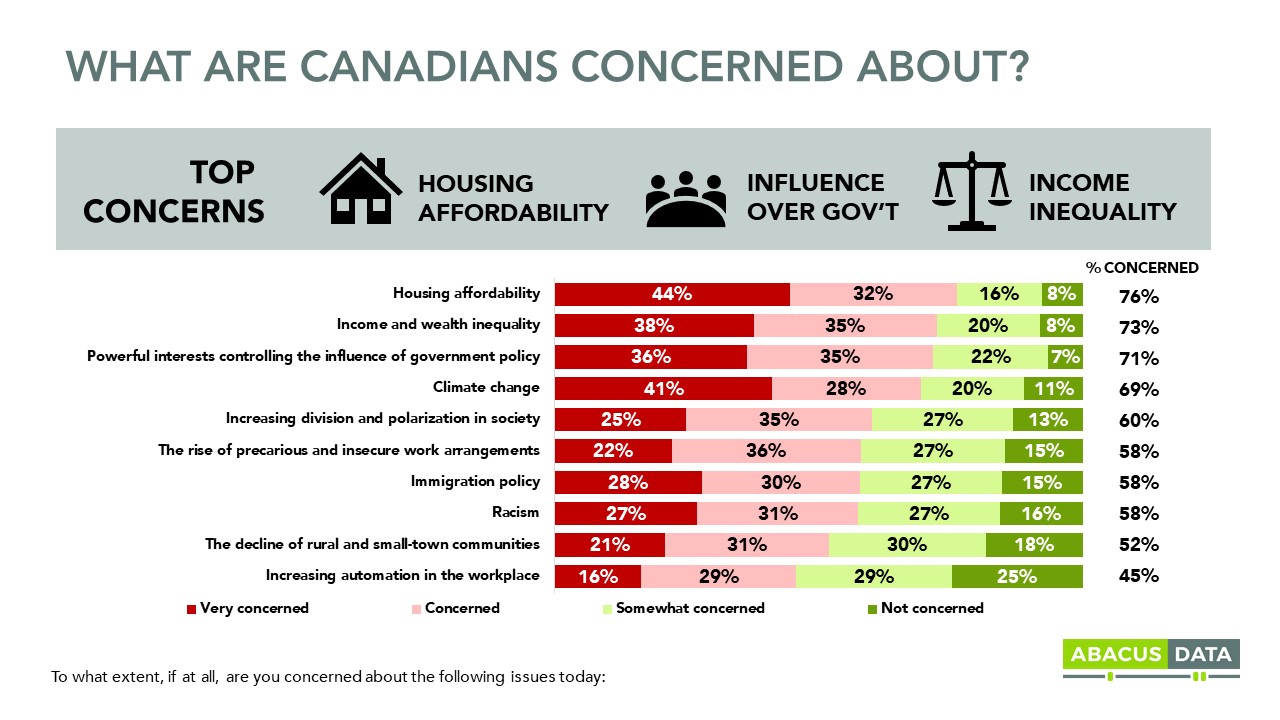
At the same time, Canadians are deeply concerned about housing affordability, climate change, income and wealth inequality, and the influence of powerful interests on government policy. There’s also growing concern about immigration policy, racism, and for those living in rural communities, the decline of small town in Canada.
AN ECONOMIC SYSTEM THAT DOESN’T FEEL LIKE IT’S WORKING WELL
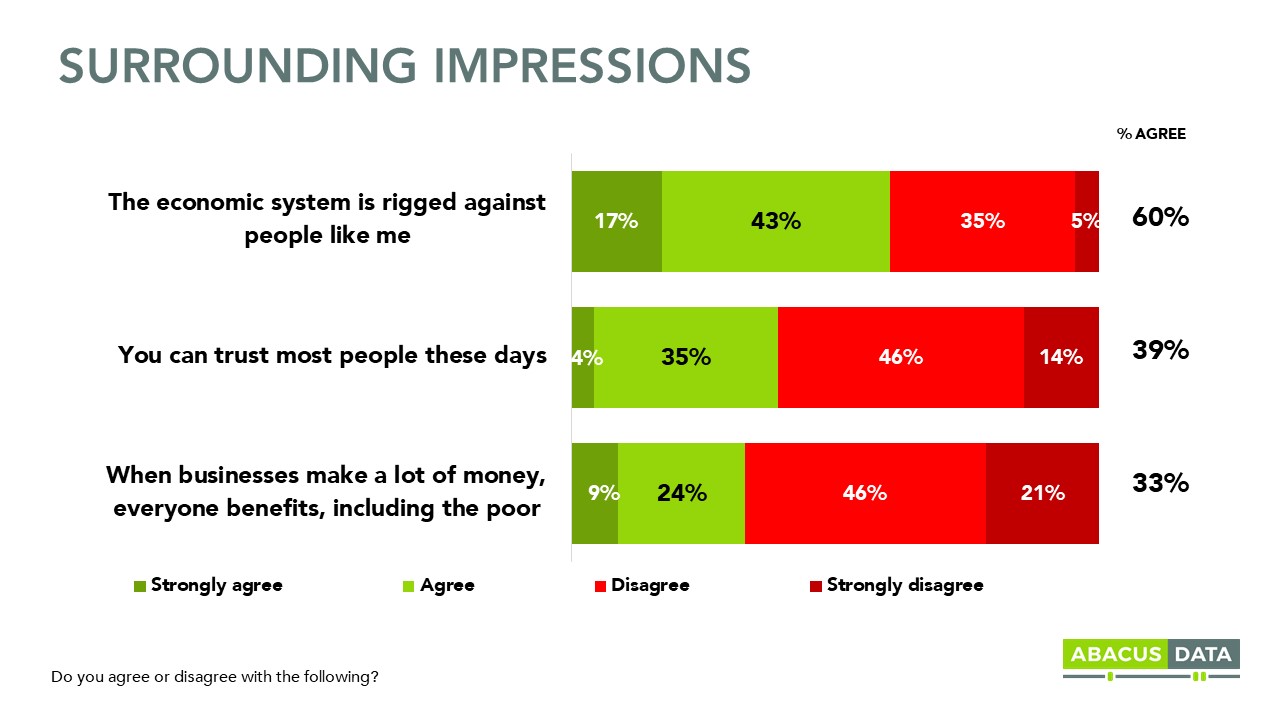
In an environment where people seek control – control over their workplace and career, their future, and the communities where they live – most look at the economic system and say it’s rigged against people like them (60% agree with this sentiment). At the same time, few say that other people can be trusted and that when businesses make a lot of money, everyone benefits.
What drives these feelings?
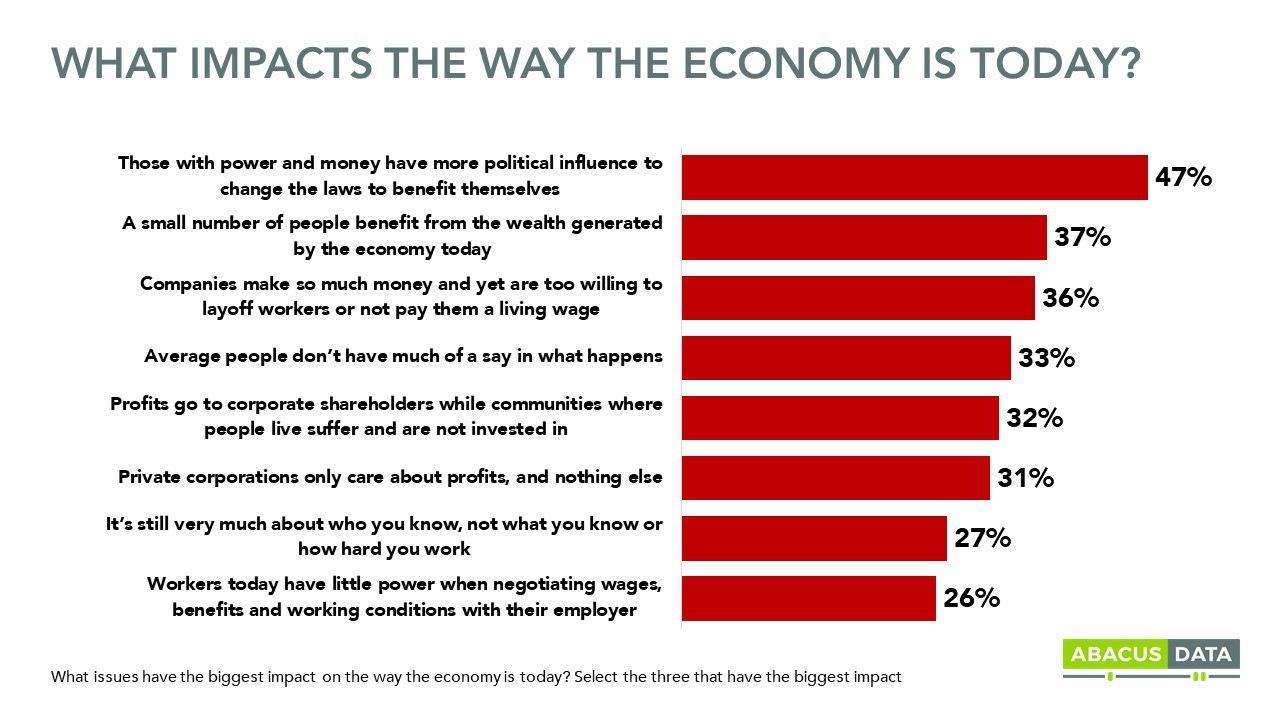
Motivations are varied, but large numbers of Canadians feel that those with power and money have too much political influence, that a small number of people benefit from the wealth generated by the economy today, and even though companies make good profits, they share them only with a few shareholders unlike co-operatives who share them with all member-owners. There is a sense that the many are not benefiting from growth nor have a say in decisions their employers, governments, and affiliated organizations are making.
Despite the fact that unemployment is at historic lows in Canada, the overall poverty rate is down, and corporate profits have improved over the past few years, Statistics Canada finds median after-tax income for households and individuals has not changed over the same period.
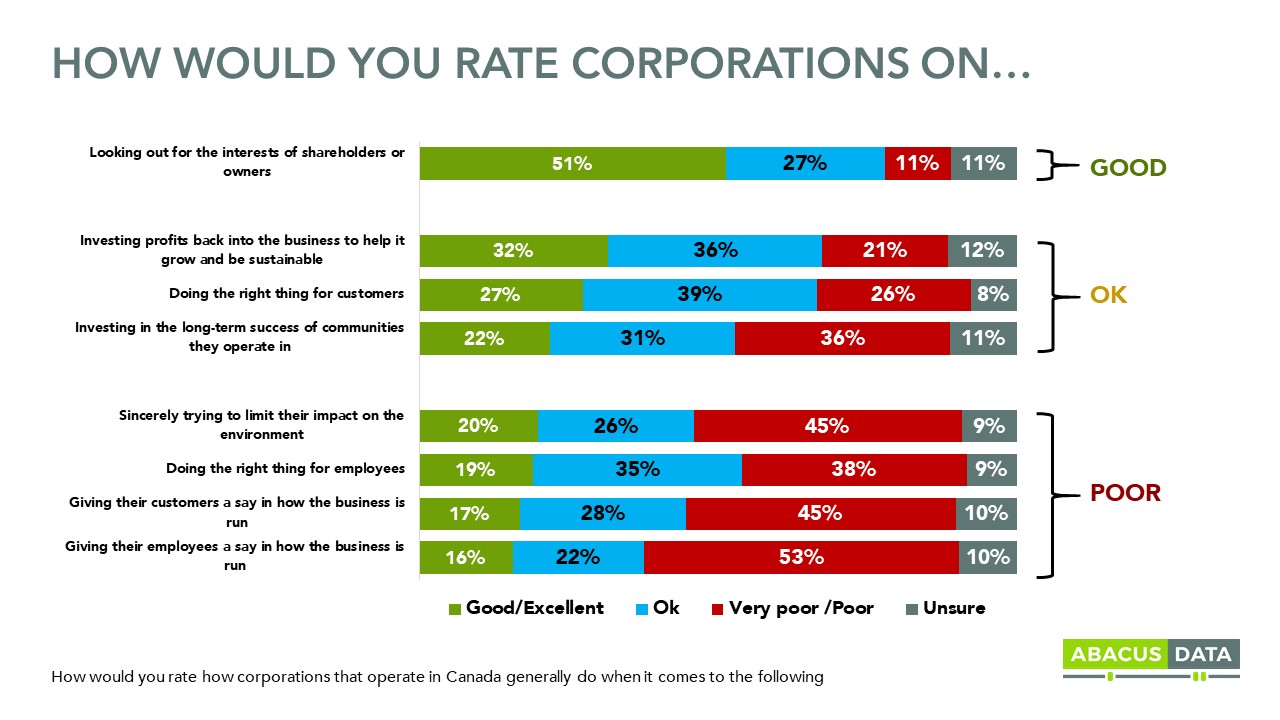
When we ask people to rate the performance of corporations in Canada on a range of metrics, the four that receive the most negative assessment are whether they are:
1. Doing the right thing for their employees; 2. Sincerely limiting their impact on the environment; 3. Giving their customers a say in how the business is run; and, 4. Giving their employees a say in how the business is run.
While most think corporations do a good job looking out for their shareholders, they are perceived to be doing a poor job doing the right thing for employees or giving their employees or customers a say in how they run the business.
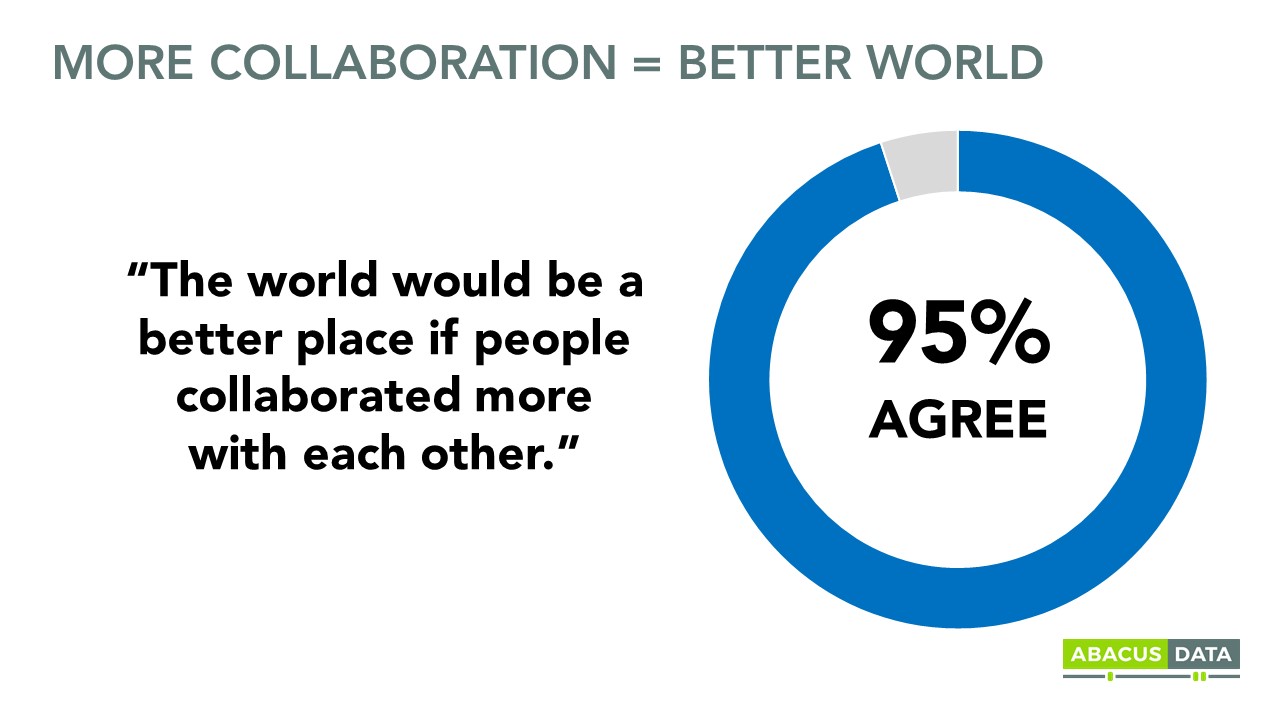
Despite this sense of powerlessness and uncertainty, almost all Canadians, regardless of political orientation, generation, or geographic location agree that the world would be a better place if more people collaborated with each other. Co-operation and collaboration are what people seek.
ARE COOPERATIVES A SOLUTION TO UNCERTAINTY?
As people seek more control over their lives, their jobs, and their communities, co-operatives appear as a legitimate alternative to an economic system and business model that so many people find inadequate and for some, destructive.
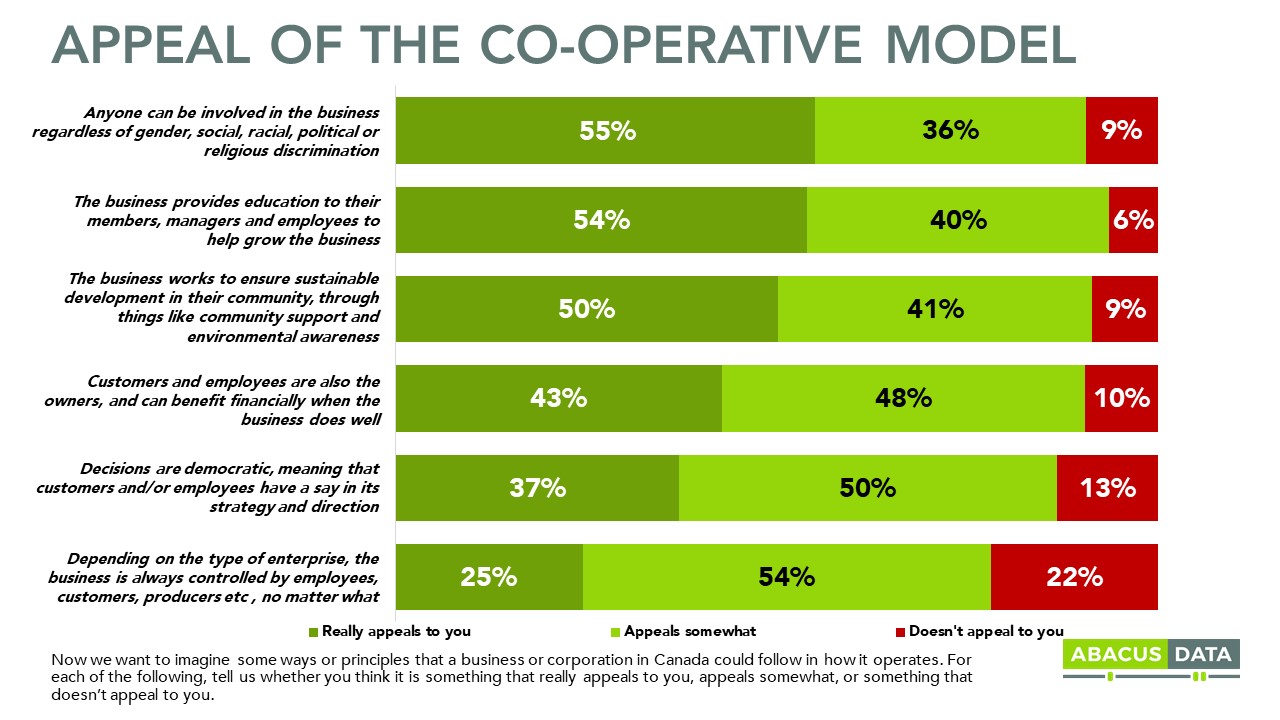
In the survey, we showed respondents six pillars of the co-operative model to gauge reaction to them. Overall, all six appeal to people but principles focused on inclusiveness, community impact, financial ownership, and membership control are particularly appealing.
Our research also finds that a clear majority of Canadians (57%) have a deep connection to the same values of the co-operative and mutual sector. Among this group, almost all like to support local whenever they can, they want a say in how the place they work runs, agree that those who support or work in a business should benefit from its success, and agree that when people cooperate to address what they need, it produces better outcomes.
We call these Canadians co-operators. They are the primary target for co-operatives to grow and expand.
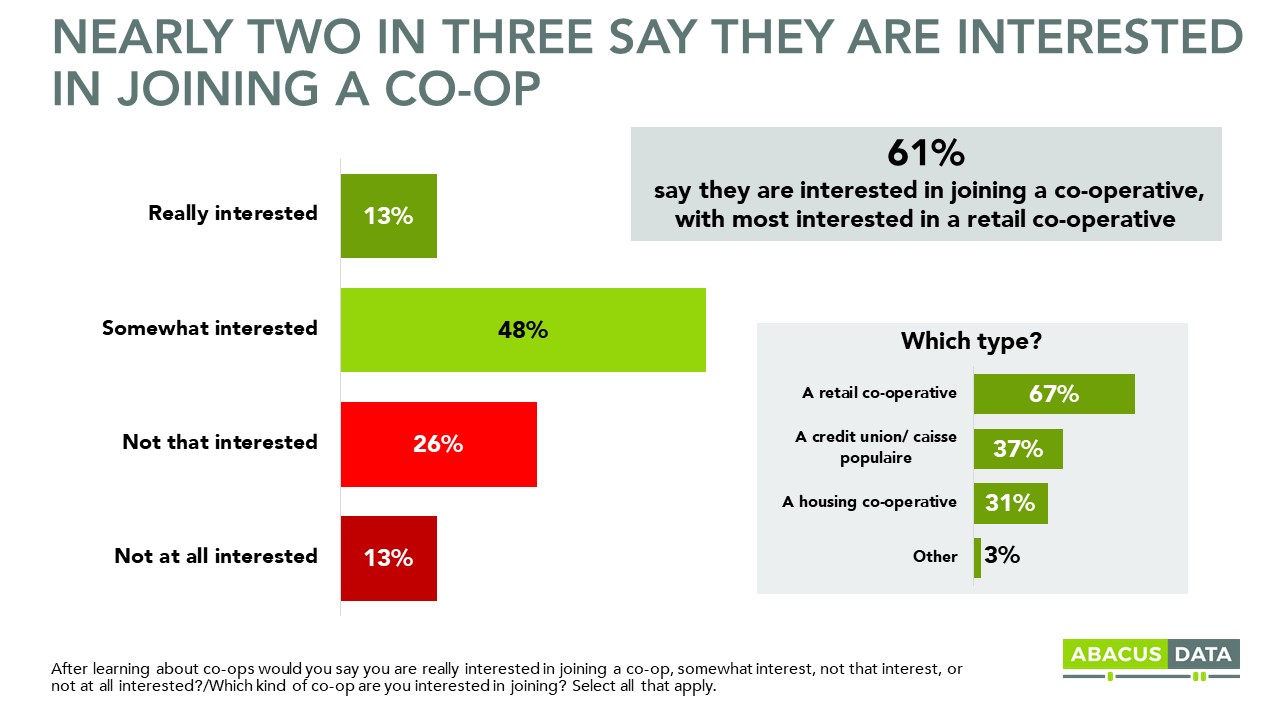
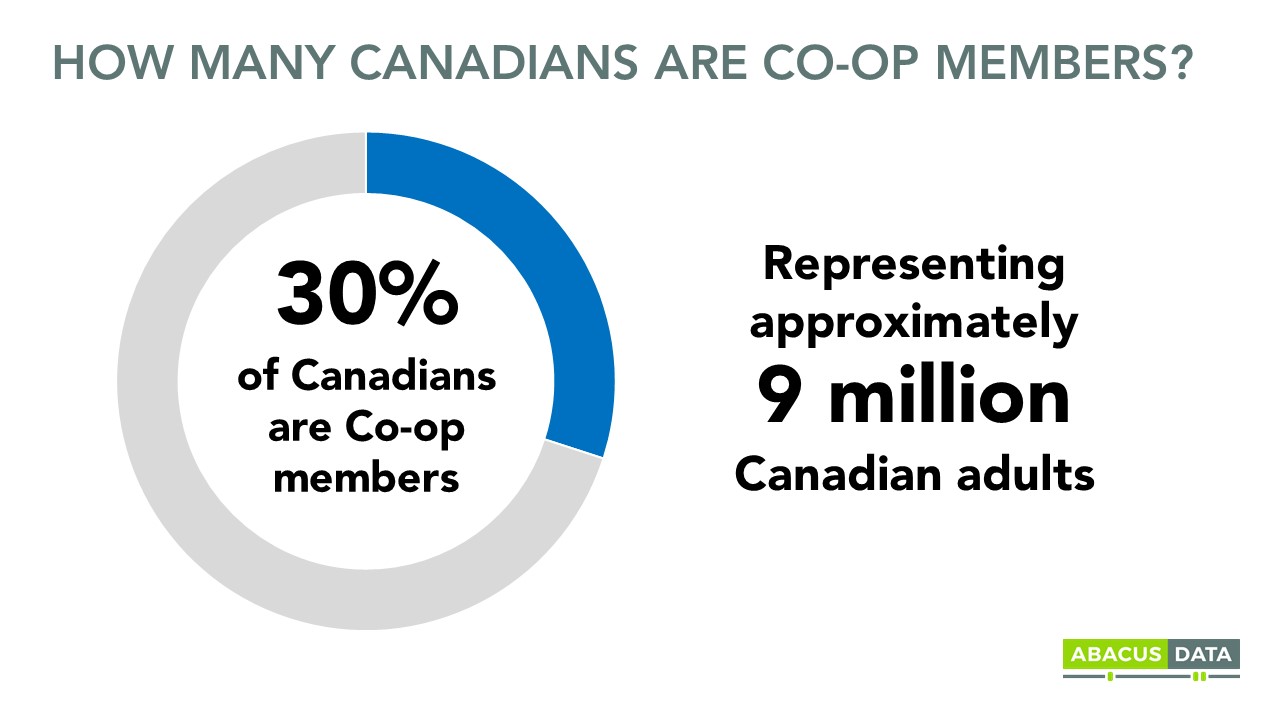
Overall, 1 in 3 Canadian adults are currently a member of a co-operative, and, of those who are not currently a member, 61% of them say they are interested in joining a co-operative.
Among those who share co-operative values, the opportunity for co-operative growth is even more clear and substantial:
37% of Canadian adults or approximately 10.7 million people are not co-operative members but should be, based on their values and intent to join a co-operative. This is the co-operative opportunity.
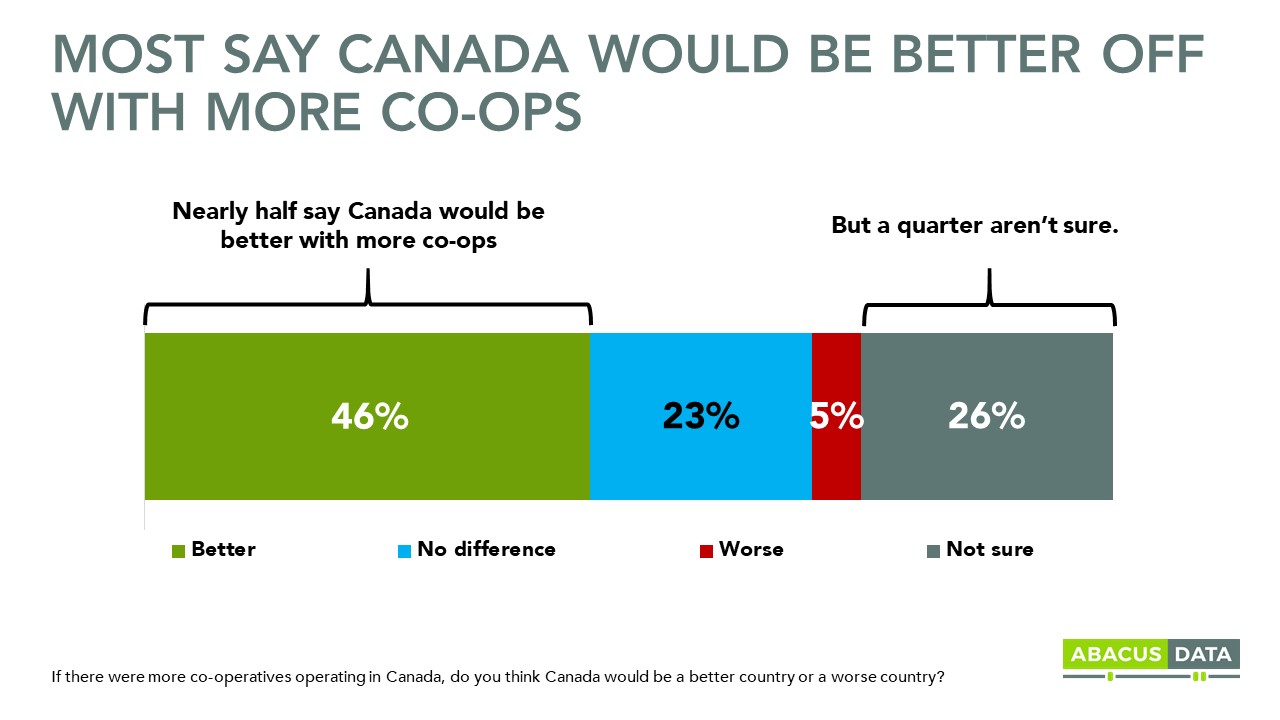
More significantly, nearly half of Canadians say the country would be better off if more co-operatives were in operation while only 5% felt things would be worse off.
CO-OPERATIVES ARE A SOLUTION TO POLITICAL DIVISION
At the same time that co-operatives can empower people and communities, they may also heal political division by uniting Canadians from different political orientations.
In our study, we identified four unique ideological groups in Canada based on responses to a set of questions. Members of these groups share a common worldview which informs their views about politics, society, and public policy.
The largest group at 33% of the population is what we term the populists. They are by far the most skeptical of elite decision-making, they are pessimistic about the future, and most resistant to change. They believe the economic system is highly rigged against them and they see immigration as a threat.
The second largest group (28% of the population) is the Progressives. They are the most open-minded and forward-looking but worry about the future. They believe climate change is a crisis, that inequality is pervasive in society and the economy, and that government is a force for good. They also deeply value collaboration and co-operation.
Similar in size to the Progressives, Classic Liberals (27%) see the good that government can do and are generally progressive on social issues but different in their view on inequality and their outlook on the future. They see change as a positive, something to be embraced and feel the future is bright. They are also more open to private-sector solutions.
Finally, at 12%, Classic Conservatives, are market-driven and see less of a role for the state in many aspects of life. They are therefore suspicious of government and worry about the coercive power of the state. They are skeptical about change, worried about the future, but less concerned about economic inequality. Most don’t consider climate change to be a serious threat.
Here is what our research tell us about how co-operatives can engage and unite them:
1. Populists and progressives are the most likely to feel a sense of powerlessness. They also overwhelmingly agree that the economic system is rigged against them. The co-operative business model has a solution to those who seek more control and influence in decisions both micro and macro.
2. Populists and classic conservatives are more concerned about the decline of small-town communities. Co-operatives have a long history of serving smaller communities, while many other types of businesses don’t. Co-operatives bring jobs, financial resources, and energy to small and rural communities.
3. Progressives, classic liberals and populists are concerned about climate change and feel that corporations today are not sincere in their efforts to tackle the climate emergency. Co-operatives are committed to sustainable business practices and making decisions that are in the best interest of the communities they serve.
4. Progressives and populists are deeply concerned about the rise of precarious and insecure work and economic inequality. They feel the rich and powerful have too much influence over political decisions. The co-operative business model has a solution to those who seek better and inclusive working conditions, good wages, and economic justice.
The research clearly suggests co-operatives can unify disparate political groups – those who are normally on opposite sides of issues – by addressing the concerns that they have and offering the co-operative model as an alternative.
But to achieve this unity, more Canadians need to be aware and understand the co-operative business model and see it as a viable alternative to other models.
CO-OPERATIVES REMAIN LARGELY UNKNOWN TO MANY CANADIANS
The co-operative model is not well understood by most Canadians. Only 10% say they are very familiar with the co-operative business model with another 37% saying they are pretty familiar. Our exploratory focus groups conducted before the survey identified this as well.
The lack of familiarity expresses itself in a general lack of understanding of some core facts about co-operatives and how they compare to other types of businesses. While most know that when a co-op makes a profit, the money is shared with members or invested back into growing the business, many don’t know that the co-operative model encourages a business to think about the long-term. Many think co-operatives are just small businesses, or that co-operatives are less efficient than other businesses.
Most striking, 3 in 4 Canadians are unaware that the largest financial institution in Quebec, The Desjardins Group, is a co-operative, including half of Quebec residents.
But despite the weak understanding of co-operatives, a plurality of Canadians thinks that if more co-operatives were operating in Canada, the country would be a better place. Only 5% think it would be worse off.
3 IN 10 CANADIANS ARE ALREADY BENEFITING FROM THE CO-OPERATIVE MODEL.
Approximately 9 million adult Canadians (or 30% of the adult population) report being a member of a co-operative. Another 15% may be a member but are unsure (representing another 4.4 million people).
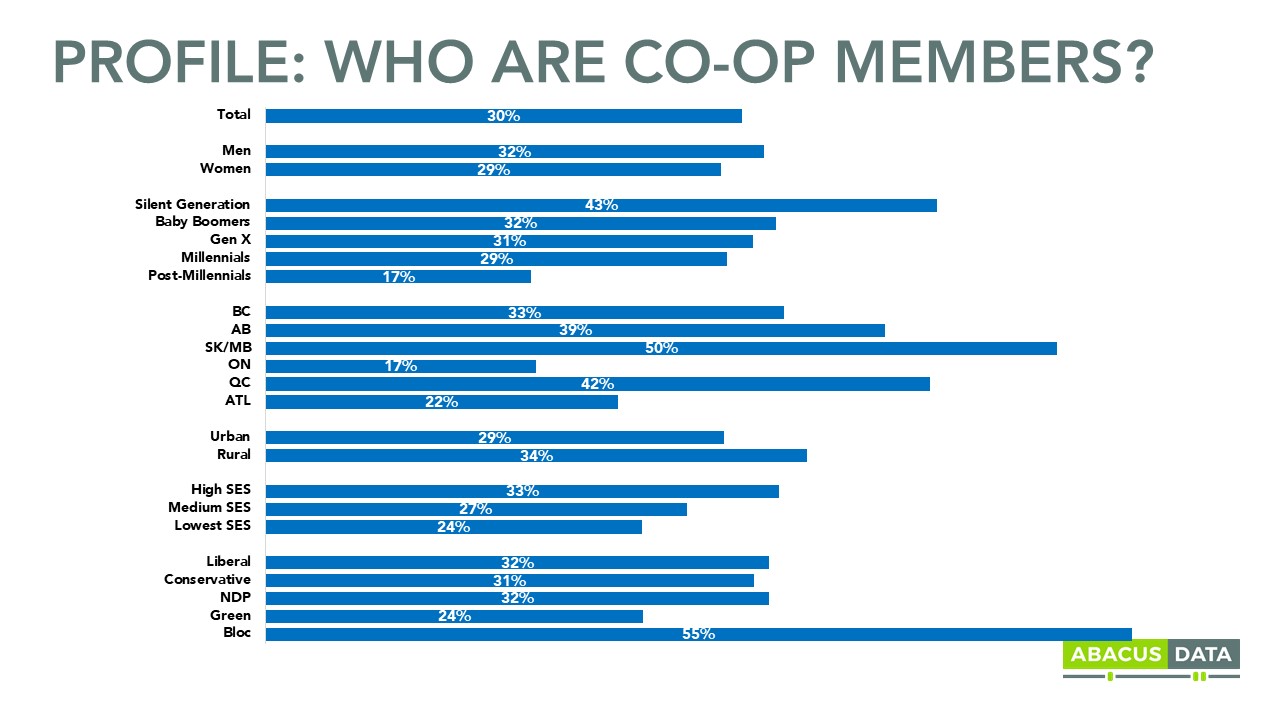
17% of Canadians report being members of a credit union or caisse populaire, including 35% in Quebec. 14% report being members of a retail co-operative like MEC, a grocery store, or gas station. 3% report living in a housing co-operative. 1% report being a member of another type of co-operative.
To these members, co-operatives every day provide products and services they rely on, provide meaningful employment, and/or serve their communities when other businesses sometimes won’t.
Co-operative members are:
More concentrated in Quebec and the Prairies. Slightly more likely to live in a rural community than other Canadians. Multi-generational. Equally men and women. Cross-partisan – members are Liberals, Conservatives, New Democrats, Bloquistes, and Greens.
In many ways, co-operative members are a cross-section of Canada and look, think, and behave very much like other Canadians who are not co-operative members.
But within the co-operative membership, our survey identified a subgroup of members (70%) who say they joined because they share the same values as co-operatives.
These members express views that are more consistent and co-operative in nature. They are far more likely to intensely agree that they care how: companies they support operate; that when people co-operate to address what they need, it produces better outcomes; and most importantly, that companies should care about the community they operate in.
Co-operative members are also more likely to say most people can be trusted and slightly less likely to feel the economic system is rigged against them.
CONVERTING THE CO-OPERATIVE POTENTIAL
As mentioned previously, approximately 8.7 million adult Canadians (or 30% of the adult population) report being a member of a co-operative. Another 10.7 million share co-operative values but are not members. That means there’s a potential audience of 19.4 million or 2 in 3 Canadian adults or who could participate in the Co-operative and Mutual Sector.
THE UPSHOT
There is an unease about the future in Canada. Many feel the economic and political system is not working for them. That unease is tied to concerns about inequality, the concentration of economic and political power in a few hands, and the impacts of climate change on their lives. To many, they seek control in their lives and feel isolated from the power structures – whether at their place of work or with the institutions (public or private) they interact with. In short, they feel helpless and isolated.
The alternative is a more democratic and empowered life. One in which more people have a say in how their workplace operates, in how the organizations they rely on and interact with on a daily-basis are run, and in how government decisions are made.
Co-operatives are well placed to offer Canadians of diverse backgrounds and political orientations a solution to this uncertainty by empowering members, employees, and suppliers to benefit from success and influence decisions.
Already one in three Canadians are co-operative members. They are young and older, male and female, Liberal, Conservative, New Democrat, Greens and the Bloc. Co-operative members reflect the diversity of Canada. They live in all parts of Canada, in our largest cities, and most remote communities.
But while many are already engaged in a co-operative, the opportunity for growth is even greater. Millions share the same values of the co-operative model. Millions are interested in learning more and joining a co-op. And half the country thinks Canada would be better off with more co-operatives.
In the age of uncertainty, co-operatives appear to be a solution; a solution to those seeking more control over their lives and a solution to division, polarization, and disagreement. Co-operation and collaboration, local community investment, and a democratic spirit of engagement are what they seek – are co-operatives the solution?
METHODOLOGY
Our survey was conducted online with 5,000 Canadians aged 18 and over from October 15 to 21, 2019. A random sample of panellists was invited to complete the survey from a set of partner panels based on the Lucid exchange platform. These partners are double opt-in survey panels, blended to manage out potential skews in the data from a single source.
The margin of error for a comparable probability-based random sample of the same size is +/- 1.4%, 19 times out of 20. The data were weighted according to census data to ensure that the sample matched Canada’s population according to age, gender, educational attainment, and region. Totals may not add up to 100 due to rounding.
The general population sample yields a sample of 1,463 co-operative members.
ABOUT ABACUS DATA
We are the only research and strategy firm that helps organizations respond to the disruptive risks and opportunities in a world where demographics and technology are changing more quickly than ever.
We are an innovative, fast-growing public opinion and marketing research consultancy. We use the latest technology, sound science, and deep experience to generate top-flight research-based advice to our clients. We offer global research capacity with a strong focus on customer service, attention to detail and exceptional value.
We were one of the most accurate pollsters conducting research during the 2019 Canadian Election.
Abacus Data Bulletins are short analyses of public opinion data we collect. For more information or media interviews, contact Bruce Anderson or David Coletto.
Data gathered over the last several days describes some of the ways Canadians have been responding to the Coronavirus.
Yesterday we documented a series of avoidance behaviours, today some additional behavioural changes.
Here are some highlights:
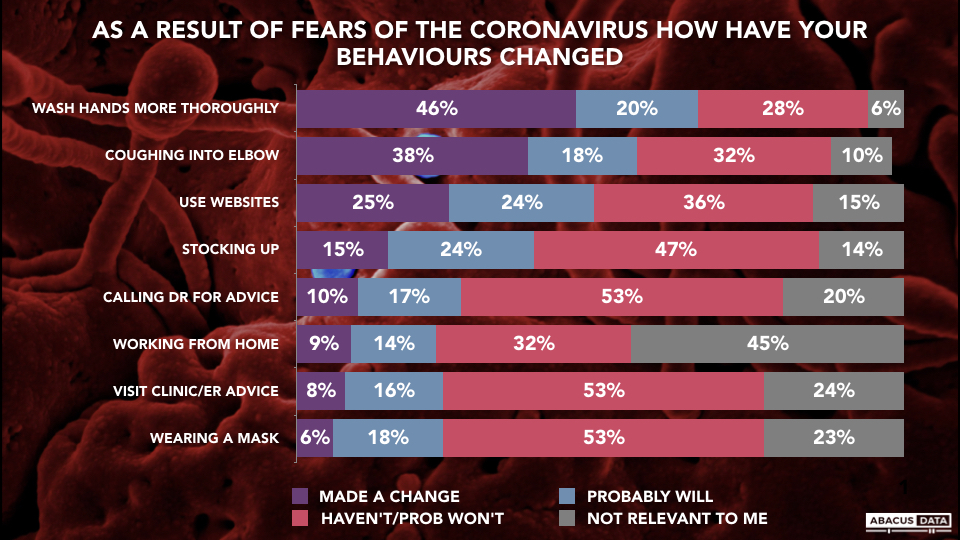
While two of out three say they have or will wash hands more thoroughly, a quarter of Canadians are resisting this advice. Half say they are or will cough into their elbow, while a third doubt they will adopt this behaviour.
A quarter is using websites to find out more about the virus, 10% have already called a doctor for advice, and almost as many 8% have visited a clinic of the ER for advice. Twice that many say they will probably visit a clinic or ER for guidance. 15% of Canadians say they have been stocking up on supplies and another 24% say they probably will do so.
9% say they have been working from home rather than a regular workplace. Among those for whom the place of work is relevant, more than a third say they are or probably will find themselves working from home.
6% say they have been wearing a mask and 3 times as many say they probably will.
Analyzing results based on location or demographics reveals a few things:
Even though older people are more at risk due to the nature of this virus, in most cases they are no more likely than younger people to be taking steps to limit their risk. We do see a higher incidence of behaviour change among women compared to men, and there is markedly higher behaviour change among residents of Canada’s three largest cities (Vancouver, Montreal, and Toronto).
THE UPSHOT
According to Bruce Anderson: ”While many people have already begun taking routine steps to help protect themselves or others from the spread of Covid-19, there remain many people who do not see a need to change. More constant and persuasive advocacy is probably needed. These numbers also show that doctors, clinics and ER’s can expect continued rising pressures which will stress systems significantly. Telework is already ramping up and will likely expand. Stores that have experienced a run on goods should probably anticipate more of the same, as long the arc of stories about the virus continues in the same direction.”
METHODOLOGY
Our survey was conducted online with 1,500 Canadians aged 18 and over from March 3 to 6, 2020. A random sample of panelists was invited to complete the survey from a set of partner panels based on the Lucid exchange platform. These partners are double opt-in survey panels, blended to manage out potential skews in the data from a single source.
The margin of error for a comparable probability-based random sample of the same size is +/- 2.1%, 19 times out of 20. The data were weighted according to census data to ensure that the sample matched Canada’s population according to age, gender, educational attainment, and region. Totals may not add up to 100 due to rounding.
ABOUT ABACUS DATA
We are the only research and strategy firm that helps organizations respond to the disruptive risks and opportunities in a world where demographics and technology are changing more quickly than ever.
We are an innovative, fast-growing public opinion and marketing research consultancy. We use the latest technology, sound science, and deep experience to generate top-flight research-based advice to our clients. We offer global research capacity with a strong focus on customer service, attention to detail and exceptional value.
We were one of the most accurate pollsters conducting research during the 2019 Canadian Election.
Abacus Data Bulletins are short analyses of public opinion data we collect. For more information or media interviews, contact Bruce Anderson or David Coletto.
Given the impact that the Coronavirus appears to be having around the world, we have started tracking how Canadians are reacting and thinking about their own behaviours.
Here’s what we have found thus far:
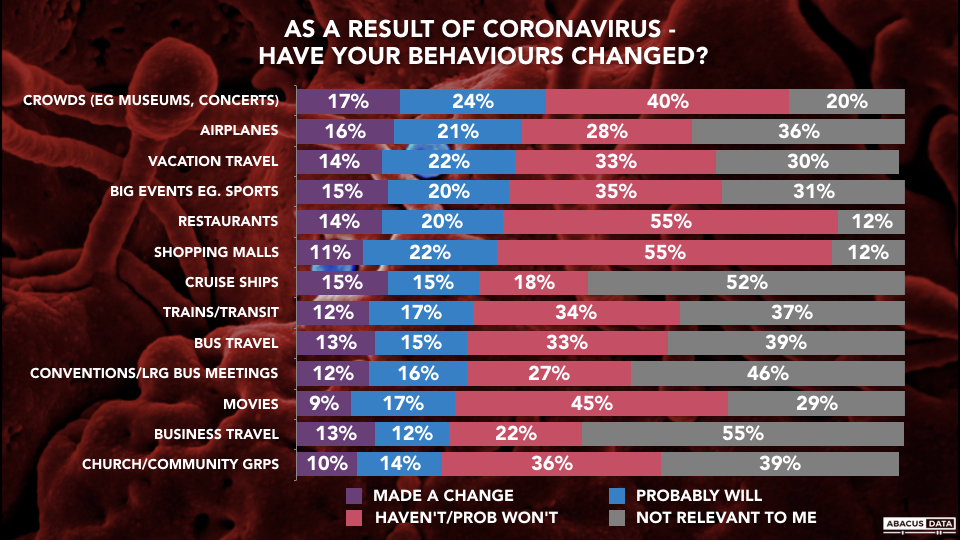
Many are avoiding places where large numbers of people congregate. About half of those who attend sports events, conventions, museums and concerts say they have or will probably limit their attendance.
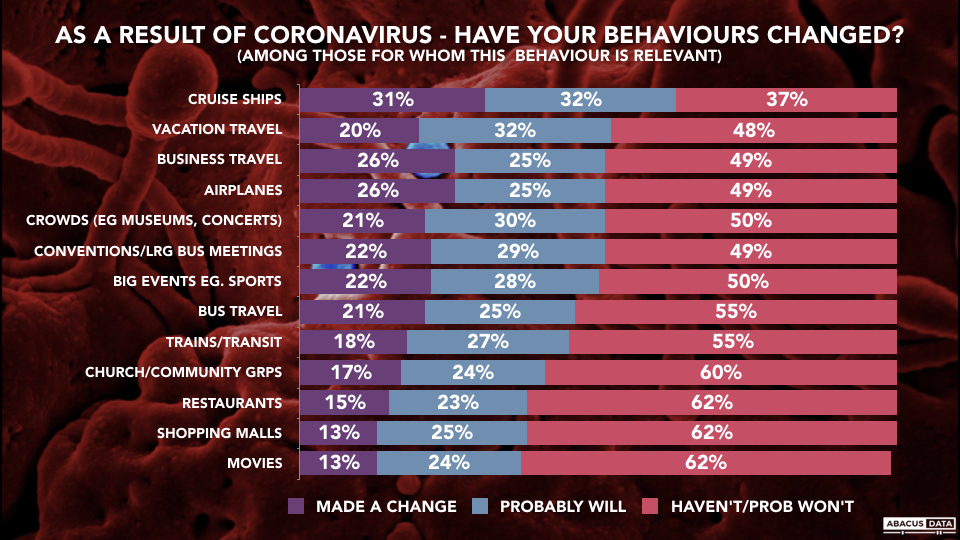
Airlines face major headwinds. 16% say they are limiting or avoiding air travel, and another 21% say they probably will. This amounts to about 10 million Canadian adults. Among business travellers 26% say they have already reduced their travel, and as many more say they probably will. The potential impact on the vacation market is of a similar size.
For cruise ships, the data are particularly challenging. Among those for whom cruise travel is part of their behaviour normally, almost 2 out of 3 customers (62%) are or will avoid cruises.
Among those who use trains and buses, more than 4 out of 10 customers indicate their usage has or will change.
In terms of the foodservice and hospitality sector, among those who use restaurants, 15% say they have reduced their use of restaurants and another 23% say they probably will.
Shopping malls have likely already experienced softer traffic with 13% of shopping mall users saying they are reducing visits. Another 25% say they probably will.
THE UPSHOT
According to Bruce Anderson: ”Non-stop comprehensive coverage of the coronavirus, likely coupled with unprecedented sharing of information over social media, has led millions to make adjustments in their daily lives. Depending on what they continue to hear about the spread of the virus and whether the risk is rising or receding, the impact could roughly double in size fairly quickly. Travel providers are likely to feel the most profound impacts, as people look to limit non-essential voyages. While airline seat demand is clearly under pressure, the cruise ship sector has a potentially even more severe, long term positioning challenge. The convention, sports, retail and hospitality sectors are likely already feeling pain and can anticipate more if the news of the virus continues to make people more anxious.”
Over the coming days, we will share more detail on how behaviour is changing, including breakdowns by different age groups and a look at how big-city dwellers compare to those who live in smaller towns and rural areas, where population density is different. Our intent is also to track these behavioural indicators over time in the weeks ahead.”
METHODOLOGY
Our survey was conducted online with 1,500 Canadians aged 18 and over from March 3 to 6, 2020. A random sample of panelists was invited to complete the survey from a set of partner panels based on the Lucid exchange platform. These partners are double opt-in survey panels, blended to manage out potential skews in the data from a single source.
The margin of error for a comparable probability-based random sample of the same size is +/- 2.1%, 19 times out of 20. The data were weighted according to census data to ensure that the sample matched Canada’s population according to age, gender, educational attainment, and region. Totals may not add up to 100 due to rounding.
ABOUT ABACUS DATA
We are the only research and strategy firm that helps organizations respond to the disruptive risks and opportunities in a world where demographics and technology are changing more quickly than ever.
We are an innovative, fast-growing public opinion and marketing research consultancy. We use the latest technology, sound science, and deep experience to generate top-flight research-based advice to our clients. We offer global research capacity with a strong focus on customer service, attention to detail and exceptional value.
We were one of the most accurate pollsters conducting research during the 2019 Canadian Election.
Abacus Data Bulletins are short analyses of public opinion data we collect. For more information or media interviews, contact Bruce Anderson or David Coletto.
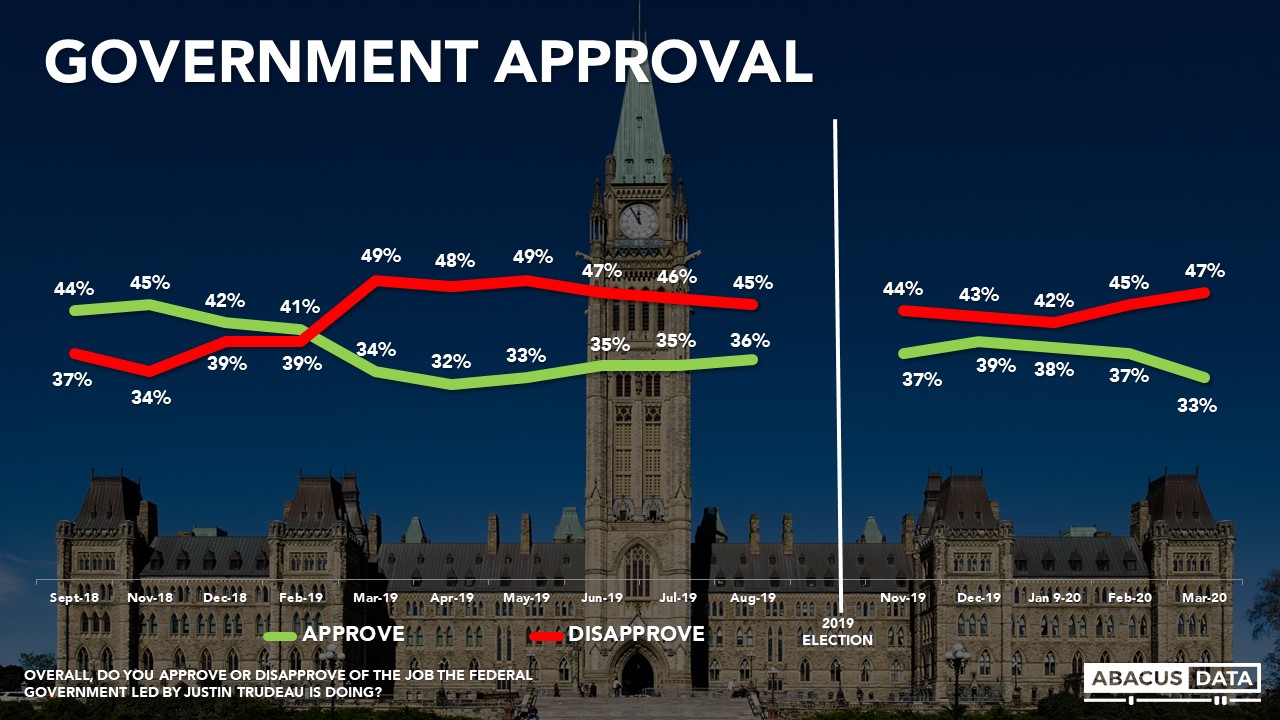
APPROVAL OF FEDERAL GOVERNMENT
Today 33% approve of the Trudeau government performance, 20% are on the fence, and 47% disapprove. Approval is down 4 points since last month and about equal where it was a year ago.
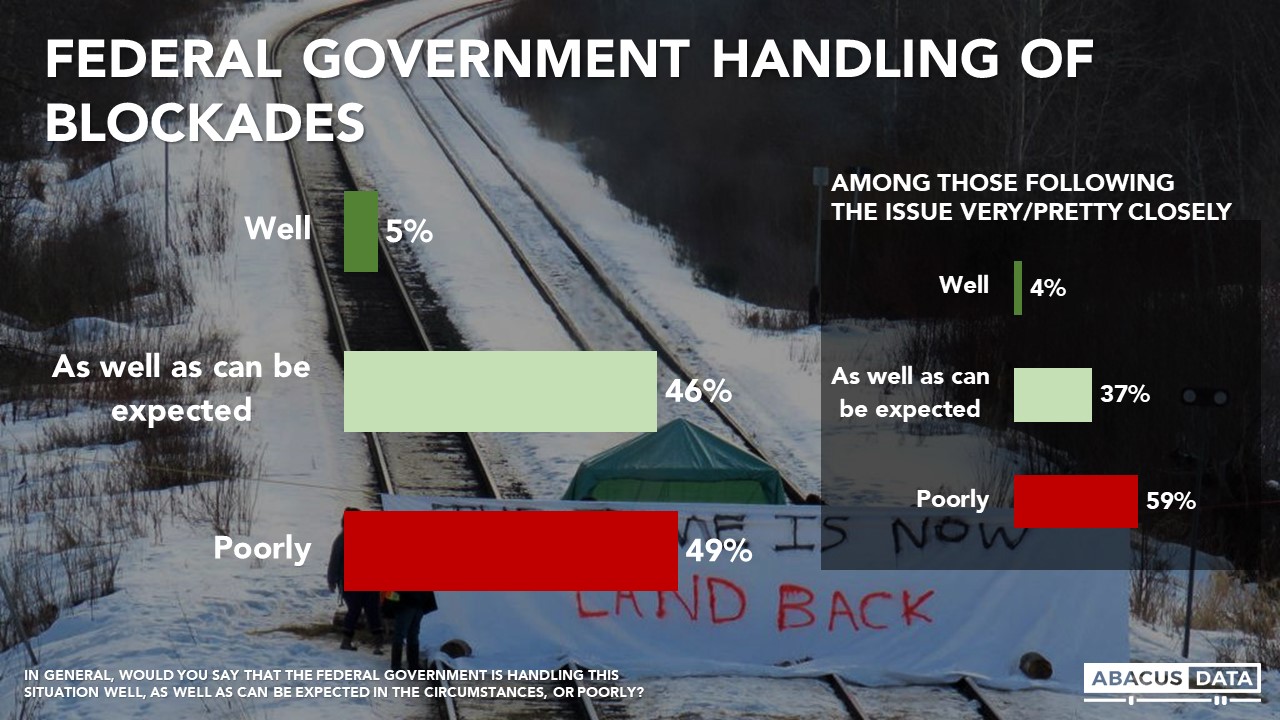
BLOCKADES
6% have been following the blockades by Indigenous protestors very closely, another 40% pretty closely. That means 44% have paid little or no attention.
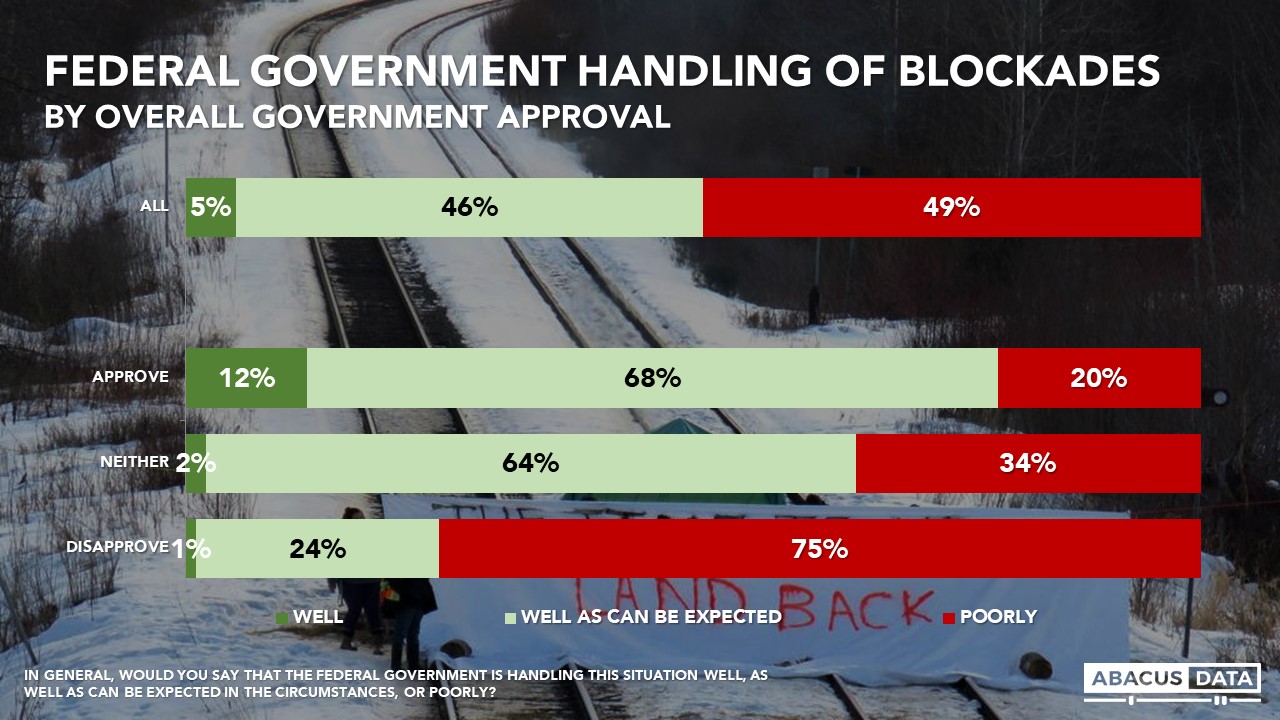
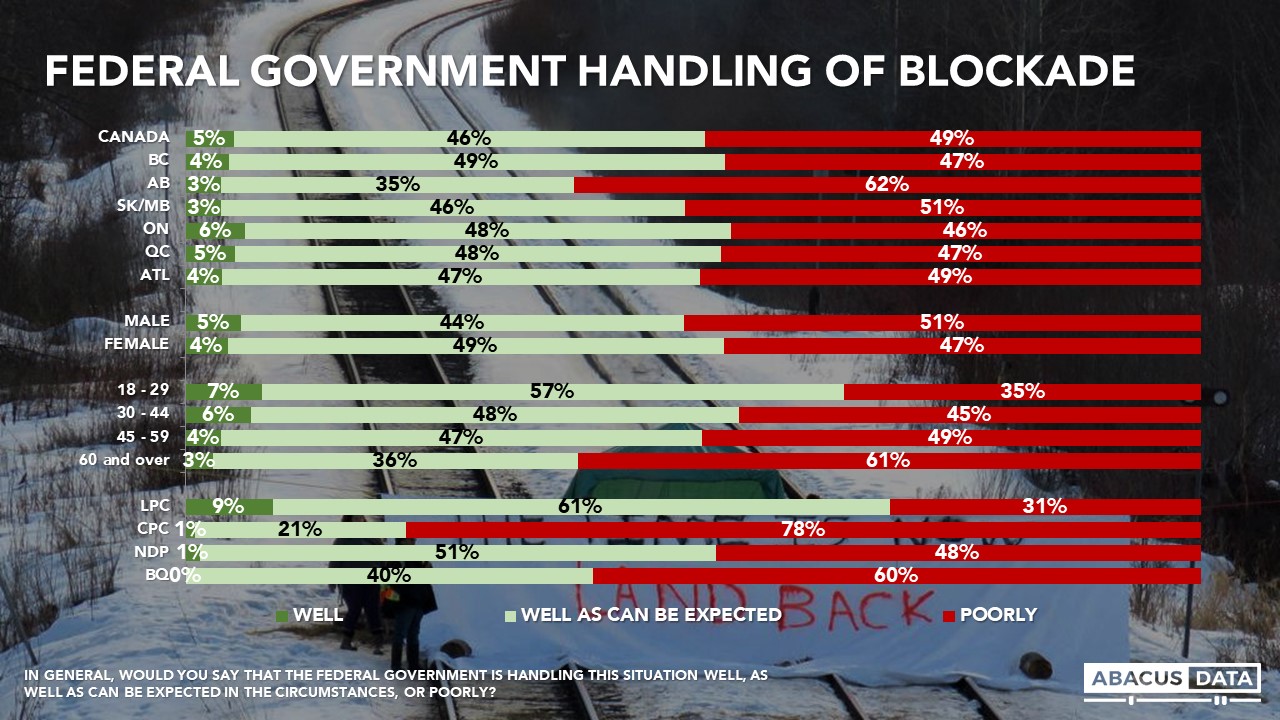
5% say the federal government has been handling the situation well, another 46% say, “as well as can be expected in the circumstances. 49% say the federal government has been doing a poor job, pretty close to the 47% who disapprove of the federal government performance generally.
Most of those who approve of the government’s overall performance also think it is handling the blockades as well as can be expected; however one in five is dissatisfied, as are one in three of those who neither approve nor disapprove of overall government performance.
In Alberta, 62% feel the federal government is handling the issue poorly, about 13-points higher than the national average. Generally, older and Conservative voters are the most unhappy with the way Ottawa has acted.
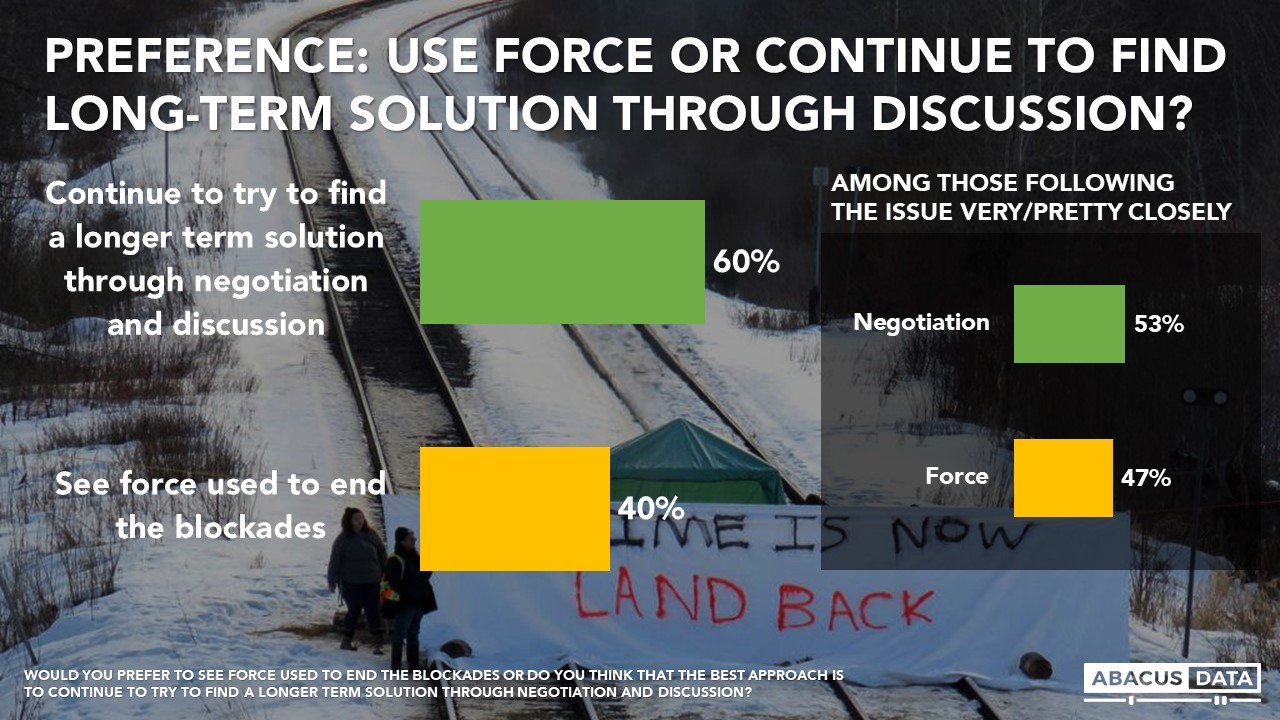
By a 60% to 40% margin, Canadians think the best approach in this situation is to “continue to try to find a longer-term solution through negotiation, rather than “use force to end the blockades.”
Albertans, older people and Conservatives are most likely to want to see force used to end the blockades.
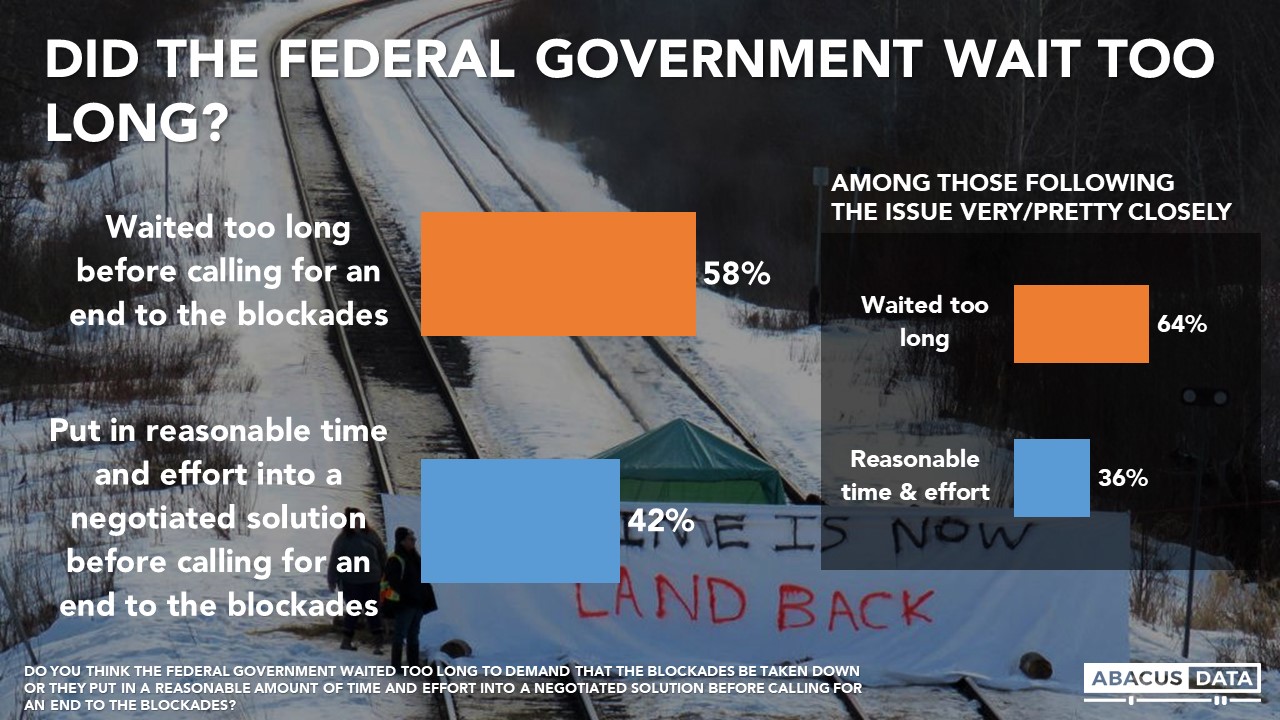
More Canadians believe the federal government waited too long to call for an end to the blockades (58%) than those who believe the government “put in reasonable time and effort into a negotiated solution before calling for an end to the blockades” (42%).
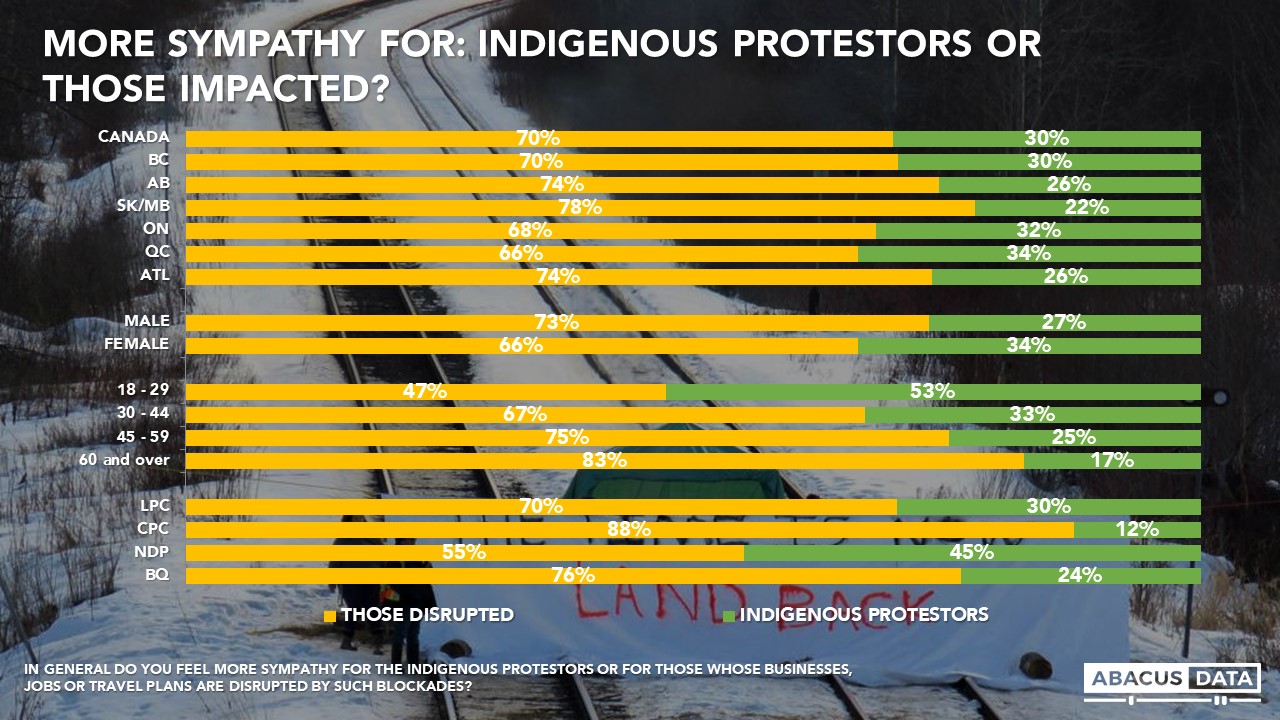
While these numbers show that Canadians prefer a negotiated solution to one that is forced, it is also clear that people feel more sympathy for all those businesses and travellers that have been disrupted (70%) than they do for the protestors (30%).
The sharpest divide is by age with those aged 18 to 29 being most likely to say they feel more sympathy for the indigenous protestors, while older Canadians are more likely to feel sympathy for those impacted by the blockades. NDP voters are split almost evenly while Liberal, Conservative, and BQ supporters are more likely to sympathize with those disrupted by the blockades.
Finally, the Prime Minister’s decision to call a conference involving first Ministers and Indigenous leaders is seen as a good idea by 46%, acceptable by 39%, while only 13% consider it a bad idea.
THE UPSHOT
According to Bruce Anderson: ”Canadians are mostly unhappy with the use of these blockades although they recognize that there are legitimate, unresolved issues that require an effort to defuse rather than ratchet up. While there is some frustration that the government might have acted more quickly, the general view is that a long term agreement is a more desirable outcome than using force to end a protest, only to have these issues persist in the future.”
According to David Coletto: “Canadians are not as engaged on this issue as they are with the coronavirus, but compared to others we have explored in the past, there is a fair bit of attention being paid to the blockades. While Canadians are split on the federal government’s handling of the issue, disapproval is in line with overall feelings about the federal government’s performance. That being said, 31% of 2019 Liberal voters feel the government is handling the issue poorly, higher than we typically see from the government’s supporters on other issues.”
METHODOLOGY
Our survey was conducted online with 1,475 Canadians aged 18 and over from February 28 to March 3, 2020. A random sample of panelists was invited to complete the survey from a set of partner panels based on the Lucid exchange platform. These partners are double opt-in survey panels, blended to manage out potential skews in the data from a single source.
The margin of error for a comparable probability-based random sample of the same size is +/- 2.1%, 19 times out of 20. The data were weighted according to census data to ensure that the sample matched Canada’s population according to age, gender, educational attainment, and region. Totals may not add up to 100 due to rounding.
ABOUT ABACUS DATA
We are the only research and strategy firm that helps organizations respond to the disruptive risks and opportunities in a world where demographics and technology are changing more quickly than ever.
We are an innovative, fast-growing public opinion and marketing research consultancy. We use the latest technology, sound science, and deep experience to generate top-flight research-based advice to our clients. We offer global research capacity with a strong focus on customer service, attention to detail and exceptional value.
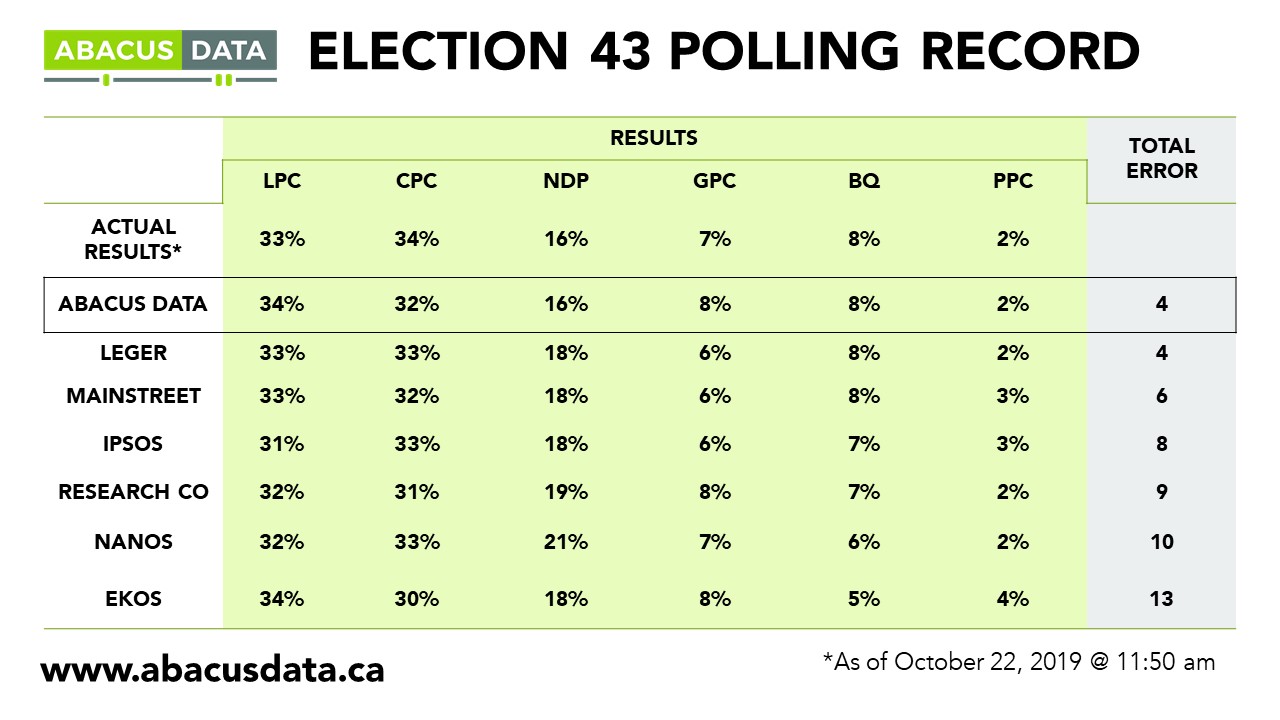
We were one of the most accurate pollsters conducting research during the 2019 Canadian Election.