Doug Ford’s image goes from very bad to impressive in less than three months.
Our team has been tracking Canadian perceptions and attitudes around the pandemic for more than two months. Last week we released new data on how the pandemic was impacting Canadian politics. Today, we turn our attention to Ontario politics.
In our most recent survey completed last weekend, we interviewed 597 Ontarians and asked them several questions about their views on the provincial government’s performance, on political leaders, and their vote intentions if an election was held at the time of the survey.
Here’s a snapshot of what we found:
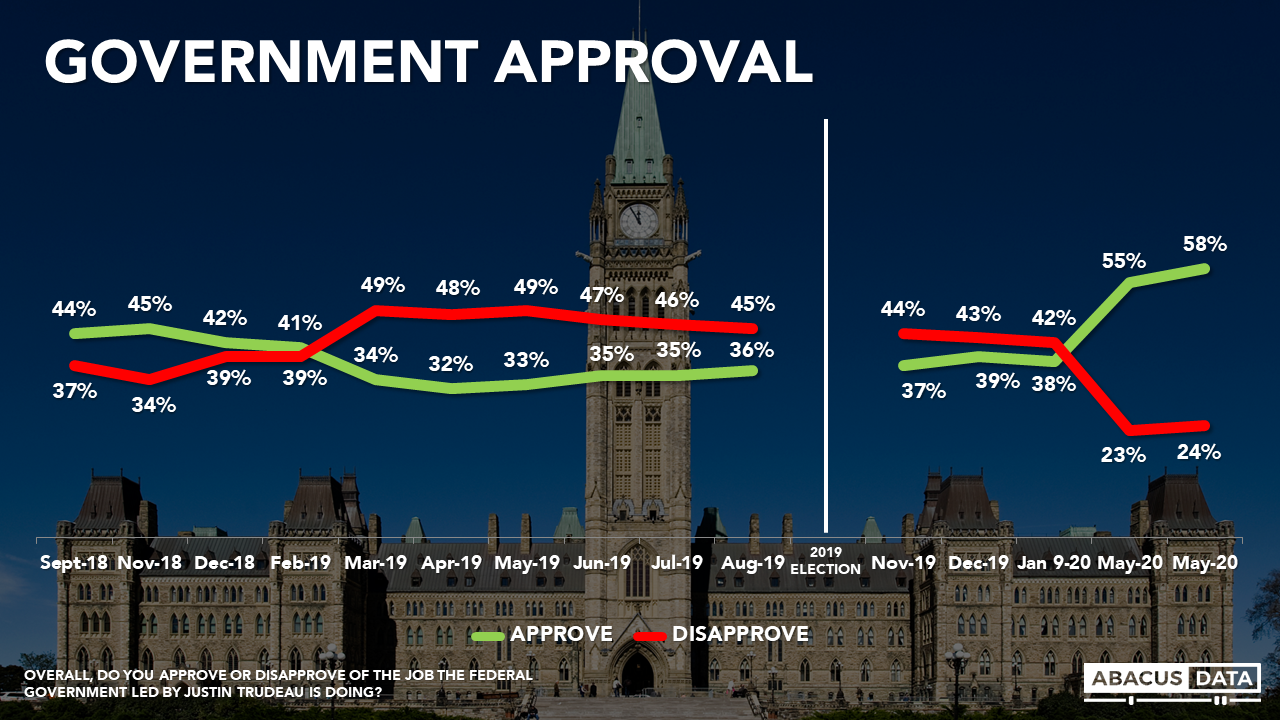
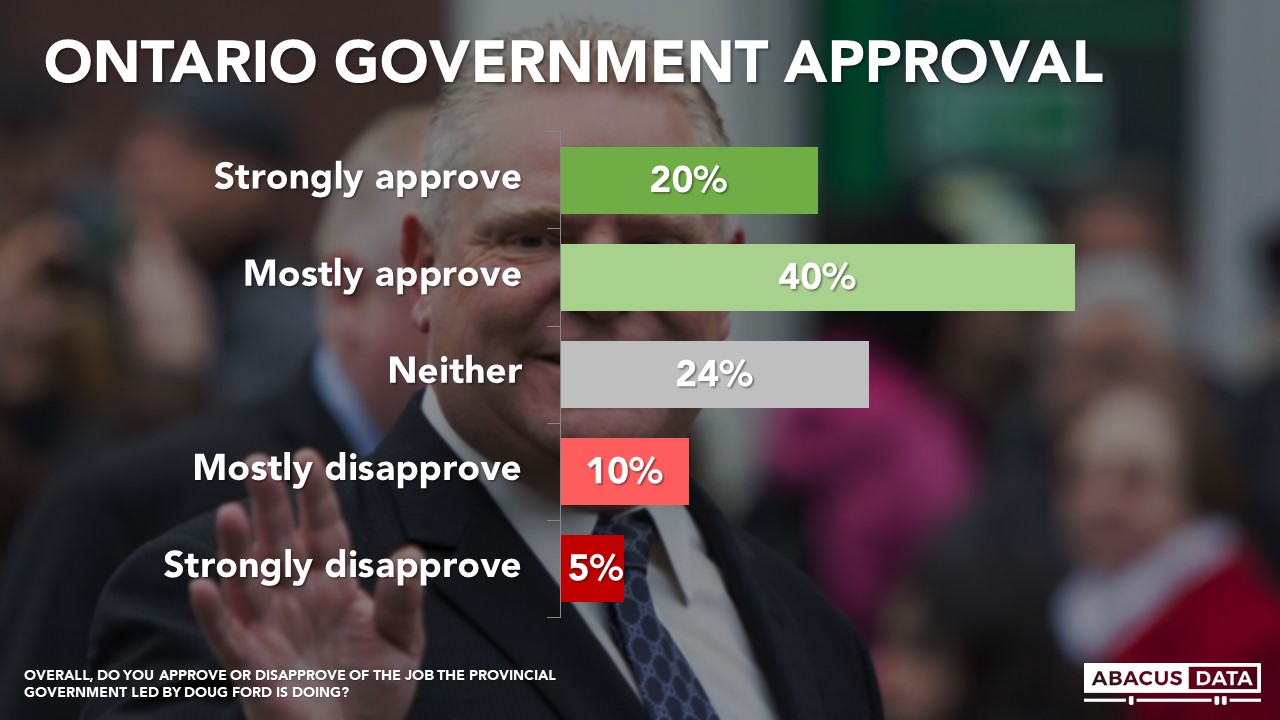
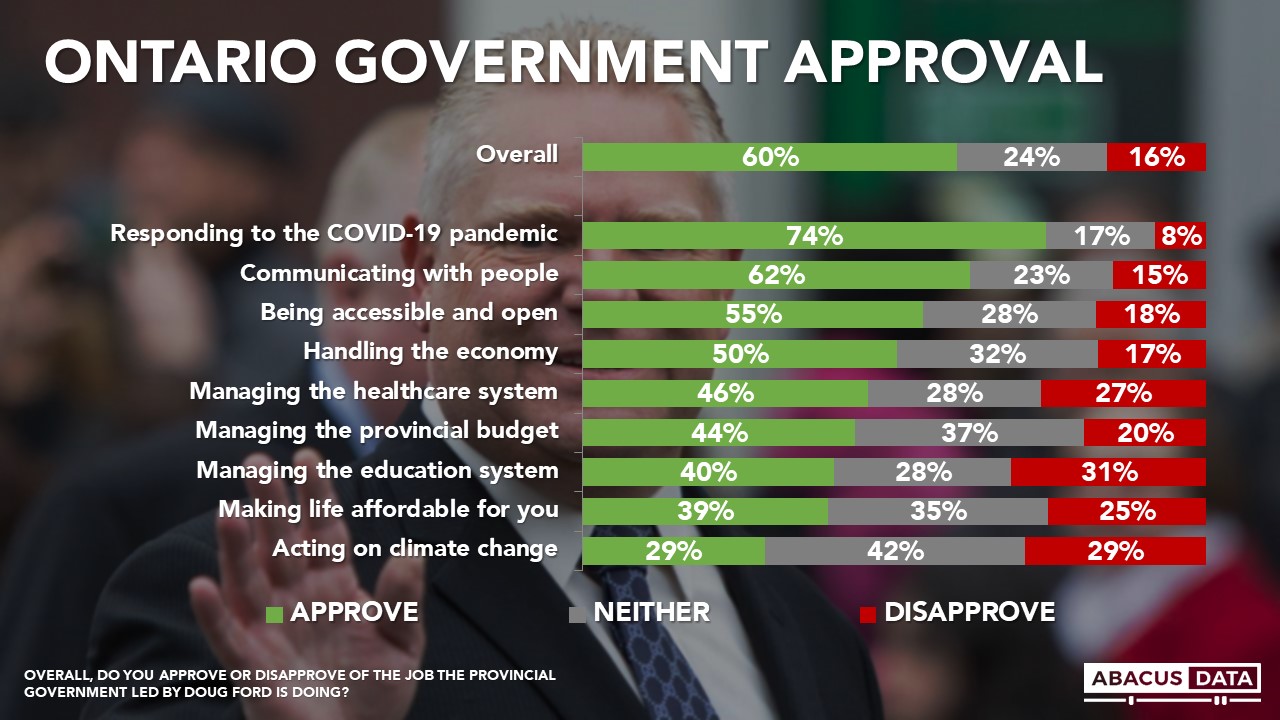
FINDING #1: 60% of Ontarians approve of the job performance of the Ontario provincial government. 15% disapprove.
FINDING #2: Ontarians rate the government’s performance in most areas positively. But its performance responding to the pandemic, how it has communicated with people, and its handling of the economy get the most positive reviews.
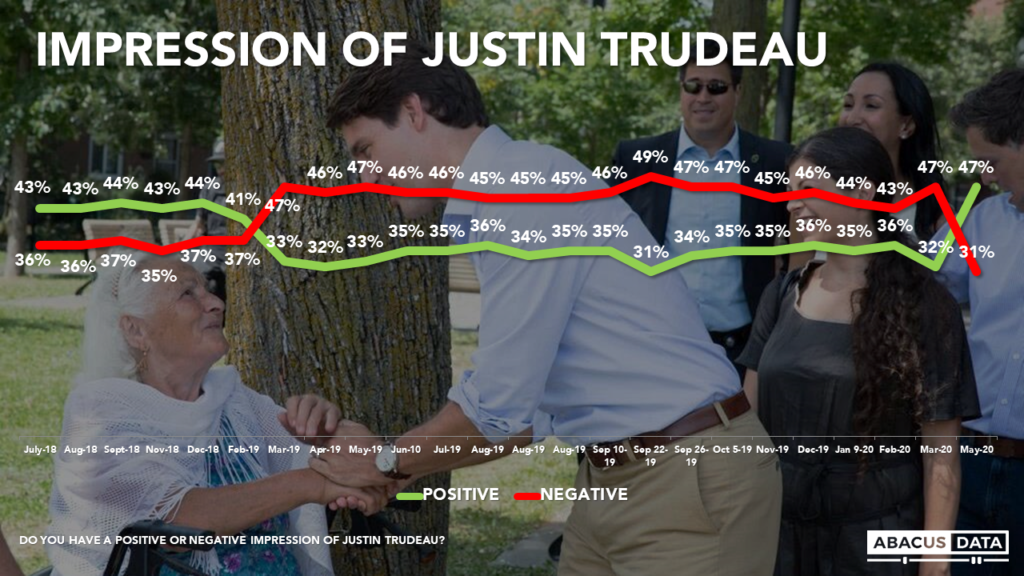
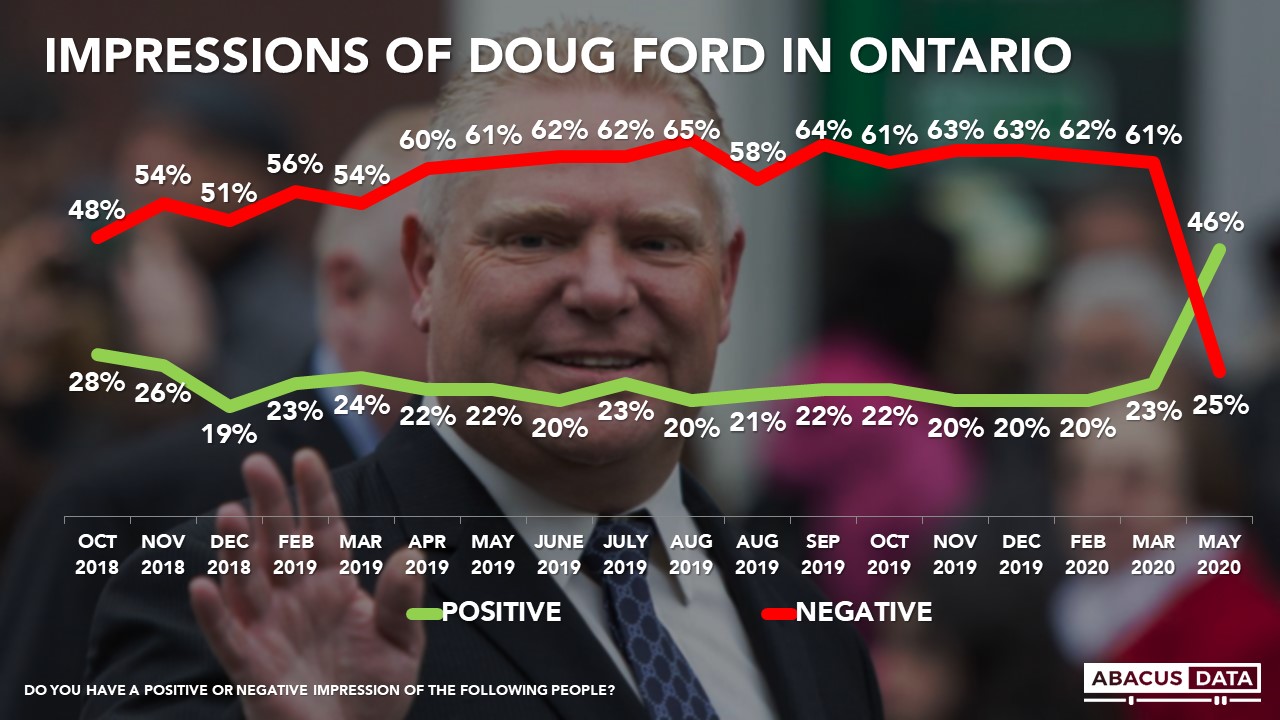
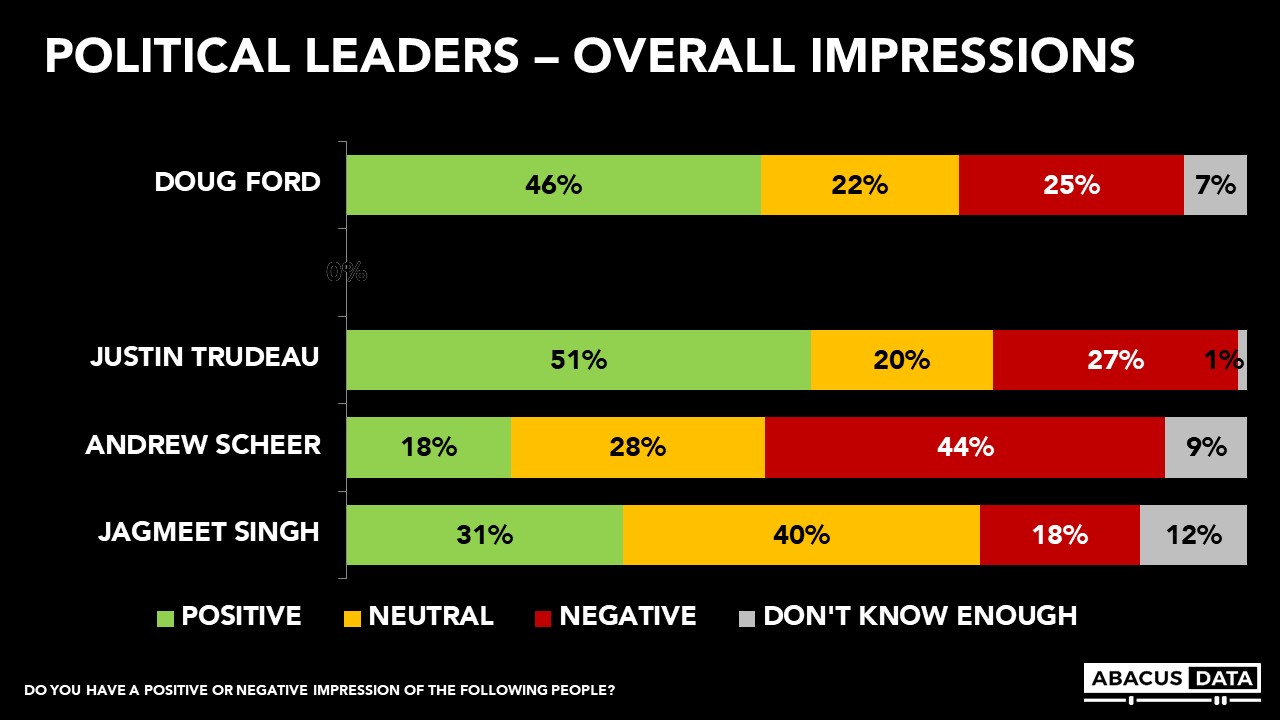
FINDING #3: Premier Ford’s personal image has improved substantially over the past two months. Today, 46% have a positive view compared with 25% negative.
From the end of 2018, throughout 2019, and into early 2020, most Ontarians had a negative impression of Doug Ford with only about 1 in 5 having a positive impression. Since early March, the Premier’s positive ratings have doubled, from 23% to 46% while his negatives have dropped 36-points, from 61% to 25%.
FINDING #4: NDP leader Andrea Horwath has a net positive image while new Liberal leader Steven Del Duca is largely unknown.

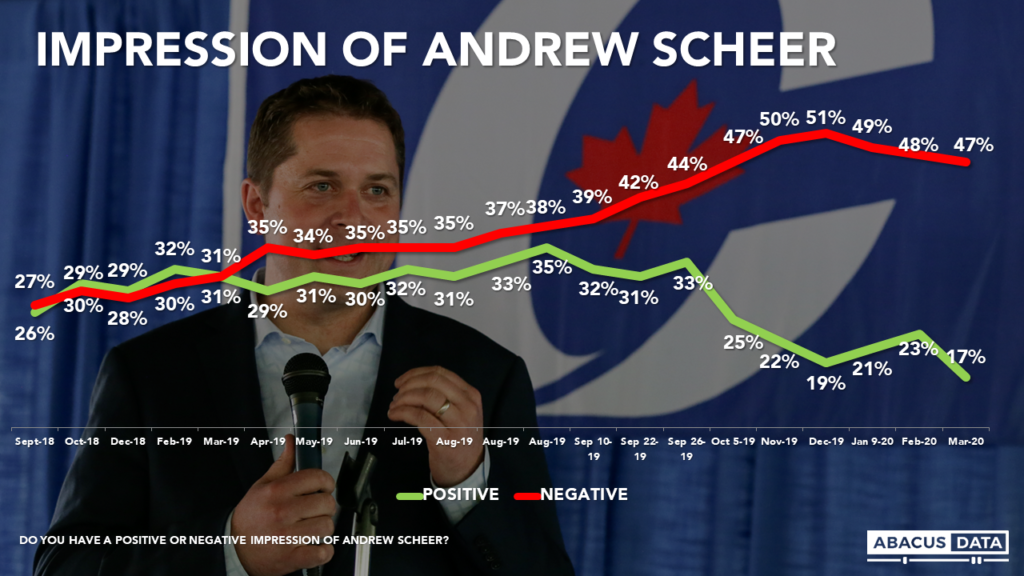
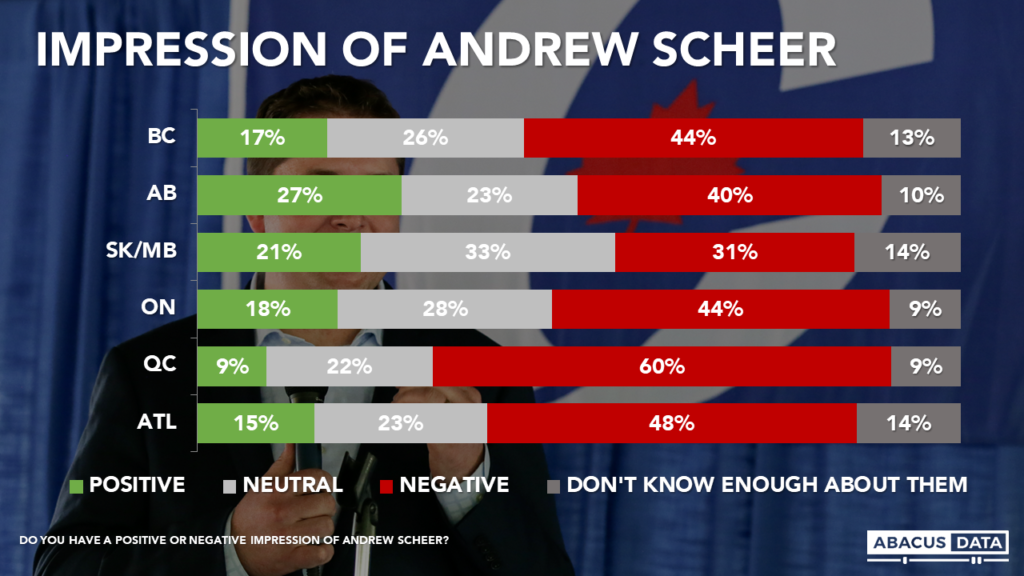
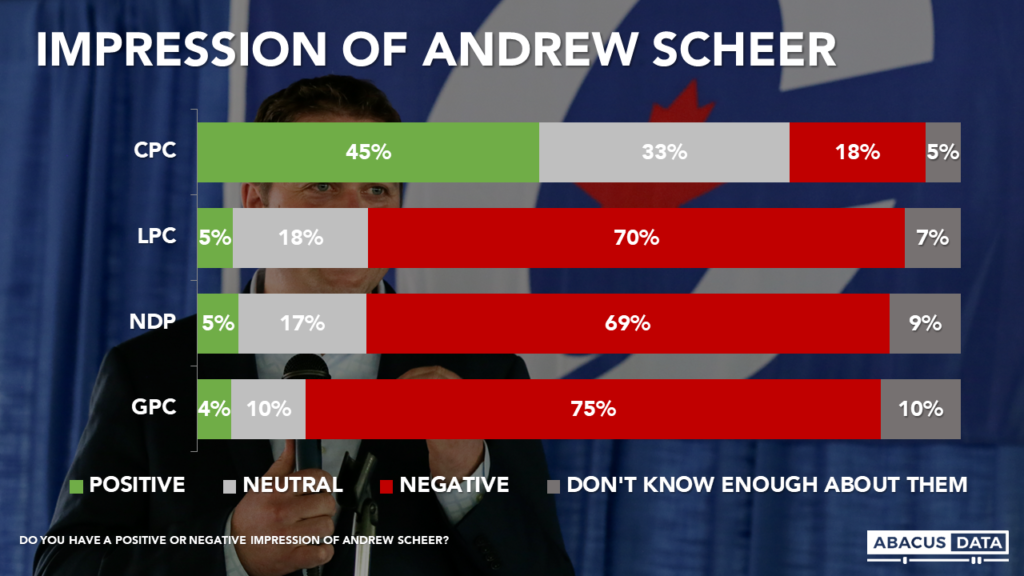
FINDING #5: Prime Minister Justin Trudeau’s personal image is also quite positive in Ontario while Andrew Scheer is viewed negatively by twice as many Ontarians than view him positively.
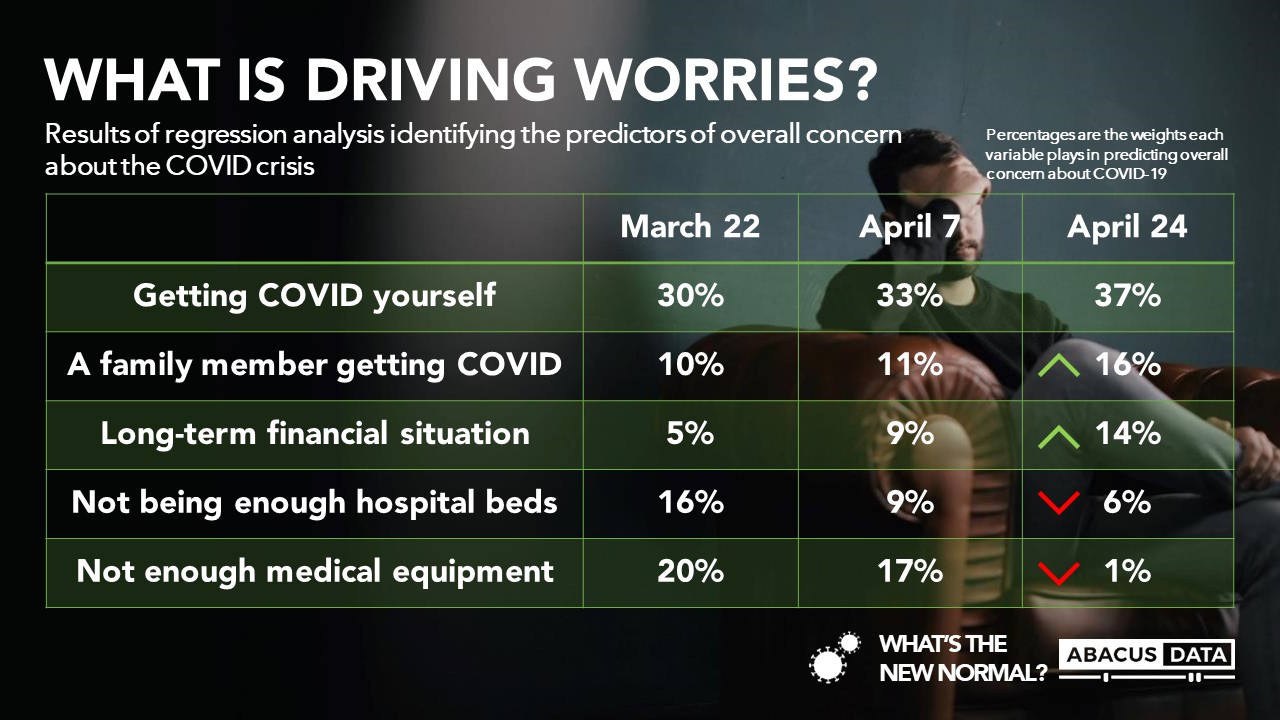
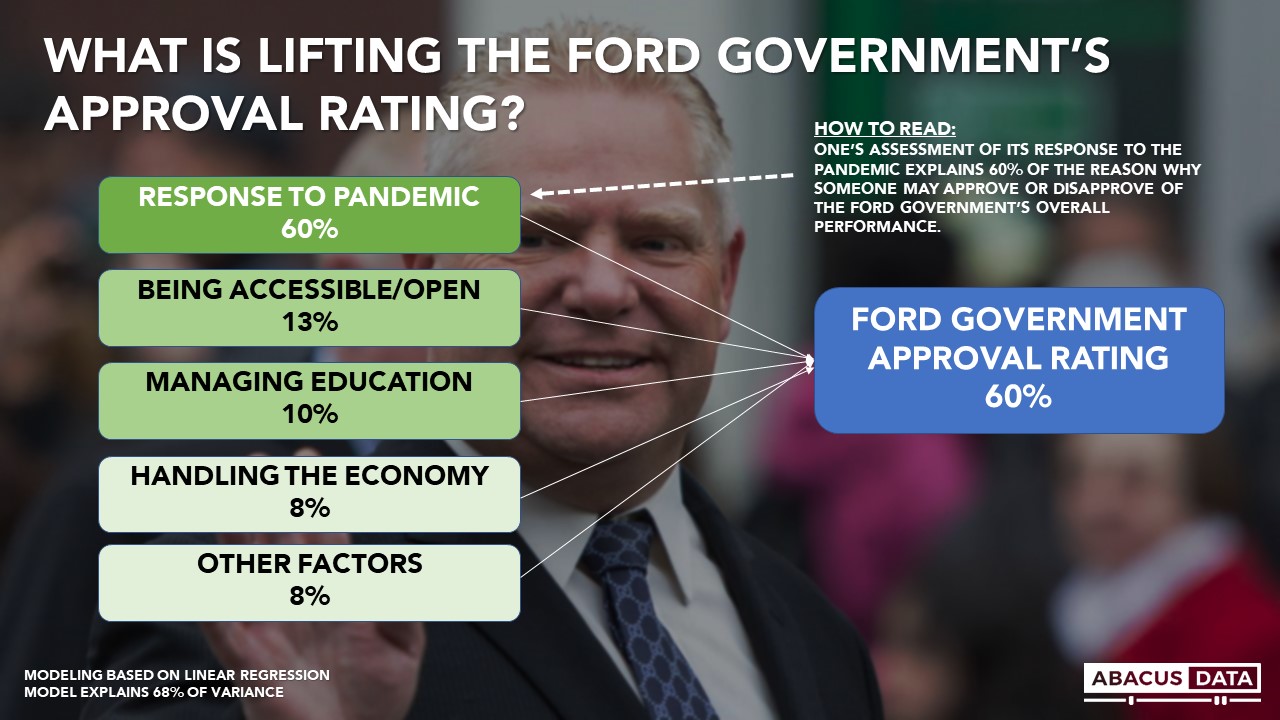
FINDING #6: The Ontario government’s response to the pandemic is the greatest driver in the government’s overall approval rating.
When we run a regression analysis of the specific policy areas against the Ontario government’s overall approval rating, we find that one’s assessment of the provincial government’s response to the pandemic explains most of the variation in one’s impression of the provincial government’s performance.
In other words, at this moment, Ontarians are rating the government’s overall performance and their views of the Premier through the lens of the pandemic. Its performance in other areas, like education, the economy, climate change, or health care are not major approval drivers.
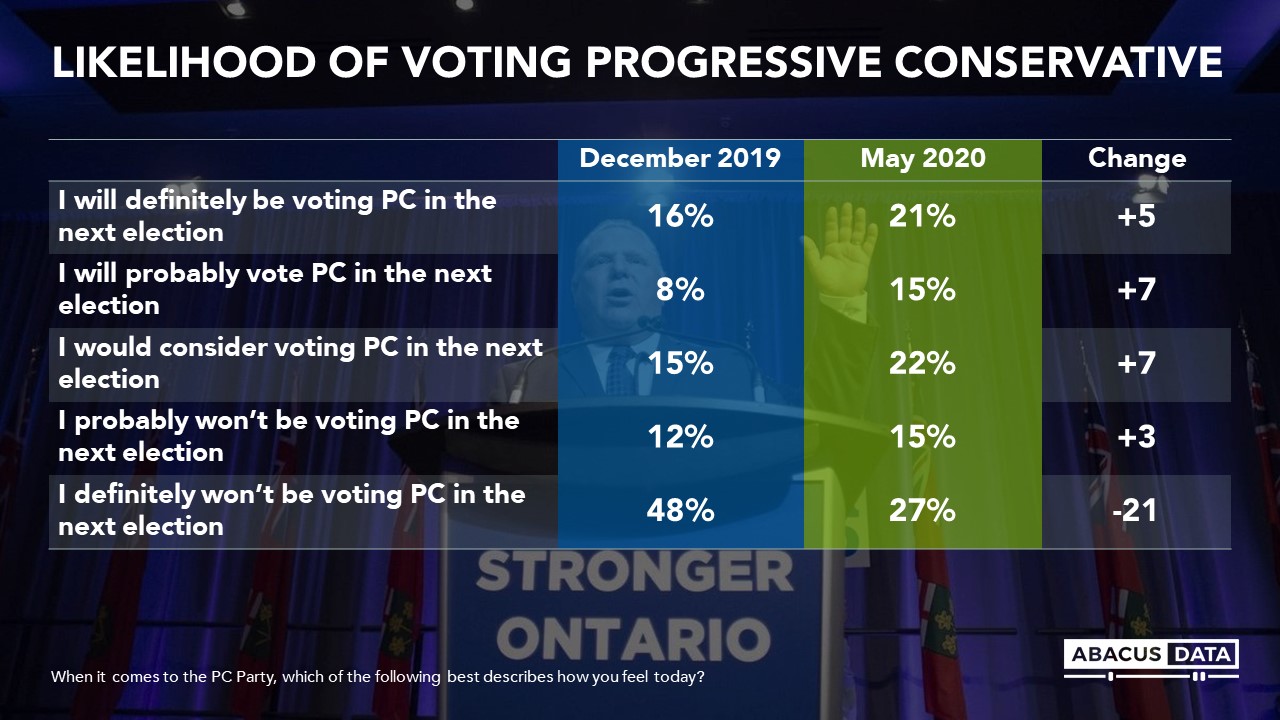
FINDING #7: Compared with December 2019, the number of accessible voters for the Ontario PC party has increased substantially. Today, 37% say they will definitely or probably vote PC in the next election while another 22% say they would consider voting PC.
Those saying they definitely won’t be voting PC in the next election is down 21-points since December, from 48% to 27%.
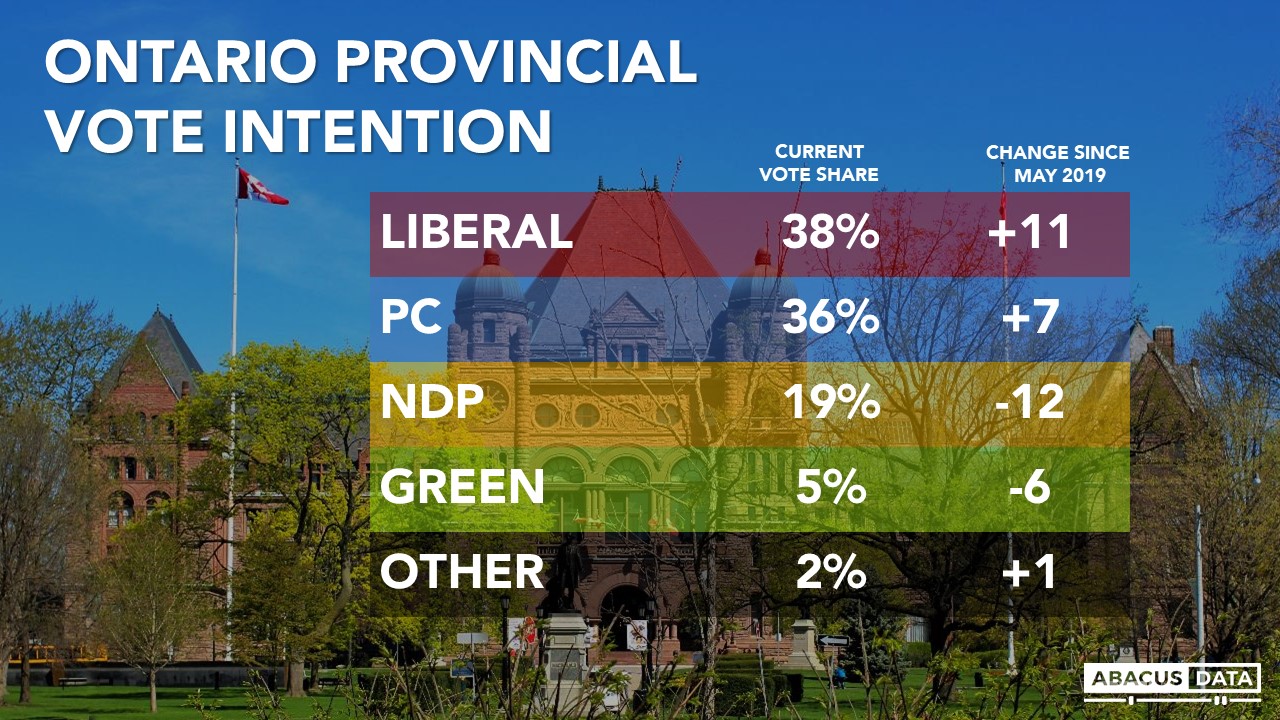
FINDING #8: Despite the generally favourable impression of both the provincial government and Premier Ford, the Ontario Liberals and PCs are statistically tied in vote intentions.
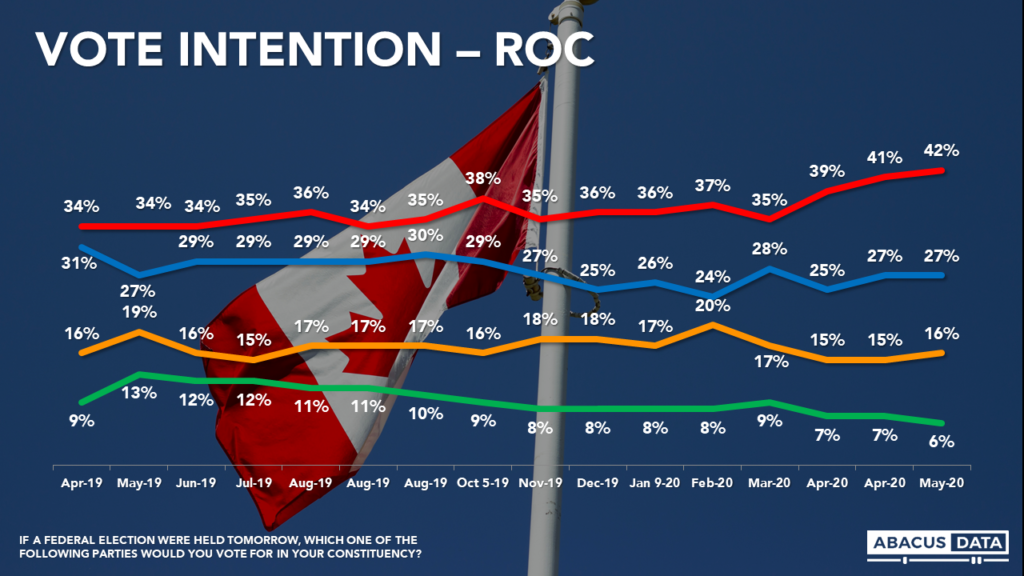
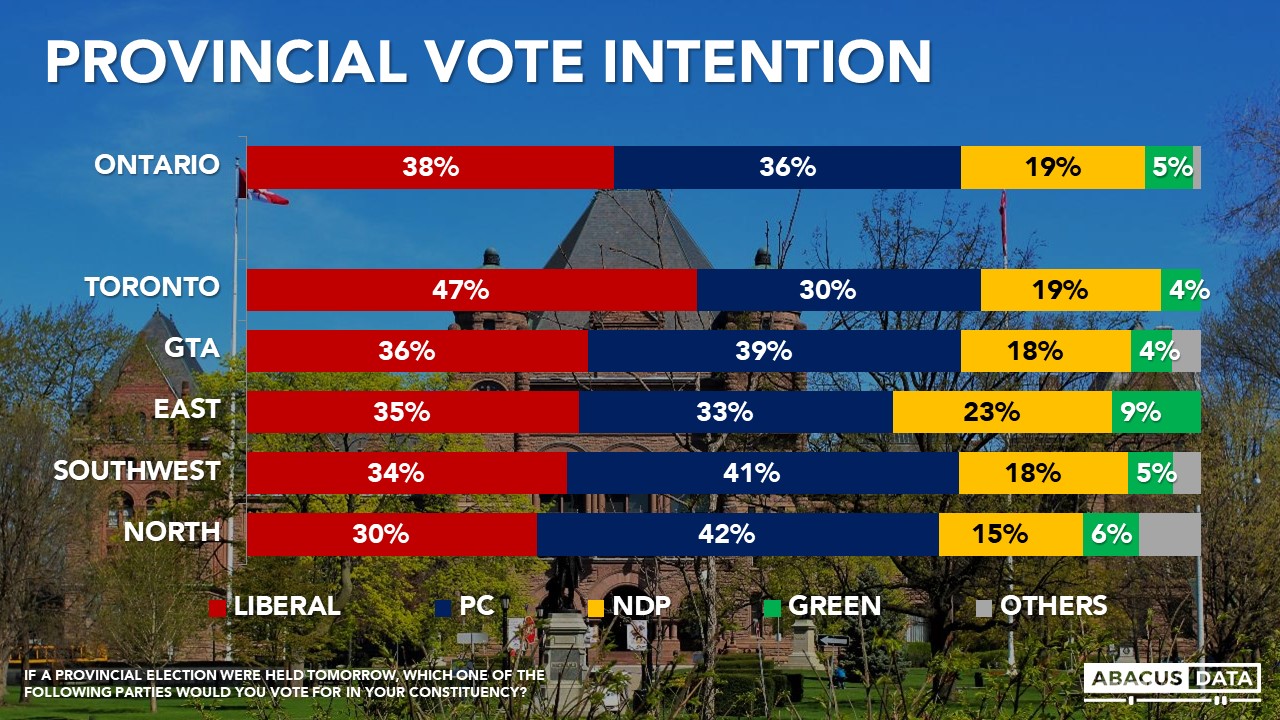
If an election were held at the time of this survey, the Del Duca led Liberals would get 38% followed by 36% for Ford’s PCs and 19% for Andrea Horwath’s NDP. Since May 2019, the Liberal vote share is up 11, the PCs are up 7, while the NDP is down 12. The Green vote share is also down by 6 points since last May.
The Liberals lead by a wide margin in Metro Toronto and are tied with the PCs in the Greater Toronto region, and Eastern Ontario. The PCs lead in Southwestern Ontario.
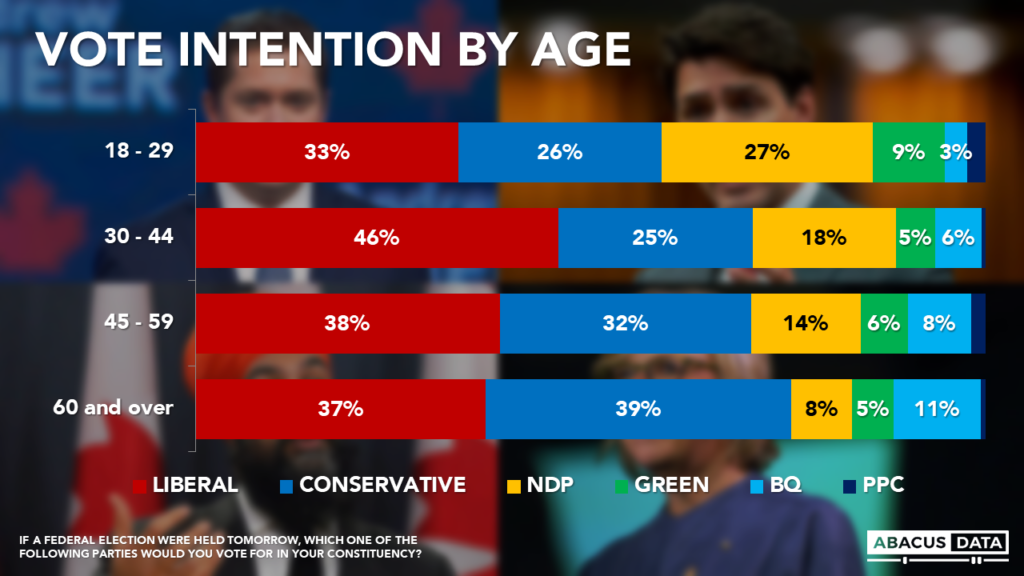
The PCs have an 18-point lead among those aged 60 and over and a 5-point lead among those aged 45 to 59. Among those aged 18 to 44, the Liberals lead the PCs by 20-points, with the PCs and NDP tied for second at around a quarter of the vote. The Liberals lead by 12 over the PCs among women while the PCs have an 8-point lead over the Liberals among men.
UPSHOT
In only two months, Doug Ford’s favourability rating increased by over 20 percentage points. 60% approve of the job performance of his government thanks to an overwhelmingly positive assessment of his government’s response to the pandemic (74% approve). In a matter of months, Ontarians went from really disliking their premier (61% negative) to almost half (46%) feeling quite good about him.
But several factors suggest this lift in his image could change quickly.
First, although evaluations of his government’s performance are generally positive in almost every area we tested, our advanced analysis indicates that Ontarians are evaluating the Premier and his government through a pandemic lens. It is by far the most important driver in predicting whether someone has a positive or negative view of the government or the premier.
Second, despite the government’s 60% approval rating, only 36% of decided respondents would actually vote PC if an election was held at the time of the survey. That suggests that the Premier and the PCs will need to do more than satisfy Ontarians on their handling of the pandemic. Premier Ford will need to also demonstrate that he is not the same guy that 60%+ of Ontarians had a negative view of in early March.
With a new Liberal leader who is largely undefined and unknown and a wilting NDP, the PCs are in a much better position to be re-elected than they were only a few months ago.
Today, 58% of Ontarians would consider voting PC, an increase of 19-percentage points since December 2019.
If nothing else, the pandemic and Premier Ford’s performance to date has caused many Ontarians to re-evaluate him and open their minds to voting for him in the future. And that’s a big change over a short period of time.
ABOUT ABACUS DATA
We are the only research and strategy firm that helps organizations respond to the disruptive risks and opportunities in a world where demographics and technology are changing more quickly than ever.
Find out more about what we are doing to help clients respond to the COVID-19 pandemic.
We are an innovative, fast-growing public opinion and marketing research consultancy. We use the latest technology, sound science, and deep experience to generate top-flight research-based advice to our clients. We offer global research capacity with a strong focus on customer service, attention to detail and exceptional value.
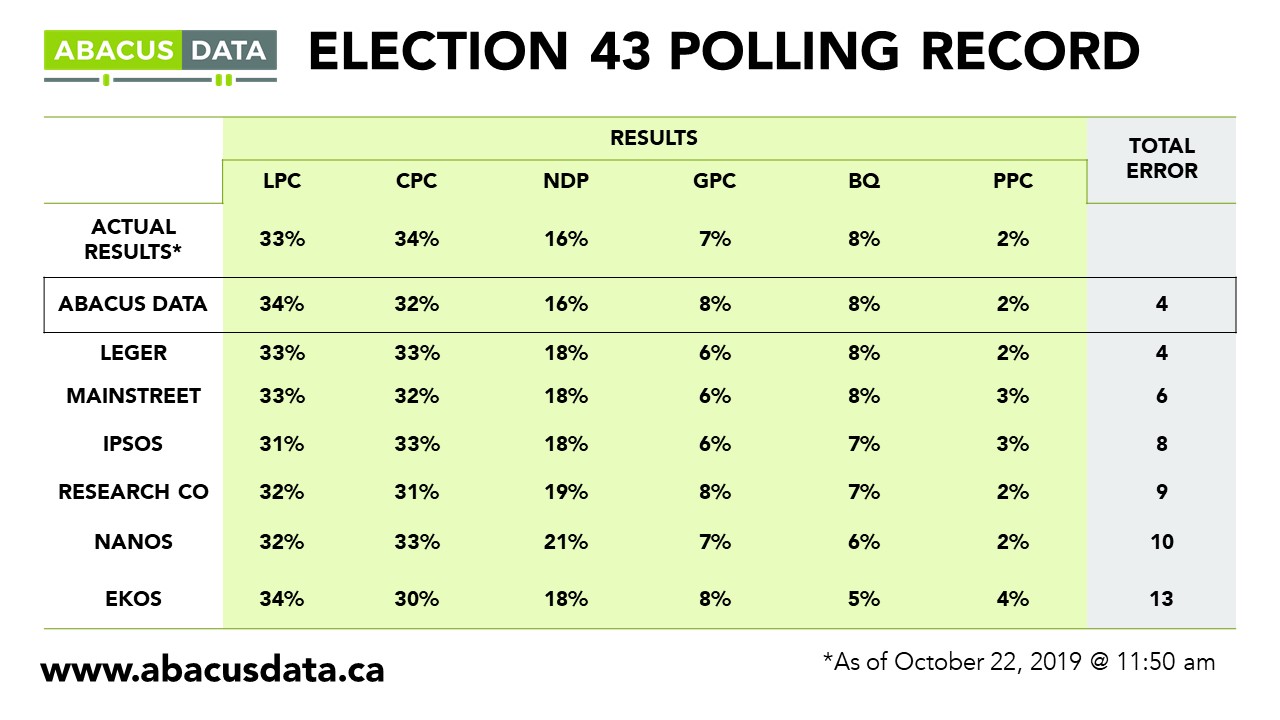
We were one of the most accurate pollsters conducting research during the 2019 Canadian Election.
Contact us with any questions.
Find out more about how we can help your organization by downloading our corporate profile and service offering.
METHODOLOGY
Our survey was conducted online with 597 Ontarians aged 18 and over from May 19 to 22, 2020. A random sample of panellists was invited to complete the survey from a set of partner panels based on the Lucid exchange platform. These partners are double opt-in survey panels, blended to manage out potential skews in the data from a single source.
The margin of error for a comparable probability-based random sample of the same size is +/- 4.1%, 19 times out of 20. The data were weighted according to census data to ensure that the sample matched Ontario’s population according to age, gender, educational attainment, and region. Totals may not add up to 100 due to rounding.