On behalf of Equal Voice, we asked 2,000 Canadian men and women (those 18 and over) their views on politics, political participation, and what can be done to increase women’s involvement in politics. This work is an extension of the study we conducted in 2017 called Finding Parity.
Here’s what we found:
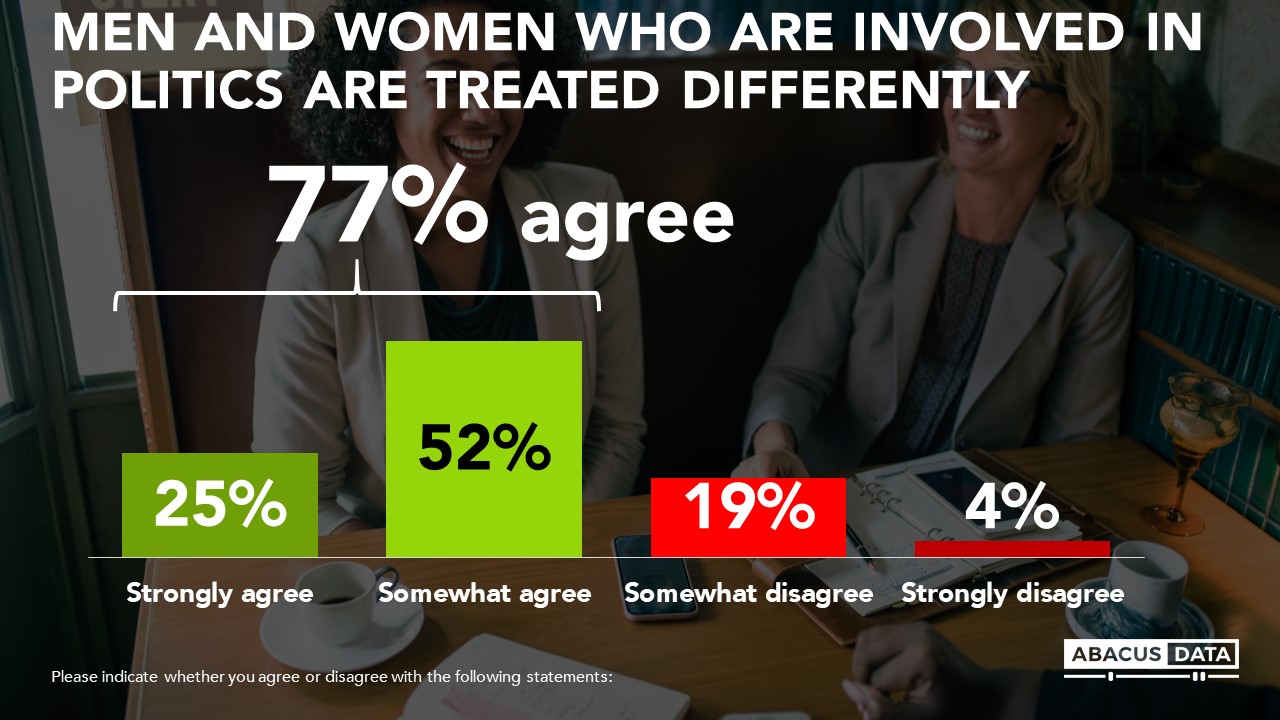
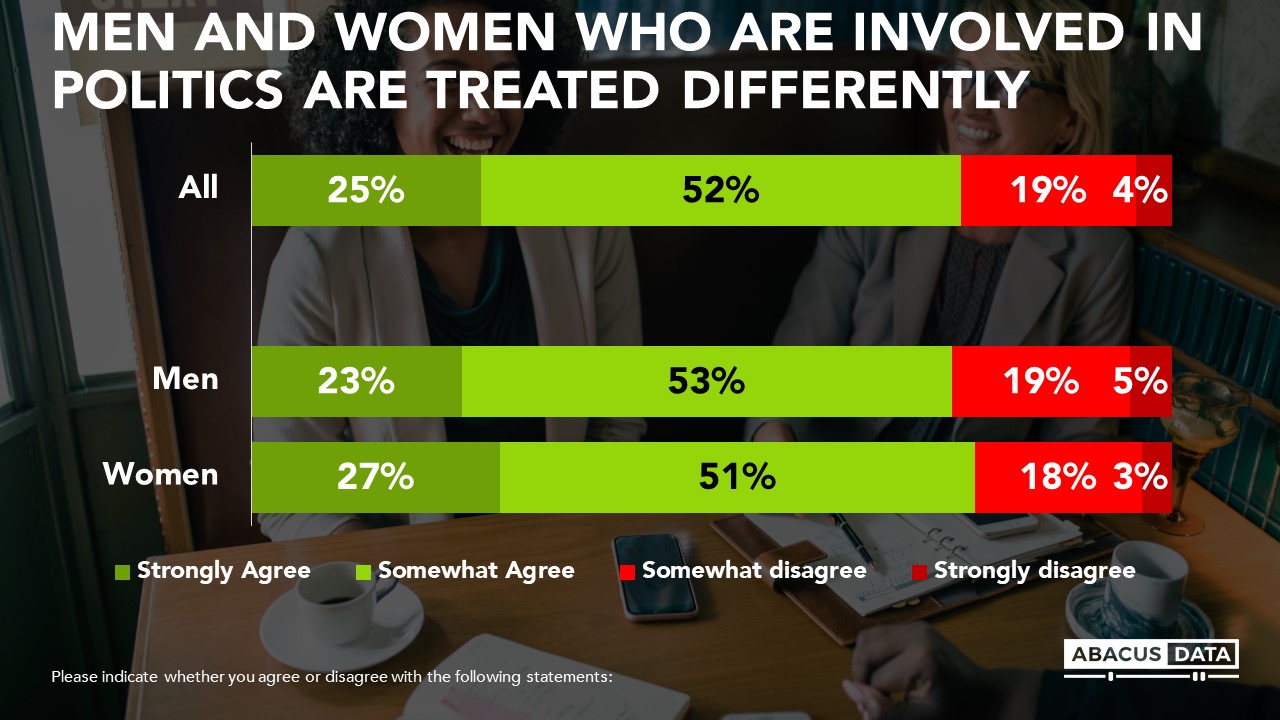
There is widespread recognition among Canadians that men and women involved in politics are treated differently. Over three in four agree with this view and opinions are consistent across gender and age. Women are no more likely to agree there is a difference in treatment (76% of men, and 78% of women).
Across age groups, perceptions among women are pretty consistent but we do find a difference among men of different ages. Younger men (those 18 to 29) are much more likely to agree there is a difference in treatment between men and women (35%) compared to men over 30 (20%).
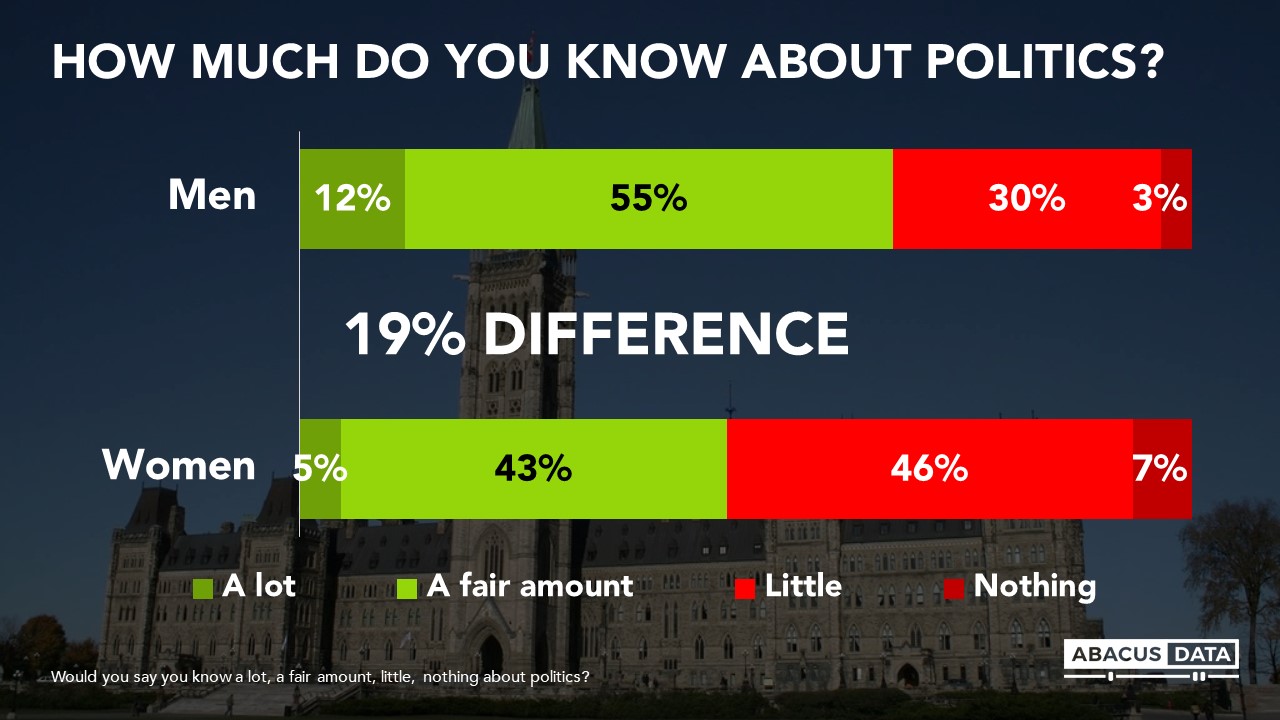
Along with a sense that men and women are treated differently when it comes to politics, we also find that men are more likely to report that they know a lot or a fair amount about politics. 48% of women surveys say they know a lot or a fair amount about politics compared with 67% among men. That’s a 19-point gap across gender. Among those who say they know “a lot about politics”, men are more than twice as likely to feel that way than women.
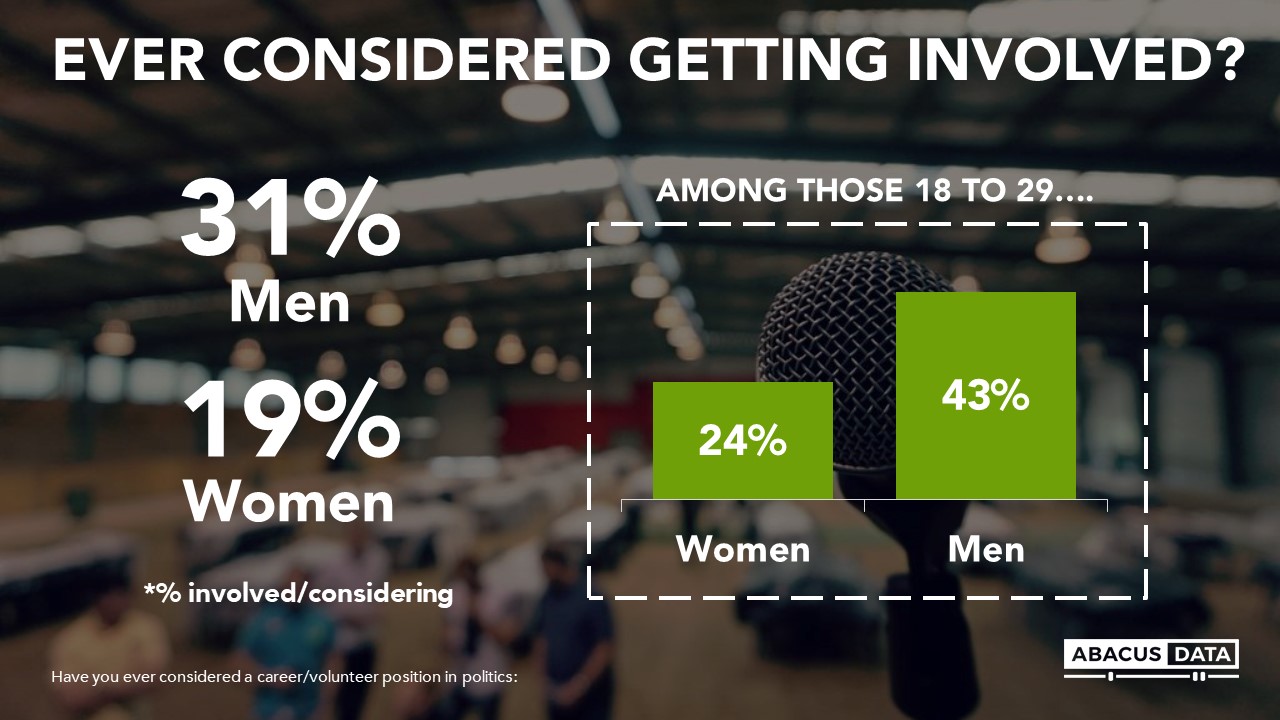
Canadian men are also almost twice as likely to say they have considered a career or volunteer position in politics (men 31% vs. women 10%). Of note, younger Canadians (aged 18 to 29) report higher levels of interest in politics than older Canadians but young men (43%) are almost twice as likely to say they have considered a career or volunteer position in politics than young women (24%)
THE UPSHOT
Women face many hurdles to becoming involved in politics. This research for Equal Voice confirms that perceptions remain a powerful barrier in achieving gender equity in Canadian politics.
Women believe that they are treated differently than men in politics. Women are less likely to say they know a lot about politics compared with men. This leads to less confidence and comfort with the subject and ultimately to fewer women who would even consider getting involved in politics – whether as a career or in a voluntary role.
The Daughters of the Vote program is such an important program because it introduces young women to the world of politics in Ottawa. It gives them a seat in our nationally elected legislature, encourages engagement and networking, and builds confidence in their own ability to get involved in politics and make change happen.
METHODOLOGY
The survey was conducted online with 2,000 Canadian residents aged 18 and over from September 14th to 18th, 2018. A random sample of panelists was invited to complete the survey from a set of partner panels based on the Lucid exchange platform. These partners are typically double opt-in survey panels, blended to manage out potential skews in the data from a single source.
The data were weighted according to census data to ensure that the sample matched Canada’s population according to age, gender, educational attainment, and region. Totals may not add up to 100 due to rounding.
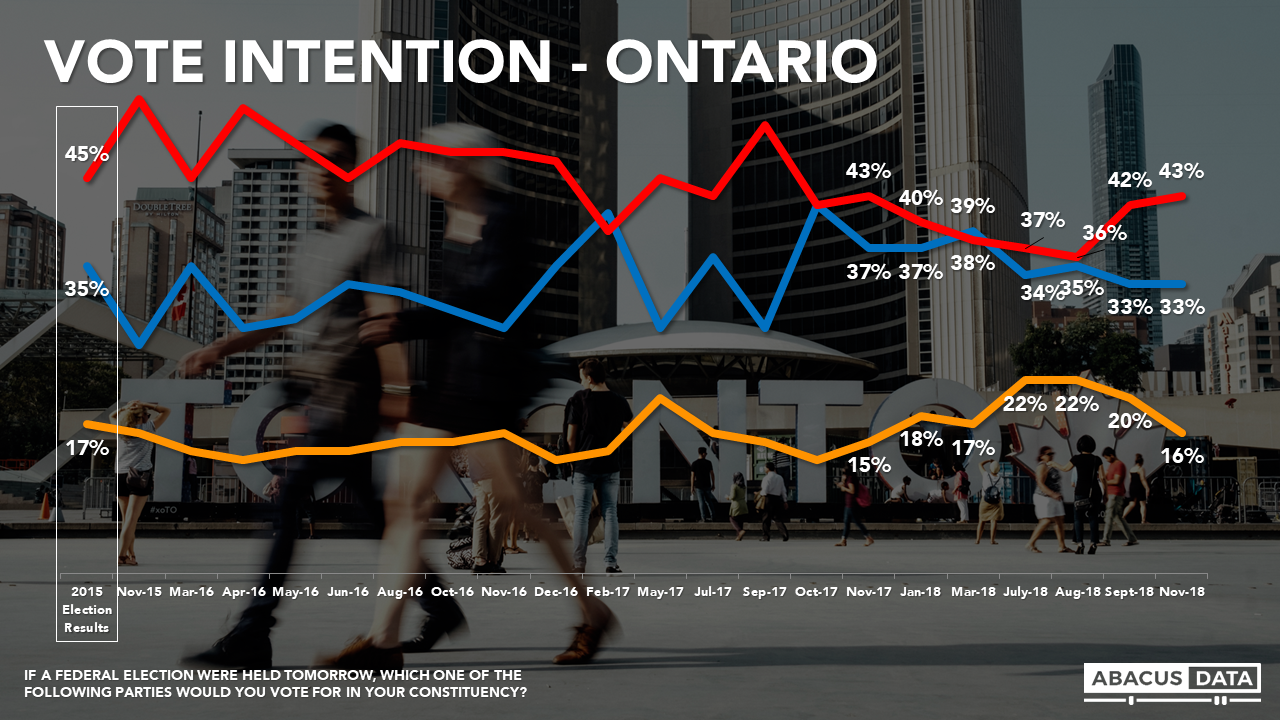
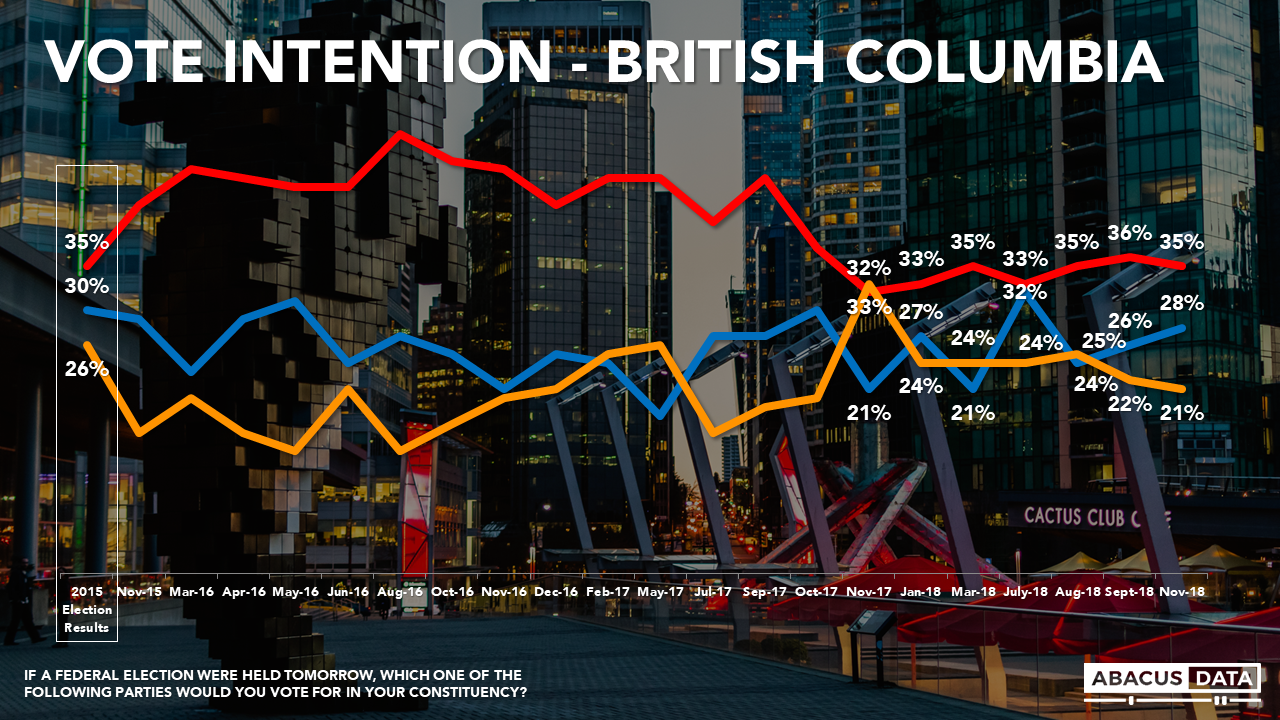
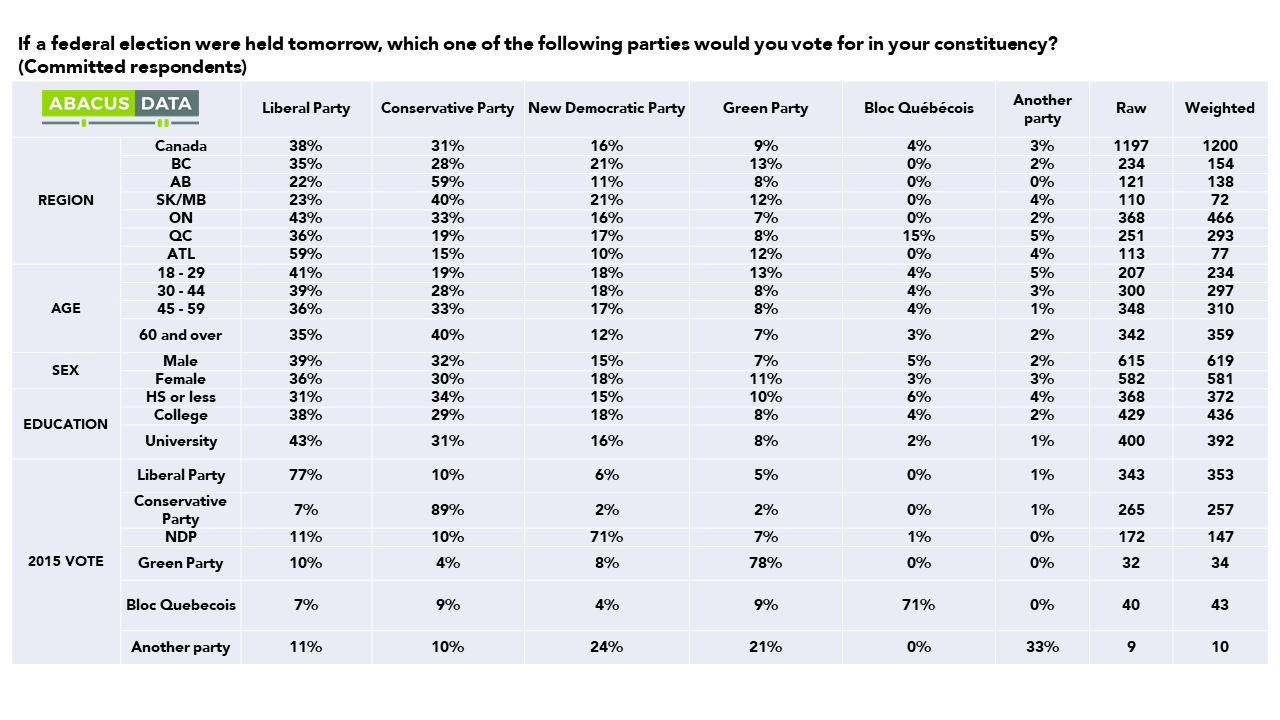
In an election held tomorrow, 38% would vote for the Liberal Party, 31% Conservative and 16% for the NDP. These numbers are similar to the levels of support each party found the last time Canadians went to the polls. Regionally the Liberals hold a 7-point lead in BC, a 10-point lead in Ontario, a 17-point advantage in Quebec and a 45-point lead in Atlantic Canada.
Liberal support has clearly strengthened in Ontario, likely caused by the after-effects of the provincial election. Frustration with Kathleen Wynne is obviously removed from the equation, and we see a 7-point rise in negative feelings towards Doug Ford on a month over month basis.
The trend lines in BC suggest the NDP is struggling to get traction and the Liberals are holding their own. In Quebec, Liberal support has dipped, but is not coalescing around any single alternative –the NDP are splitting most of the “change” votes with the Conservatives and BQ.
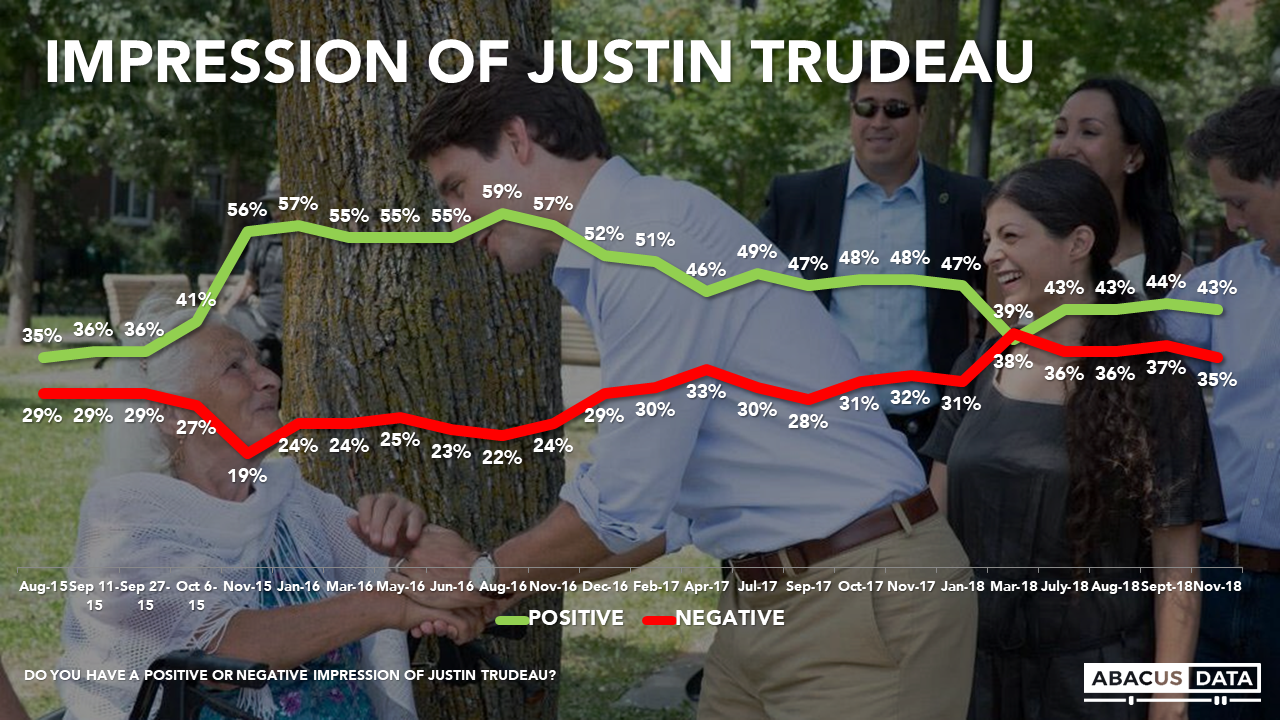
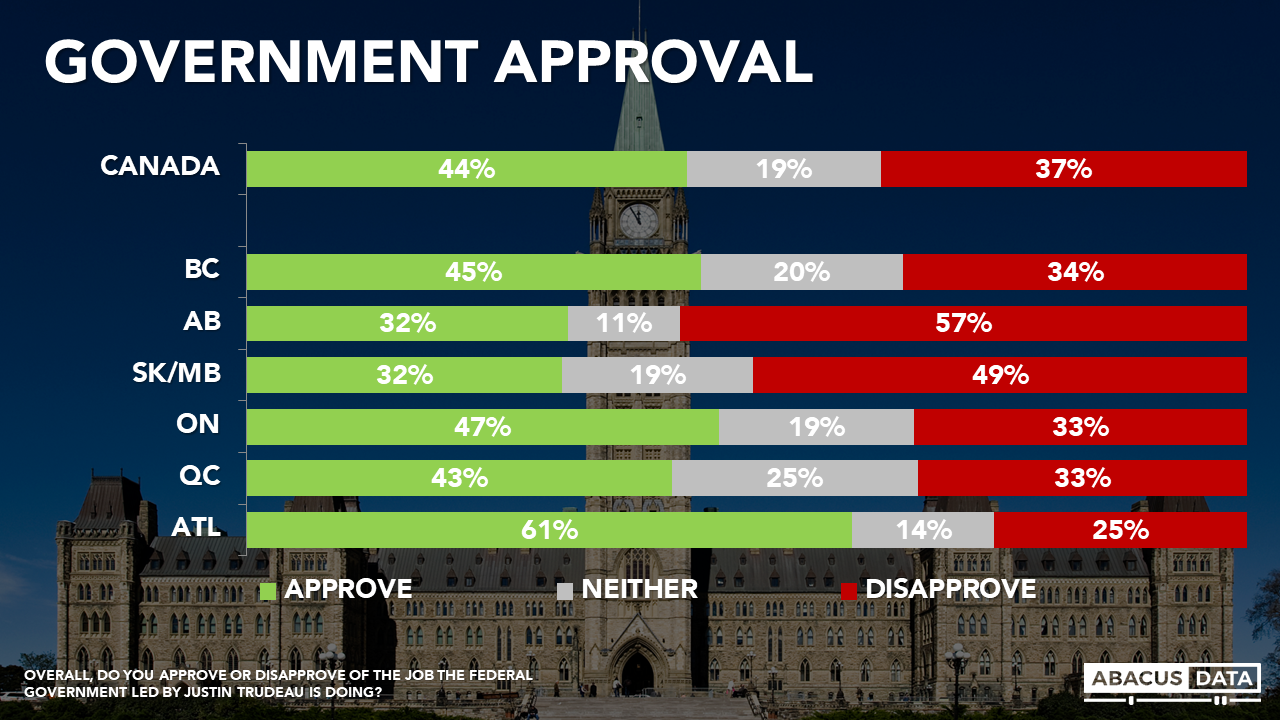
Feelings about the performance of the federal government show approval levels up a few points from the spring, and disapproval has dropped 6 points over that period of time. Similar patterns are evident in feelings about the Prime Minister.
Performance assessments of the federal government suggest there may be some latent Liberal support above the 38% that currently say they will vote Liberal. Regionally, 45% in BC, 47% in Ontario, and 43% in Quebec say they approve of the federal government’s performance so far. These provinces together elect 241 of 338 MPs in the federal House of Commons. Another 32 seats come from Atlantic Canada, where approval of Ottawa’s performance is running at 61%.
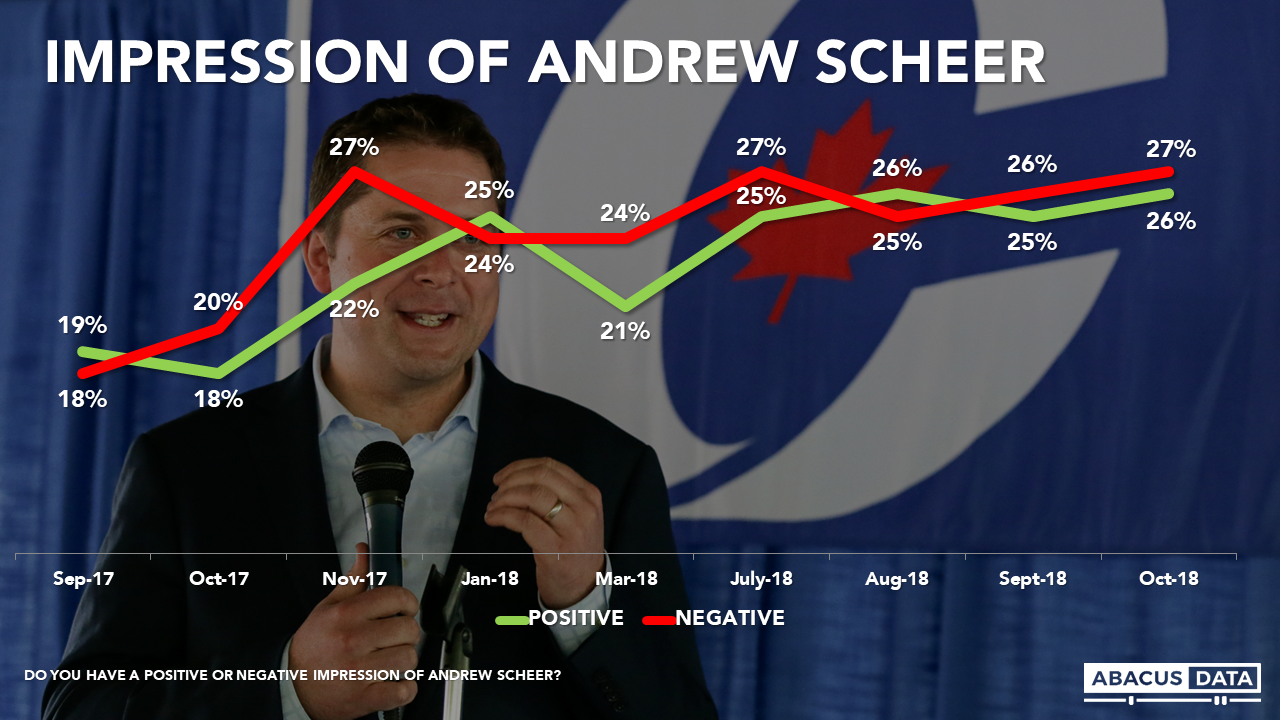
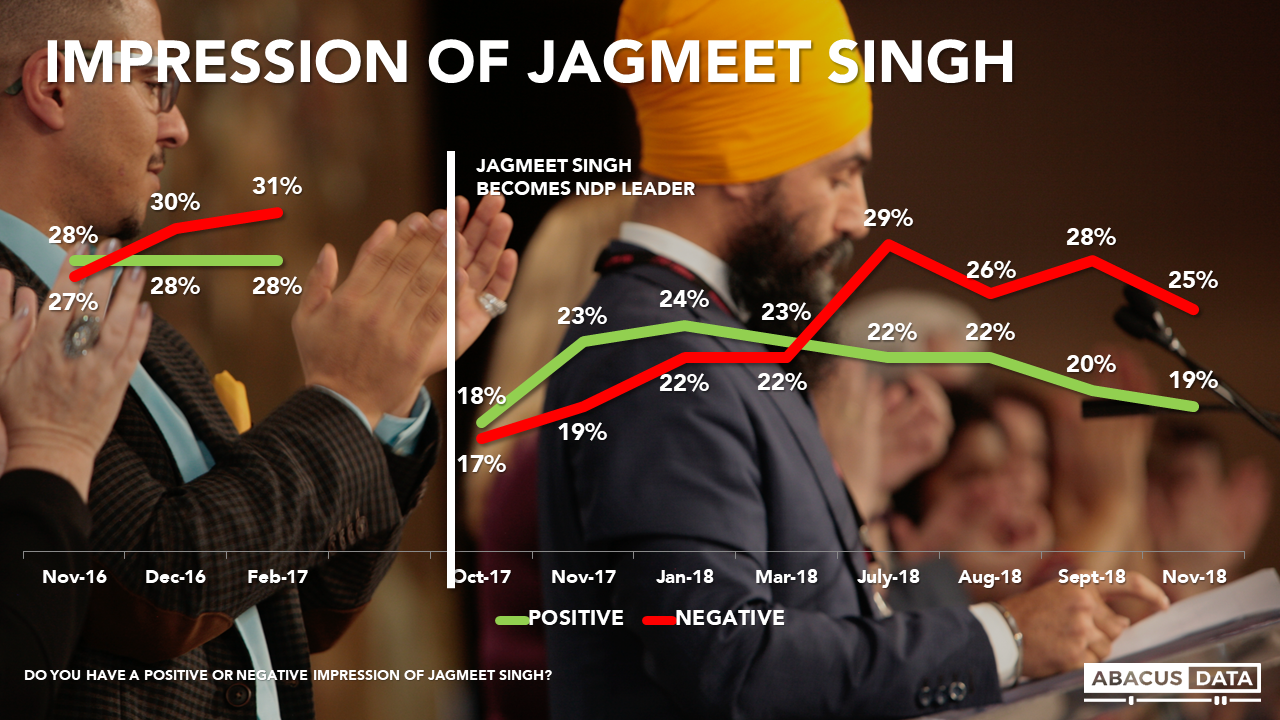
Mr. Scheer’s image is not shifting much, and his negatives continue to be about equal to his positives. Mr. Singh’s negatives continue to be higher than his positives.
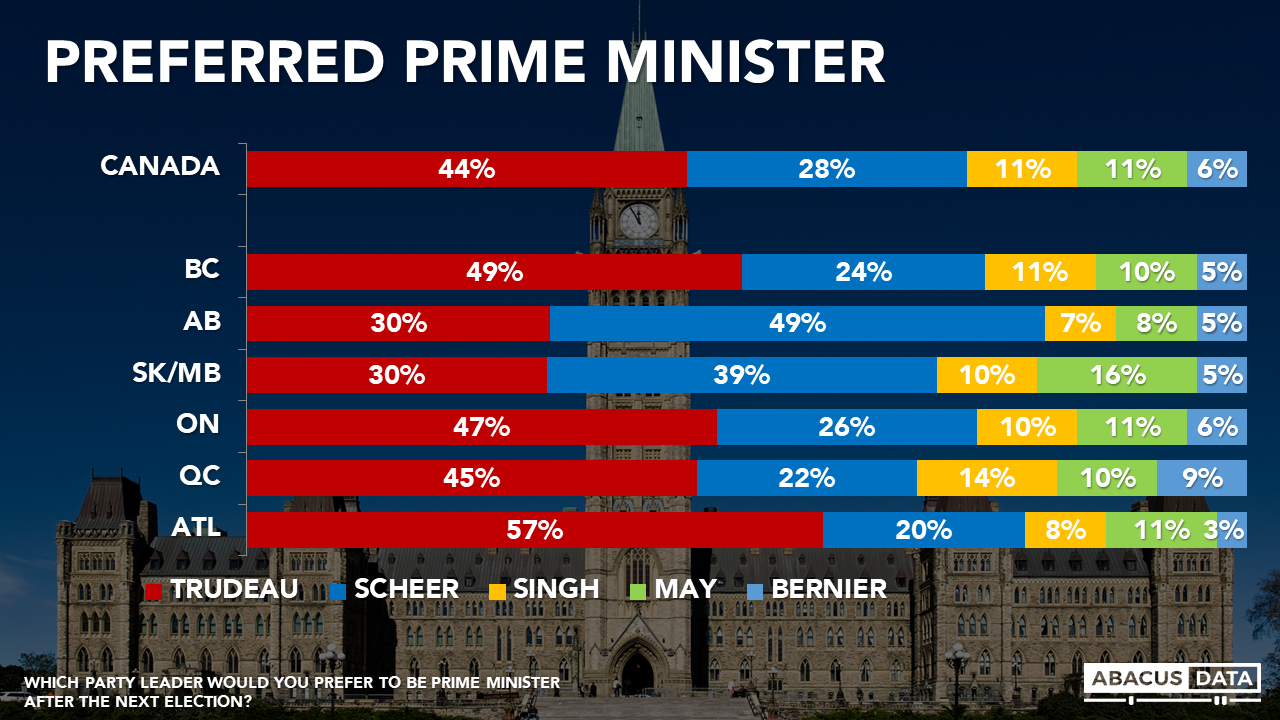
As to which party leader Canadians would prefer to see as prime minister after the next election, Justin Trudeau bests Andrew Scheer by 16-points and runs ahead of his party while both opposition leaders underperform their parties’ popularity.
Regional patterns on this preferred PM question underscore that if an election were held now, and turned on how people felt about the leaders, Mr. Trudeau is in an even stronger position relative to his rivals than current vote intention numbers imply.
UPSHOT
Last fall, winter, and spring were tough sledding for the Liberals. However heading into this winter, our data indicate the incumbents have stopped their slide and become more competitive, while both main opponents lack forward momentum, at least at this moment in time.
The Ontario election put dissatisfaction with Kathleen Wynne into sharp focus and likely kept downward pressure on the federal Liberal brand. Now, the question is whether Doug Ford is becoming something of a lightning rod in Ontario and may lead to some firming up of Liberal fortunes.
The Prime Minister’s popularity isn’t where it was a couple of years ago. However, he is running ahead of his party and considerably ahead of his rivals in terms of the impressions of voters. It’s not unusual for relatively new opposition leaders to trail on a “best PM” question, however, both of the opposition parties might have been hoping for more progress than is evident so far. As the discussion shifts from popularity to a choice of who people prefer to run the country, the data indicate the PM has more support than the party vote numbers suggest.
The results for the NDP point up some risk of voters deciding that 2019 might feel like a two-party race. Only 11% nationally (and only about half of NDP voters) say they would like to see Jagmeet Singh as Prime Minister next year. Unionized, feminist and environmentally oriented voters – each of which have been important parts of the NDP coalition – look like they may be tempted by other parties and leaders.
Methodology
Our survey was conducted online with 1,500 Canadians aged 18 and over from November 9 to 13, 2018. A random sample of panelists was invited to complete the survey from a set of partner panels based on the Lucid exchange platform. These partners are double opt-in survey panels, blended to manage out potential skews in the data from a single source.
The margin of error for a comparable probability-based random sample of the same size is +/- 2.6%, 19 times out of 20. The data were weighted according to census data to ensure that the sample matched Canada’s population according to age, gender, educational attainment, and region. Totals may not add up to 100 due to rounding.
ABOUT ABACUS DATA
We are the only research and strategy firm that helps organizations respond to the disruptive risks and opportunities in a world where demographics and technology are changing more quickly than ever.
We are an innovative, fast-growing public opinion and marketing research consultancy. We use the latest technology, sound science, and deep experience to generate top-flight research-based advice to our clients. We offer global research capacity with a strong focus on customer service, attention to detail and exceptional value.
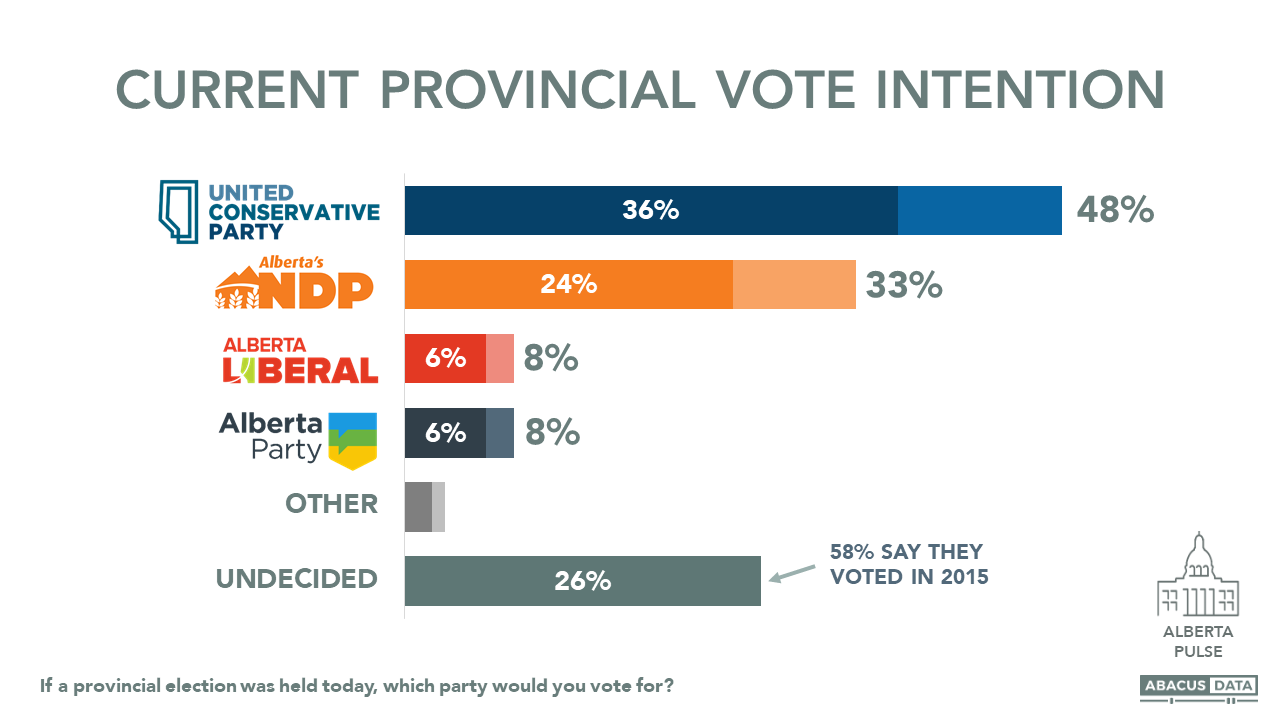
THE UNITED CONSERVATIVE PARTY LEADS THE NDP BY 15 AS 77% OF FORMER WILDROSE AND PC PARTY SUPPORTERS NOW SUPPORT THE UCP.
About three and a half years ago, the NDP surprised many in Alberta and across the country by winning a majority government in a province that had never elected the NDP and had been governed by the Progressive Conservative Party for 44 years.
With about six months to go before the start of the next provincial election in Alberta, we surveyed 800 Albertans at the end of October and asked them to share their views on politics in the province.
Here’s what we found:
THE UNITED CONSERVATIVE PARTY LEADS BY 15 AMONG COMMITTED VOTERS BUT 26% OF ALBERTANS SAY THEY ARE UNDECIDED.
If an election was held at the time of the survey, the United Conservative Party would likely win a majority. Overall 48% of committed voters say they would vote UCP with the incumbent NDP behind 15 points at 33%. The Alberta Liberal and Alberta parties both got 8% of the vote.
Among all respondents, 26% say they are undecided with most of those them saying they voted in the previous provincial election.
Compared to the actual election results in 2015, the NDP is down 7 points from the 40% it won, whereas the United Conservative Party is 3 points ahead of where the former PC and Wildrose parties stood if you combined their popular vote today.
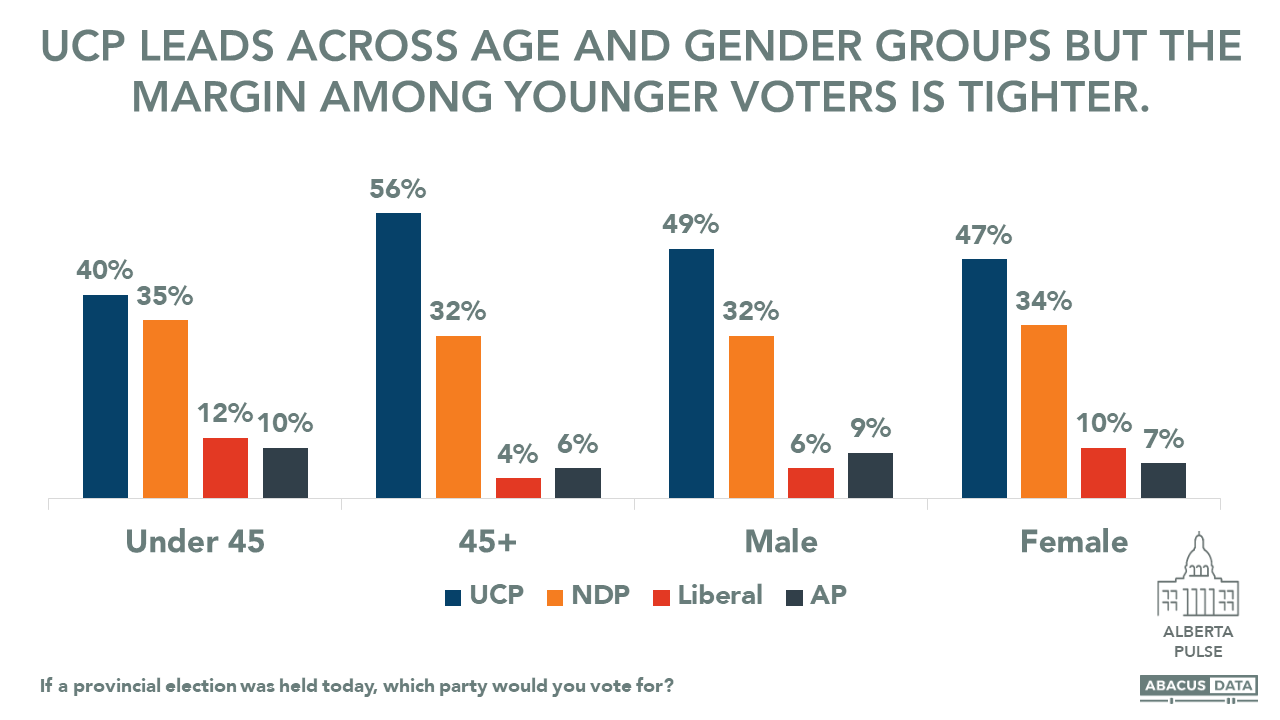
The UCP leads among both younger and older Albertans (although the race is closer among those under 45) and among both men and women.
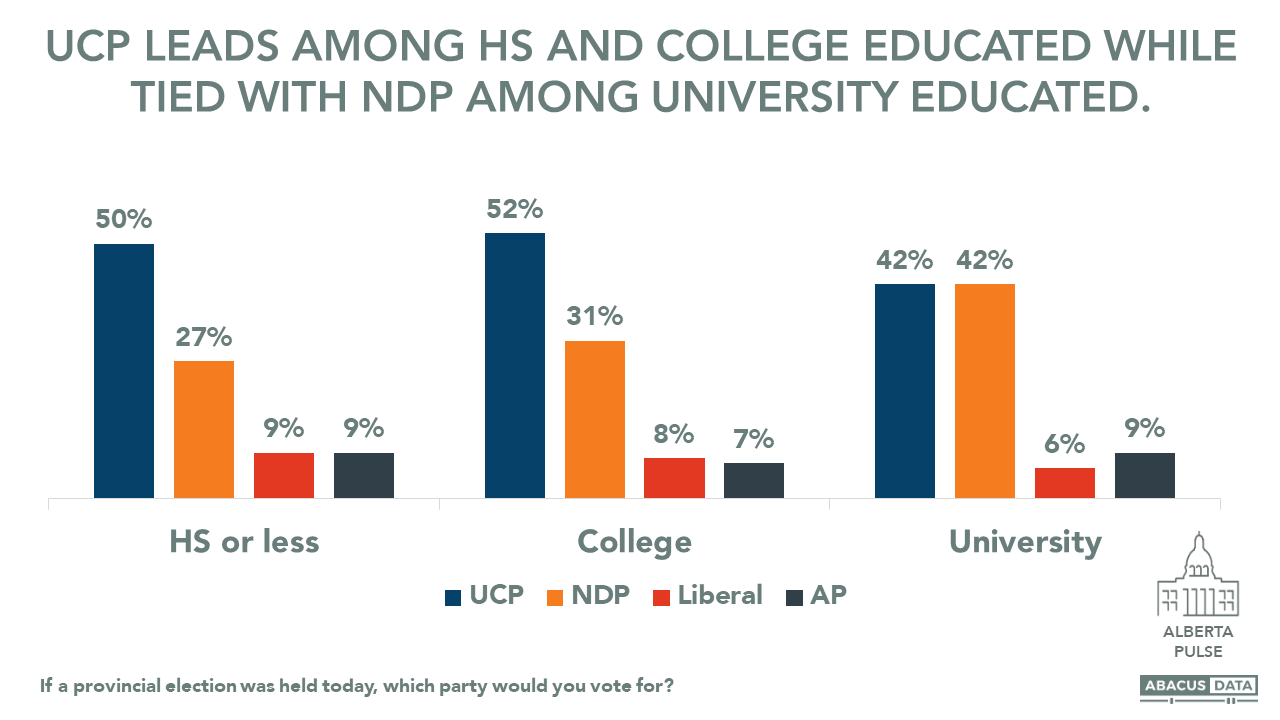
Whereas the UCP has large leads among Albertans with high school or college educations, they are tied with the NDP among those who have a university education.
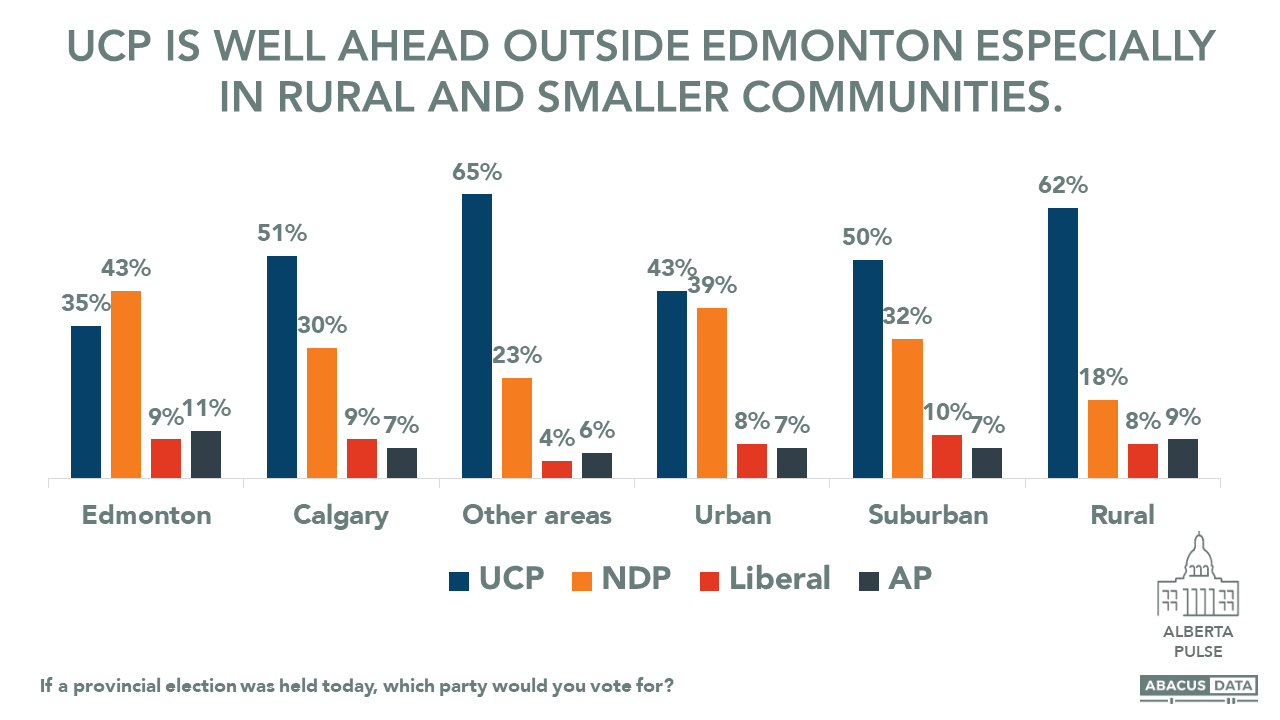
Regionally, the NDP leads by 8 in Edmonton while the UCP has a 21-point lead in Calgary and a 42-point lead in communities outside of the two largest cities. The NDP is stronger among voters who say they live in an urban community (trail the UCP by 4) compared with those living in suburban or rural communities. In rural Alberta, the UCP has an astounding 44-point lead over the NDP.
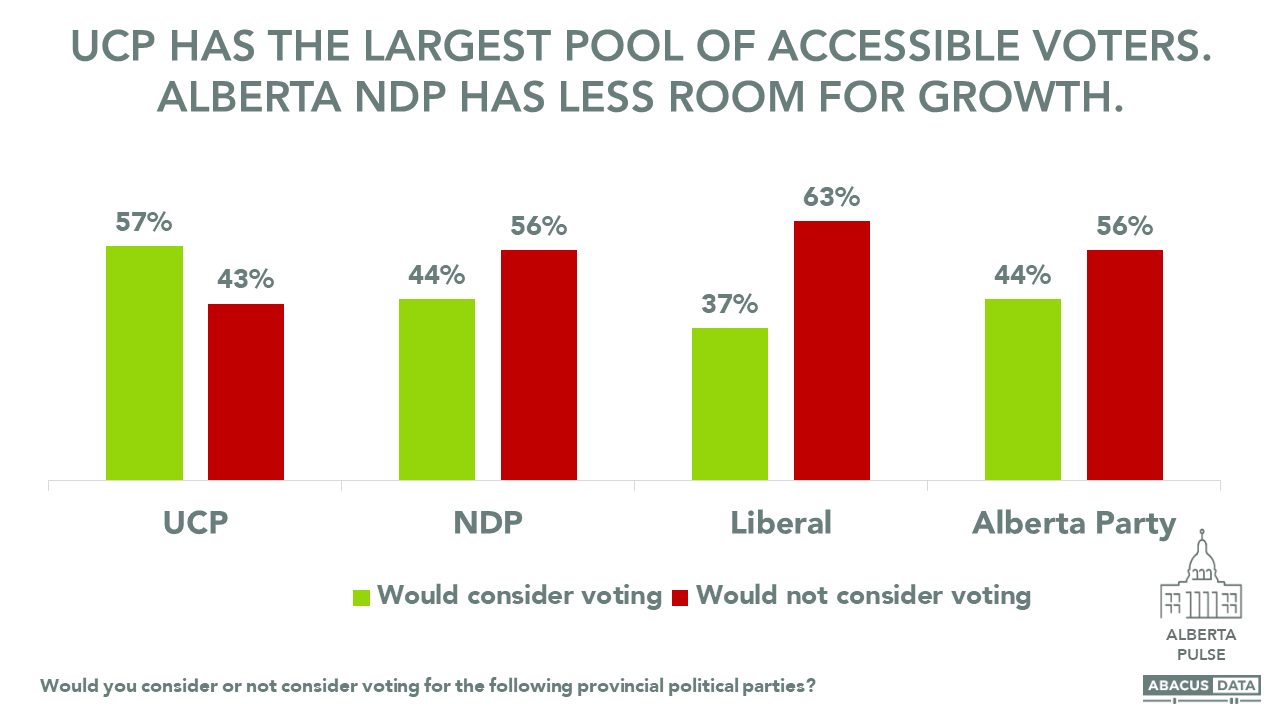
Beyond the horserace, the situation is challenging for the NDP because of the limited size of its accessible voter pool.
The NDP’s accessible voter pool is 13-points smaller than that of the UCP meaning that even if the NDP converted all of its potential support into voters and mobilized them to vote, the UCP could still win if it holds onto most of its current support.
Moreover, the NDP must also deal with opponents closer to it ideologically in the form of the Liberal and Alberta parties who themselves have sizeable accessible voter pools to try and convert. In fact, as many Albertans say they are open to voting for Stephen Mandel and the Alberta Party as are those open to voting NDP.
THE NDP STRUGGLES HAVE MORE TO DO WITH A UNITED OPPONENT THAN DISSATISFACTION AMONG ITS VOTERS.
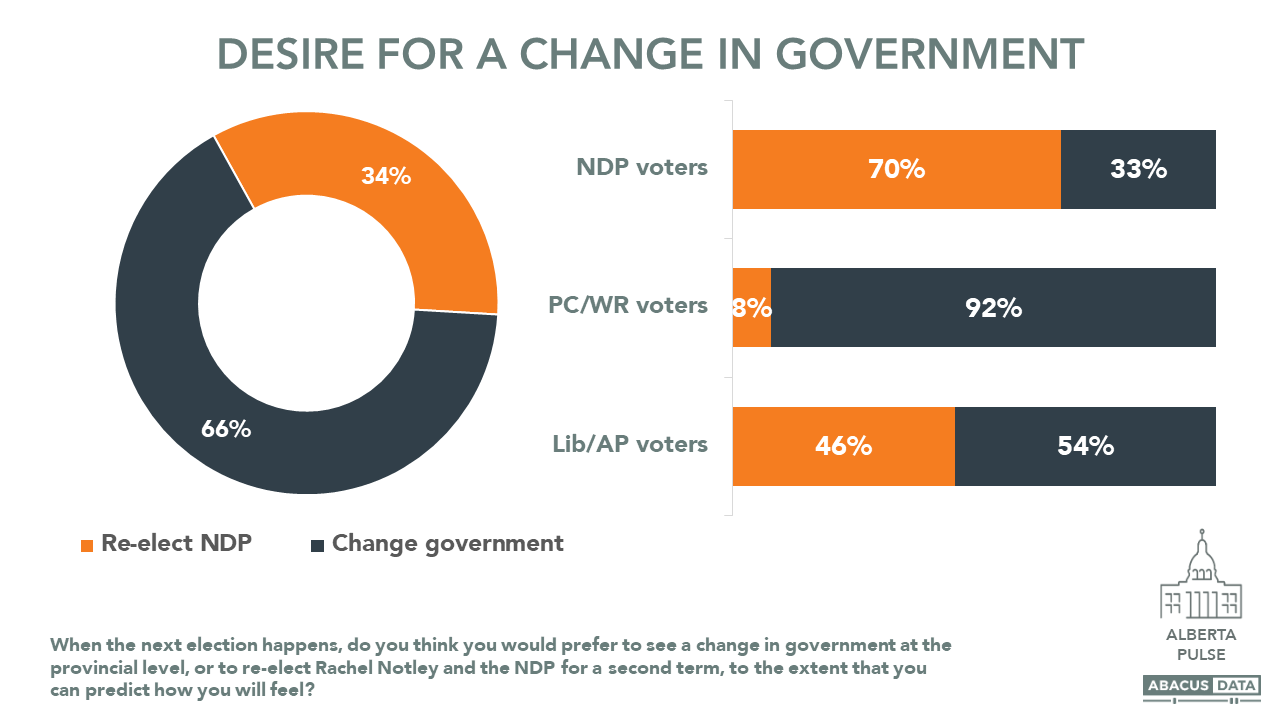
The NDP won in 2015 in large part thanks to a strong desire for change and a fractured conservative movement. Despite challenging economic conditions, the NDP government’s greatest threat is not from dissatisfaction with its performance among its past voters, but from a united opposition.
For example, among those who voted NDP in 2015, only 16% say the government has performed worse than they would have expected. 60% of PC or Wildrose voters feel the same way but on the other hand, 33% of NDP voters want a change in government, as do 66% of Albertans overall.
And while only 59% of those who voted NDP in 2015 say they would vote NDP again today, most of the defectors have not switched their support to another party, but instead, say they are undecided. 9% of past NDP voters now way they will vote UCP while another 10% are inclined to support another party (Liberal or Alberta Party). The NDP has an opportunity to rebuild its coalition from 2015 by convincing past voters that it deserves re-election and it is a better choice than its opposition. But that alone may not be enough to win again.
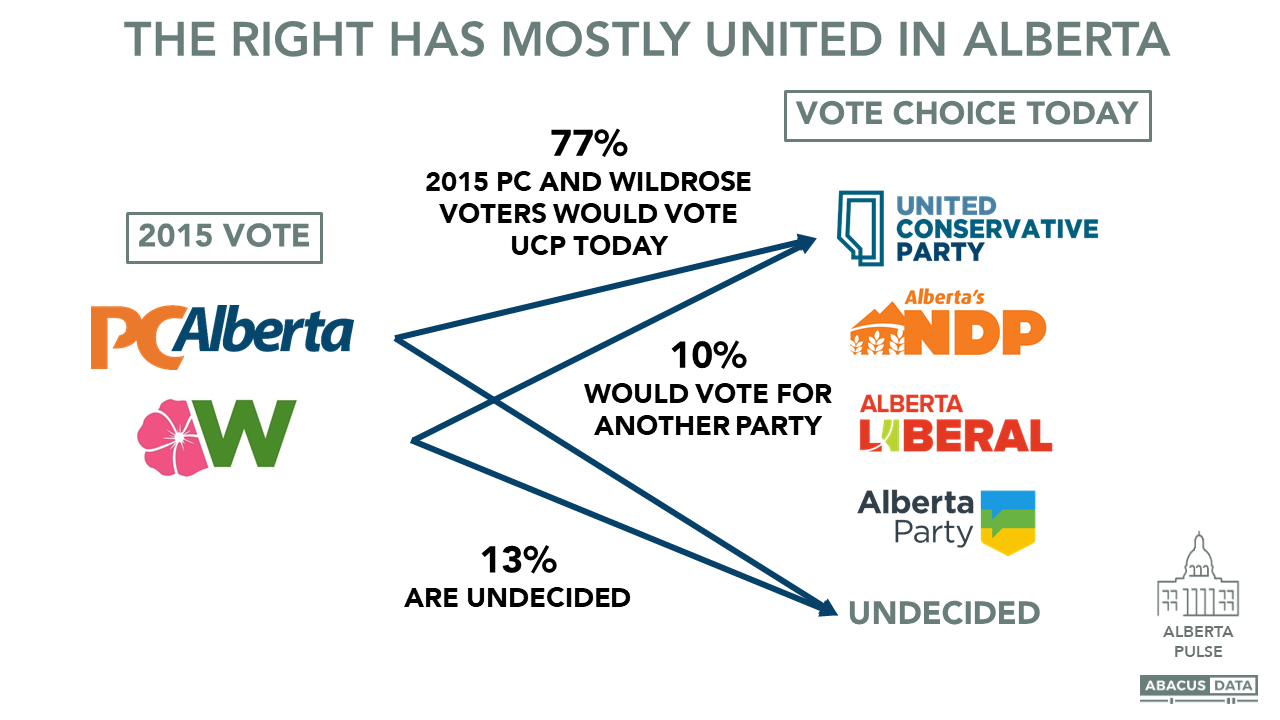
The reason? Because so far, the right in Alberta has reunited.
When we look at where 2015 Wildrose and PC voters have shifted, we find that 3 in 4 now say they would vote UCP. Another 13% are undecided while 10% say they would vote for another party (half of whom would vote NDP today). A united right along with some defection from the NDP to the UCP is the basis for the official opposition’s large lead in vote intention.
But several other factors can offer some insight into the dynamics at play in Alberta politics.
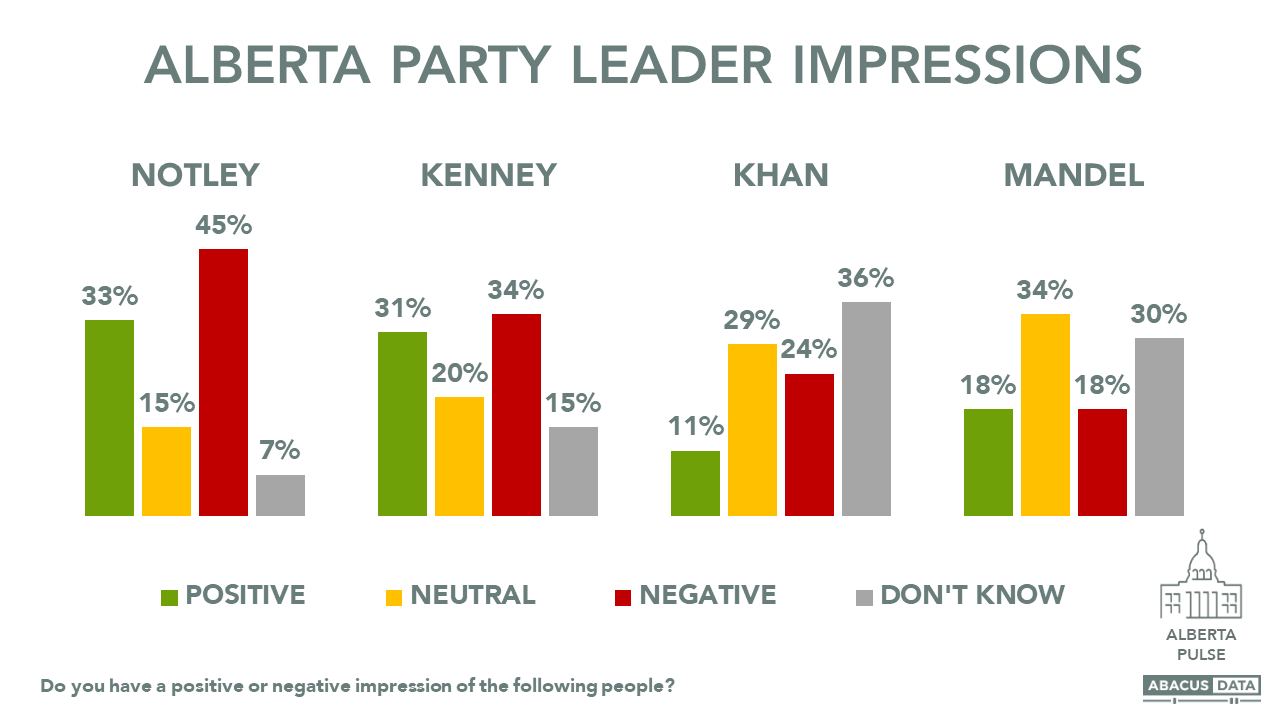
MORE HAVE A NEGATIVE IMPRESSION OF PREMIER NOTLEY THAN A POSITIVE ONE, BUT JASON KENNEY IS NOT FARING THAT MUCH BETTER.
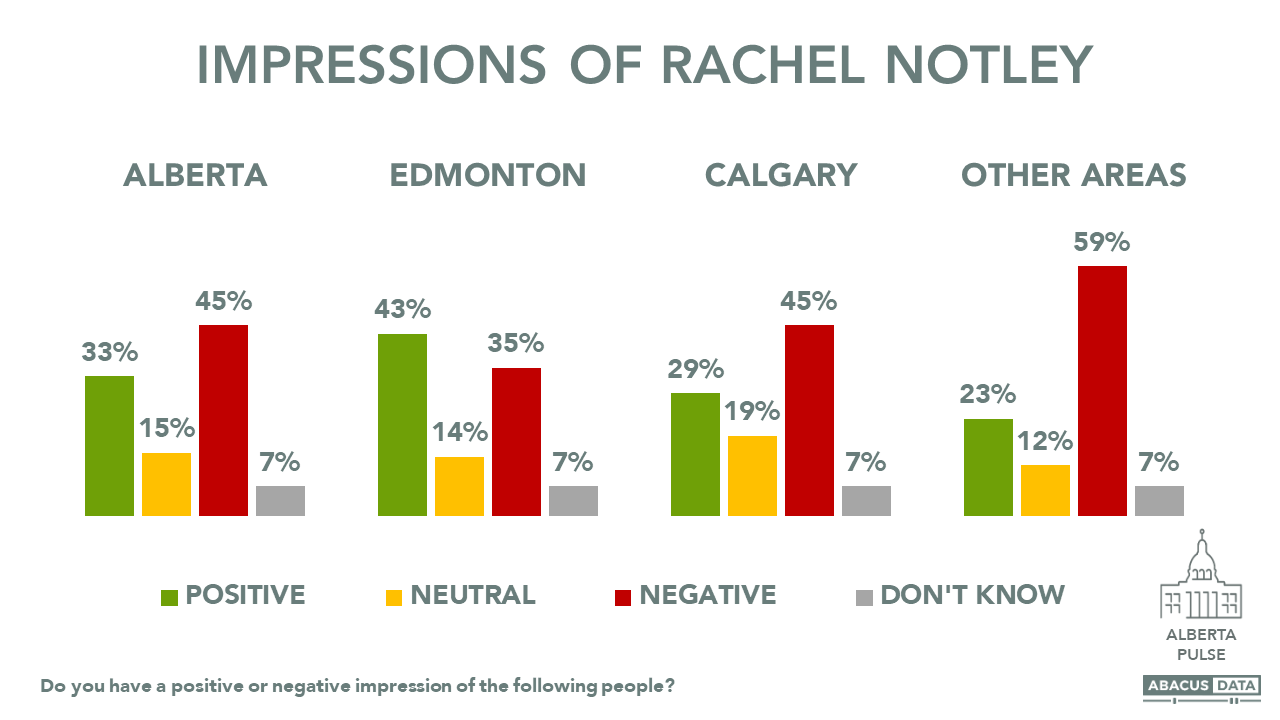
Despite clear animosity towards Premier Notley, her personal numbers are nowhere near the level of negativity we have seen for other recent incumbent premiers facing re-election in Ontario or Quebec. One in three Albertans has a positive view of the Premier compared with 45% who view her negatively.
About the same number have a positive view of Jason Kenney but his negatives are 11-points lower.
David Khan and Stephen Mandel are less well known and not well defined, except in Edmonton where Mandel, as the former Mayor, is better known.
Impressions of Premier Notley match closely with vote intention patterns. She’s more popular in Edmonton and much less so in Calgary and areas outside the two major cities. Interestingly, men view her more positively than women.
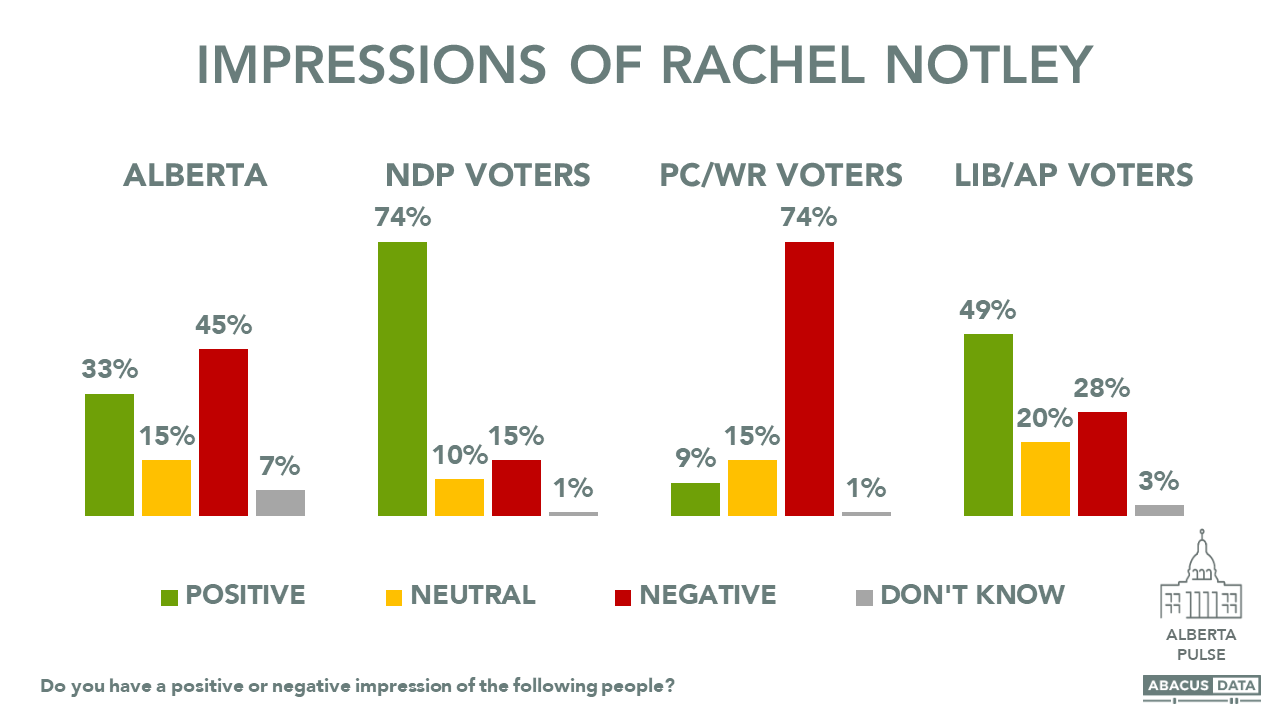
Among 2015 NDP voters she is well liked (only 15% view her negatively) while PC and Wildrose voters overwhelmingly dislike her (9% disagree and have come to like the NDP leader). More important, however, among Liberal and Alberta Party voters, half have a positive view of the NDP premier suggesting an opportunity to grow support among those voters.
Impressions of UCP Leader Jason Kenney also follow similar patterns as vote intention. He is more popular in Calgary and outside the big cities and more unpopular in Edmonton. Men and older residents have a more favourable impression of him while women and younger resident feel less positive about him.
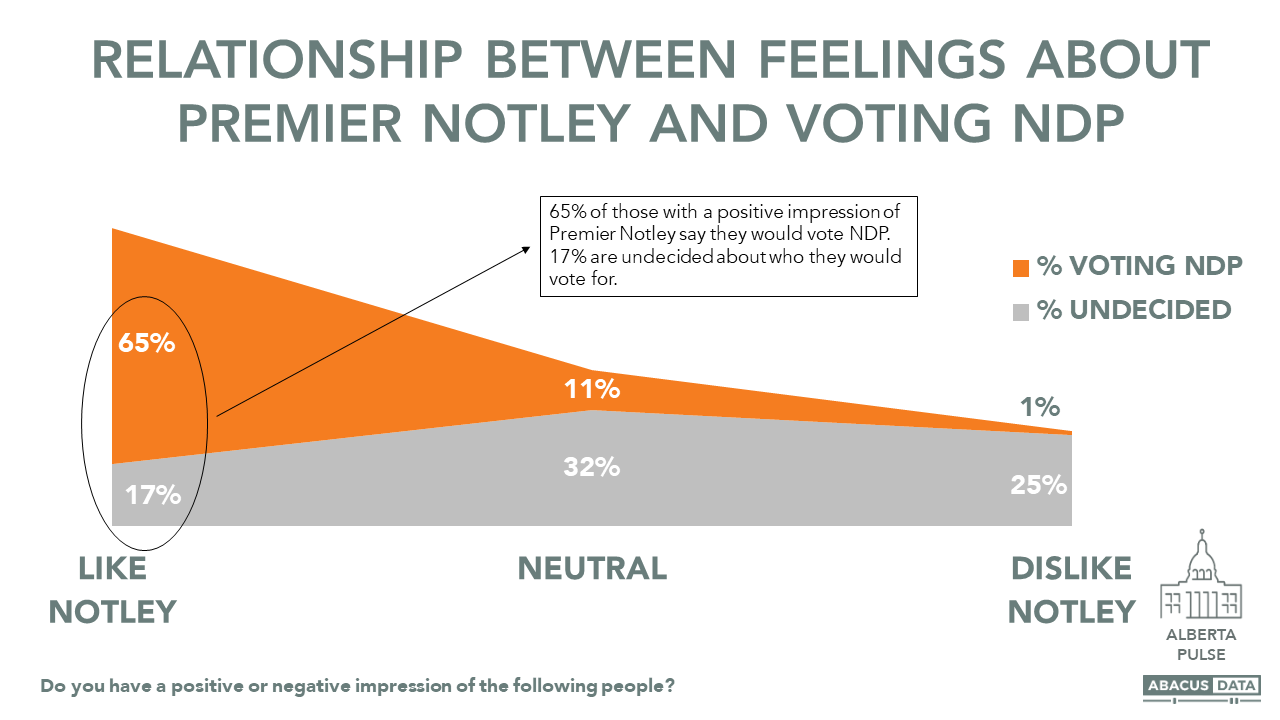
As expected, there is a strong relationship between how one feels about Premier Notley or Jason Kenney and the likelihood of supporting the party they lead. Among those who like Rachel Notley, 65% say they would vote NDP. That number drops to 11% among those who are neutral towards her and 1% among those who dislike her.
For Mr. Kenney, 87% of those who like him would vote UCP compared with 28% of those with more neutral feelings and 3% of those who dislike him. This advantage among those with “neutral” views is both an opportunity for the UCP and a potential threat.
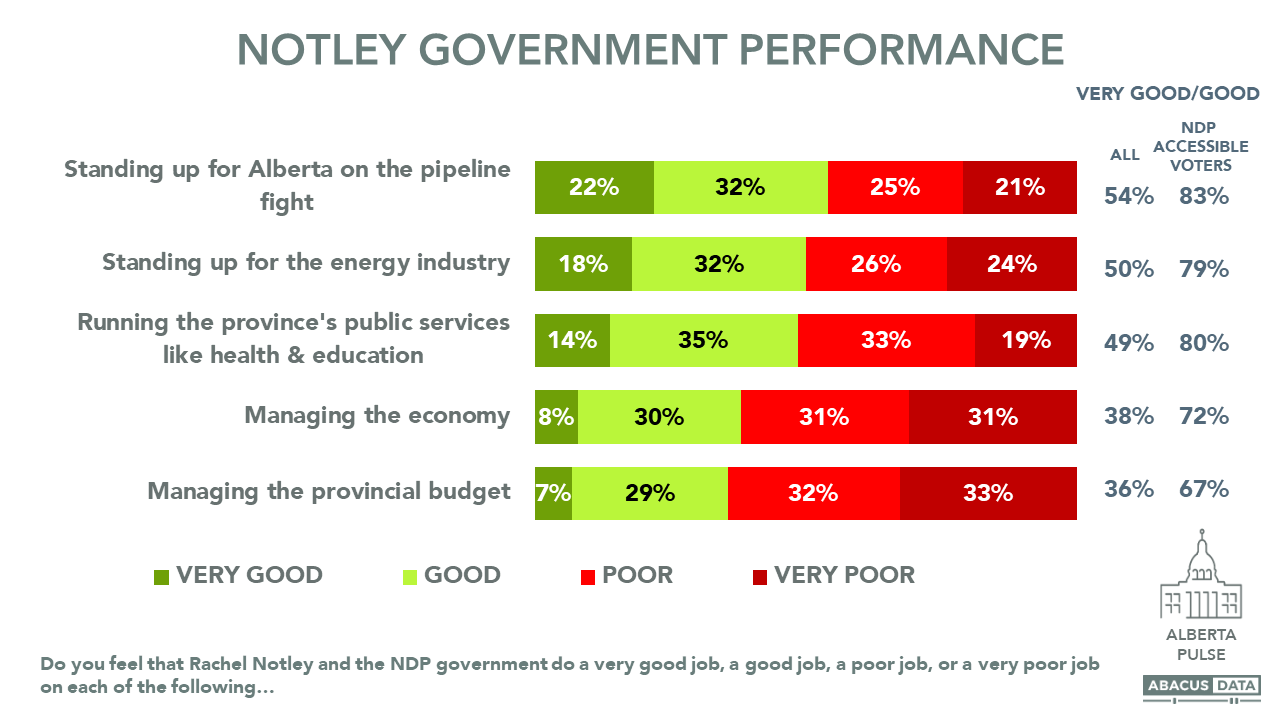
PREMIER NOTLEY AND HER GOVERNMENT GET GOOD MARKS FOR STANDING UP FOR THE ENERGY SECTOR AND RUNNING PUBLIC SERVICES BUT STRUGGLES ON ECONOMIC AND BUDGET MANAGEMENT.
When we ask respondents to rate the performance of the provincial government in a few areas, we find residents do hold different views depending on the issue. For example, about half of residents feel the government has done a good job standing up for Alberta on the pipeline flight or standing up for the energy industry. About half think the government has done a good job running the province’s public services.
But on questions of economic and fiscal management, less than four in ten feel the government has done a good job with at least 3 in 10 feeling the government has done a very poor job. This helps explain Jason Kenney’s focus on economic development and fiscal management as it appears to be a major vulnerability for the government.
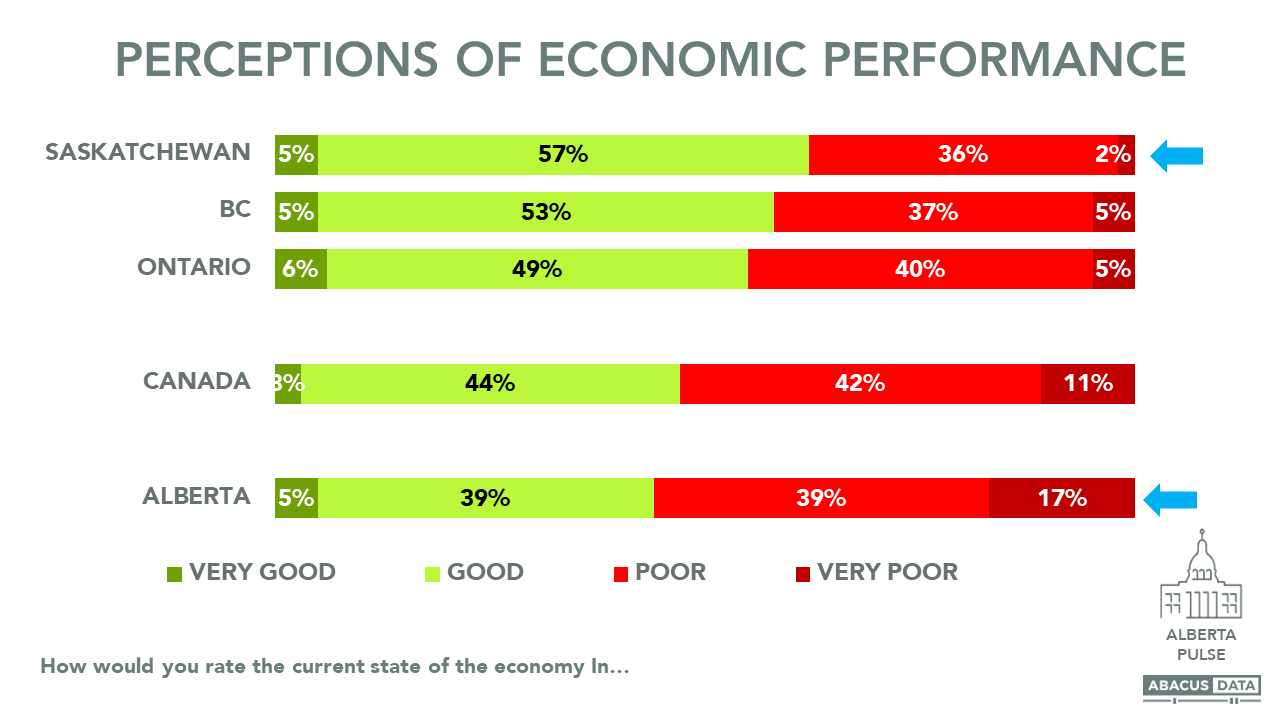
Broader perceptions about the state of the Alberta economy underscore this challenge. Most Albertans (56%) describe the provincial economy as poor or very poor. Another 5% describe it as very good and 39% say it is good.
When we ask about how things are going in other provinces and nationally, we find that Albertans are less bullish on the Canadian economy but generally feel that things are better in Ontario, BC, and especially neighbouring Saskatchewan where 62% describe the Saskatchewan economy as doing very good or good – 18 points fewer than think the same thing about the Alberta economy.
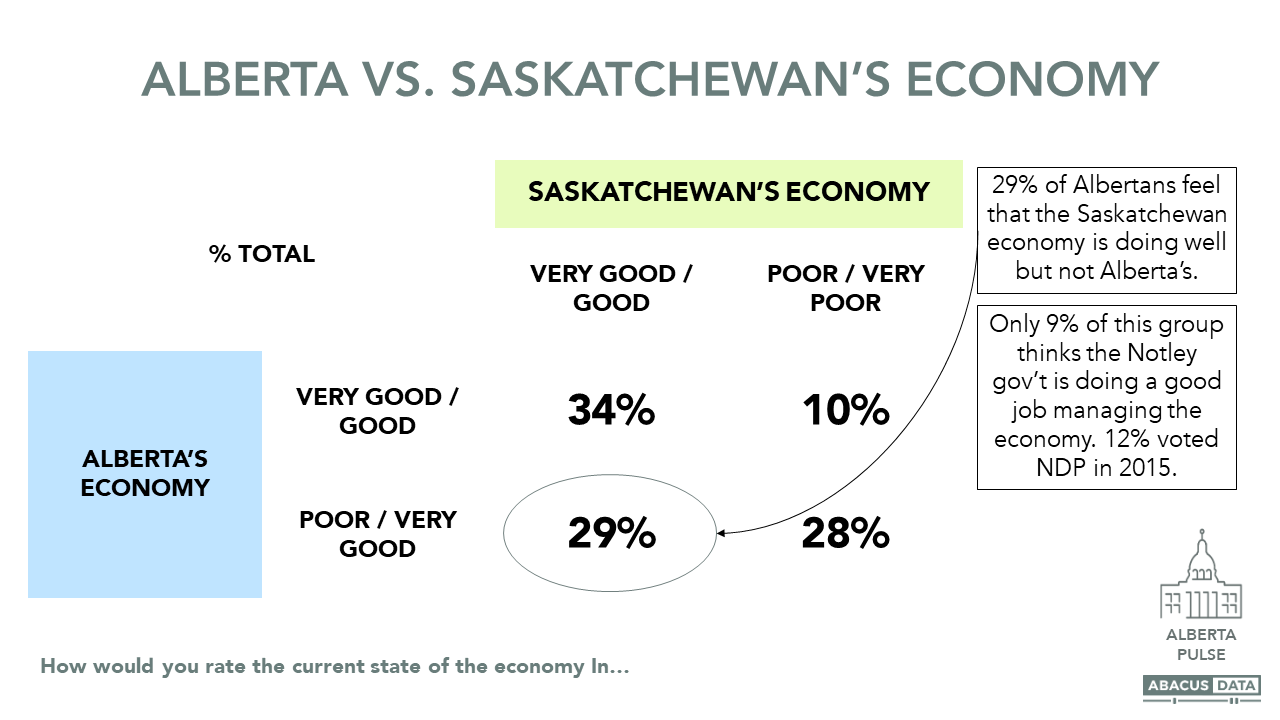
When we look specifically at perceptions of the Alberta and Saskatchewan economies, we find that 29% of Albertans feel the Alberta economy is doing poorly but feel the Saskatchewan one is doing well. This group holds quite negative views of the NDP government. Only 9% think the government is doing a good job managing the economy and only 12% voted NDP in 2015.
This difference in perceptions between how the economy is doing at home and across the provincial border in Saskatchewan is interesting and may be driving some of the underlying negativity towards the NDP government despite that fact that Alberta and Saskatchewan have similar unemployment rates and in 2017 and 2018, Alberta’s economy has grown at a faster rate than that of Saskatchewan.
UPSHOT
With about 7 months to go before the next Alberta election, the opinion environment for the NDP and Premier Rachel Notley is quite challenging. Two-thirds of Albertans want change, conservative-oriented voters have rallied and mostly united around Jason Kenney and the United Conservative Party, and despite some goodwill for Premier Notley, the smaller pool of accessible voters for the NDP means it has much less room for error and fewer paths to victory.
The UCP is in a strong position thanks to its effectiveness at uniting former PC and Wildrose party supporters. With a 15-point lead in vote intentions, a 13-point advantage in terms of accessible voters, and broad and deep support outside of Edmonton, the UCP is well positioned to win come next spring.
But a few data points suggest it’s still too early to call it for the UCP.
First, one in four Albertans are undecided and a majority of those undecided respondents said they voted in the previous election. Many are former NDP supporters who are somewhat disappointed with the government but are not fully comfortable with alternatives.
Second, compared with other premiers and provincial governments that have been defeated over the past year, Rachel Notley is more popular and the desire for change is not as intense as with those other cases. Albertans do give her credit for standing up for the province in the pipeline debate and recognize her efforts standing up for the energy industry. If the economic situation in the province and provincial finances continue to improve there may be space for an NDP comeback.
However, one challenge stands in the NDP’s way – the UCP and Jason Kenney. As long as conservative-oriented voters are united behind Jason Kenney and the UCP, even with all those who voted NDP back under the orange tent, the UCP would likely still win.
METHODOLOGY
Our survey was conducted online with 800 Albertans aged 18 and over from October 24 to 27, 2018. A random sample of panelists was invited to complete the survey from a set of partner panels based on the Lucid exchange platform. These partners are double opt-in survey panels, blended to manage out potential skews in the data from a single source.
The margin of error for a comparable probability-based random sample of the same size is +/- 3.5%, 19 times out of 20. The data were weighted according to census data to ensure that the sample matched Alberta’s population according to age, gender, educational attainment, and region. Totals may not add up to 100 due to rounding.
ABOUT ABACUS DATA
We are the only research and strategy firm that helps organizations respond to the unprecedented threat of generational change and technological disruption.
We are an innovative, fast-growing public opinion and marketing research consultancy. We use the latest technology, sound science, and deep experience to generate top-flight research-based advice to our clients. We offer global research capacity with a strong focus on customer service, attention to detail and exceptional value.
In our latest national survey, we asked respondents a series of questions about climate change, the federal approach to deal with the issue, and what they know and think about the federal leaders and their approach to climate change.
Here’s what we found:
THE SCALE OF THE CLIMATE ISSUE
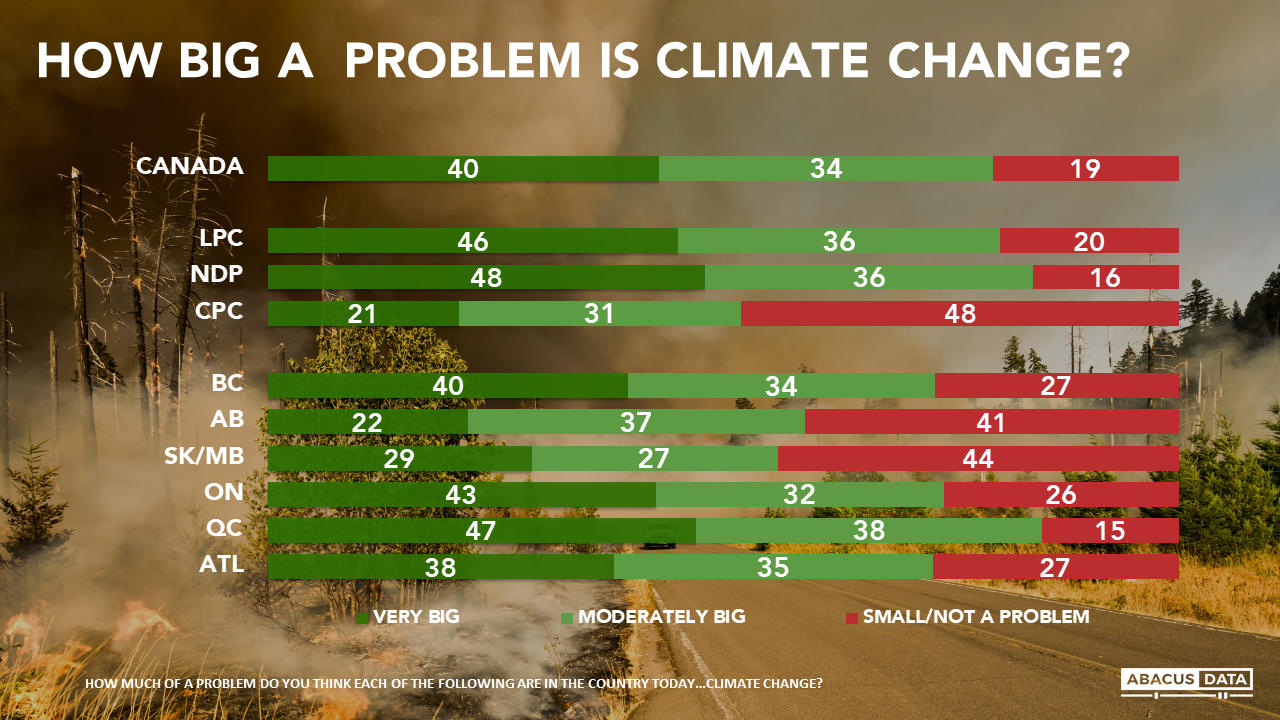
Eighty percent of Canadians believe climate change is a very big or moderately big problem today. Only one in five say it is a small problem or not a problem. Well known partisan and regional differences exist on this issue: Conservatives and Prairie residents are less preoccupied with the issue. However, this offers a warning signal for advocates at either end of the on the climate change debate spectrum.
• Among Conservative partisans, only half think the climate is not really a problem. Among Albertans, 59% say climate change is a moderately big or very big problem. Conservative leaders who appear to be dismissive of the issue may find some of their base unhappy at that choice
• On the other hand, some environmental advocates may want to reflect on the fact that after decades of strident advocacy many voters see it as an important problem – among others – to be considered by political leaders.
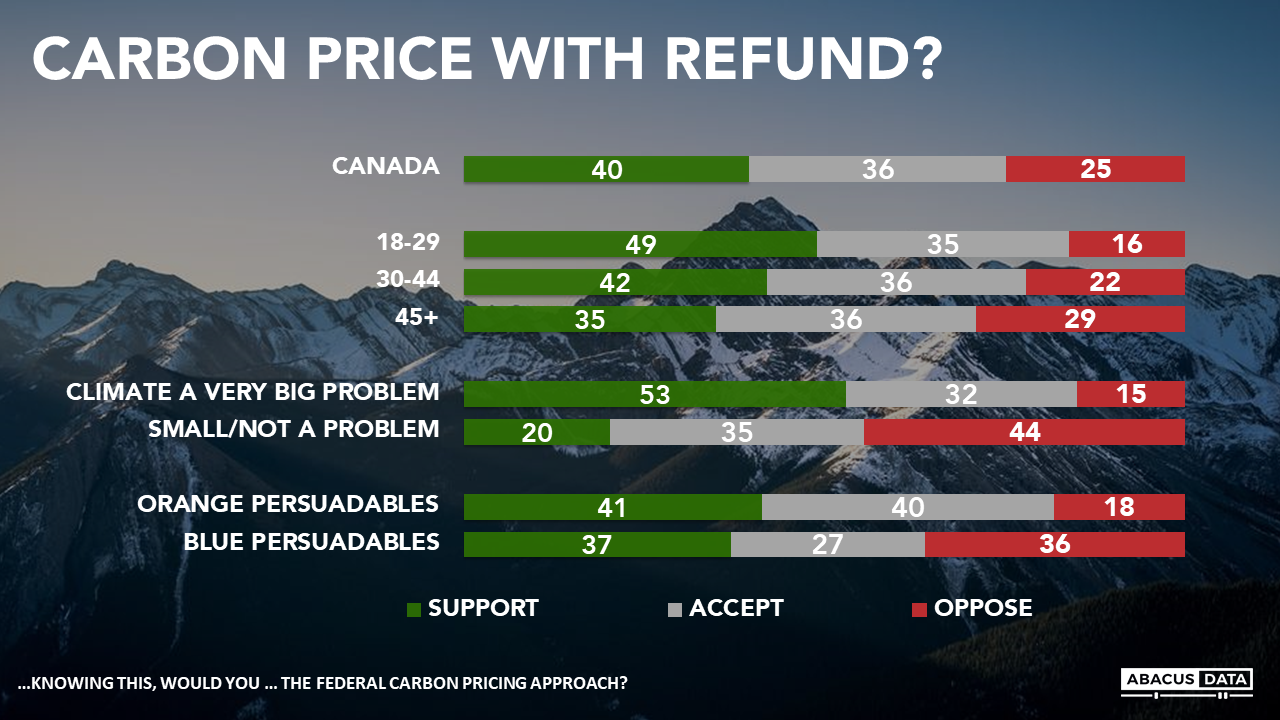
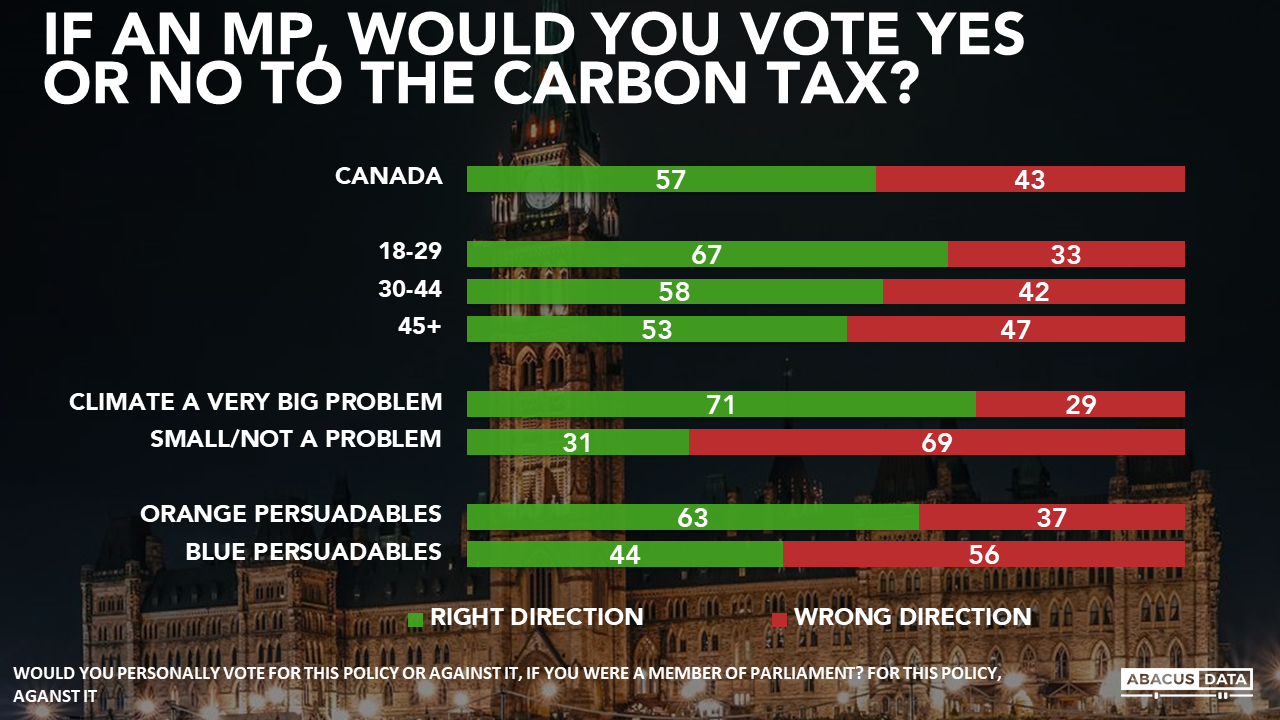
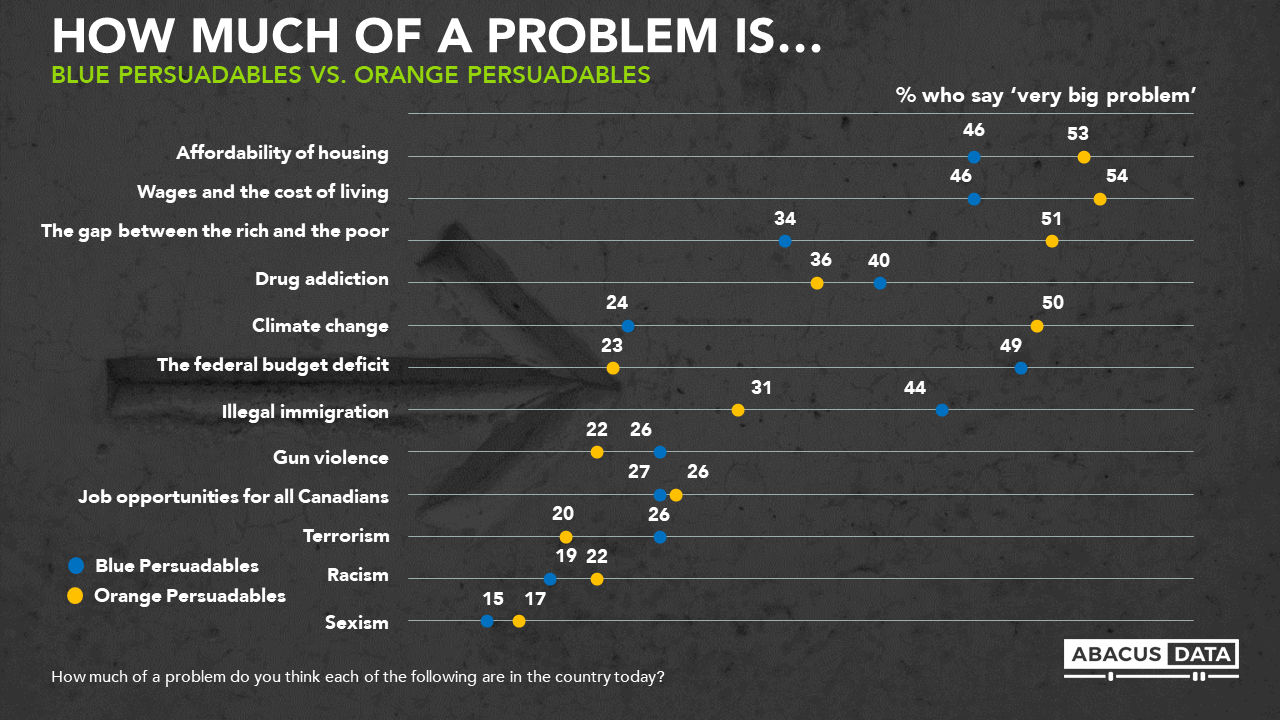
• As the Liberals consider strategy in the run-up to the election, they will note that “Orange Persuadables” (voters leaning NDP but saying they could consider the Liberals) are 10 points more likely than average to say that climate change is a very big problem. Among Blue Persuadables, one in four say climate change is a very big problem. In other words, if the election looks like it is turning into a binary choice between a Liberal Party with a climate agenda and a Conservative Party that is almost silent on the issue, there are votes that could coalesce to the Liberals’ advantage.
• Women are 9 points more likely than men to say climate change is a very big problem. Differences in concern by generation are modest. For Conservative strategists, a lack of climate policies could exacerbate a gender challenge and with no particular upside among older voters.
BELIEF IN CLIMATE CHANGE EVIDENCE
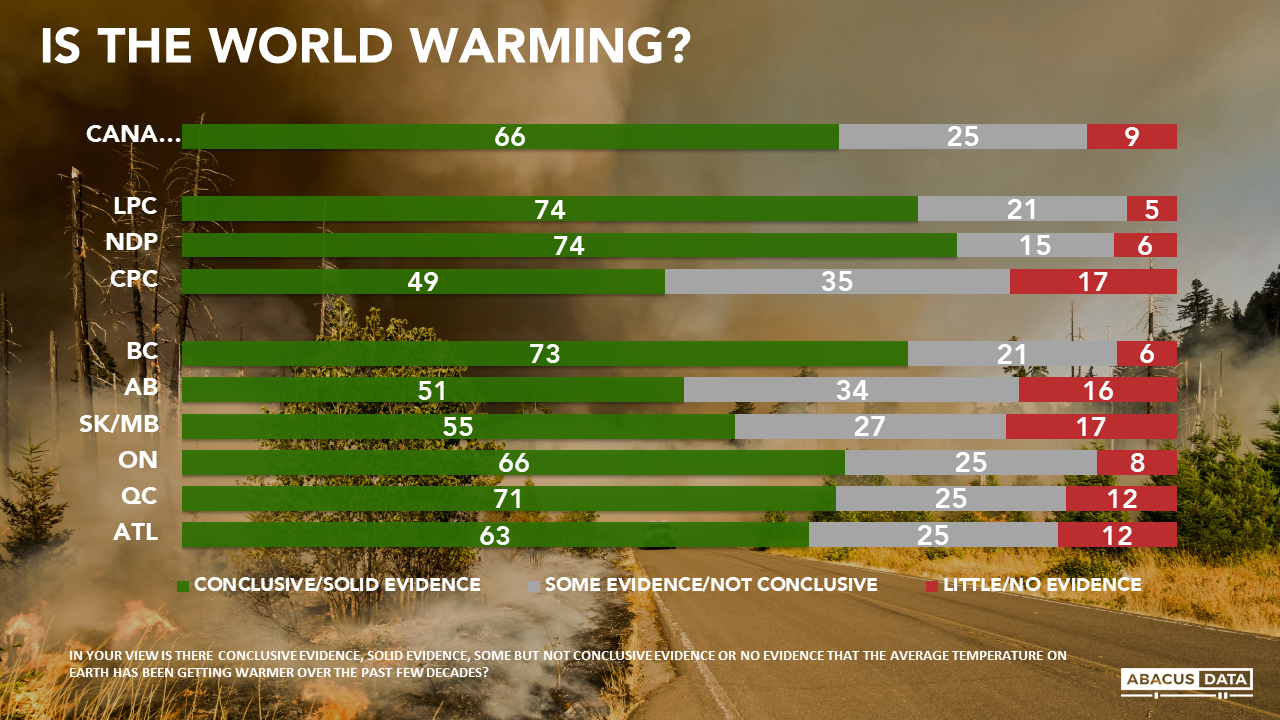
Two-thirds of Canadians feel there is conclusive or solid evidence that the earth is warming. Only 9% say there is little or no evidence. Half of those inclined to vote Conservative say the evidence of climate change is now conclusive or solid. Half of Alberta voters also believe this.
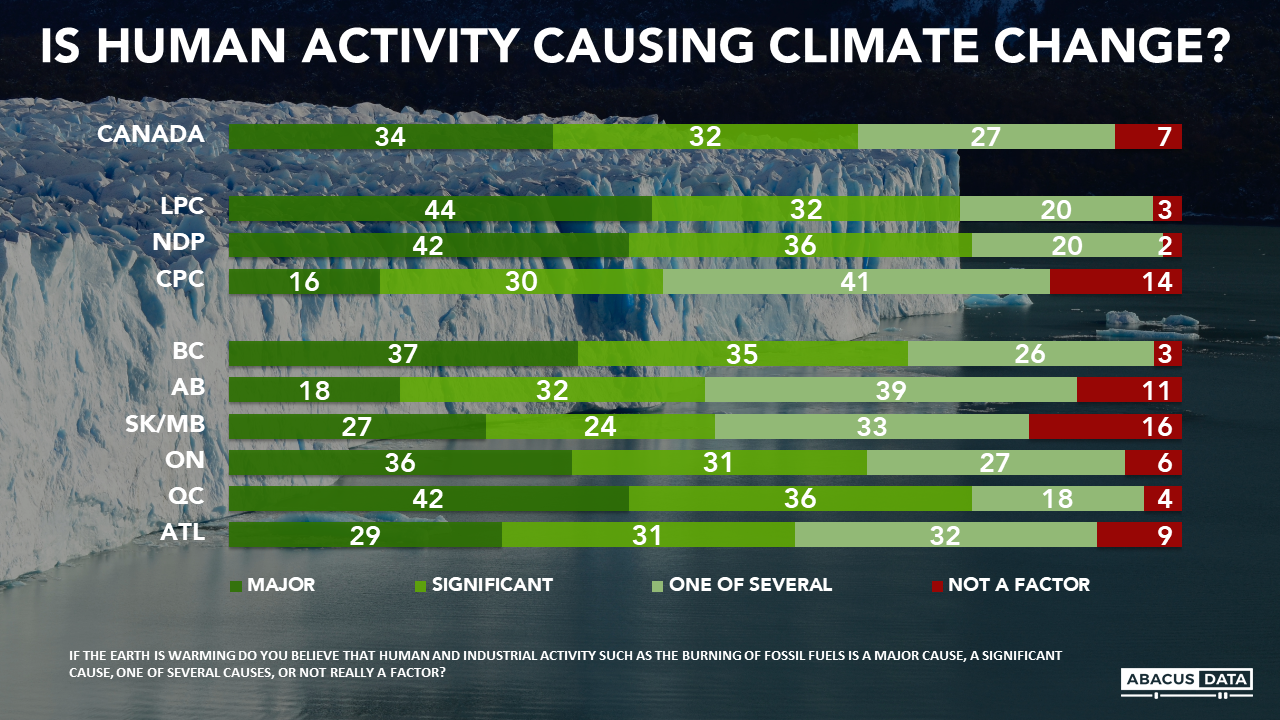
More than 9 in 10 people believe that if the planet is warming, humans are at least part of the problem, and two-thirds call human and industrial activity such as the burning of fossil fuels a major or significant cause. Among Conservative voters, only 14% deny any impact of human and industrial activity, and only 11% of Albertans feel that way.
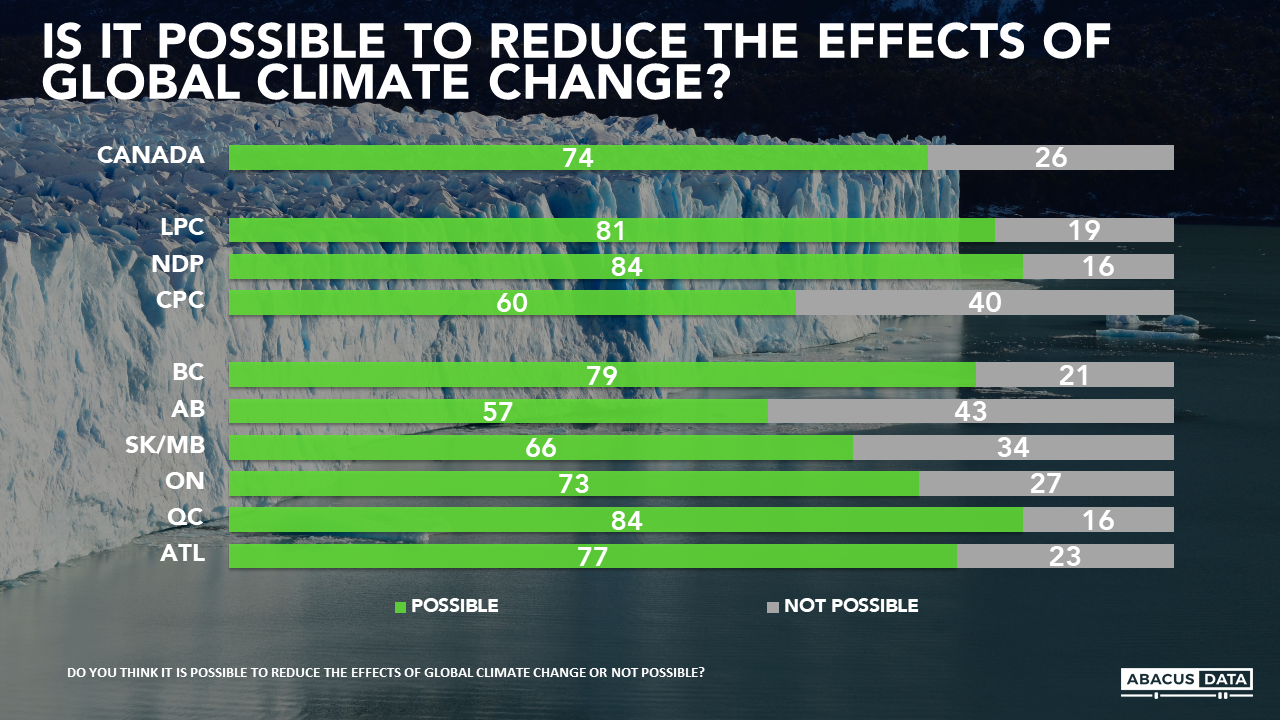
Broadly, Canadians also believe that it is possible to reduce the effects of climate change. This includes about 6 in 10 Alberta and Conservative voters.
REACTIONS TO FEDERAL CLIMATE PRICING POLICY
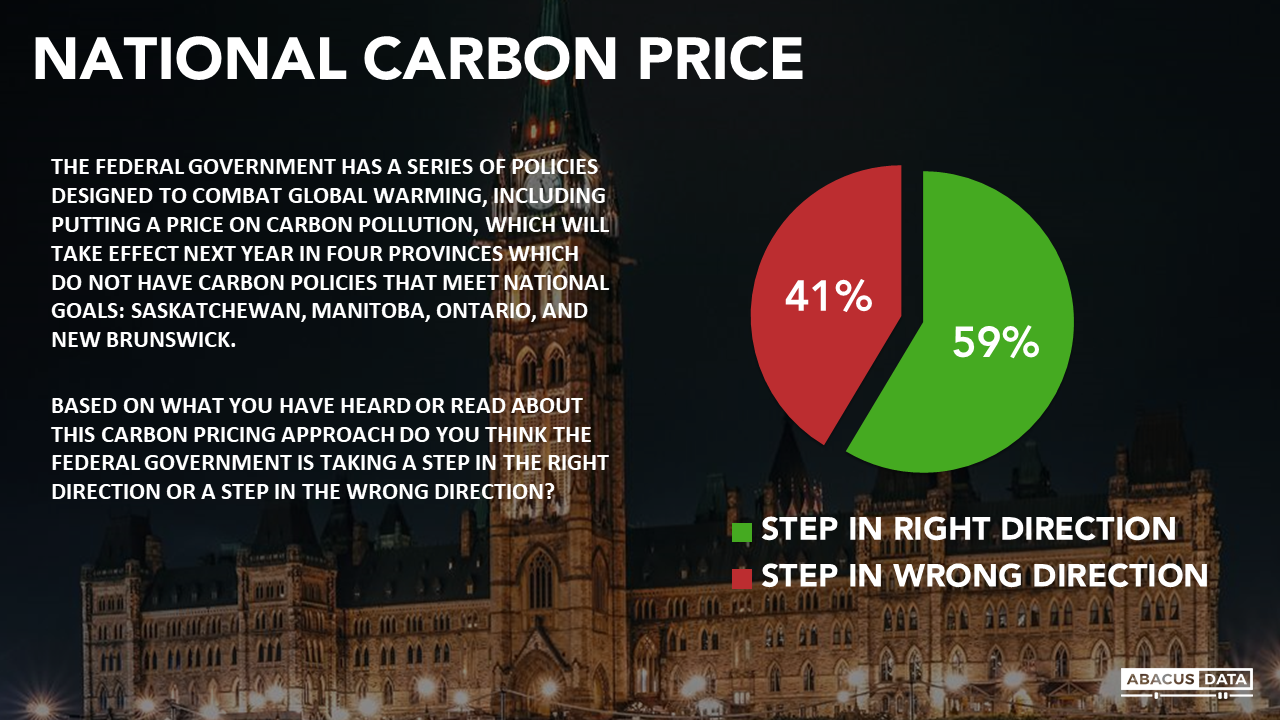
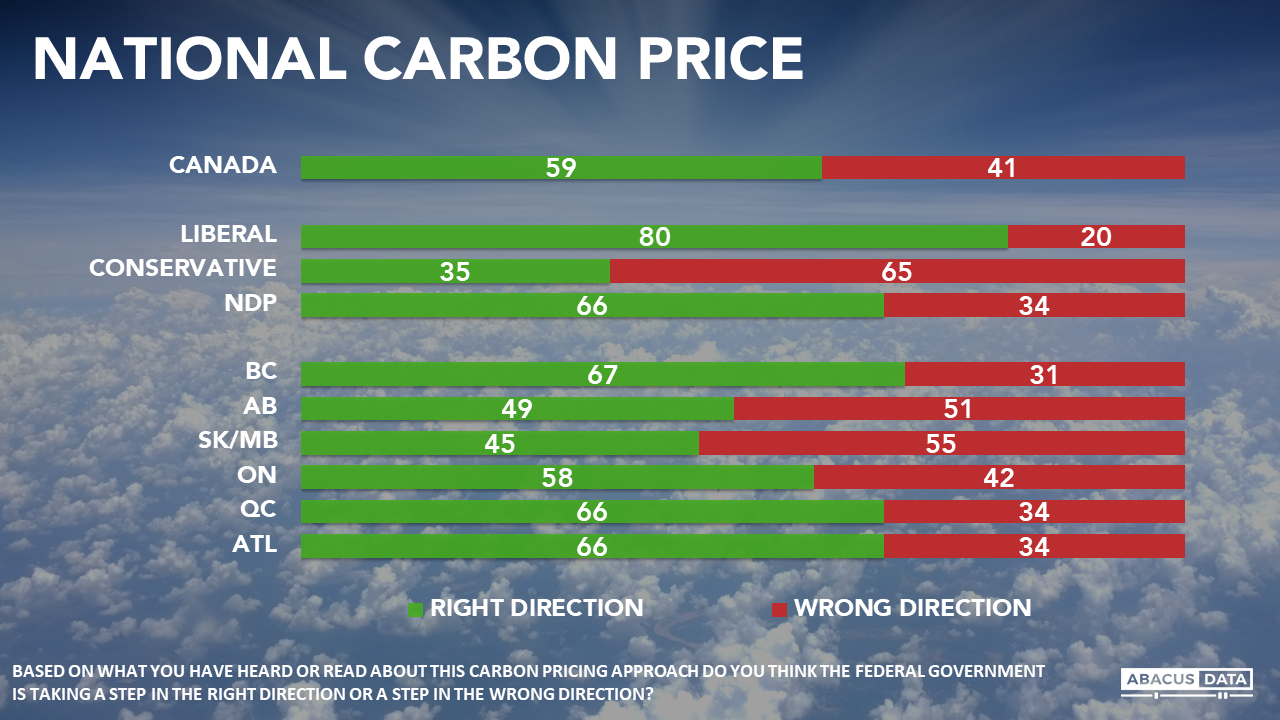
We provided a basic description of the federal policy approach to pricing carbon and asked for reactions. Fifty-nine percent (59%) thought it was a step in the right direction including roughly half of those living on the Prairies, a third of Conservative voters, and two-thirds of NDP voters.
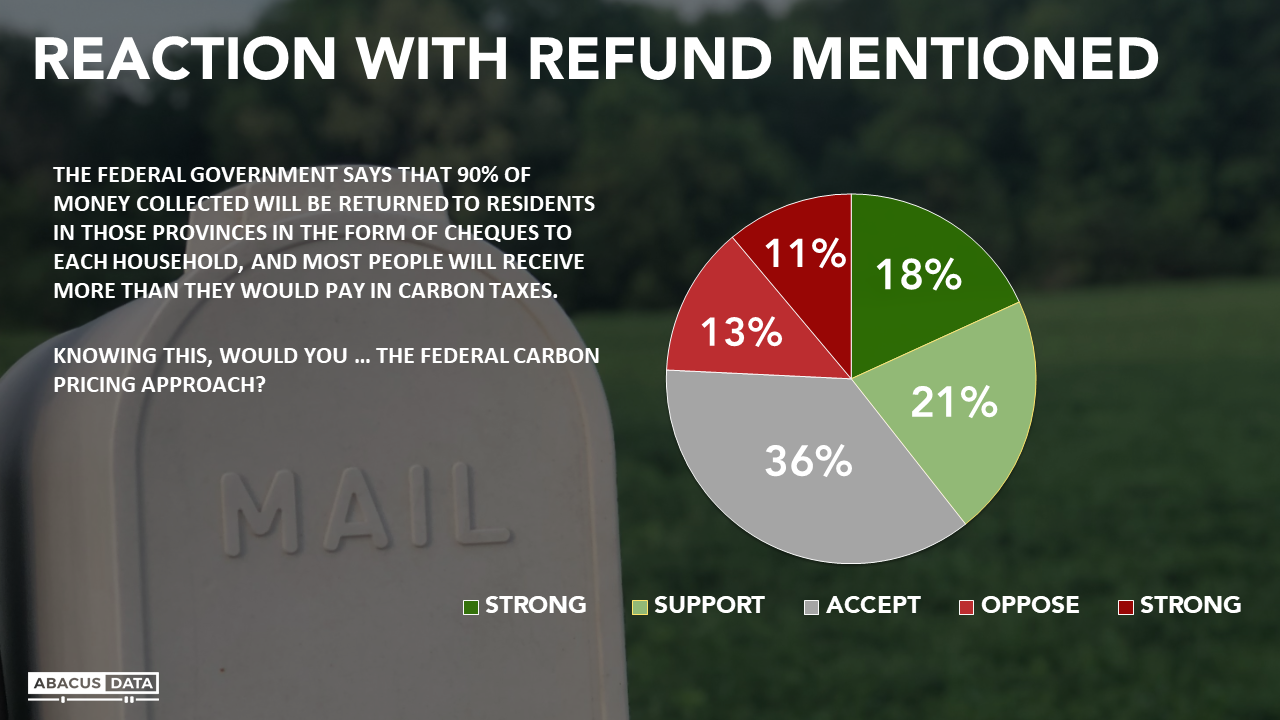
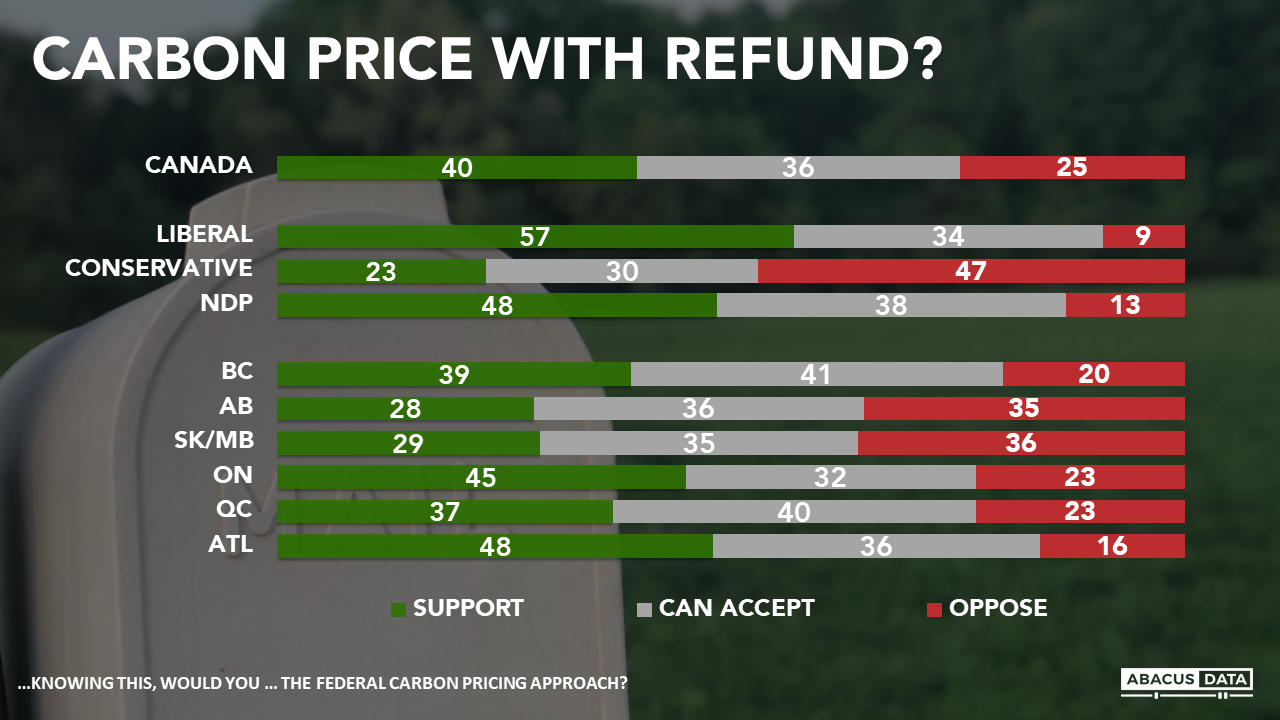
A second question included information about the rebate to affected households and found discomfort with the federal policy dropped to 24%. Strong support at 18% was larger than strong opposition (11%). Half of Conservative supporters and about two-thirds of Prairie residents say they support or can accept this approach. In Ontario, support is twice as common as opposition.
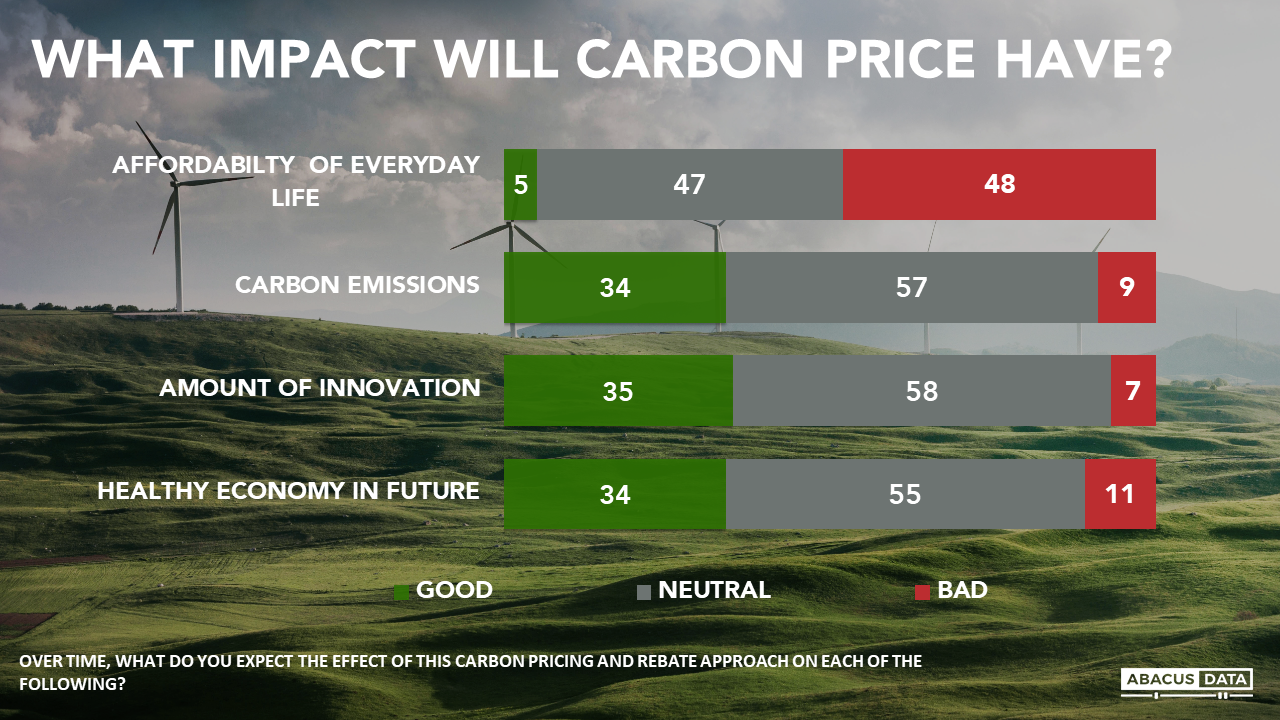
While opposition to the federal approach is softer than some might imagine, support for the policy isn’t overwhelming or unqualified. Half think it will increase the cost of living, which given the importance of cost of living issues these days remains a significant risk for advocates of this policy. The fact that only a third are convinced this policy will lead to reduced carbon emissions is an important signal to federal advocates as well.
While people aren’t sure how much it will help innovation and economic growth, they are clearly more likely to believe the effect will be a positive one than a negative one. Only 11% think it will be harmful to the health of the economy in the future.
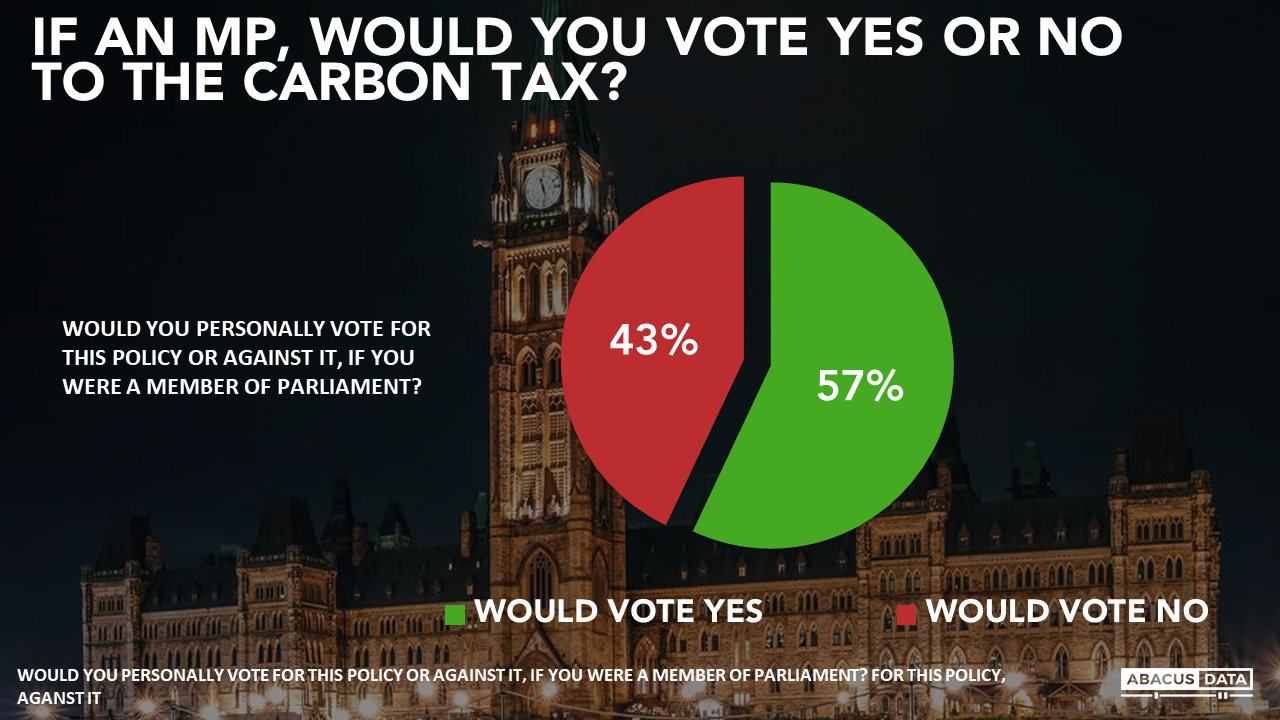
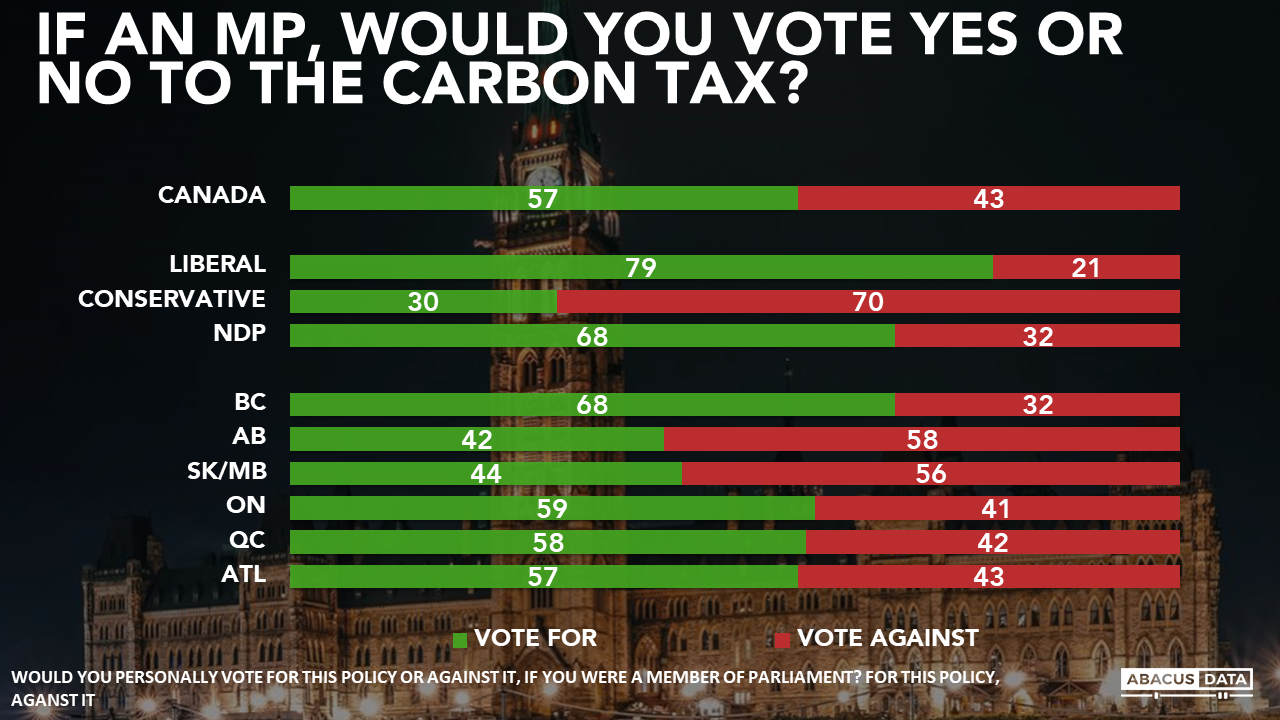
Asked if they would vote for this policy if they were a Member of Parliament, 57% say they would vote to pass it, including 79% of Liberal voters, 68% of NDP voters and 30% of Conservative voters.
In BC, 68% say they would endorse the federal approach, and just under 60% of voters in Quebec and Ontario say they would be a “yea” if they were MPs.
LEADERS AND ELECTORAL POLITICS
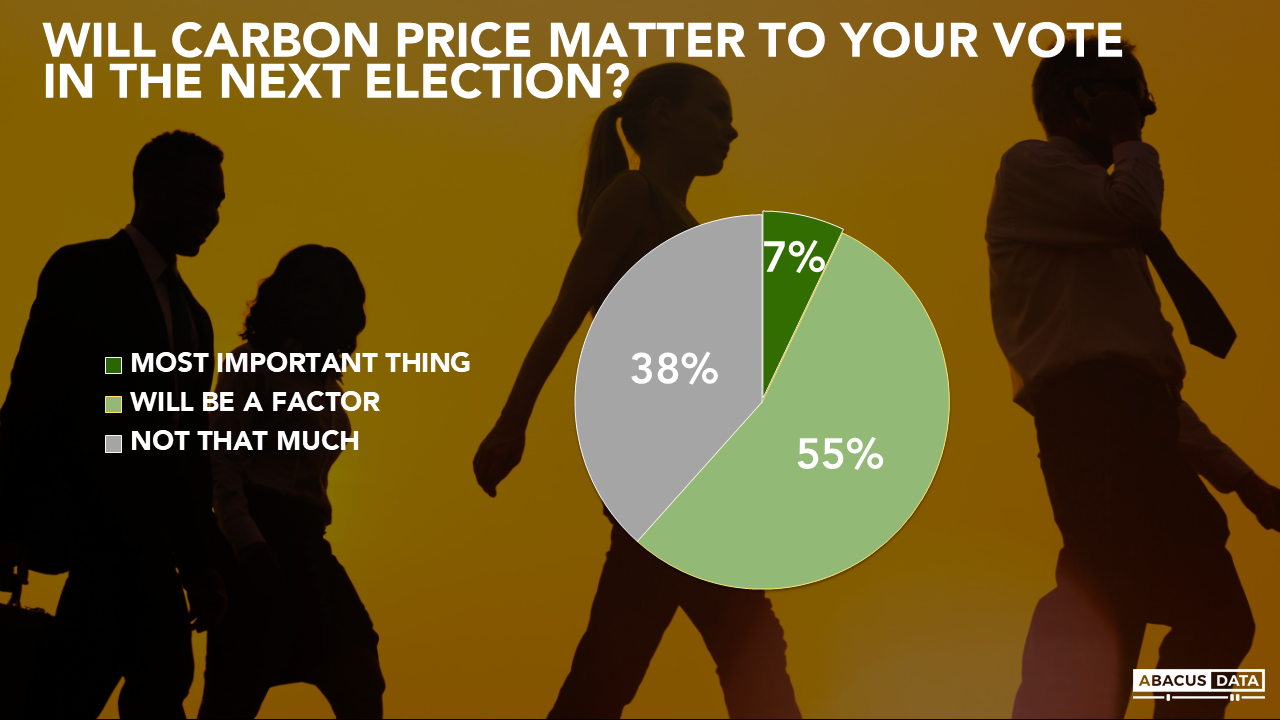
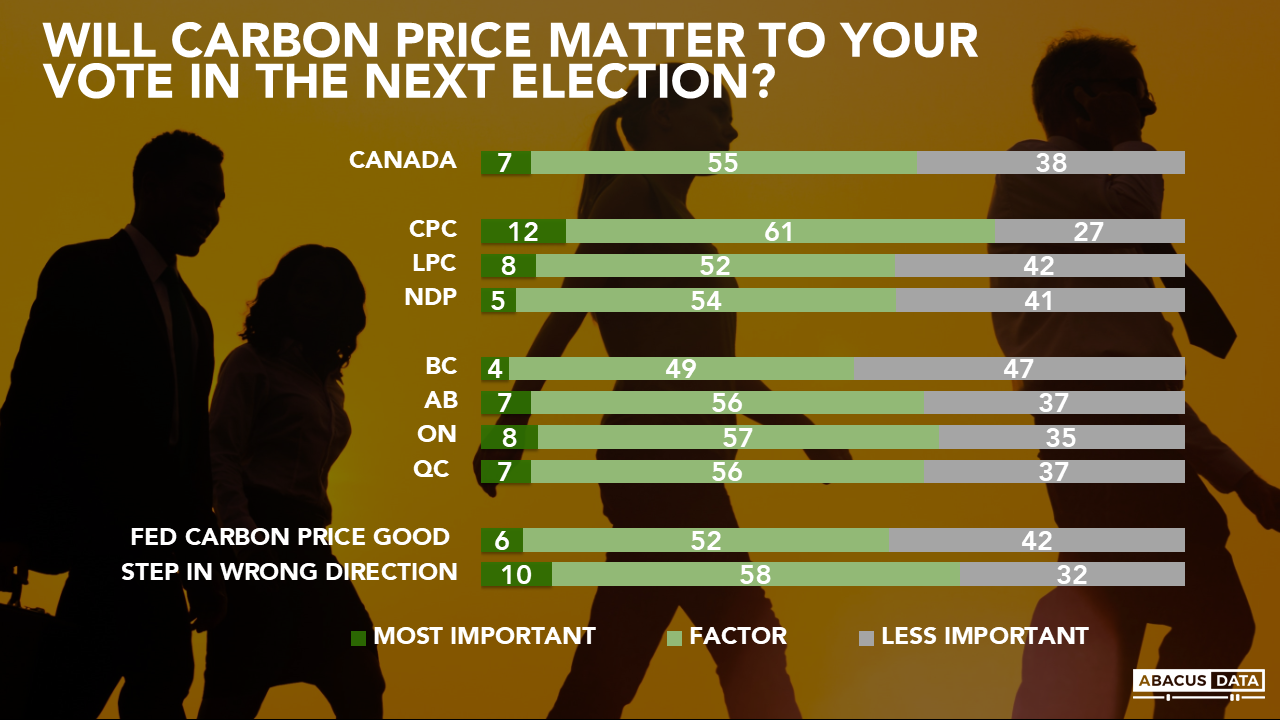
Conservative leader Andrew Scheer, has said that his first priority, if he wins the election in 2019, would be to abolish the federal carbon price, signaling an intention to make this a central campaign issue.
But today, only 7% say carbon pricing will be the most important issue to them, another 54% say it will be a factor, while more than a third say this policy will play a small role in their voting choice.
Among Conservatives, only 12% say it will be the most important issue. Among those who think the carbon price is a step in the wrong direction, only 1 in 10 says it will determine their vote.
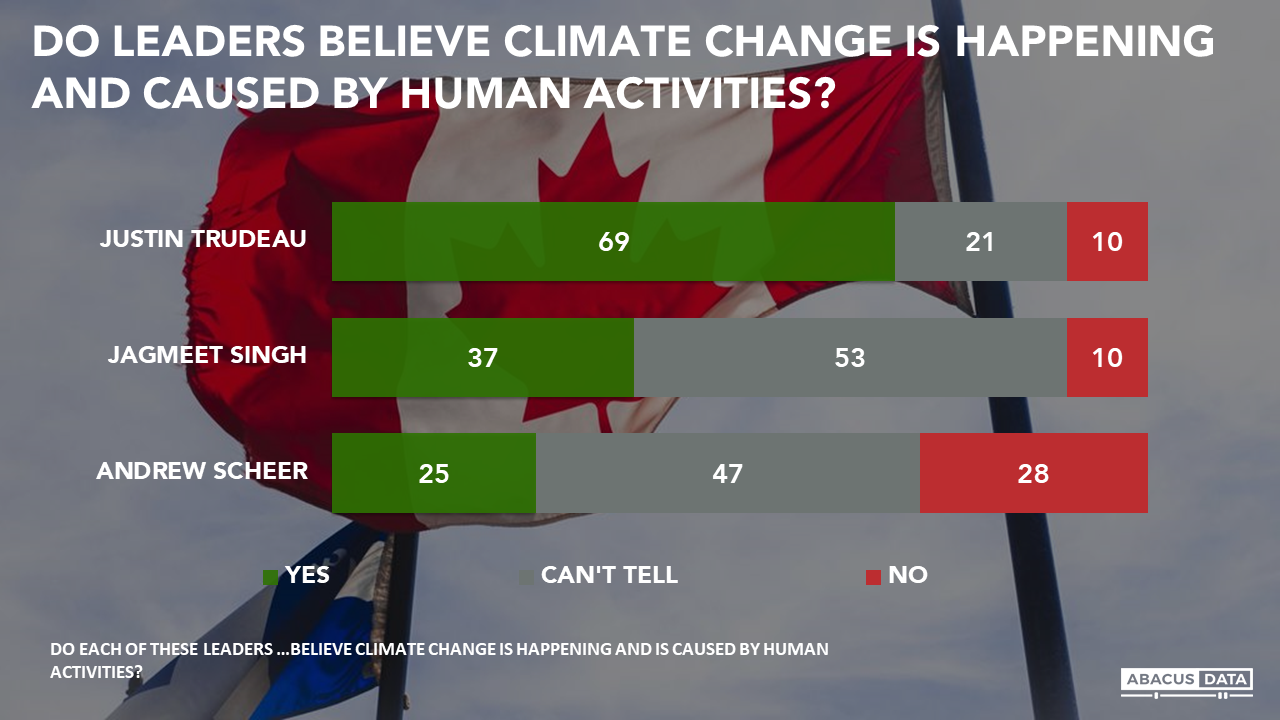
Most people think Prime Minister Justin Trudeau believes climate change is happening and is caused by human activities. Voters are less sure what Jagmeet Singh feels. As many think Andrew Scheer is a climate change denier as think he believes there is a problem and humans contribute to it.
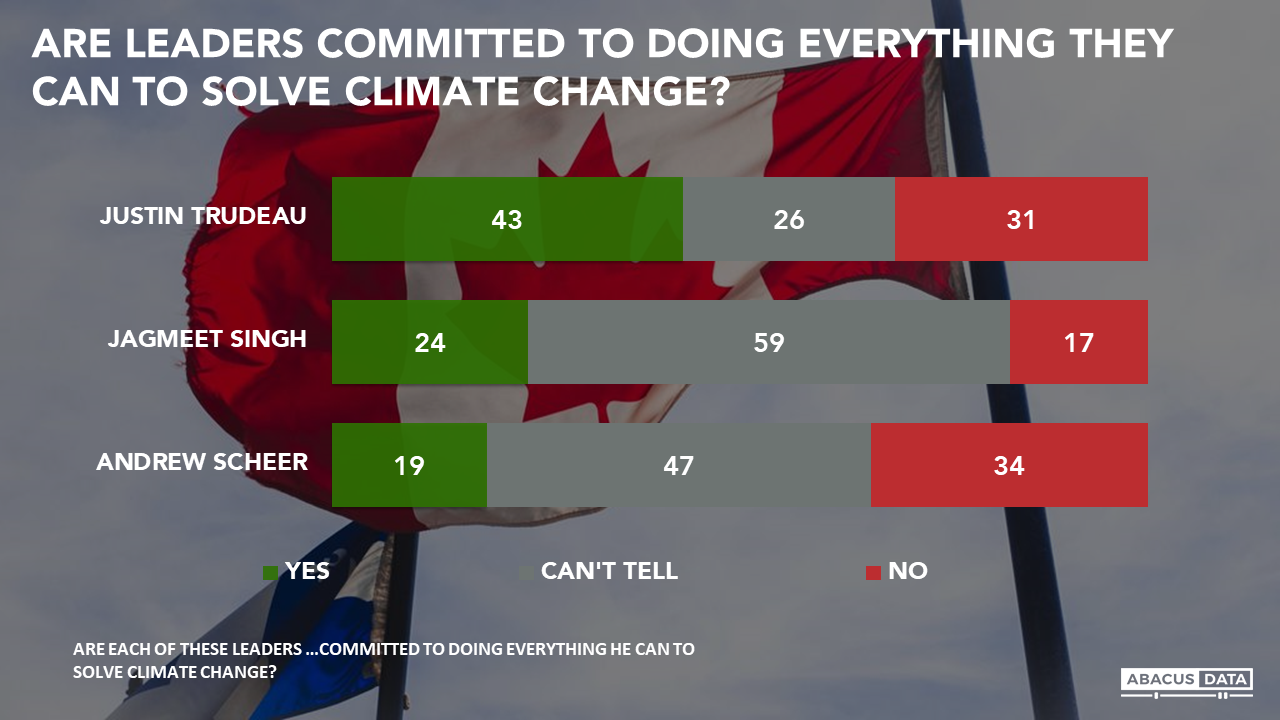
The plurality believes that Justin Trudeau is committed to doing everything he can to solve climate change. Most people can’t say whether Jagmeet Singh has this level of commitment and views of Andrew Scheer show more doubt than confidence in Mr. Scheer’s determination on the issue.
When asked if they are each listening to the advice of experts on the issue, the plurality believes Mr. Trudeau is doing so, while only a quarter think Jagmeet Singh and Andrew Scheer are.
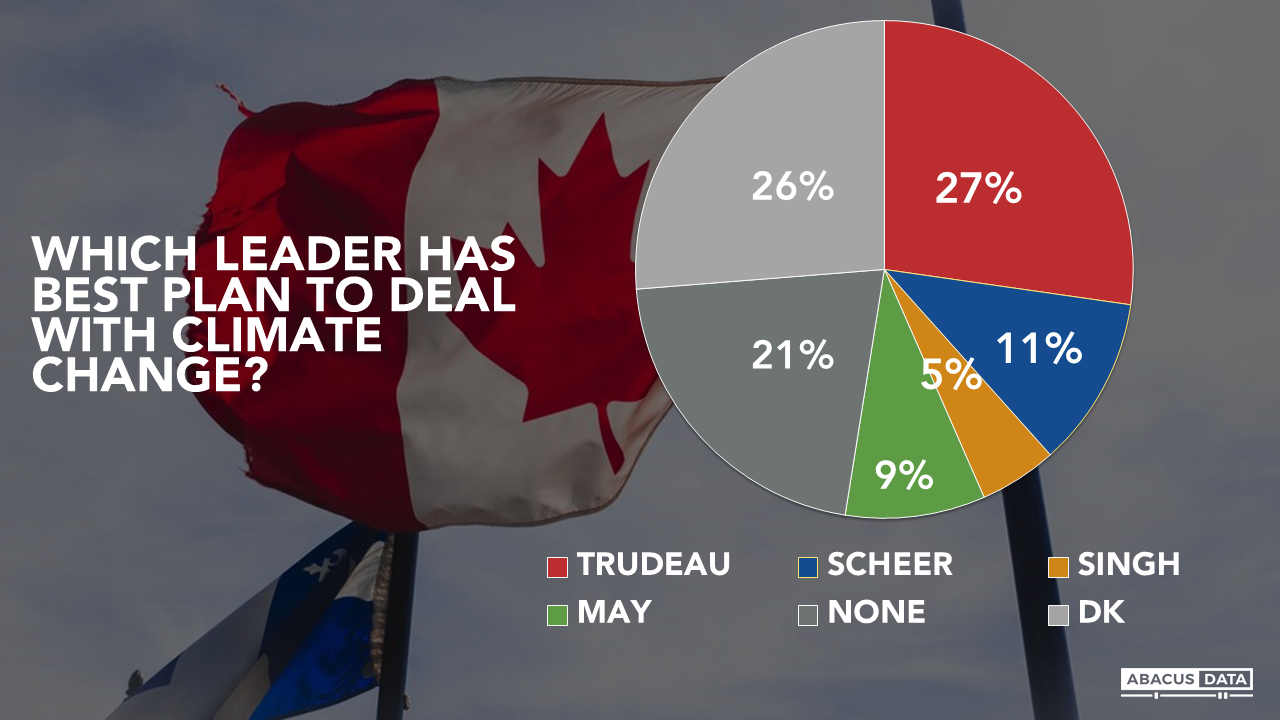
When asked which leader has the best plan to deal with climate change, Mr. Trudeau was picked by 27%, Mr. Scheer by 11%, Mr. Singh by just 5%, behind Elizabeth May (9%).
Among those who say carbon pricing will be a factor in how they vote, 29% felt Mr. Trudeau has the best plan followed by Mr. Scheer at 15%, Ms. May at 10%, and Mr. Singh at 5%.
Among those who voted NDP in 2015, as many say Mr. Trudeau (14%) has the best plan as say Jagmeet Singh does (13%). Among Conservative voters, only 40% say Mr. Scheer has the best plan. Among Blue Persuadables (swing voters) just 31% say Mr. Scheer has the best plan.
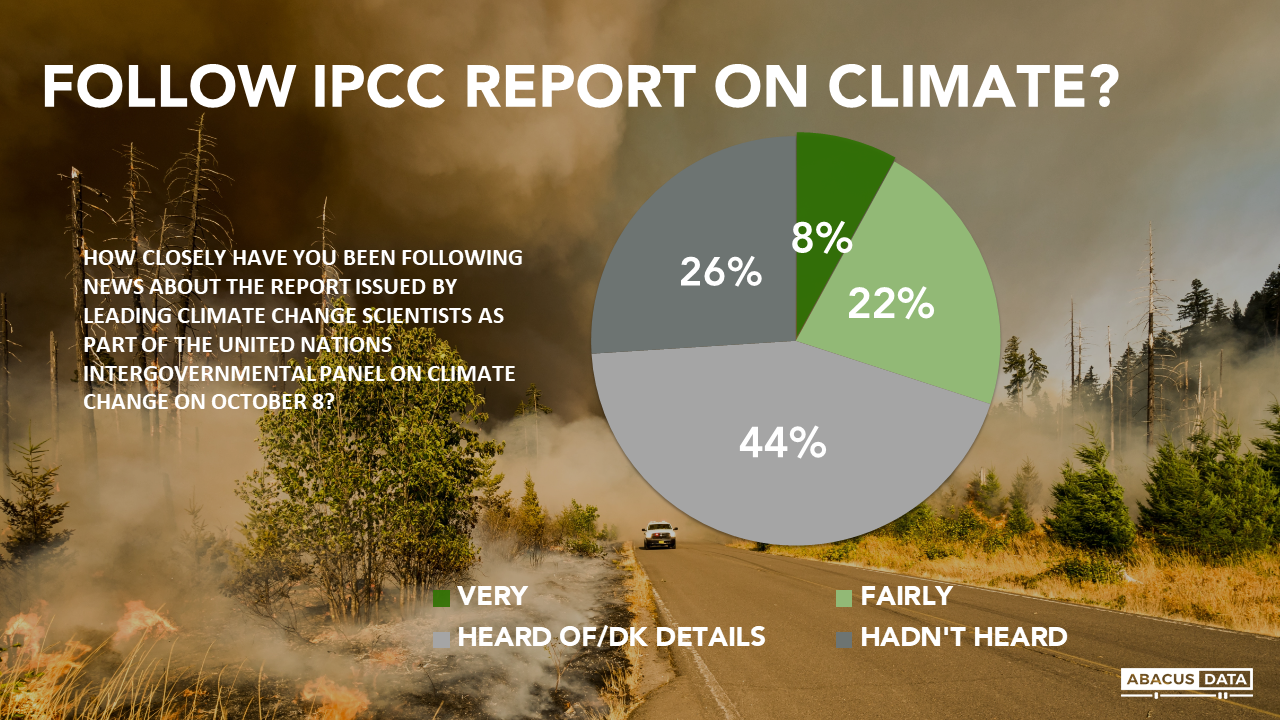
THE IPCC REPORT
About a third followed the news of the most recent report of the UN Panel on Climate Change very or fairly closely and 44% said they had heard of it but didn’t really know the details. Among those aware of the report, 45% said it left them more concerned suggesting more than 8 million voters felt increased concern about climate change as a result of this report
If you combine both the awareness and impact questions, we find that 33% of Canadians said they became more concerned because of the IPCC report, 36% were aware of the report but unaffected, 4% became less concerned while 26% were unaware of the report itself.
UPSHOT
According to Bruce Anderson: ”With the cost of housing and living among the biggest concerns for Canadians, it might be easy to imagine that Canadians will rally to campaigns to kill a national carbon price. But these results say that’s far from a foregone conclusion. Many Conservative voters share a concern about the climate issue and up to half are open to the idea of pricing carbon. The idea of rebating the tax to consumers cuts resistance to carbon pricing significantly.
Moreover, Canadians are signaling that they are concerned about climate change but think there are important other issues as well. They are not inclined to want an election about carbon pricing. This is true even among those who dislike the carbon pricing idea.
The challenges faced by the NDP are clear on this issue. Many of their potential supporters do not know much about where their leader stands and are inclined to think the Liberal approach is relatively aligned with their preferences. There is no evidence in these data that environmental critics of the government have rallied British Columbians or NDP voters against the Trudeau government based on energy and pipeline issues.
For the Conservatives, fighting a new tax may feel like a promising, almost ‘can’t fail’ proposition. However, it comes with some clear risks. Today, their leader is judged to care relatively little about an issue of rising public concern and is signaling he wants to make carbon pricing a central election issue, a choice that many CPC supporters have qualms about.”
According to David Coletto: “More broadly, our poll should offer both hope and concern for advocates of climate action in Canada. While most Canadians recognize that climate change is a big problem, that the effects of climate change can be mitigated, and most favour a national carbon price, there remains many who appear either ambiguous about action or are isolated from the debate about climate change.
Consider the finding that one in four Canadians were unaware of the recent IPCC report. Despite the widespread coverage it received in the new media, many were unaware of it. Almost half of those exposed to coverage of report say they became more concerned about climate change. As fewer Canadians consume mainstream news media and rely more on their social media feeds for news and information, it’s especially important for those who want to raise awareness and support for action on climate change need to be active where people are.
Politically, although most feel the federal approach to climate action is a good step and most support or can accept the federal carbon pricing plan that includes the consumer rebate, the minority opposed is large enough to become a significant electoral voice if it’s unified and mobilized. There’s a chance that one of the key battle lines for the next election could be on how to deal with climate change and which party has the best plan to do deal with it.
The Conservatives may be able to win if they can consolidate carbon tax opponents around them, but it’s no slam dunk given that a clear majority favour action and are concerned about the issue. If this group mobilizes and consolidates around the Liberals, there’s little room for the Conservatives to win in the minority on this issue.”
METHODOLOGY
Our survey was conducted online with 1,650 Canadians aged 18 and over from October 24 to 29, 2018 as part of Abacus Data’s national omnibus survey product (find out more). A random sample of panelists was invited to complete the survey from a set of partner panels based on the Lucid exchange platform. These partners are double opt-in survey panels, blended to manage out potential skews in the data from a single source.
The margin of error for a comparable probability-based random sample of the same size is +/- 2.2%, 19 times out of 20. The data were weighted according to census data to ensure that the sample matched Canada’s population according to age, gender, educational attainment, and region. Totals may not add up to 100 due to rounding.
ABOUT ABACUS DATA
We are the only research and strategy firm that helps organizations respond to the unprecedented threat of generational change and technological disruption.
We are an innovative, fast-growing public opinion and marketing research consultancy. We use the latest technology, sound science, and deep experience to generate top-flight research-based advice to our clients. We offer global research capacity with a strong focus on customer service, attention to detail and exceptional value.
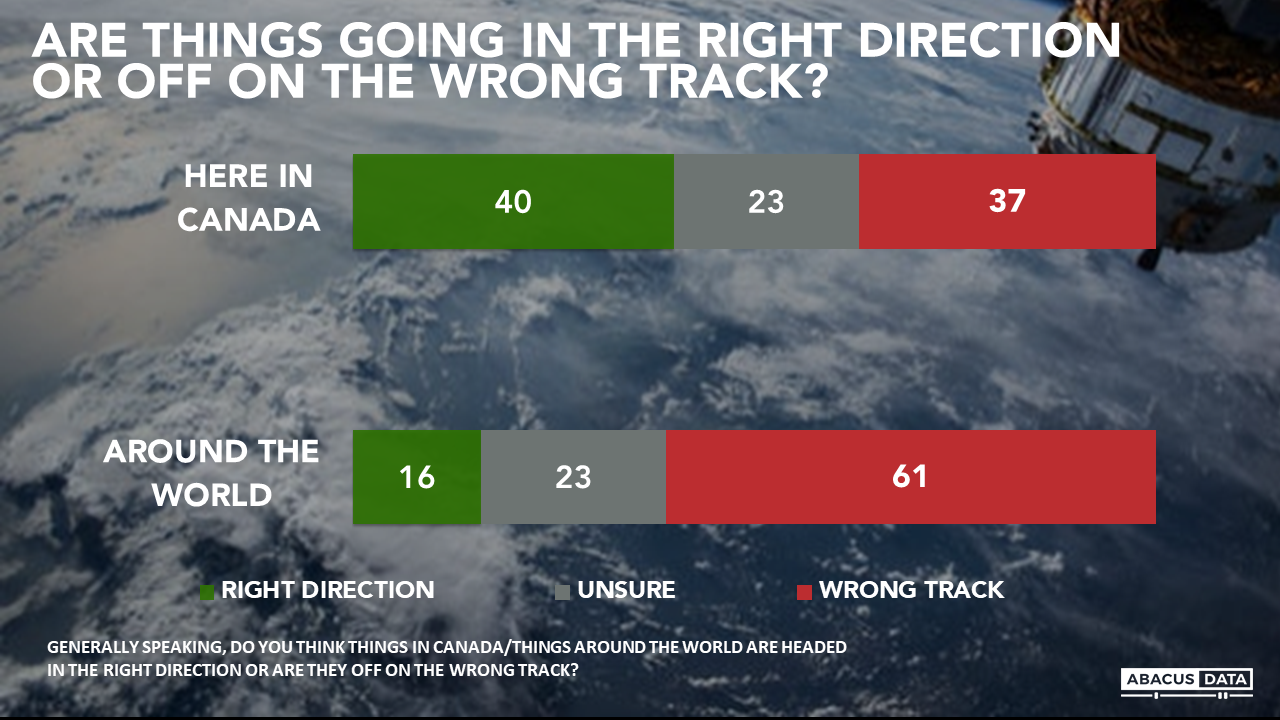
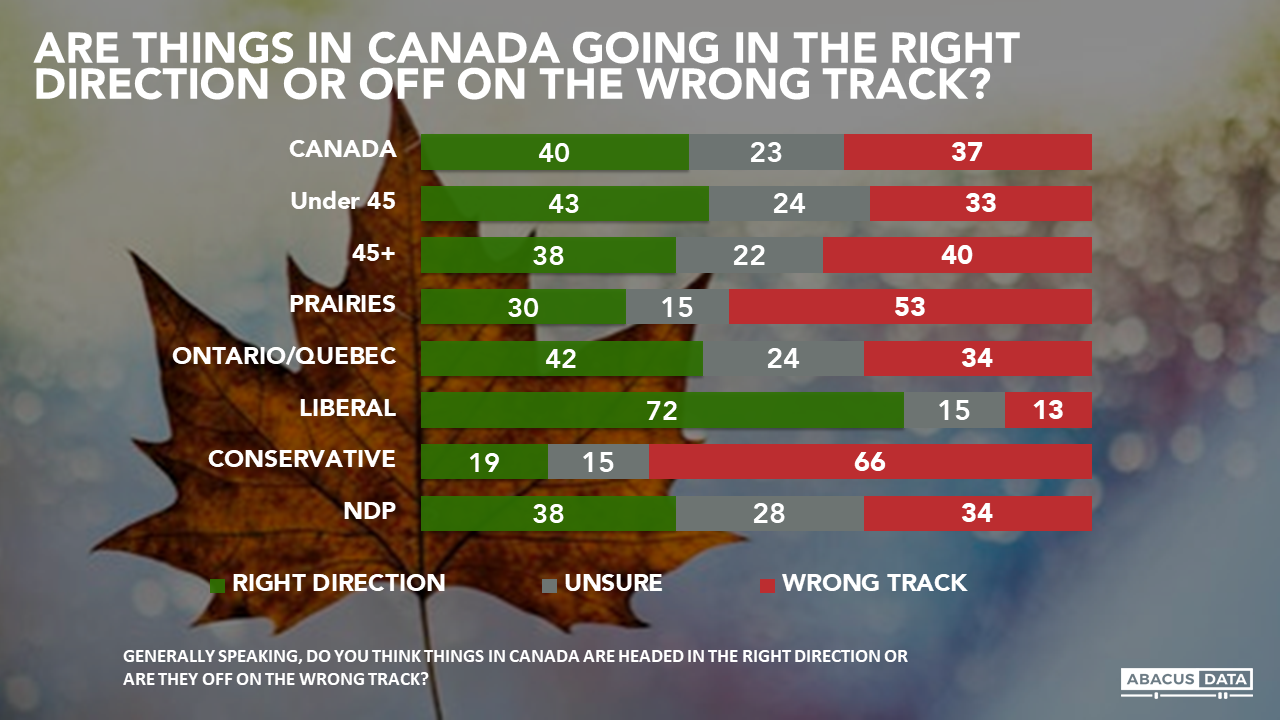
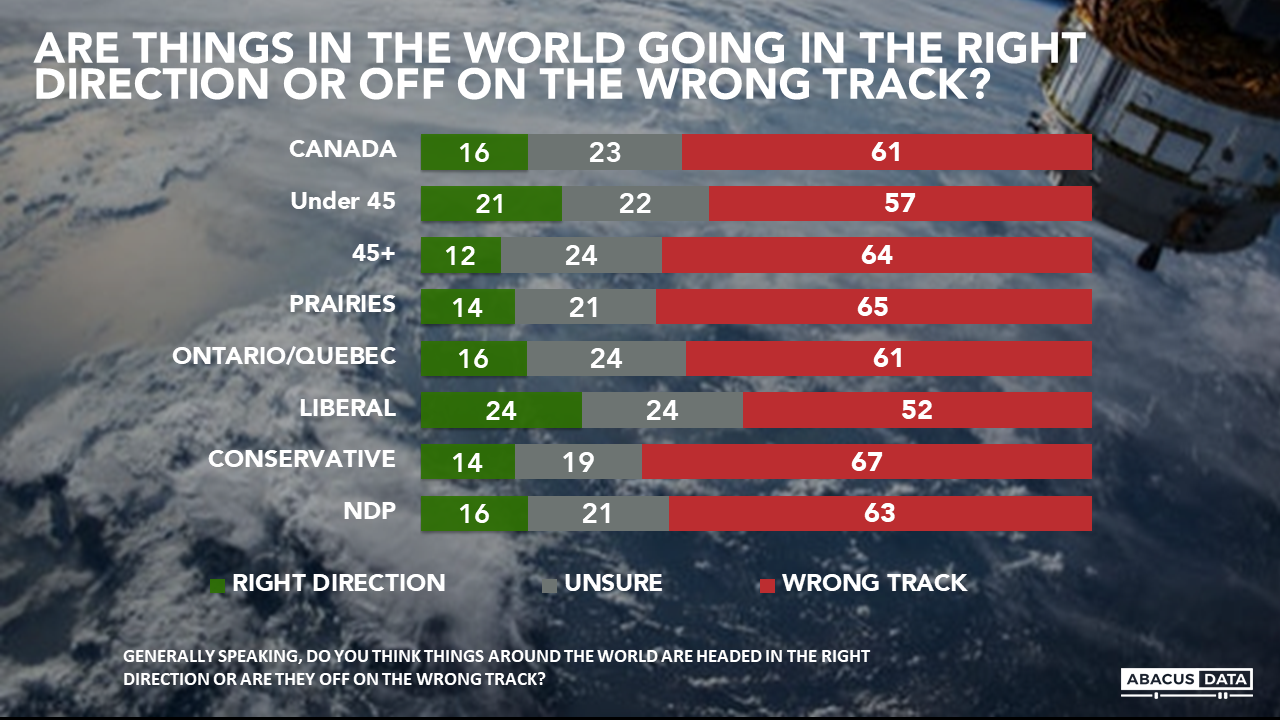
Canadians may be somewhat divided as to whether the country is heading in the right direction (40%) or off on the wrong track (37%), but compared to what we see in the rest of the world, the consensus seems to be things could be worse. Around the world, only 16% see things going in the right direction, while 61% say things are off on the wrong track.
There are regional, political and slight generational differences in feelings about the direction of things in Canada. Younger people are more likely to feel positive, and “right track” is the plurality response in BC, Ontario, Quebec and Atlantic Canada. Prairie residents and Conservative voters occupy the other end of the spectrum on this question.
But when evaluating the state of the world, differences in view among Canadians are modest – people in all age groups, regions, and every party believe the world is doing badly
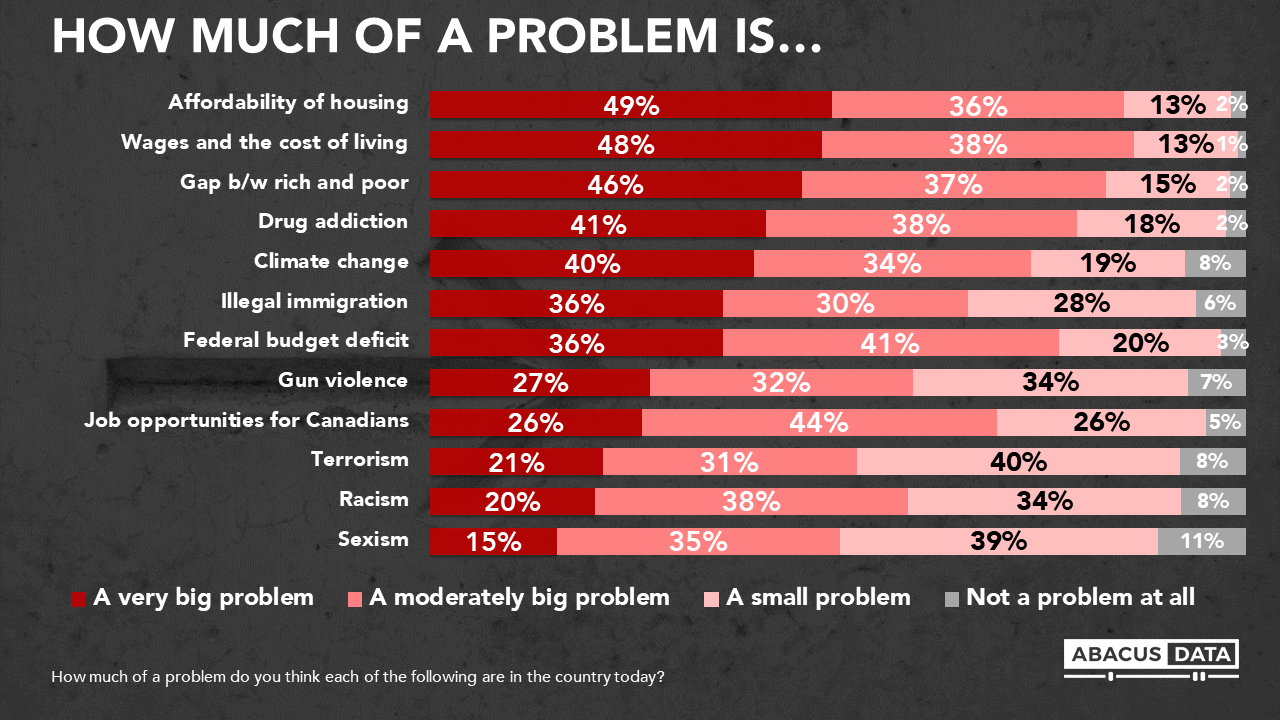
THE BIG PROBLEMS FACING CANADA
To dig into the issues that matter to people today, we used a question structure that the Pew Research team has used, allowing us to compare results in the US to those in Canada. We asked people to rate the seriousness of a series of issues in Canada. Here are some of the interesting findings of the leading concerns of Canadians.
-The adage holds that elections are always about the economy. But while the top economic concern is usually jobs, today, things are different. People are more concerned about wages, the cost of living, the cost of housing, and the gap between the rich and the poor.
-The opioid crisis has also become a large, mainstream concern. Drug addiction has probably never figured as prominently among the concerns of Canadians than it does today.
-Climate change ranks relatively high on the list of concerns, just slightly ahead of illegal immigration and the federal deficit.
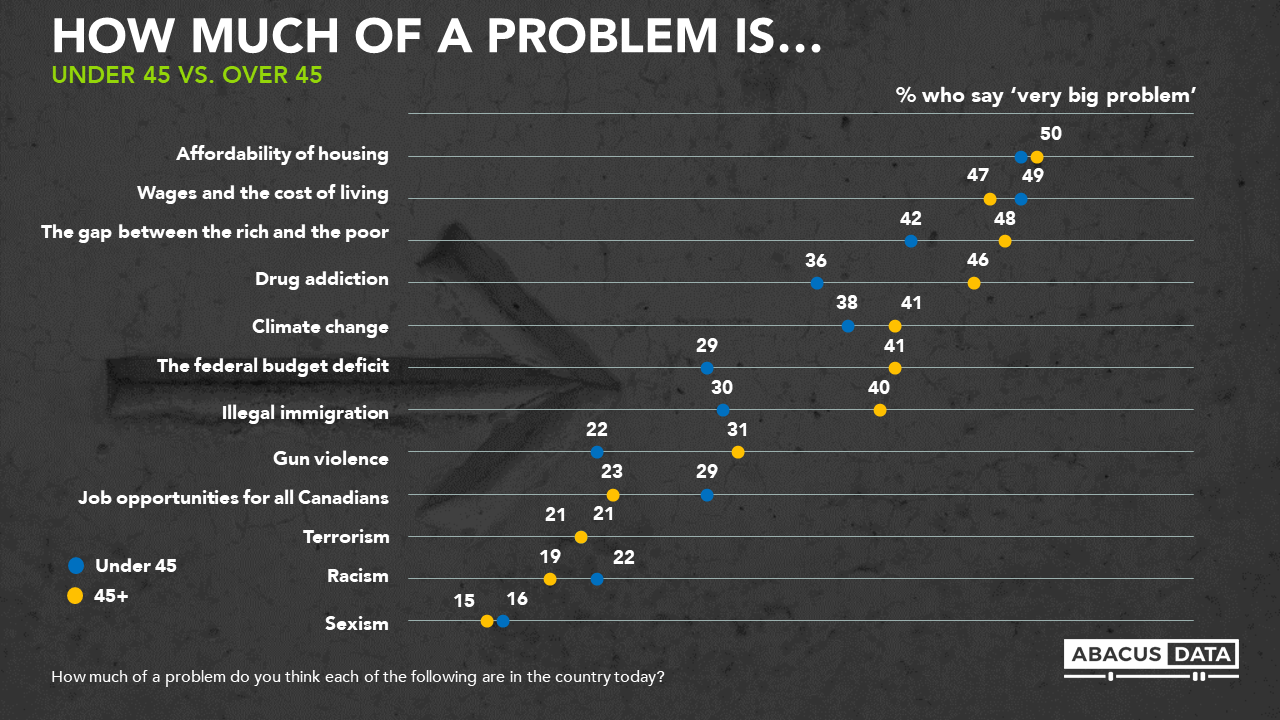
For the most part, the hierarchy of top problems is similar for younger as for older Canadians, but older people put more emphasis on drug addiction, the budget deficit, and illegal immigration while younger Canadians are more likely to feel that job opportunities and racism are problems.
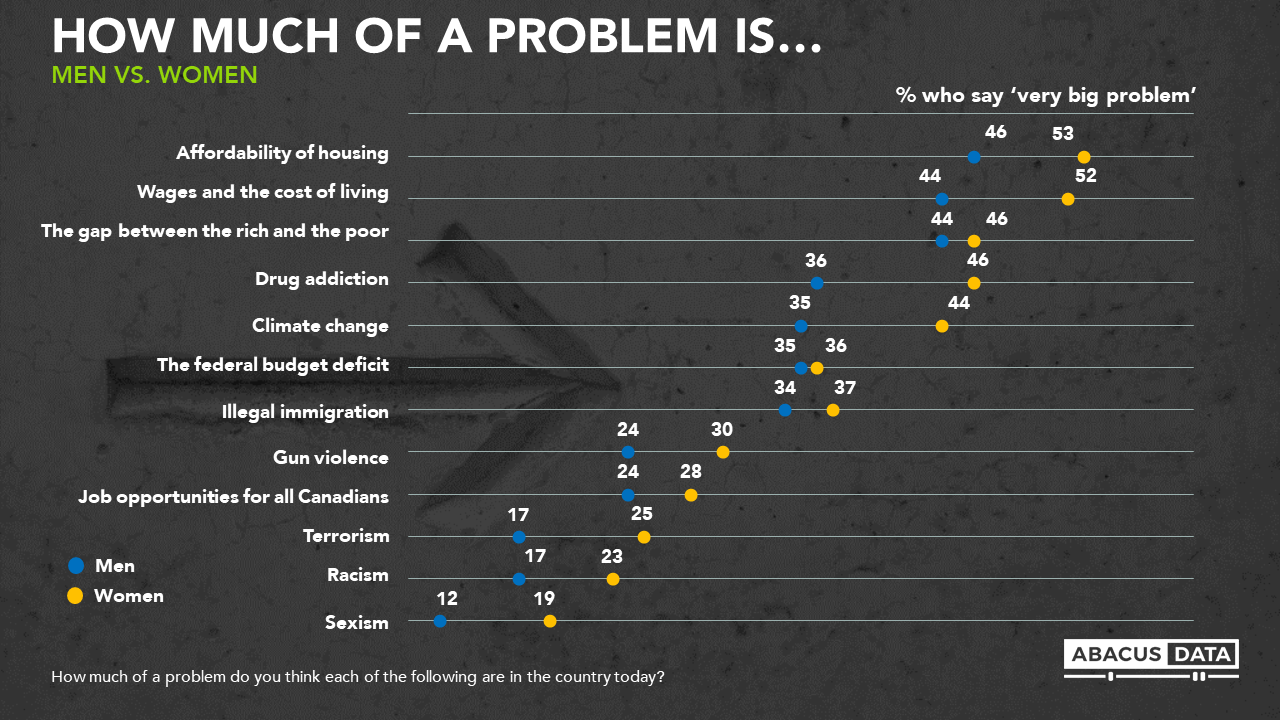
Women rated all the issues more seriously than men. The gap is largest on housing affordability, wages, and cost of living, drug addiction, climate change, and sexism.
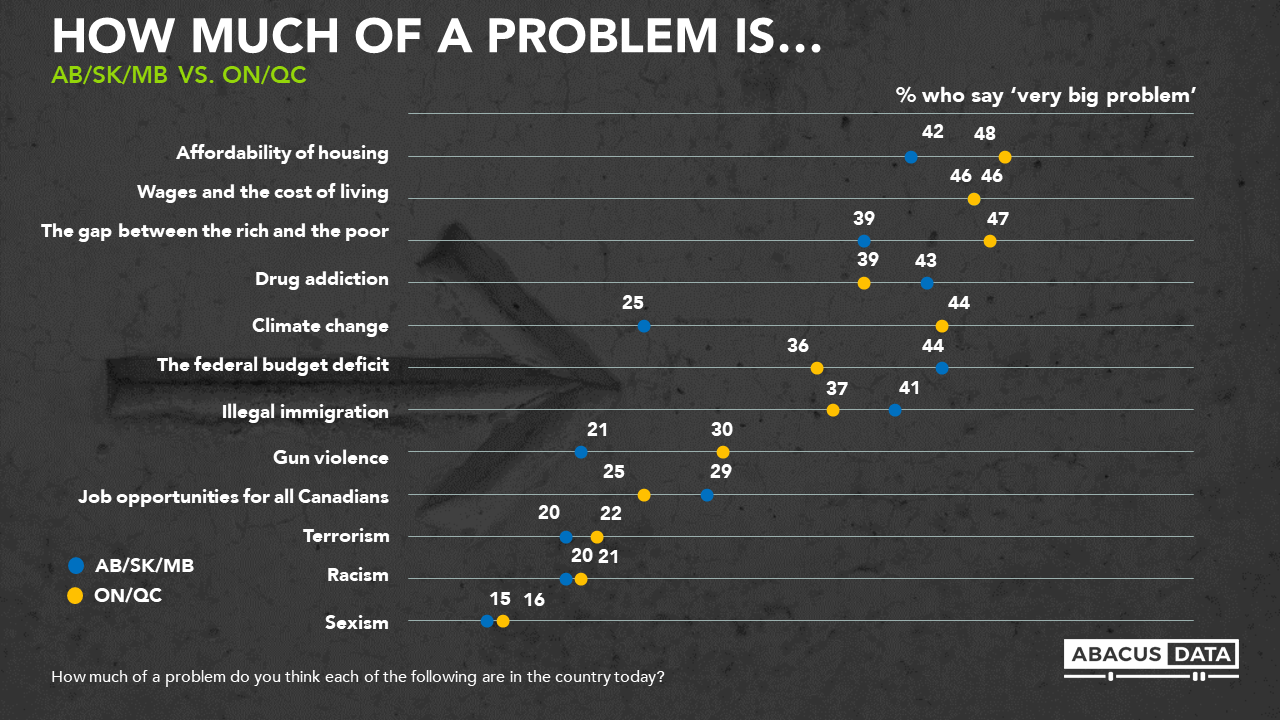
Because the differences in partisan leanings are markedly different between those living on the Prairies and those in Ontario and Quebec, we took a look at the differences in issues of importance. On the Prairies, housing costs are roughly equivalent in the importance of drug addiction, the deficit and illegal immigration. In central Canada, gun violence, the gap between rich and poor, and especially climate change all show significantly higher levels of concern.
Politically, there are some very sharp differences. Conservatives are far more likely to rate the federal budget deficit, illegal immigration, and terrorism as very big. NDP voters are more likely to emphasize wages and the cost of living and the gap between the rich and the poor. Liberal and NDP supporters are far more preoccupied with climate change compared to Conservatives supporters. Liberals are least likely to see illegal immigration as a very big problem while NDP supporters are more likely to be concerned about housing affordability although that issue is the highest concern for the most people overall.
Roughly 8 million voters are characterized as “Persuadable” or swing voters in our segmentation model (people who say they are inclined to want a change in government but could be persuaded to vote to re-elect the incumbents).
When we compare Blue Persuadables (inclined to vote Conservative) and Orange Persuadables (inclined to vote NDP) there are distinct agenda differences. Orange Persuadables focus on the gap between the rich and poor, climate change, and wages and cost of living, while Blue Persuadables are more preoccupied with the federal budget deficit and illegal immigration.
CANADIANS AND AMERICANS
When looking at recent results to these questions among Americans, we see:
-Similar levels of concern about wages and the cost of living, illegal immigration, climate change, and jobs.
-Americans are 19 points more preoccupied with the deficit, 19 points more likely to say sexism is a very big problem, and over 25 points more concerned about drug addiction, gun violence, and racism. Drug addiction is the most intense concern of all of those tested in the US.
UPSHOT
The level of anxiety in America is clearly higher than it is in Canada, and the list of concerns is quite different in some respects. Overall, it seems that economic growth and jobs are not as pressing a concern as wages, the cost of living, and economic inequality. This appears true in both countries.
America is grappling with drug addiction and gun violence and feels considerably more stress around gender and race equality. Americans are also showing some reaction to the growth in the federal deficit under President Trump.
Here in Canada, the principal focus for many people is the cost of living. Beyond that, we see some important differences by region and political affiliation. Climate change is a preoccupation for centre and left voters but conservatives and Prairie voters do not attach nearly as much importance to the issue. Similar cleavages are evident on illegal immigration and gun violence.
Canadians are far from universally happy or complacent, but there is clearly a sense that our problems are not as big as those in other parts of the world, and the data show that while we have political cleavages, they are isolated to a handful of issues, around climate change, law and order and to some degree cultural diversity/immigration. The next election promises to be an important test of what agenda is chosen by the most voters, and what solutions they favour to the issues they care about.
METHODOLOGY
Our survey was conducted online with 1,650 Canadians aged 18 and over from October 24 to 29, 2018. A random sample of panelists was invited to complete the survey from a set of partner panels based on the Lucid exchange platform. These partners are double opt-in survey panels, blended to manage out potential skews in the data from a single source.
The margin of error for a comparable probability-based random sample of the same size is +/- 2.2%, 19 times out of 20. The data were weighted according to census data to ensure that the sample matched Canada’s population according to age, gender, educational attainment, and region. Totals may not add up to 100 due to rounding.
ABOUT ABACUS DATA
We are the only research and strategy firm that helps organizations respond to the unprecedented threat of generational change and technological disruption.
We are an innovative, fast-growing public opinion and marketing research consultancy. We use the latest technology, sound science, and deep experience to generate top-flight research-based advice to our clients. We offer global research capacity with a strong focus on customer service, attention to detail and exceptional value.
In our latest national survey, we asked several questions about the recently agreed to trilateral trade deal (USMCA) which is proposed to replace NAFTA.
Here is what we found:
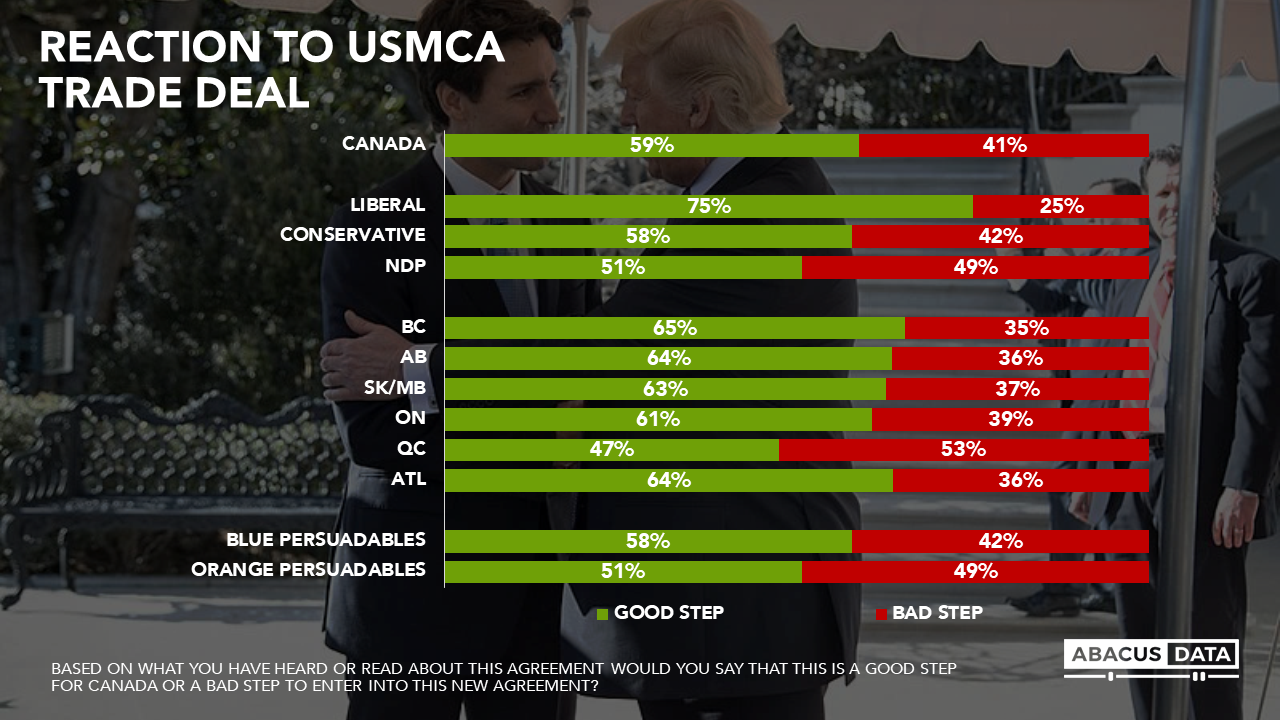
Across the country, 59% believe that it was a “good step” for Canada to decide to enter this agreement, based on what they have heard or read about it, while 41% feel it was a bad step. Majorities of 61% or higher in every region say good step, except for Quebec, where 47% say good step and 53% feel it was a bad step.
Across partisan lines, the deal was welcomed by half of NDP voters, 59% of Conservatives and 75% of Liberal voters. Among Blue Persuadables, 58% say the deal was a good step while among Orange Persuadables, 51% feel that way.
(Blue Persuadables are those who are planning on voting Conservative but say the incumbent Liberals might be able to win their support in next year’s election. Orange Persuadables are those planning on voting NDP but who say they could be persuaded to support the Liberals)
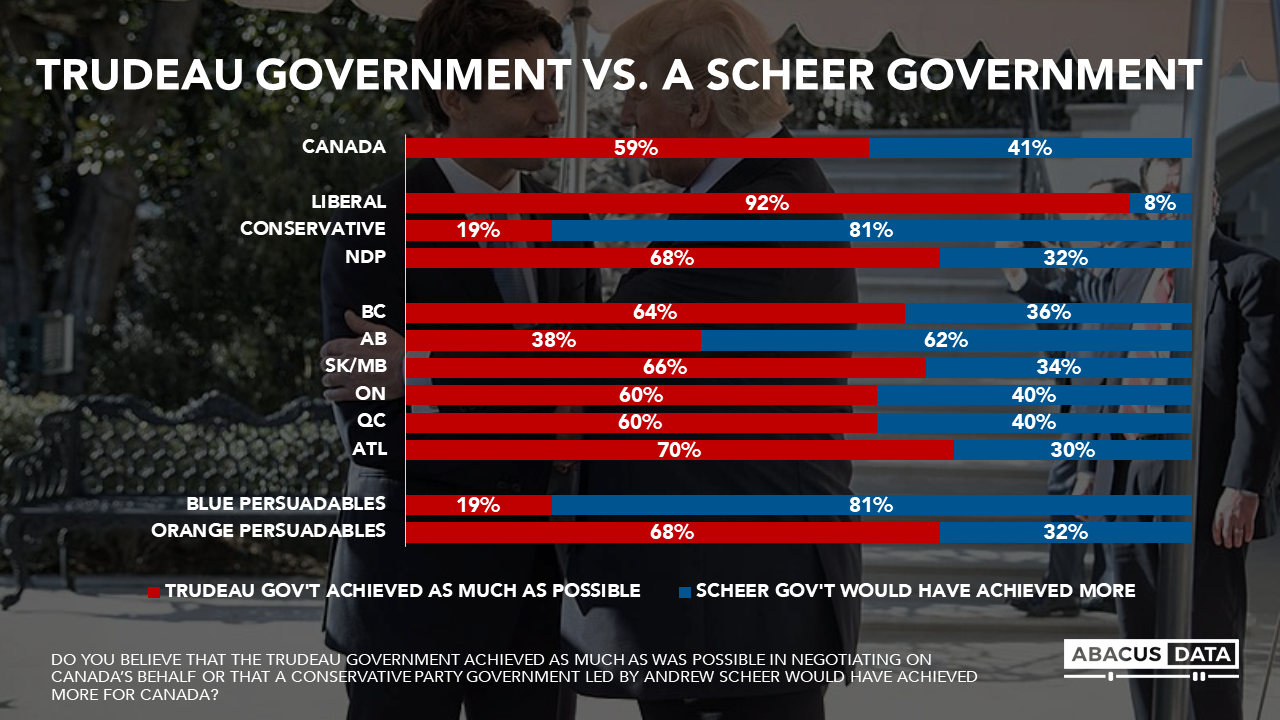
Most people (59%) feel that the “Trudeau government achieved as much as was possible in negotiating on Canada’s behalf” while 41% believe “a Conservative government led by Andrew Scheer could have achieved more for Canada.” The belief that the Trudeau government got the best deal possible is 60% or higher in every region except for Alberta, where it drops to 38%. Across party lines, 92% of Liberals say the government got the best deal possible, 68% of New Democrats and 19% of Conservatives.
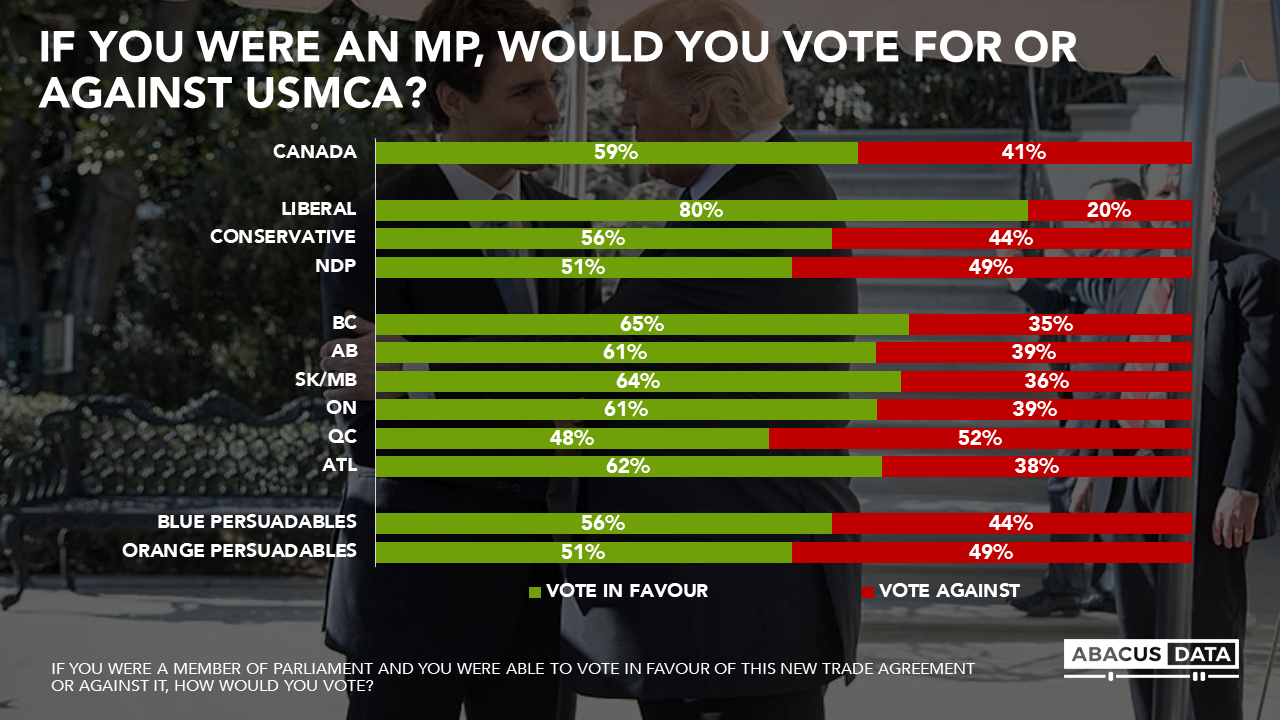
When asked if they were a Member of Parliament whether they would vote for or against the deal, 59% said they would vote in favour, 41% opposed, with support 61% or higher in every region but Quebec, where 48% would vote in favour and 52% opposed. Among NDP voters and Orange Persuadables 51% would vote yes on the deal. Among Conservatives and Blue Persuadables the proportions voting yes would be 55% and 56% respectively.
The issue of dairy market access played out prominently in the talks, and we asked the following question: “One of the things that Canada agreed to in the new USMCA was to let American dairy producers have more access to sell their dairy products to Canadian consumers. Canadian dairy farmers had opposed this. Which is closer to your view …I’m very opposed to any changes that allow the US more access to our dairy market…I think it’s a reasonable trade-off to allow the US more access to our dairy market in exchange for having a trade agreement…or I don’t have any feelings one way or the other about this.”
On this question, 43% expressed opposition to allowing more US producer access to Canada’s dairy market, while an almost equal number said they felt this was a reasonable trade-off while 18% have no clear views. Discomfort is 14 points higher in Quebec compared to the rest of the country.
Across party lines, 33% of Liberal voters are unhappy about that aspect of the deal, while 53% accept the trade-off and 16% have no real opinion. Conservative unhappiness with the impact on dairy registers at 42% while 60% of NDP voters are opposed to this aspect of the deal.
UPSHOT
When Canada first agreed to enter into a free trade agreement with the US, Canadians were anxious about the potential downsides and hesitant about whether it was a good idea.
With 30 years of experience of free trade, opinion has shifted and most Canadians indicate relief that a new deal has been reached, having wondered if that would be possible, given the uncertainty that has marked the trade relationships of the US, under President Donald Trump. Given that Liberal vote has been in the 33%-38% range lately, the fact that about 60% are supportive of this new deal indicates that the issue is at this point in time, a positive for Mr. Trudeau and his party.
There is evidence of some discomfort with the dairy provisions, especially in Quebec, and time will tell whether this becomes a larger or persistent source of unhappiness with the USMCA outcome.
So far, at least, the USMCA deal is not a situation where many voters think a Conservative government would have been able to accomplish more.
METHODOLOGY
Our survey was conducted online with 2,109 Canadians aged 18 and over from October 5 to 12, 2018. A random sample of panelists was invited to complete the survey from a set of partner panels based on the Lucid exchange platform. These partners are double opt-in survey panels, blended to manage out potential skews in the data from a single source.
The margin of error for a comparable probability-based random sample of the same size is +/- 2.2%, 19 times out of 20. The data were weighted according to census data to ensure that the sample matched Canada’s population according to age, gender, educational attainment, and region. Totals may not add up to 100 due to rounding.
ABOUT ABACUS DATA
We are the only research and strategy firm that helps organizations respond to the unprecedented threat of generational change and technological disruption.
We are an innovative, fast-growing public opinion and marketing research consultancy. We use the latest technology, sound science, and deep experience to generate top-flight research-based advice to our clients. We offer global research capacity with a strong focus on customer service, attention to detail and exceptional value.
As recreational use of cannabis is set to become legal on October 17, we conducted a national survey of 3,000 Canadian adults on behalf of The Cannabis Council of Canada in September to find out how the country was feeling about legalization. Here’s what we found:
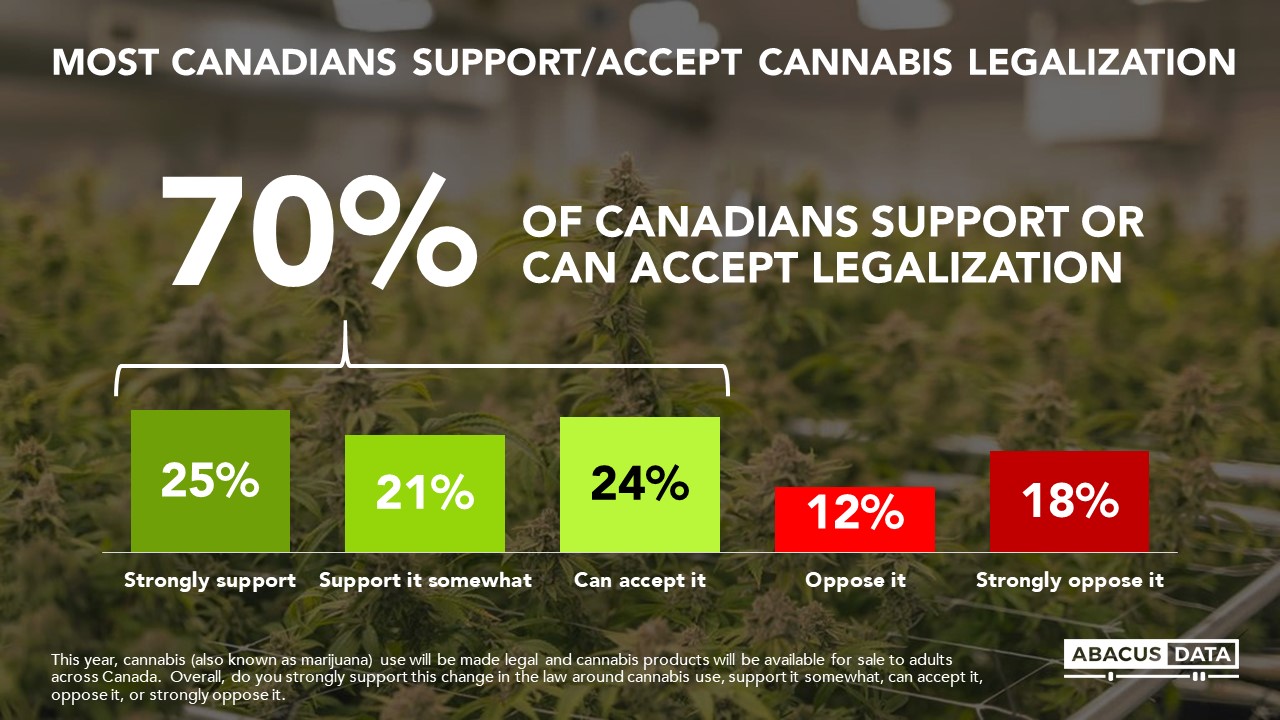
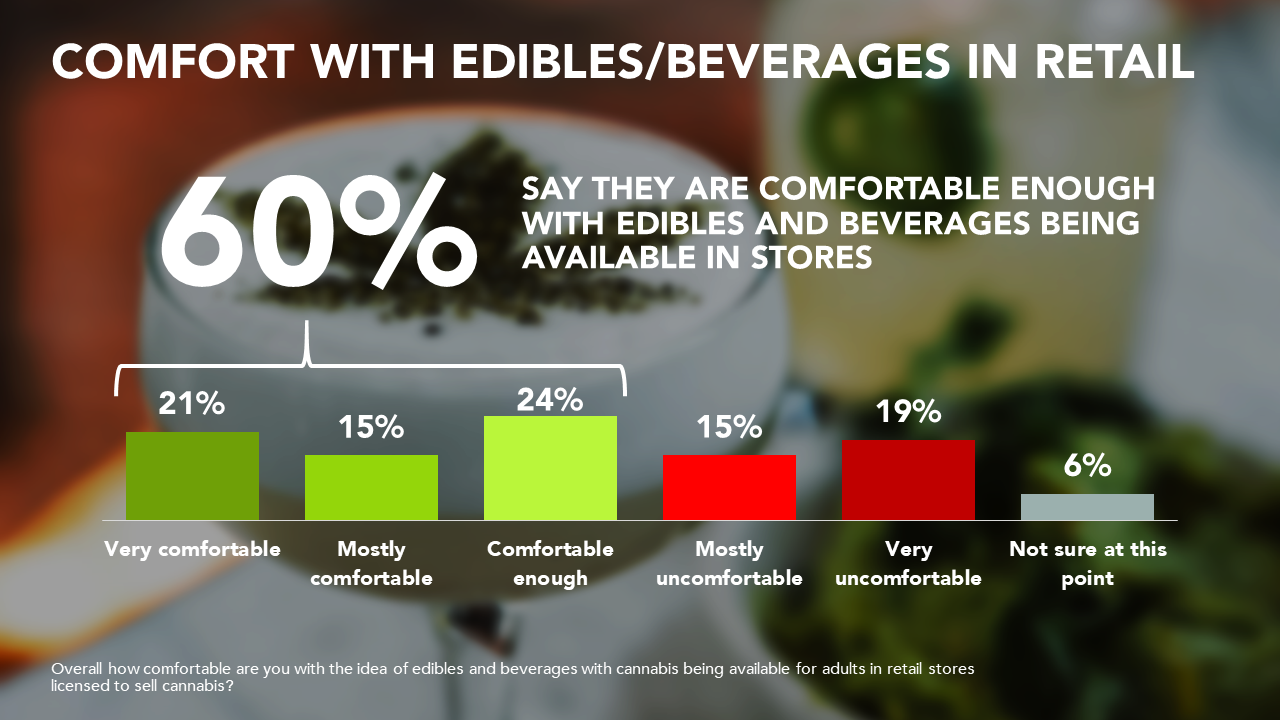
Most people support (46%) or can accept (24%) cannabis legalization. Thirty percent are opposed. Strong support is higher than (25%) than strong opposition (18%).
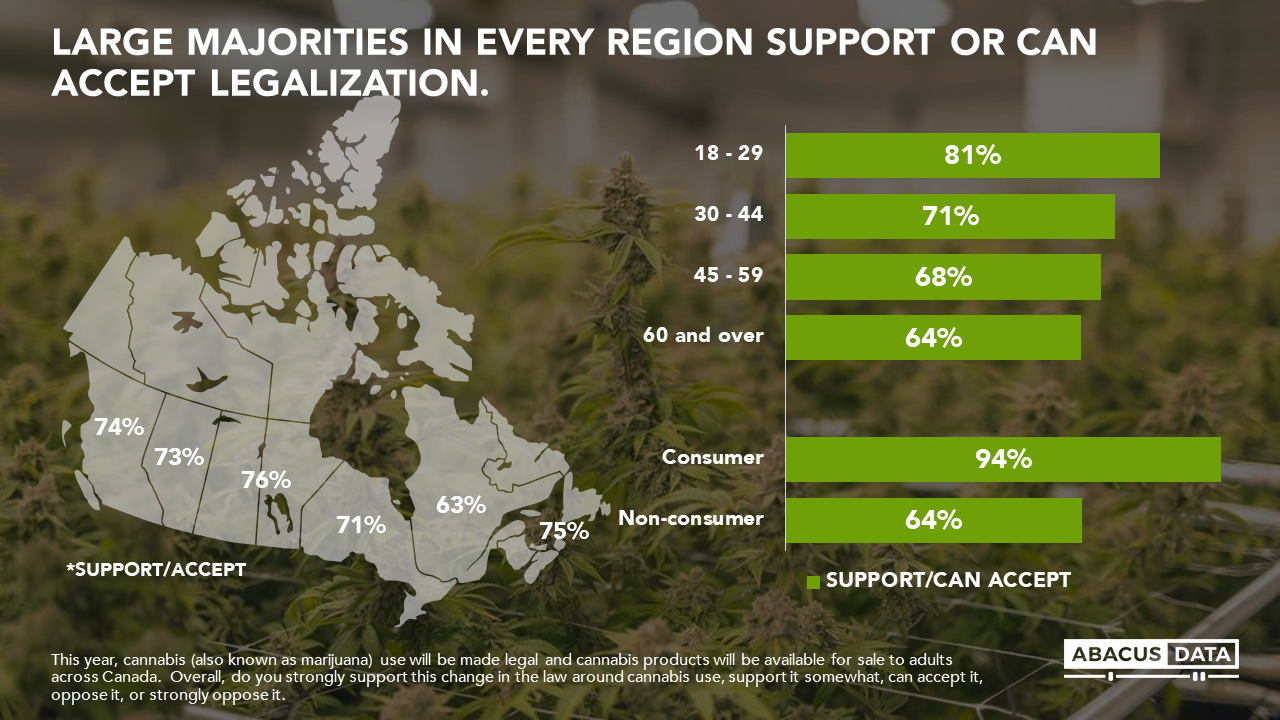
Majorities in every region support or accept legalization.
Although younger Canadians are more likely to support or accept legalization (81% among those aged 18 to 29), at least 6 in 10 Canadians in all age groups can at least support or accept legalization. Those who use cannabis more likely to support or accept legalization, but even a clear majority of non-consumers accept or support it.
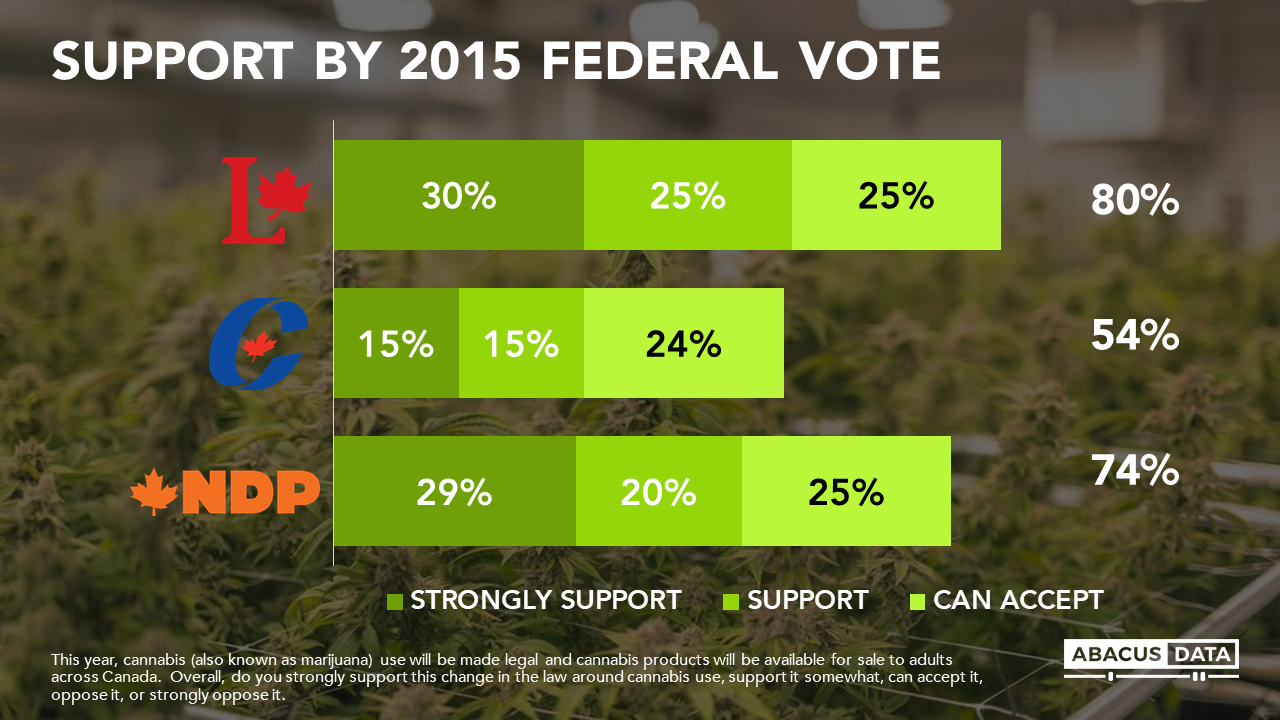
Liberal and NDP voters are more supportive of legalization, and in each case, roughly 30% strongly support this change. Among Conservatives, opinion is divided, with just over half saying they either support or can accept this change in the law.
Acceptance of legalization is tied to how people feel about the way policy and regulation are developing around this change. At this stage in the process, most (70%) feel that the regulatory approach being taken by the Government of Canada is working well or well enough (including 55% of Conservatives).
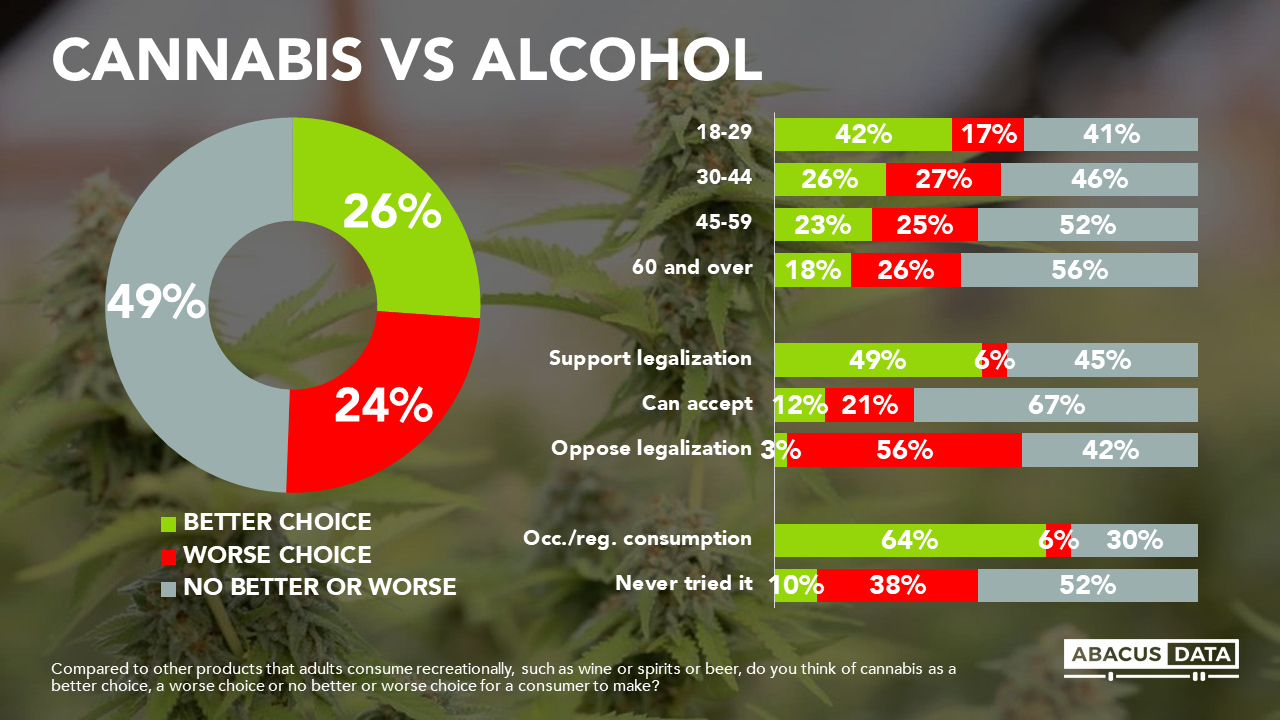
Attitudes towards cannabis reflect the fact that a majority do not see it as any worse than consuming alcohol. About a quarter say it is a better choice and a similar number say it is worse, with the plurality saying it is no different. Those who are younger are more likely to say cannabis is a better choice, while those who are older are more likely to say it is no difference. This sense of equivalence between alcohol and cannabis is related to the proximity that most Canadians have to the product. People who have used the product are far more likely to say it is either a better or no worse choice than alcohol. The same can be said for those that support legalization.
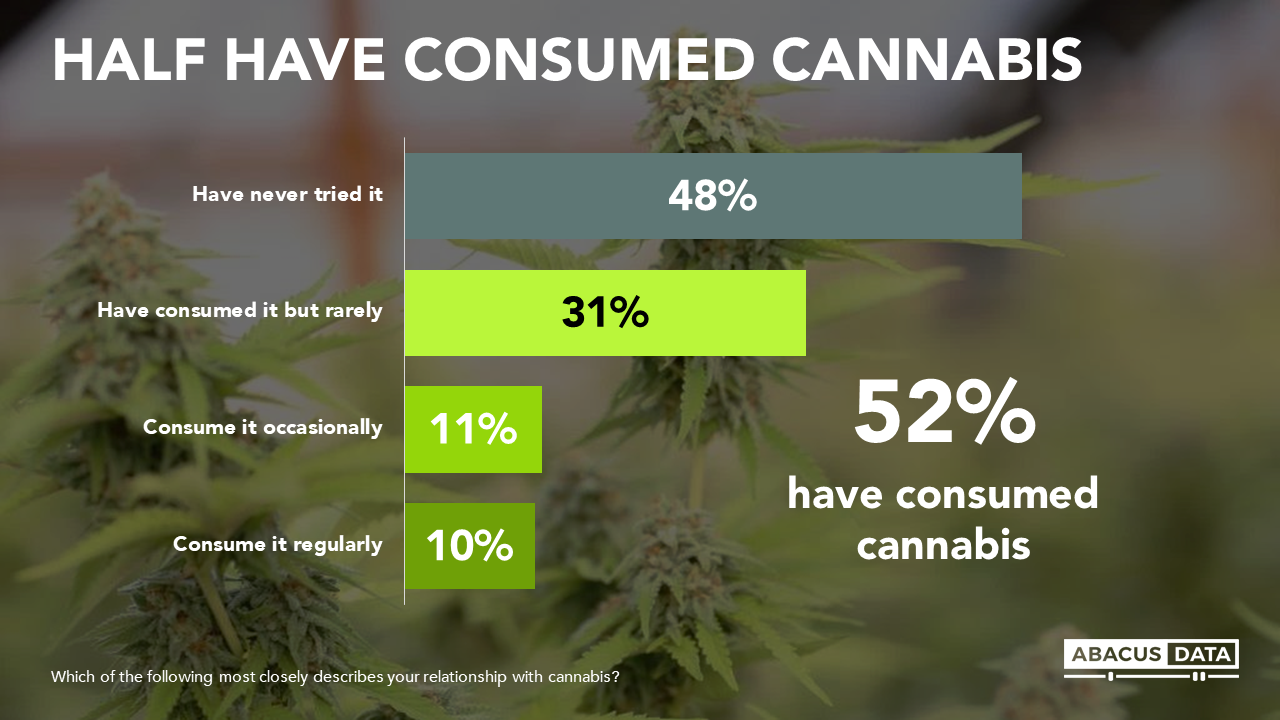
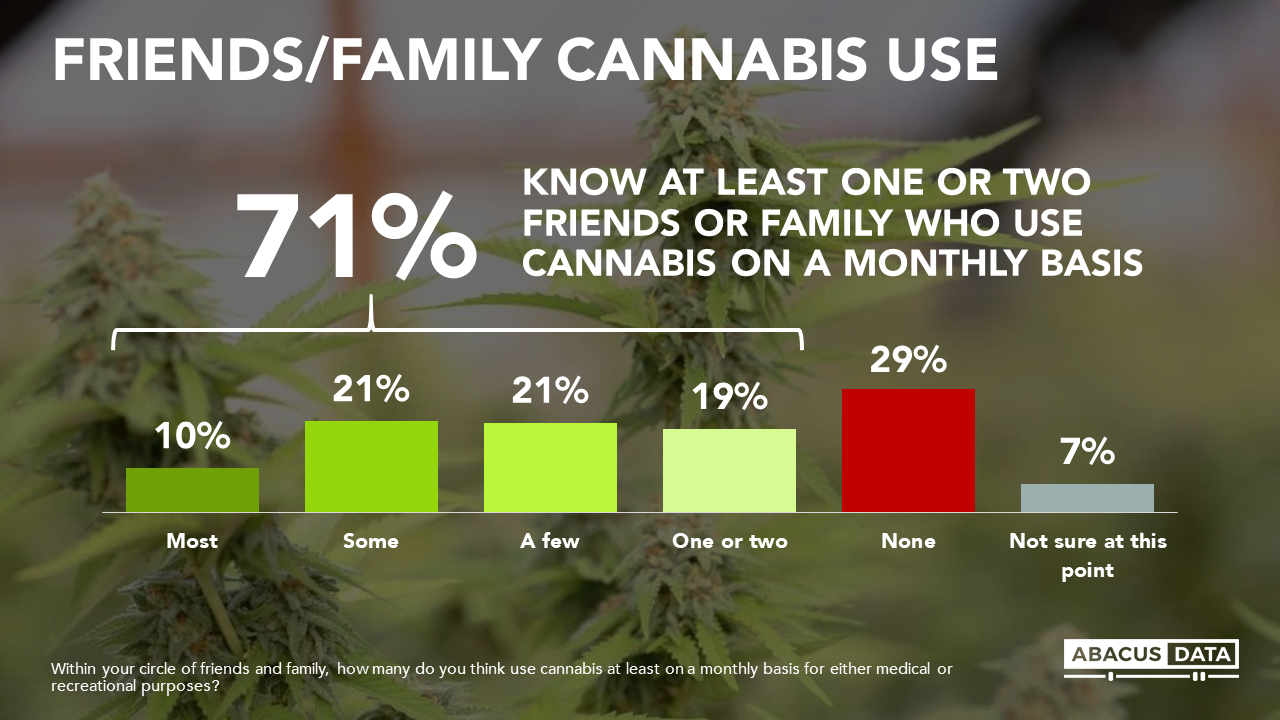
Half have personally tried the product with 1 in 5 (21%) saying they consume cannabis regularly or occasionally. And 7 in 10 know at least one person who consumes cannabis monthly.
A majority also say they are either comfortable or comfortable enough with edibles and beverages being available for adults to purchase in retailers licensed to sell cannabis.
THE UPSHOT
As Canada moves towards legal recreational cannabis consumption, most Canadians, in every region of the country and across all political groups, either support or can accept the change.
The prevailing mood is conditioned by the fact that a good number of people have tried the product and/or know people who use cannabis, that using cannabis is no worse than using alcohol, and that the regulatory approach taken to date seems to be judged positively.
Opinions could change as people see legalization move from theory to practice, however, the mood of the country on this change, to this point in time, shows that acceptance is more common than anxiety.
METHODOLOGY
The survey was conducted online with 3,000 Canadian residents aged 18 and over from September 4 to 15, 2018. A random sample of panelists was invited to complete the survey from a set of partner panels based on the Lucid exchange platform. These partners are typically double opt-in survey panels, blended to manage out potential skews in the data from a single source.
The margin of error for a comparable probability-based random sample of the same size is +/- 1.79%, 19 times out of 20.
The data were weighted according to census data to ensure that the sample matched Canada’s population according to age, gender, educational attainment, and region. Totals may not add up to 100 due to rounding.
ABOUT ABACUS DATA
We are the only research and strategy firm that helps organizations respond to the unprecedented threat of generational change and technological disruption.
We are an innovative, fast-growing public opinion and marketing research consultancy. We use the latest technology, sound science, and deep experience to generate top-flight research-based advice to our clients. We offer global research capacity with a strong focus on customer service, attention to detail and exceptional value.
Premier Ford was swept into power by an intense desire for change incubated over a long stretch of provincial Liberal governments and under a historically disliked premier.
In Abacus Data’s first poll months since the Ontario PC win, we find that while most Ontarians still have negative views of the premier, few PC voters have buyer’s remorse and the PCs would be returned to office if an election was held today.
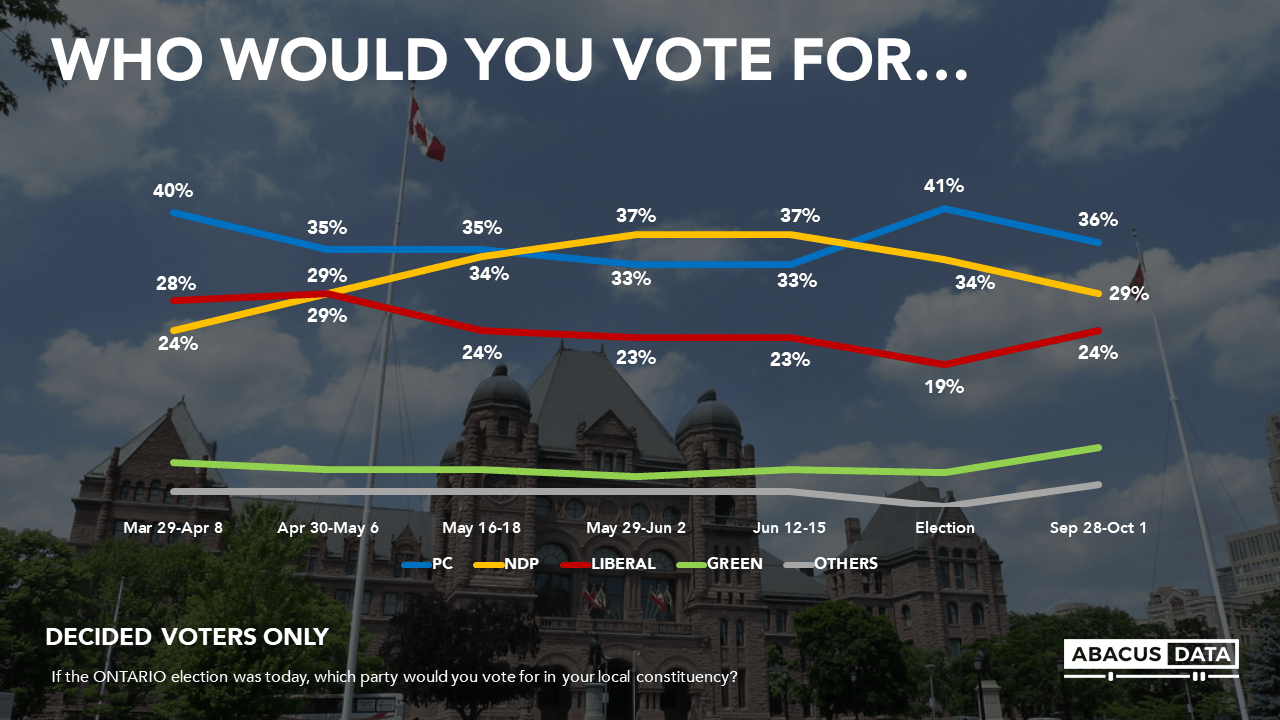
PCs LEAD BY 7 AS NDP FALLS AND LIBERALS RISE
The Ontario PCs continue to command a lead over the other parties in the province.
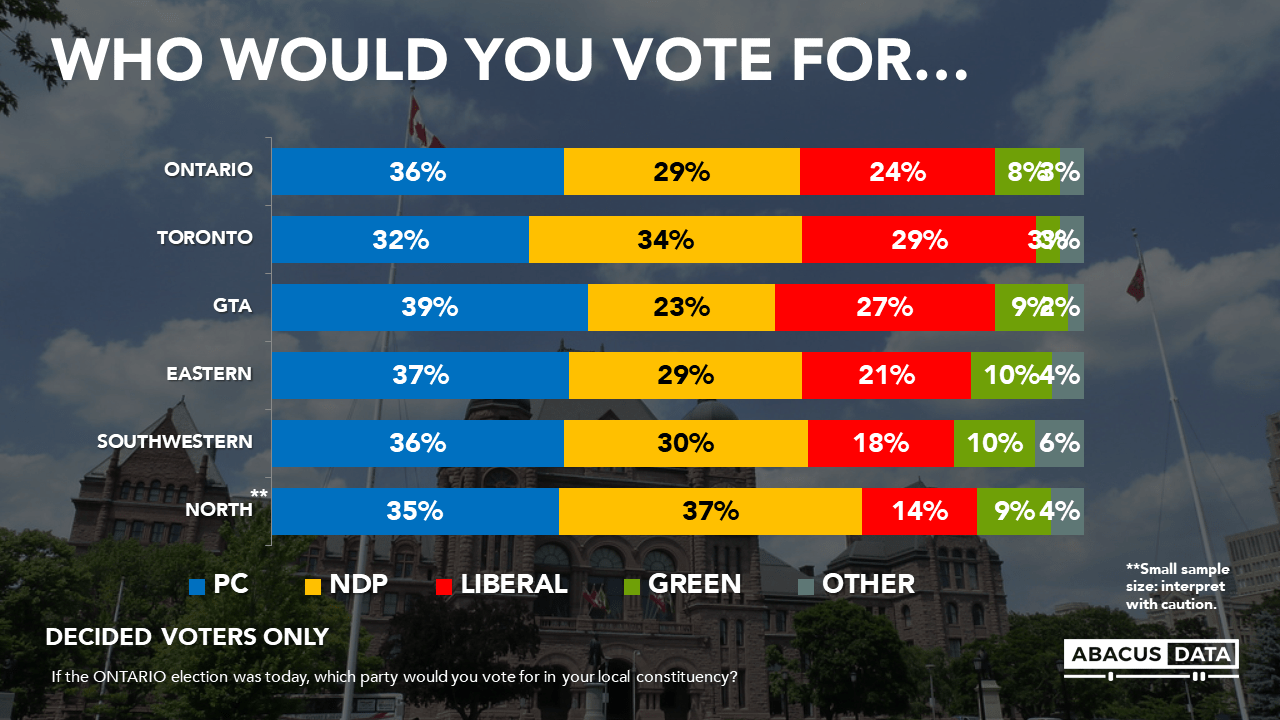
36% of committed voters would vote PC (down 5 since the election), 29% would vote NDP (down 5) while Liberal support is up 5 to 24%.
PC support is fairly consistent across the province ranging from a high of 39% in the GTA (postal codes starting with L) to a low of 32% in Metro Toronto. The NDP is stronger in Metro Toronto and Northern Ontario, and trail both the PCs and Liberals in the region surrounding Toronto. The Liberals continue to struggle outside of the GTA and Metro Toronto.
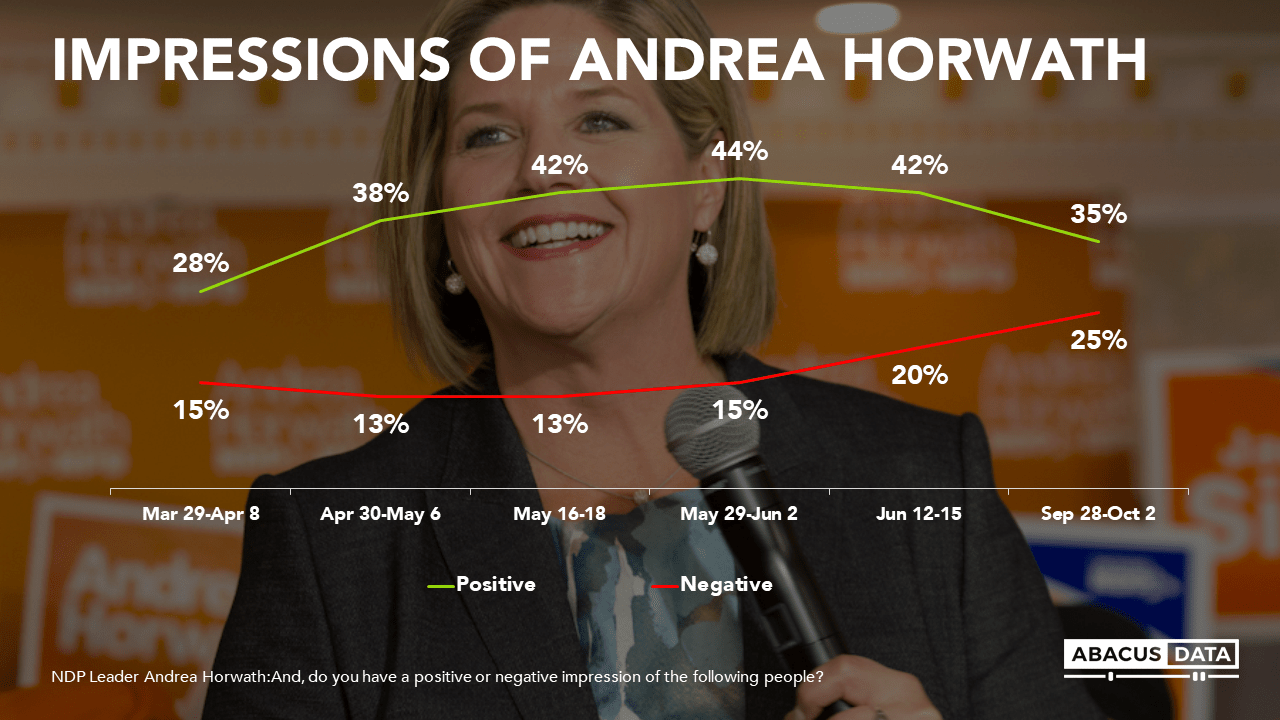
PREMIER FORD CONTINUES TO BE POLARIZING, BUT HIS PERSONAL FAVOURABLE NUMBERS ARE UP WHILE HORWATH’S DECLINE
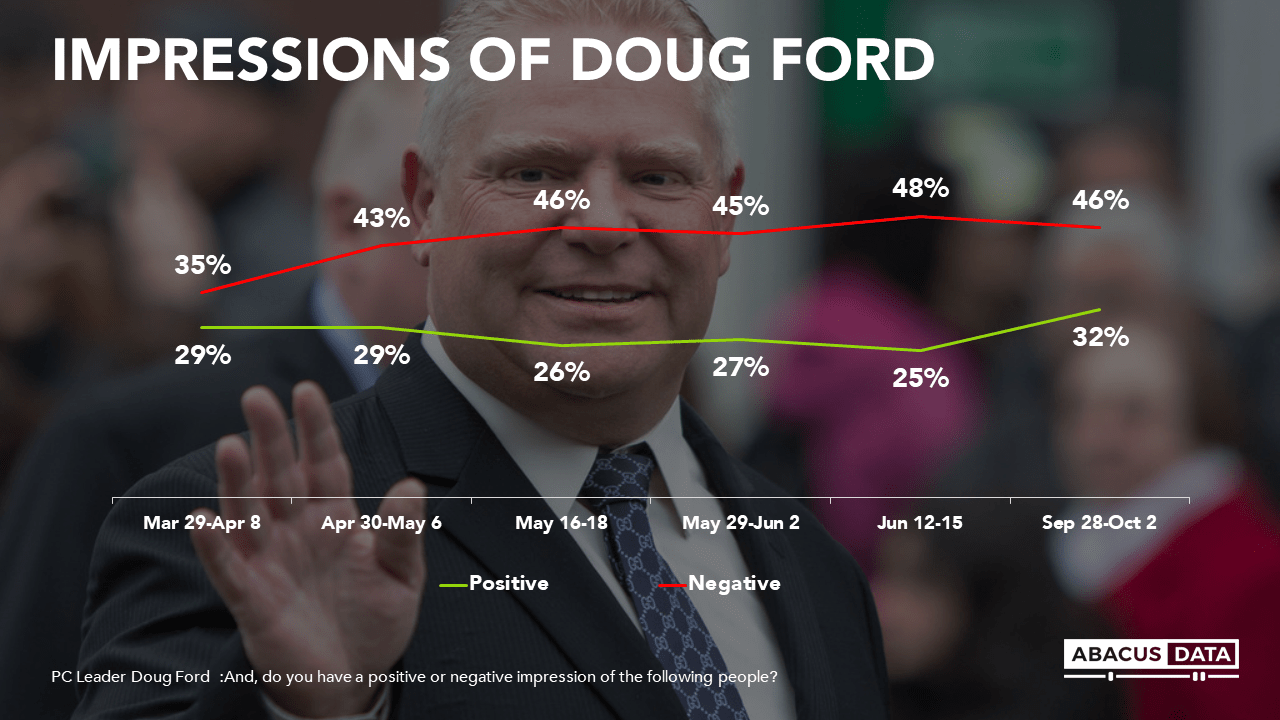
Our first poll last spring before the election found that about three in ten Ontarians had a positive impression of Doug Ford. Over the course of the campaign, that number shrank but has since recovered since the election. That said, about half of Ontarians still have a negative impression of the Premier, largely unchanged since the week before E-day.
NDP leader Andrea Horwath, much as she was throughout the election campaign, is viewed more positively than negatively and has the best ratings of all provincial party leaders. Despite this, her positives are down 9 points to 35% since her peak at the end of May.
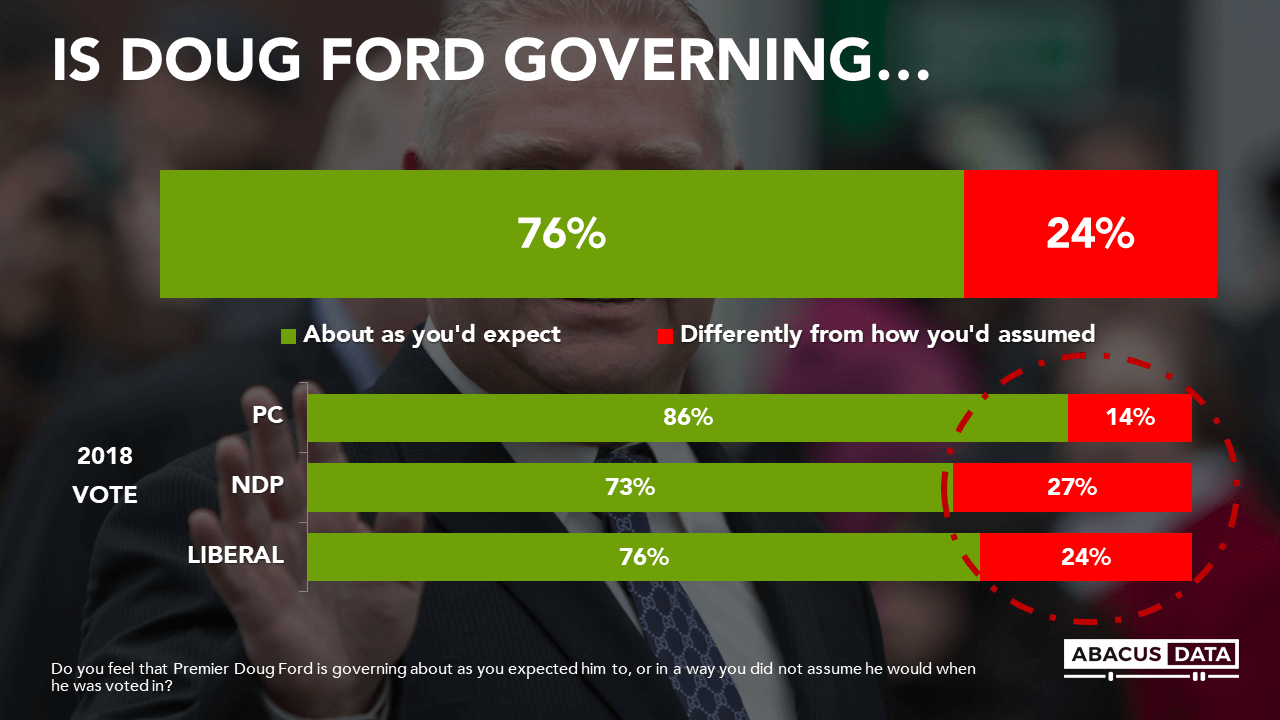
FEW SURPRISES FROM THE FORD GOVERNMENT
With some bold moves straight out of the gate- a notwithstanding clause here, a hydro one board firing there – most Ontarians say Doug Ford is governing about as they expected him to. This feeling holds true regardless of vote choice in the last election.
Those who voted PC in June say they are getting pretty much what they expected from the new government and Premier Ford. Most NDP and Liberal voters feel the same way, but likely with a different set of emotions.
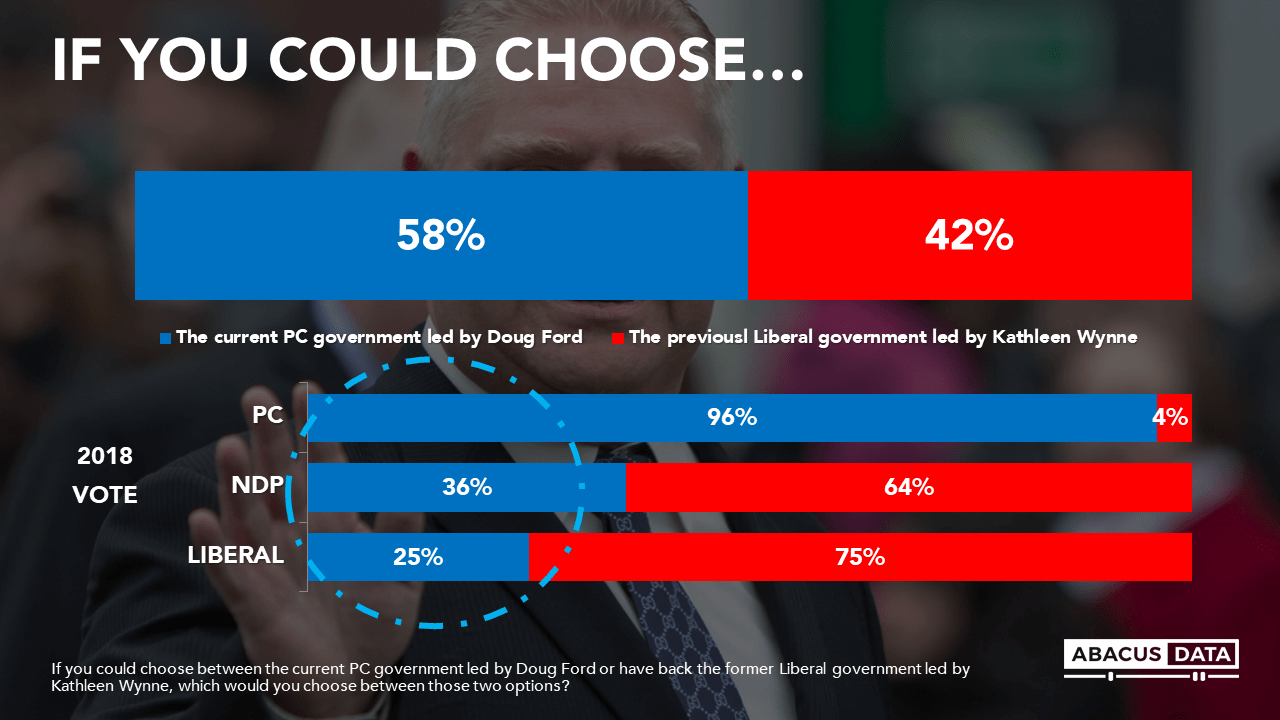
LITTLE BUYER’S REMORSE FROM SUPPORTERS OF FORD GOVERNMENT
Asked if they prefer the current PC government led by Doug Ford or would revert back to a Wynne-led Liberal government, more would opt for Ford and the PCs (58%) than go back to the previous Liberal government.
Not only would more continue to prefer a PC government over the previous Liberal one, many voters who did not vote PC say they prefer today’s Ford government over Wynne’s. Most notably, 36% of New Democrat voters say they would keep the current PC government instead of reverting back to the Liberals confirming that intense desire for change that swept the Wynne government from power.
WHAT NEXT?
Our campaign post-mortem in June found that half of the 28% of Ontarians who identify as capital “L” Liberals, voted for another party in the 2018 election. They defected to defeat a government they felt was stale. Our poll finds a small Liberal rebound as more of those partisans have come back into the Liberal fold.
But the overall status remains much like it was at the June election. The PCs hold a sizeable lead over the opposition, Premier Ford is a highly polarizing figure, but his supporters strongly back his agenda and the approach he’s taken to governing the province. Almost all of those who voted PC in 2018 (96%) would continue to prefer a PC government over the previous Liberal one.
NDP leader Andrea Horwath remains popular but has seen her numbers weaken over time and instead of consolidating anti-Ford sentiment behind the NDP, the opposition is more divided than during the election. Her ability to entrench the NDP as a government in waiting remains unclear at this point. Much may depend on the early victories she can score before the cameras turn towards an OLP leadership race potentially bolstered by a leader with less baggage and a rebuild & recover narrative. For now, the Ford government and the premier himself are polarizing but maintain a clear advantage thanks to a loyal and solid support base that has approved the new government’s first four months in office.
Methodology
The survey was conducted online with 1,500 Ontario residents aged 18 and over from September 30th to October 1st, 2018. A random sample of panelists was invited to complete the survey from a set of partner panels based on the Lucid exchange platform. These partners are typically double opt-in survey panels, blended to manage out potential skews in the data from a single source.
The data were weighted according to census data to ensure that the sample matched Ontario’s population according to age, gender, educational attainment, and region. Totals may not add up to 100 due to rounding.
About Abacus Data
Abacus Data is an innovative, fast-growing public opinion, data science, and marketing research consultancy. We use the latest technology, sound science, and deep experience to generate research-based advice to our clients. We offer global research capacity with a strong focus on customer service, attention to detail and value-added insight.
Our team combines the experience of our Chairman Bruce Anderson, one of Canada’s leading research executives for two decades, with the energy, creativity and research expertise of CEO David Coletto, PhD.
In our most recent national public opinion survey, we explored one of the most contentious topics in Canadian politics – oil – and found most people don’t find it all that contentious.
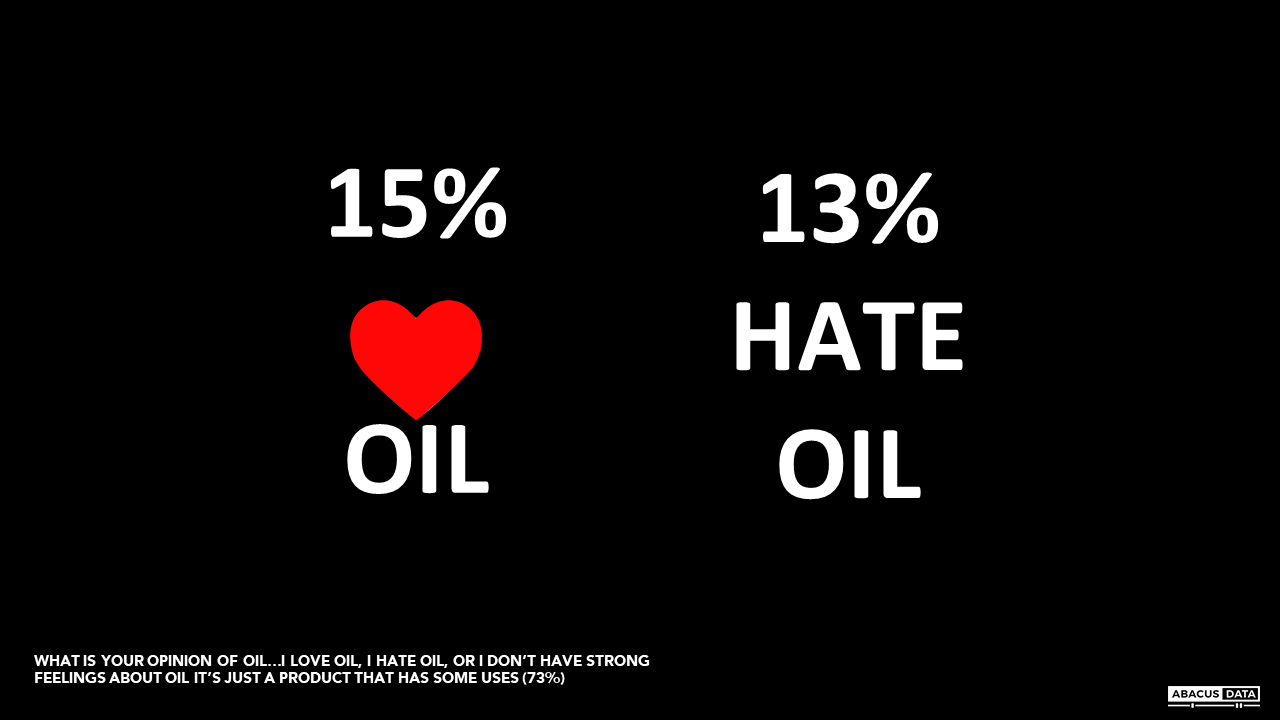
When asked if they loved oil, hated oil, or “don’t have strong feelings about oil, it’s just a product that has some uses”, 73% chose the latter option to describe their view.
No strong feelings about oil is the view of 72% in BC, 76% in Ontario, and 74% in Quebec. A remarkably consistent 73% of NDP, Conservative, and Liberal voters say they have no strong feelings about oil.
Roughly equal, and small, numbers of Canadians love (15%) and hate (13%) oil. Only 21% of NDP voters hate oil, and only 21% of Conservative voters love oil. 37% of Albertans love oil.
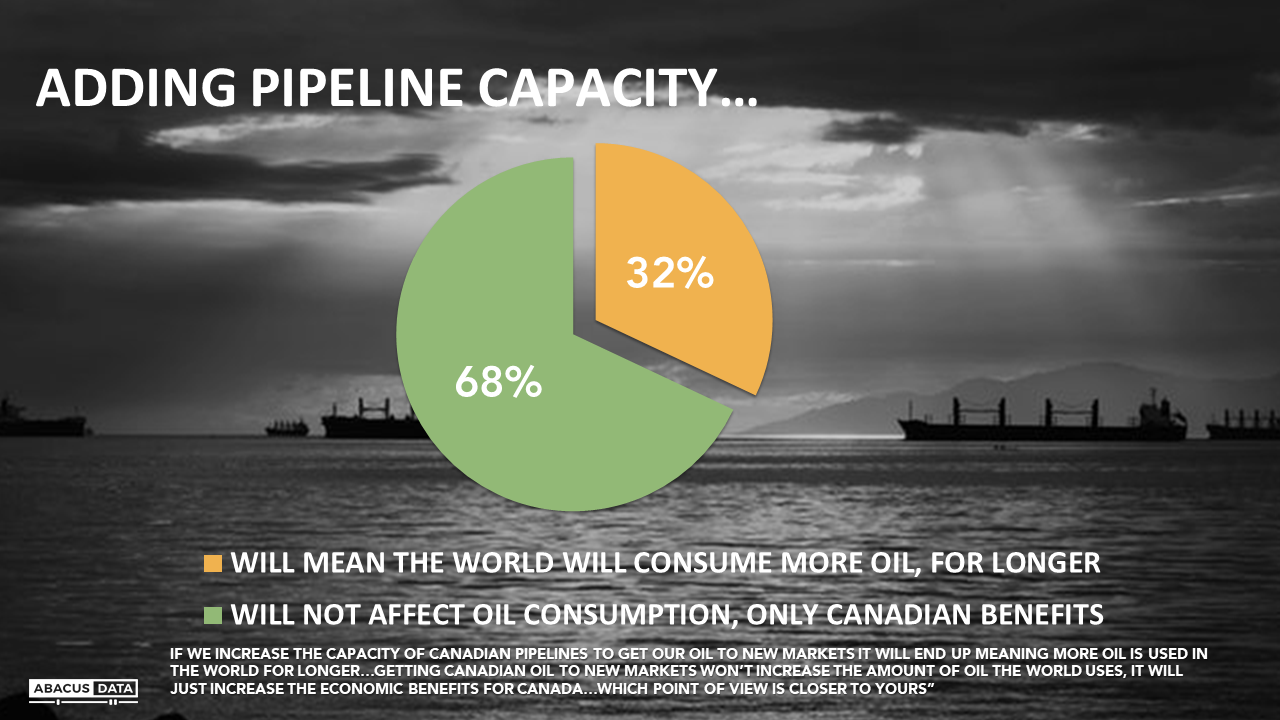
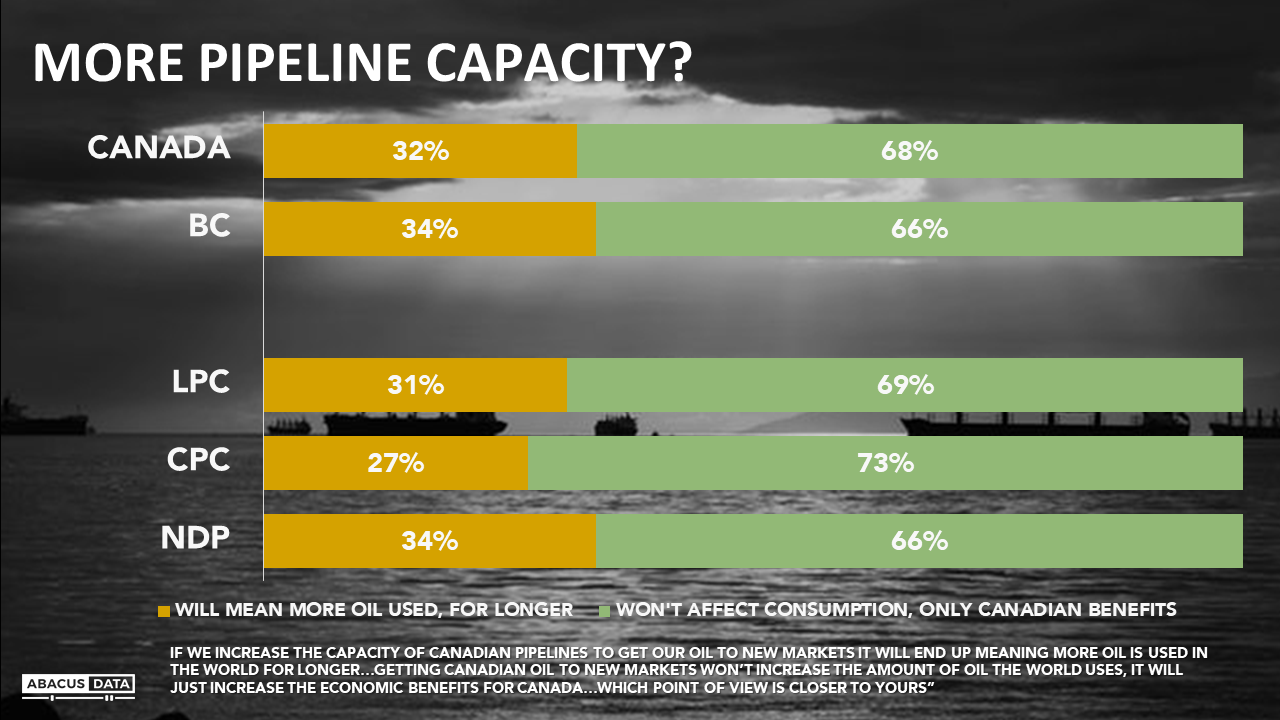
Most Canadians reject the argument that increasing the capacity of pipelines to get our oil to new markets will end up meaning more oil will be used in the world for longer. The majority (68%) believes that expanding our access to new markets won’t affect global oil consumption but will increase the economic benefits for Canadians.
This is the majority view of 69% of Liberal voters, 66% of NDP voters and 73% of Conservative voters.
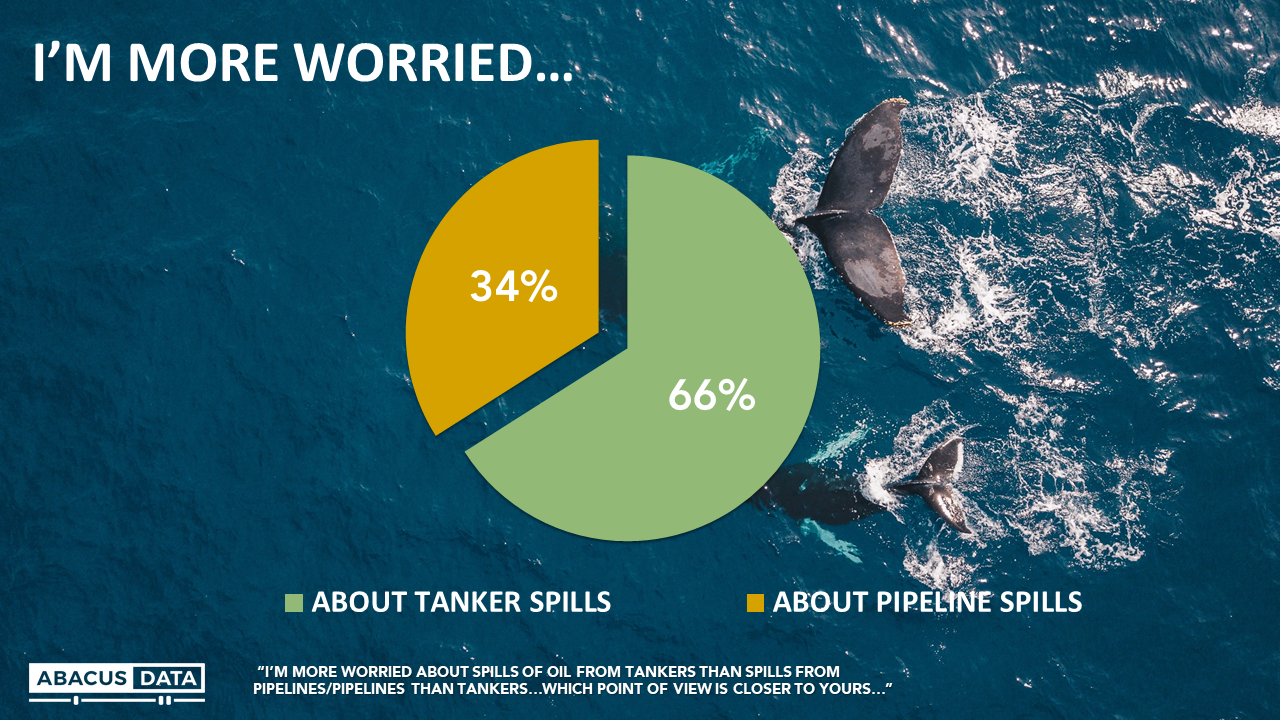
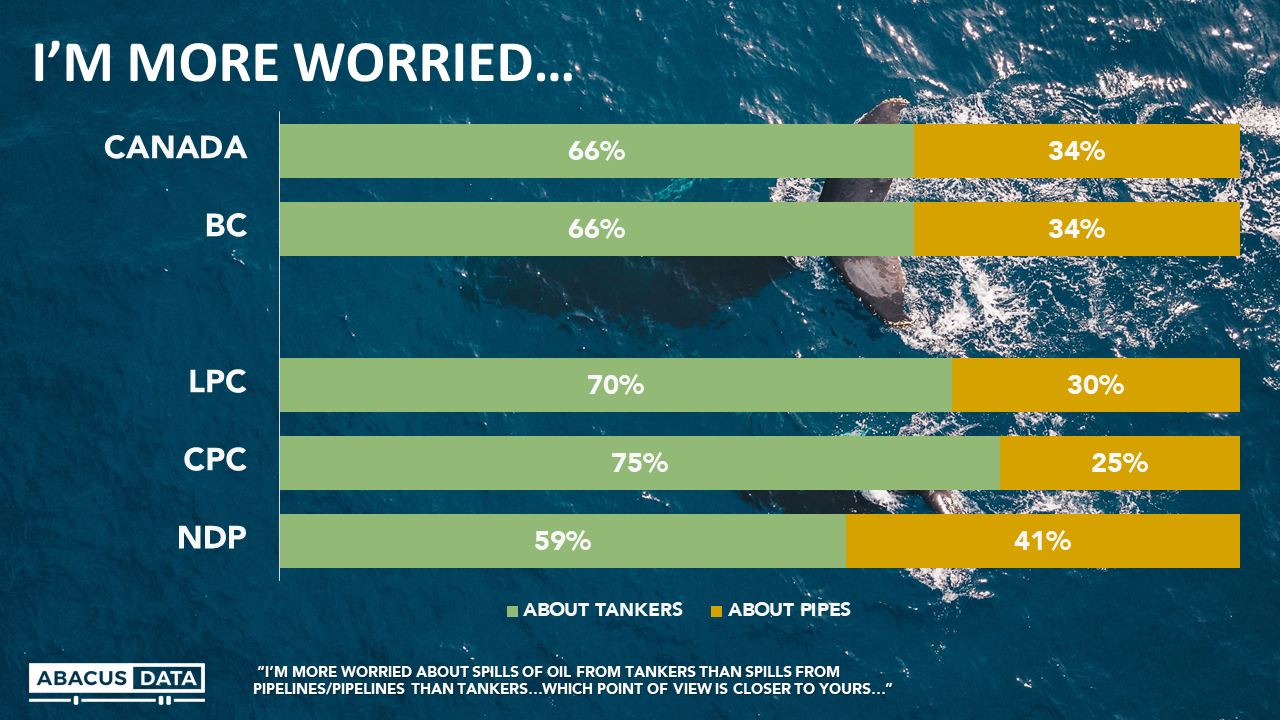
Two out of three (67%) Canadians think pipelines are generally pretty safe, and worries tend to be more about the risk of spills from tankers (66%) than from pipelines (34%)
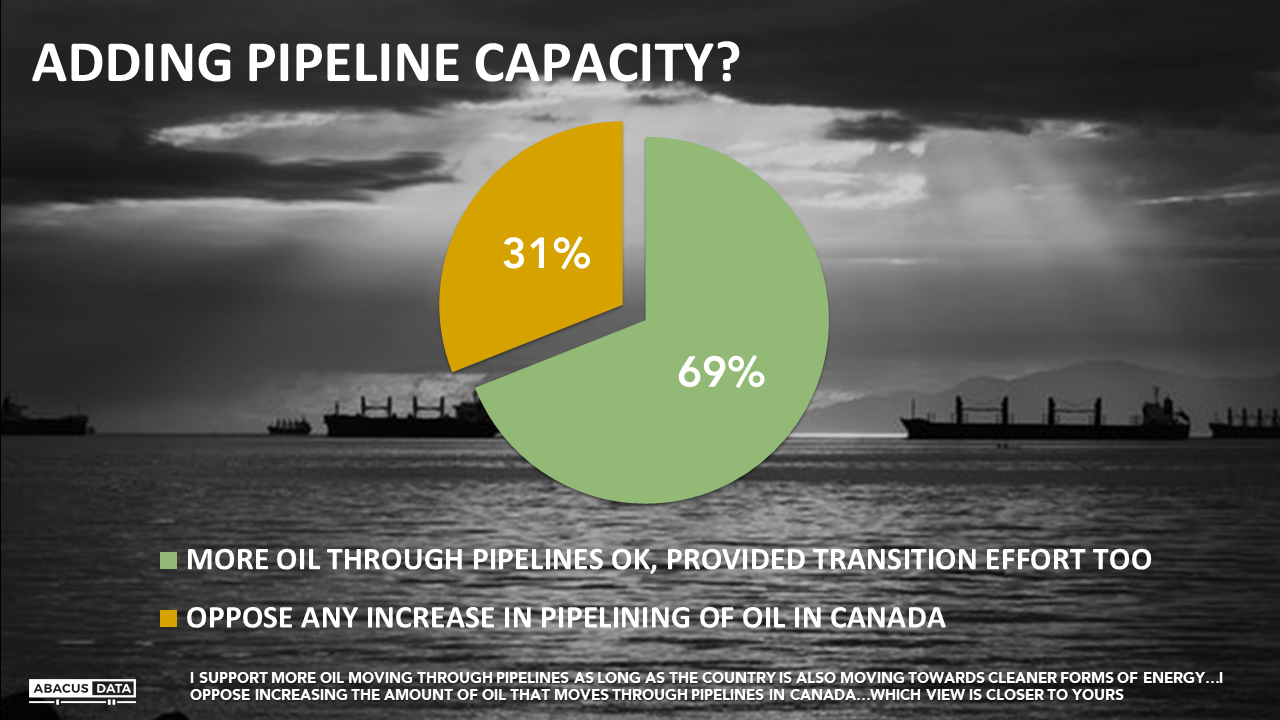
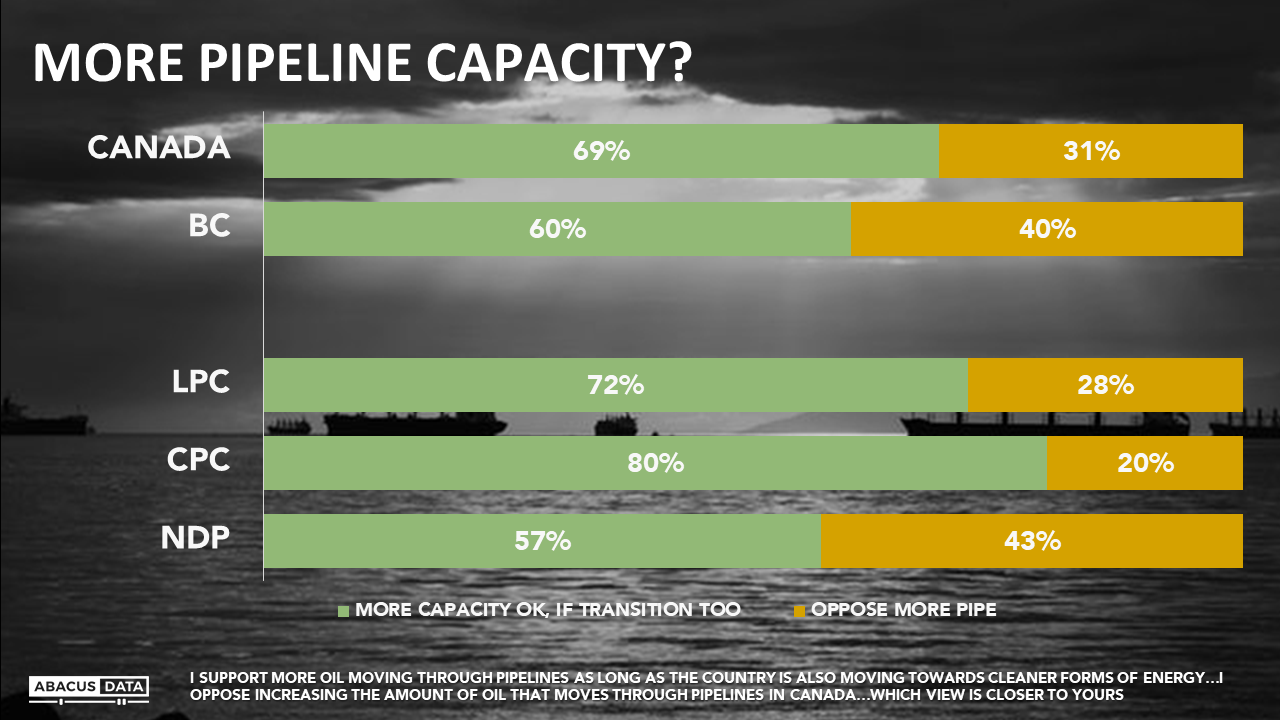
Most (69%) Canadians “support more oil moving through pipelines as long as the country is also moving towards cleaner forms of energy” while only 31% oppose increasing the amount of oil that moves through pipelines in Canada. Large majorities of Liberal (72%) and Conservative (80%) voters are aligned on this question, while NDP voters are split with 57% saying they support the transition idea and 43% opposed to any increase in pipelining of oil.
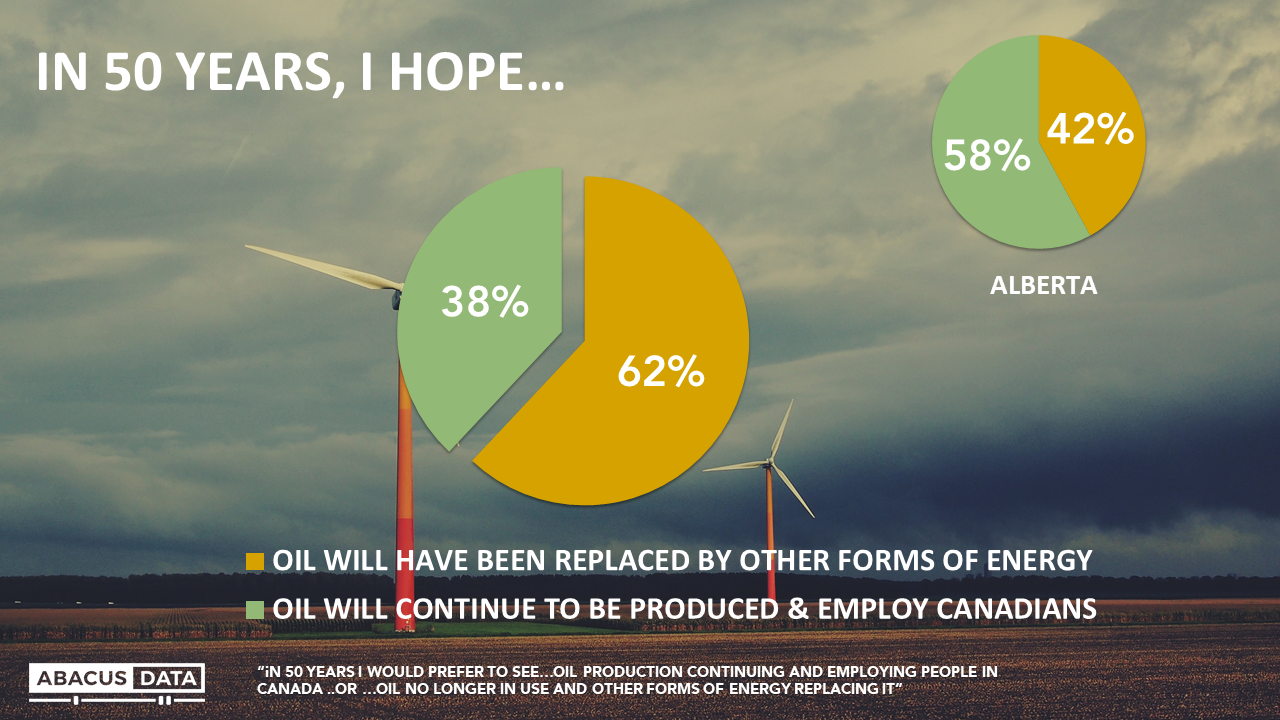
Looking into the future, when asked what they hope will be the case in 50 years time, 62% of Canadians (including 42% in Alberta, and 47% of Conservative voters) say they would prefer it if “oil was no longer in use and other forms of energy was replacing it”, while 38% would prefer to see “oil production continuing and employing Canadians.”
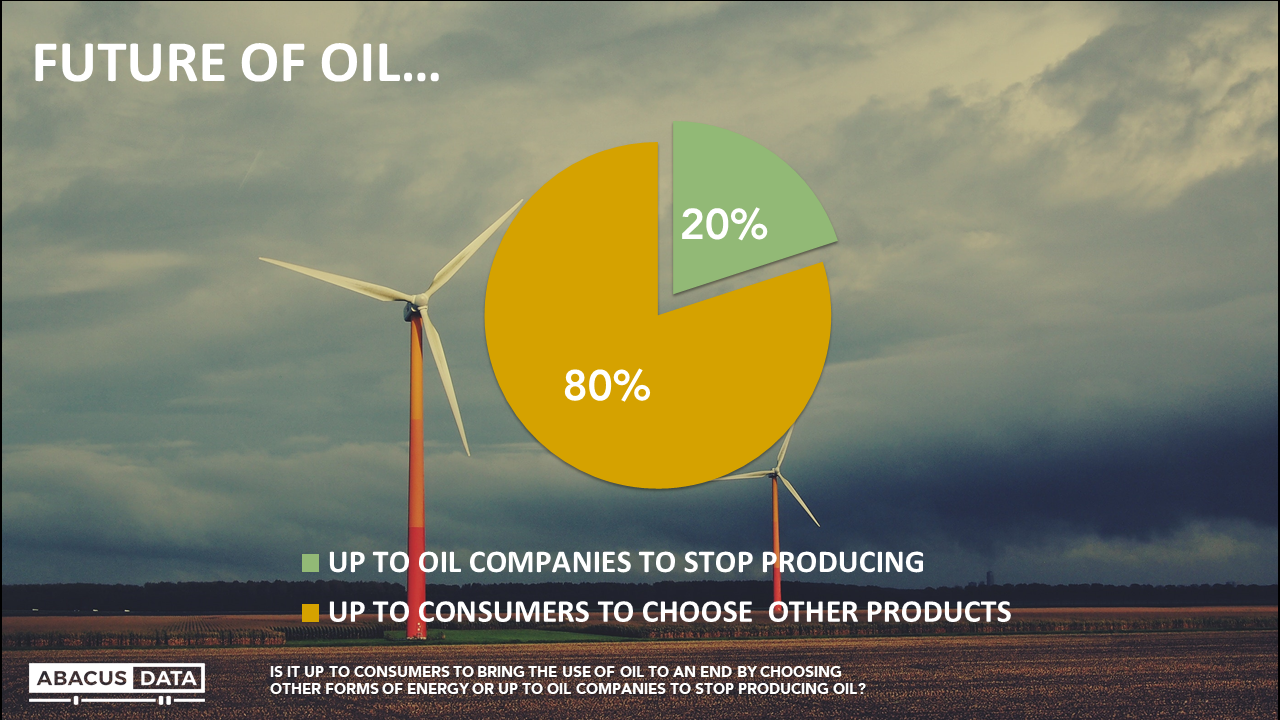
Finally, it is worth noting that by a very wide margin, Canadians believe it is up to consumers to choose different energy products rather than up to oil companies to stop producing oil if a transition is to occur.
CONCLUSIONS
For years, pro-oil advocates and anti-oil crusaders have tried to weaponize public opinion – with very little to show for these efforts. Canadians are relentlessly pragmatic – they see oil as a product with many practical uses, want to see it phased out over time, but see economic value in making sure Canada is a successful participant in the world market for oil, as long as efforts are made to shift energy use over time.
These numbers contain important signals for each of the main parties.
For the Liberals, the numbers reinforce that their supporters mostly see merit in a strategy of balance, even if some will be disappointed in the pace of change or discomfited by owning a pipeline.
For the Conservatives, the numbers warn that their base is neither homogeneously pro-oil, nor fixated on oil and pipelines.
But probably the most troublesome news is for the NDP – a party which attracts the strongest anti-oil voters but whose tent also includes many who believe in extracting economic benefits from Canadian energy and support pipeline construction. This simmering internal tension may well become even more challenging for NDP leader Jagmeet Singh over the coming year.”
Methodology
Our survey was conducted online with 2,000 Canadians aged 18 and over from September 14 to 19, 2018 2018. A random sample of panelists was invited to complete the survey from a set of partner panels based on the Lucid exchange platform. These partners are double opt-in survey panels, blended to manage out potential skews in the data from a single source.
The margin of error for a comparable probability-based random sample of the same size is +/- 2.2%, 19 times out of 20. The data were weighted according to census data to ensure that the sample matched Canada’s population according to age, gender, educational attainment, and region. Totals may not add up to 100 due to rounding.
On behalf of The Canadian Real Estate Association (CREA), we conducted a national survey of 2,500 Canadian millennials (those aged 18 to 38) earlier this spring (April 18 to May 9). The survey explored attitudes and perceptions around housing with Canada’s largest generation.
Come the time of the next federal election in 2019, millennials will make up the largest group of eligible voters and Elections Canada estimates voter turnout among young voters increased by about 15 percentage points from 2011 to 2015. Given the size of the generation, if they vote collectively and turnout, they can have a major impact on the outcome of the next election.
Here are the highlights from the research:
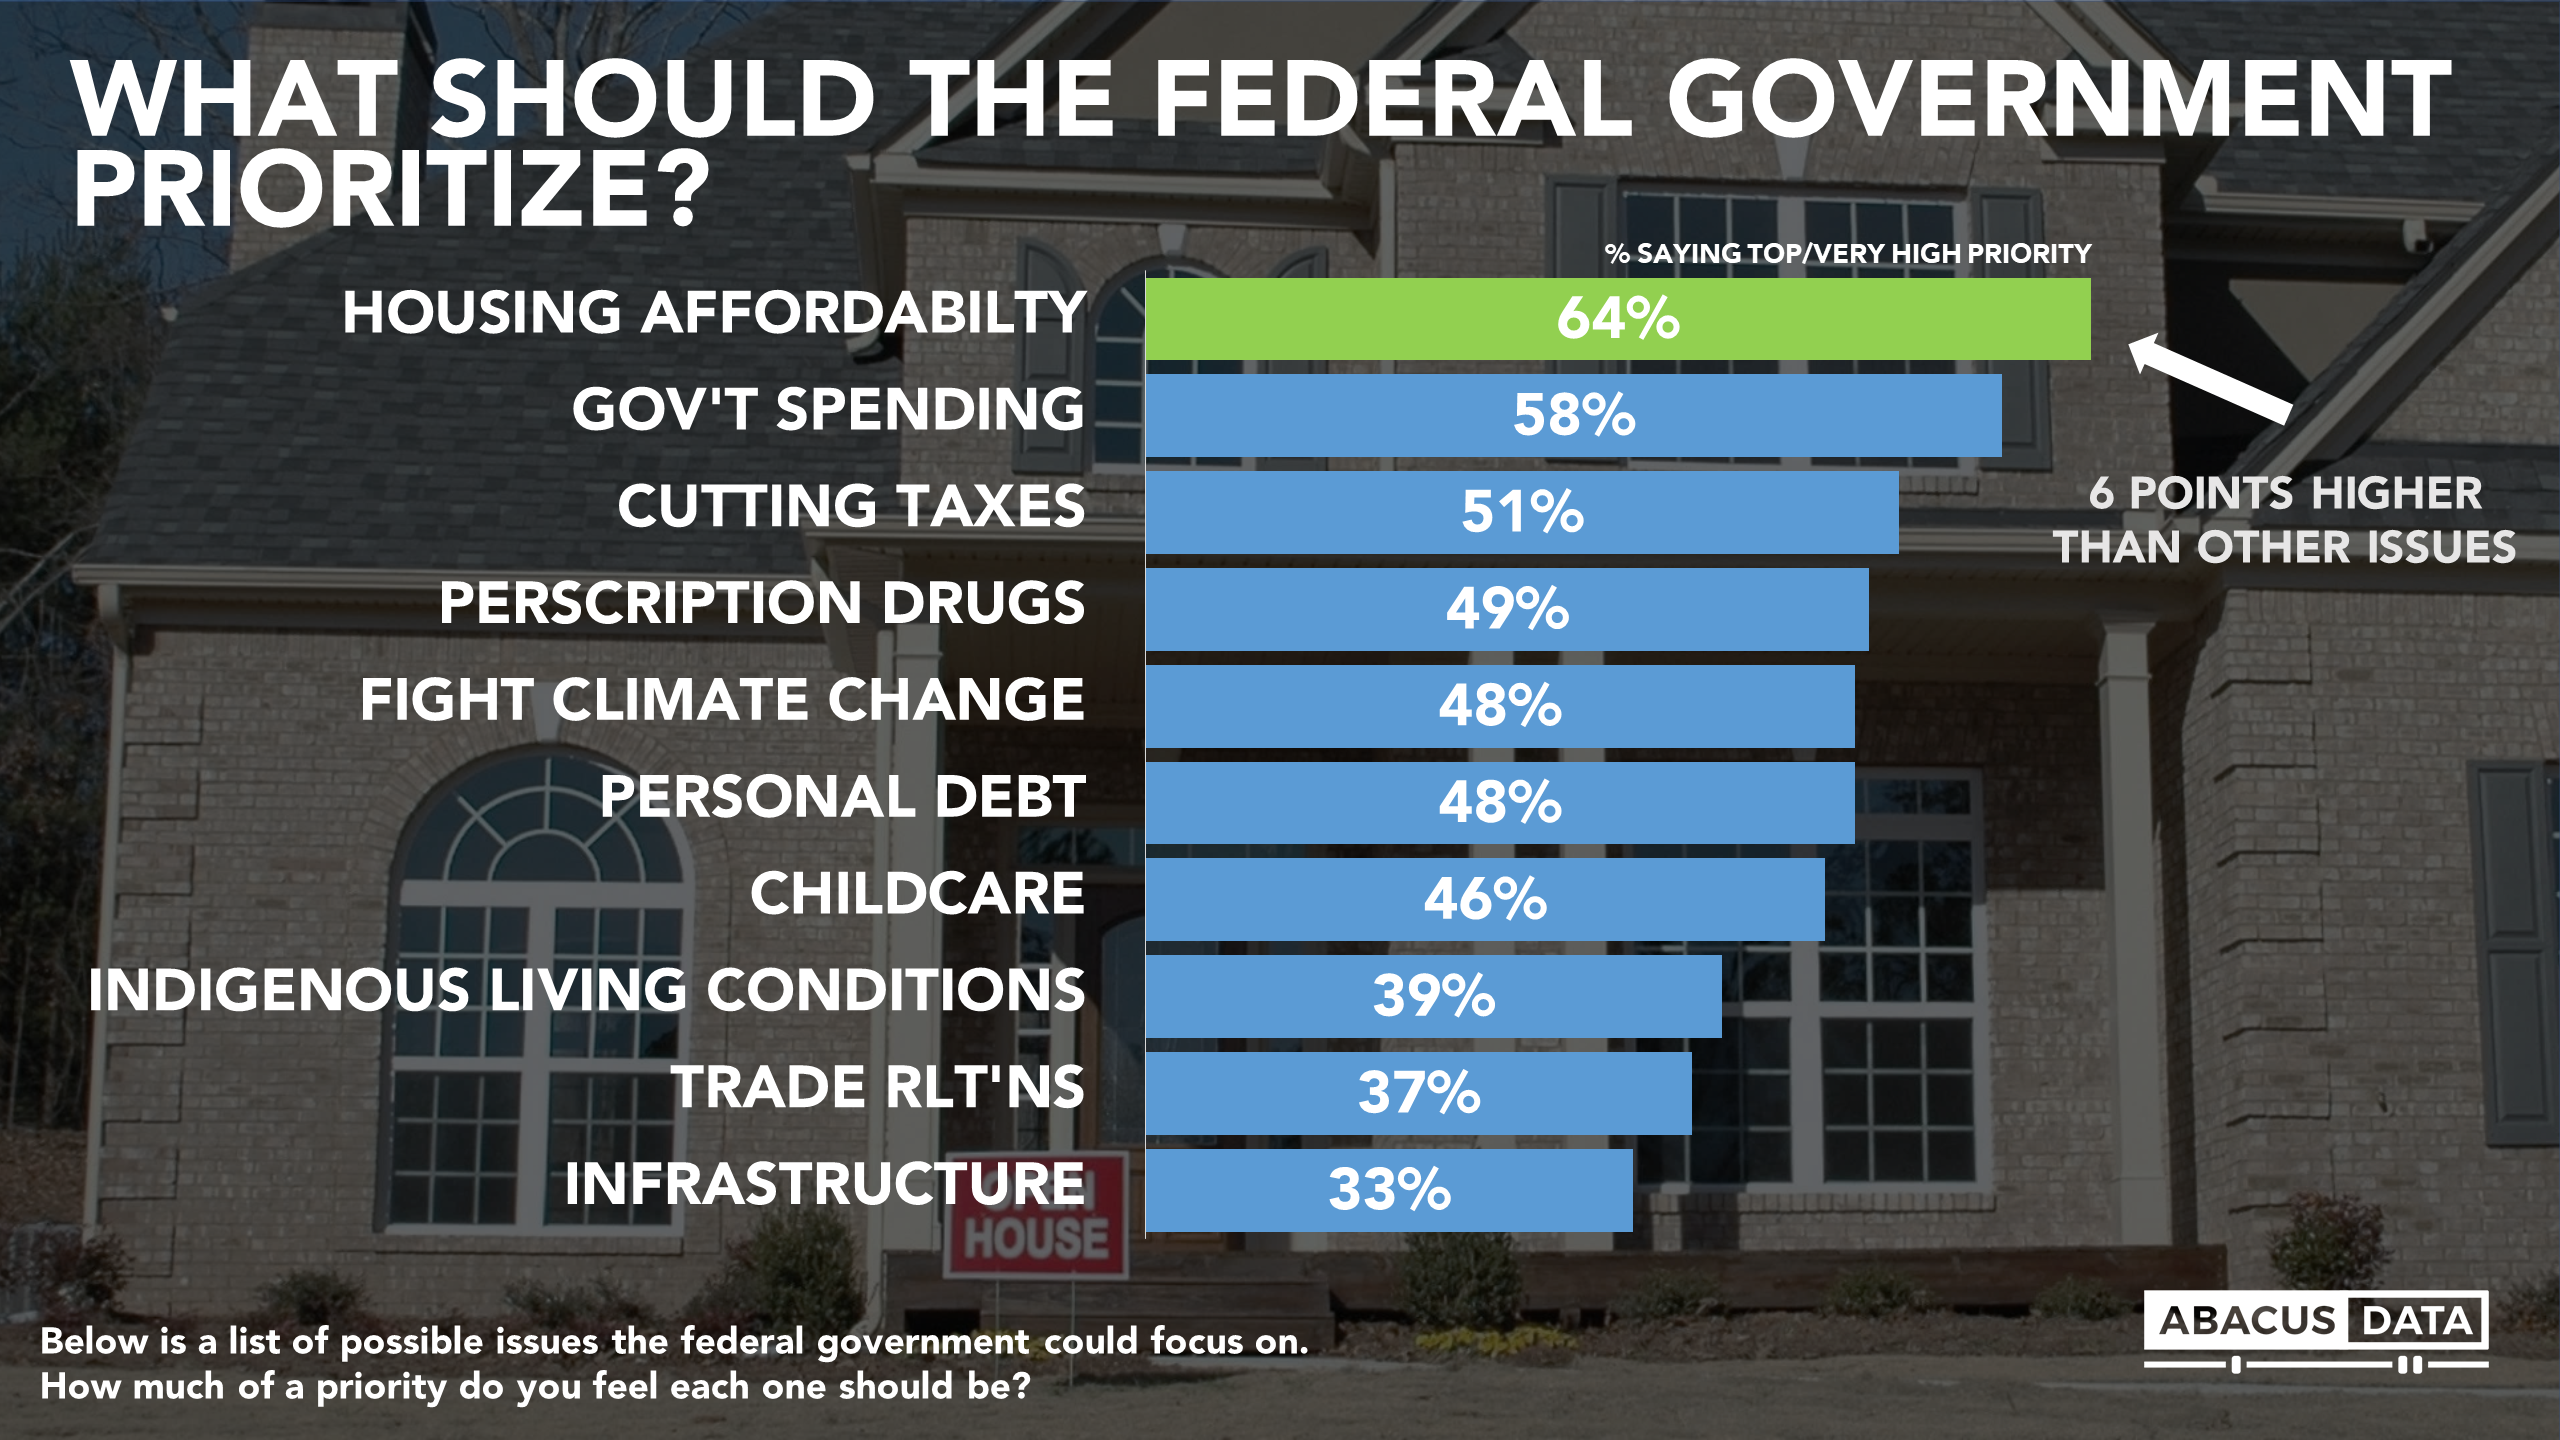
MORE MILLENNIALS BELIEVE THAT THE FEDERAL GOVERNMENT SHOULD MAKE HOUSING AFFORDABILITY A TOP OR VERY HIGH PRIORITY THAN OTHER ISSUES.
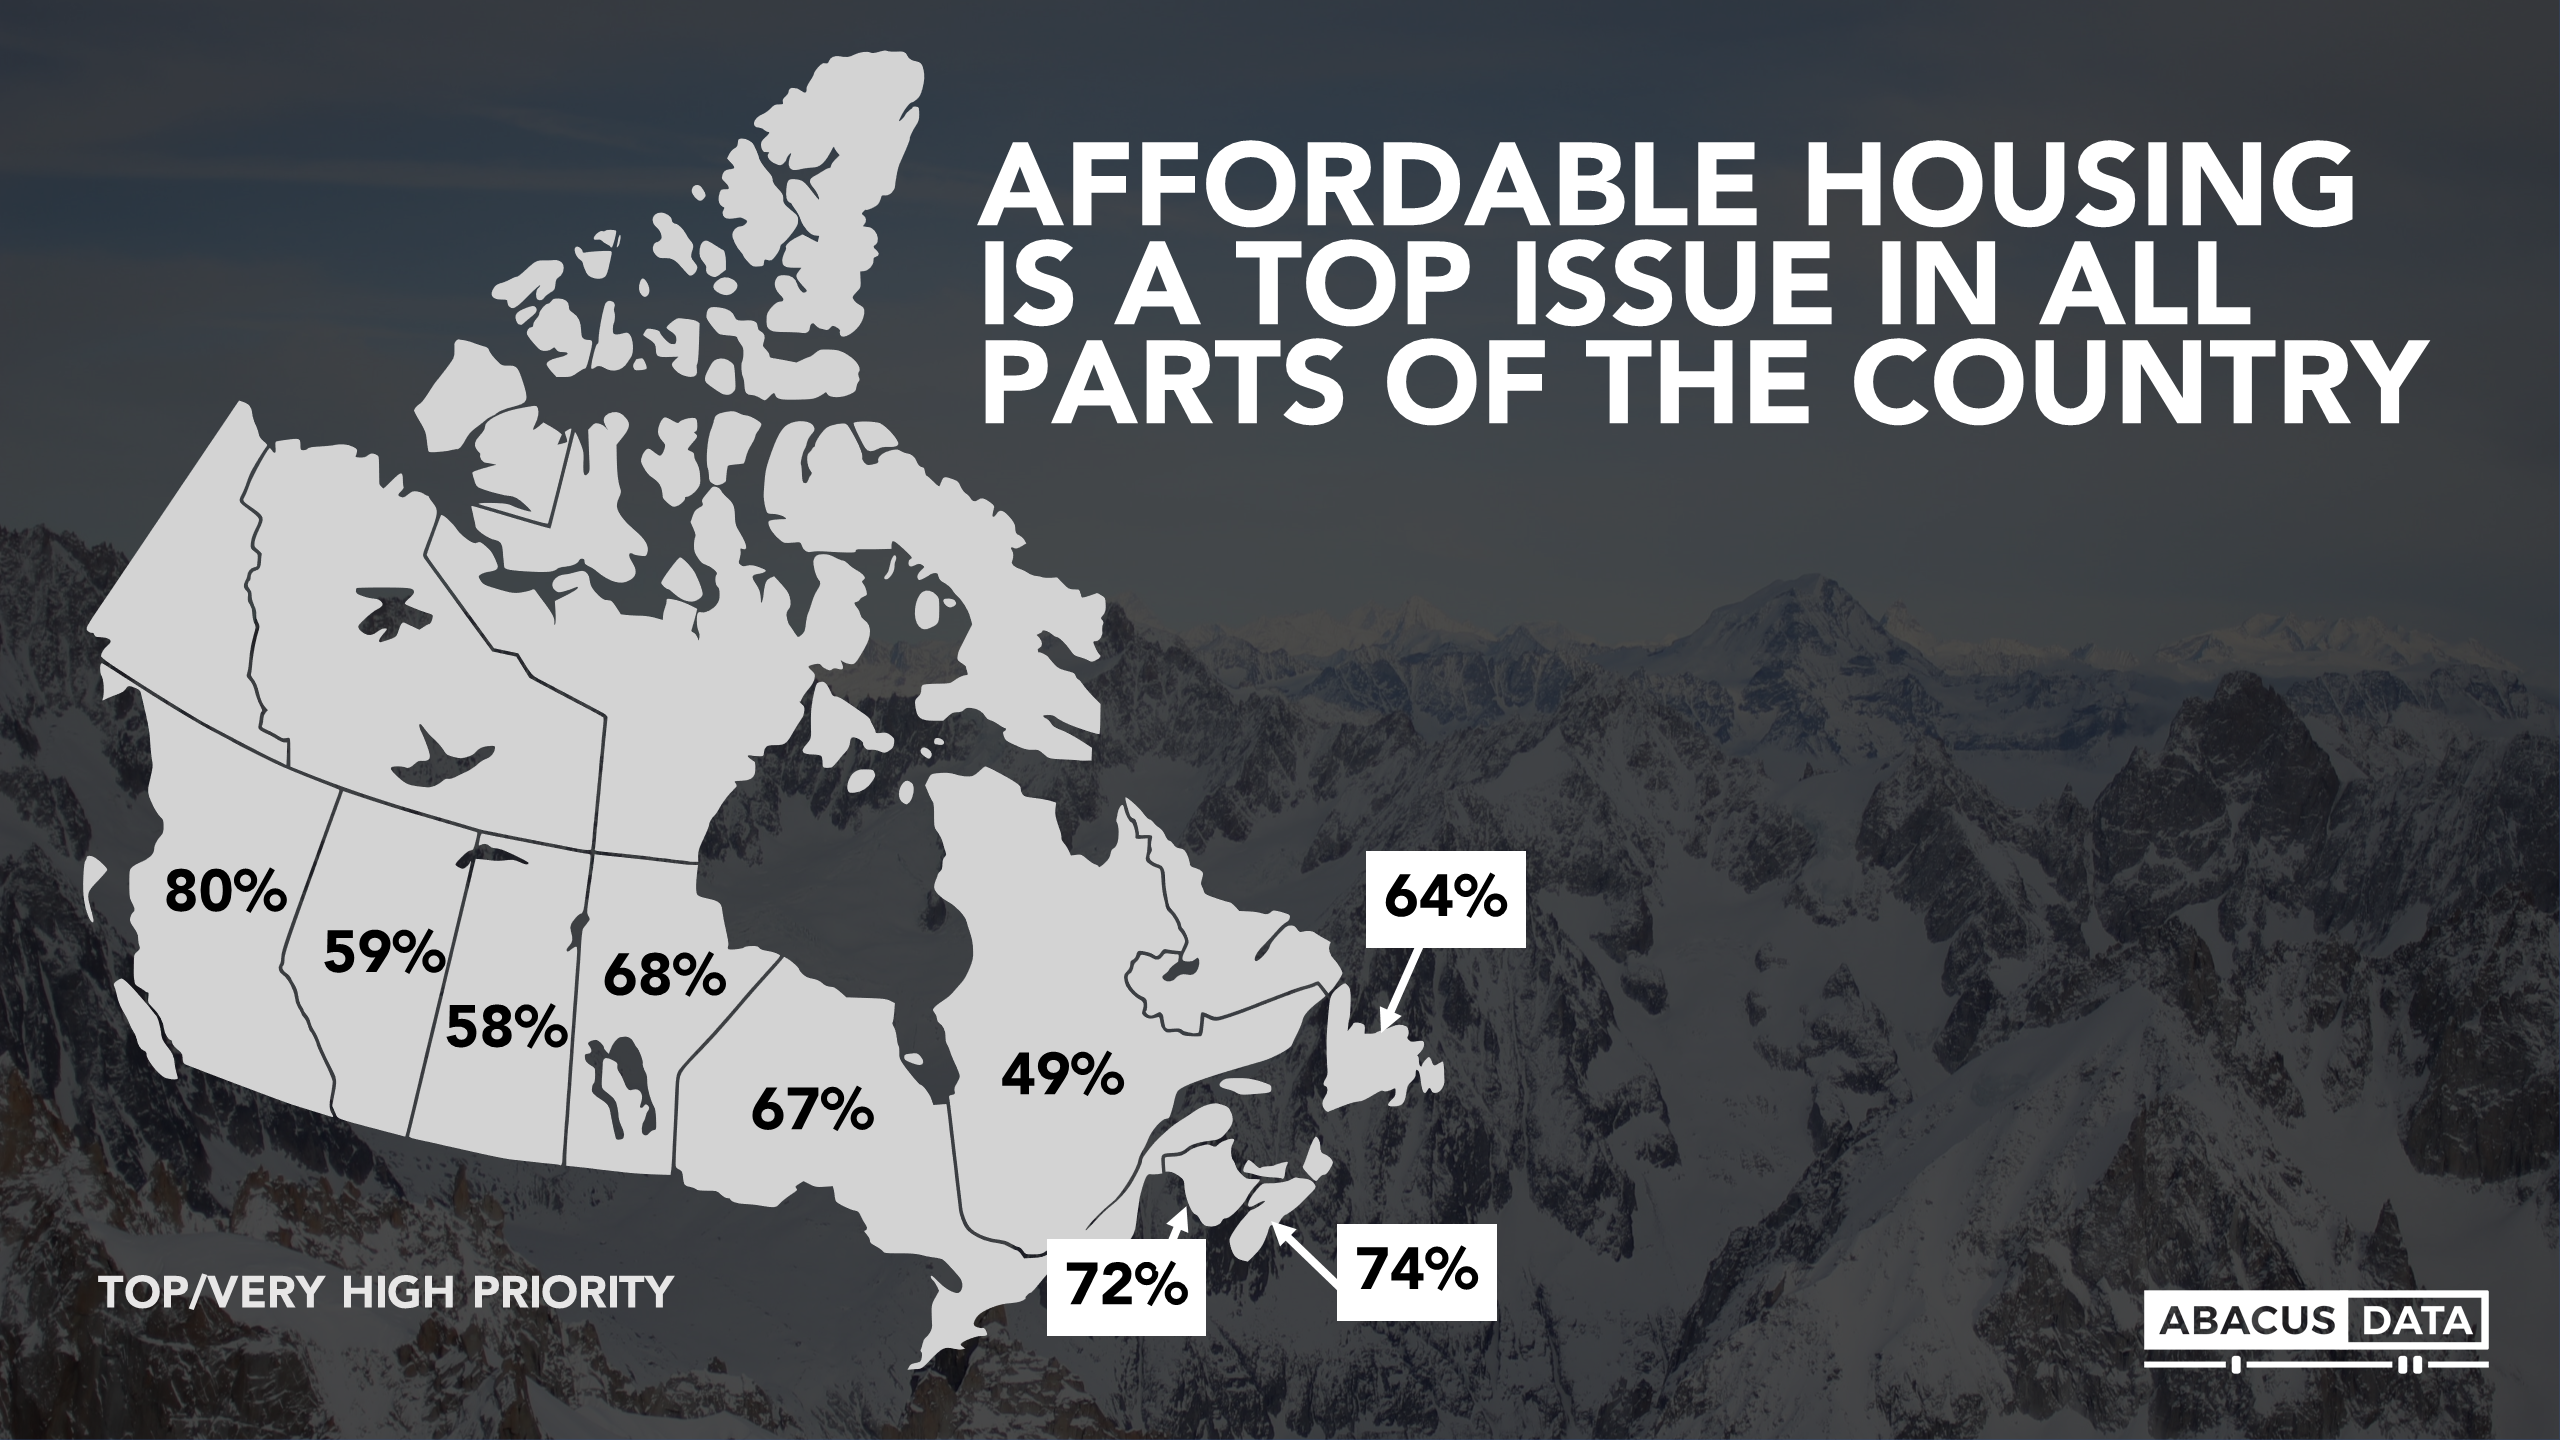
Over 6 in 10 millennials rated housing affordability as a top or very high priority. It’s the top issue of those we tested and six points higher than government spending, cutting taxes, prescription drug prices, and fighting climate change.
And concern about housing affordability is not confined to the Greater Toronto Area or the lower mainland of British Columbia. Majorities in every province, except for Quebec, rated affordable housing as a top or very high priority for the federal government to focus on.
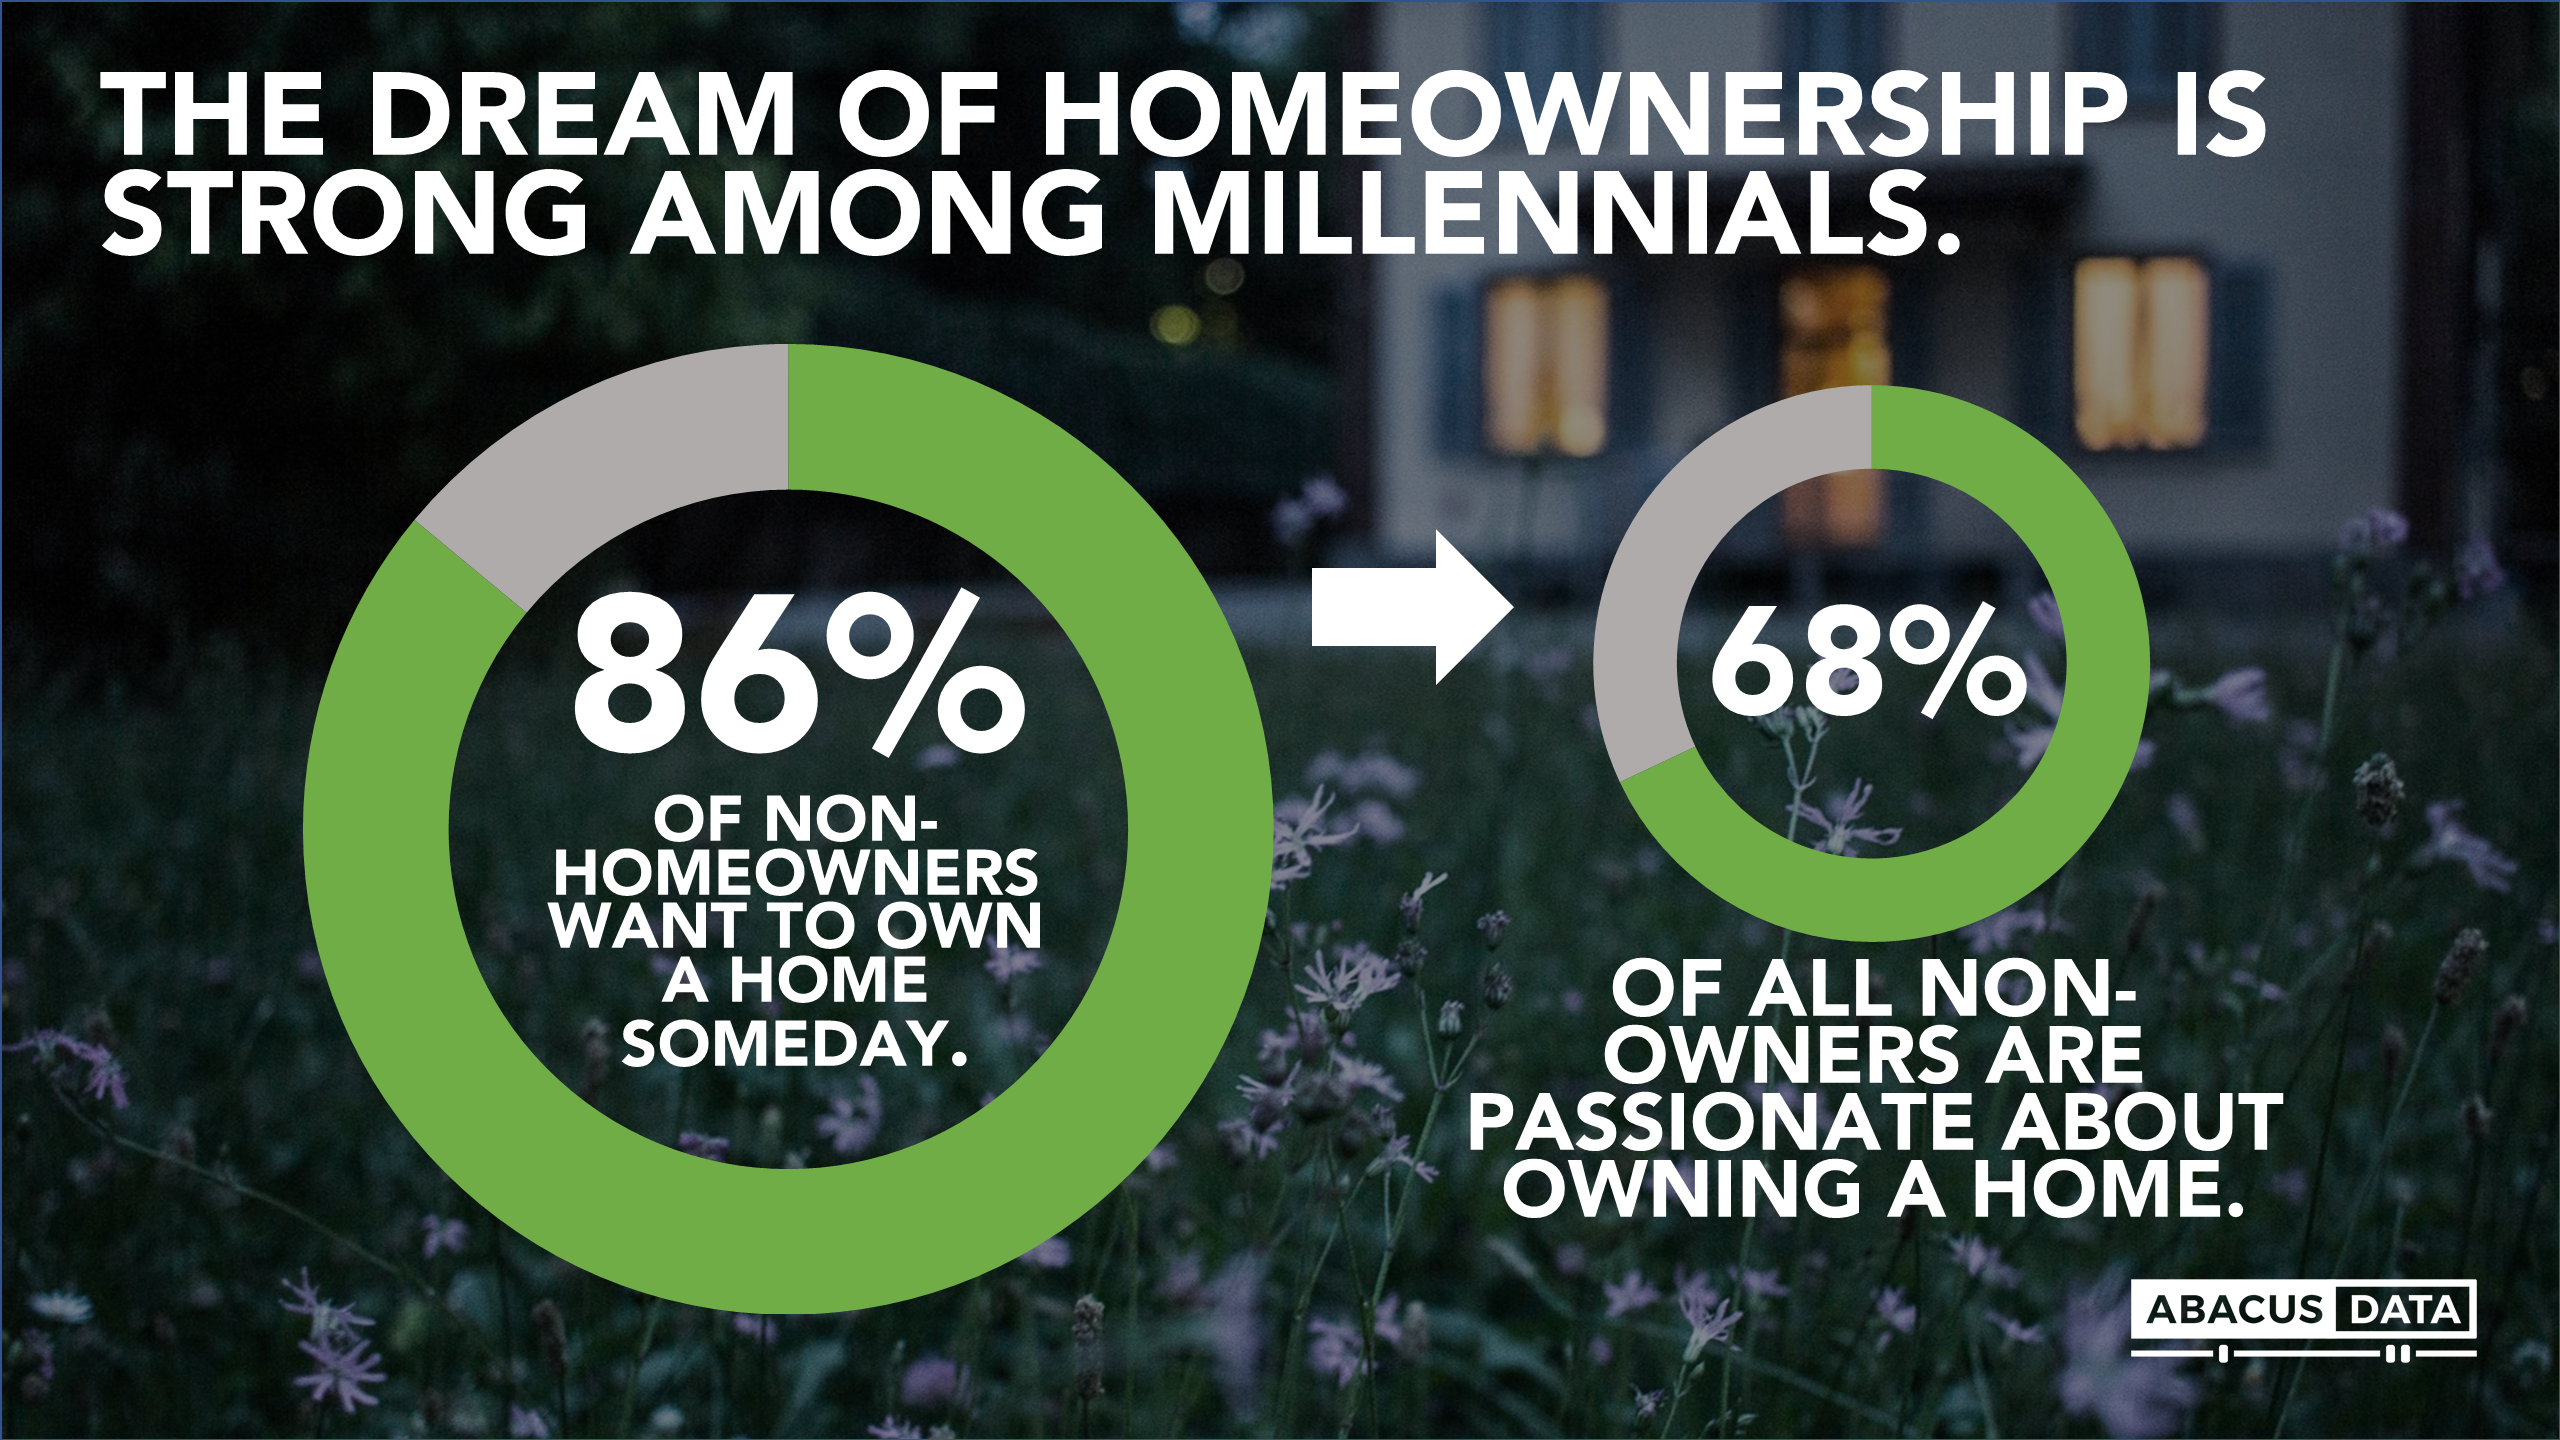
THE DREAM OF HOMEOWNERSHIP IS ALIVE AND WELL WITH MILLENNIALS.
The concern about housing affordability among millennials comes from their strong desire to own their own home. Among those who do not own a home yet, 86% said they want to own a home someday and over two-thirds of this group are passionate about owning a home. For many millennials, homeownership and home improvement are topics they obsess over. Watching HGTV or browsing REALTOR.ca listings is a common practice for many young Canadians. The data confirms this.
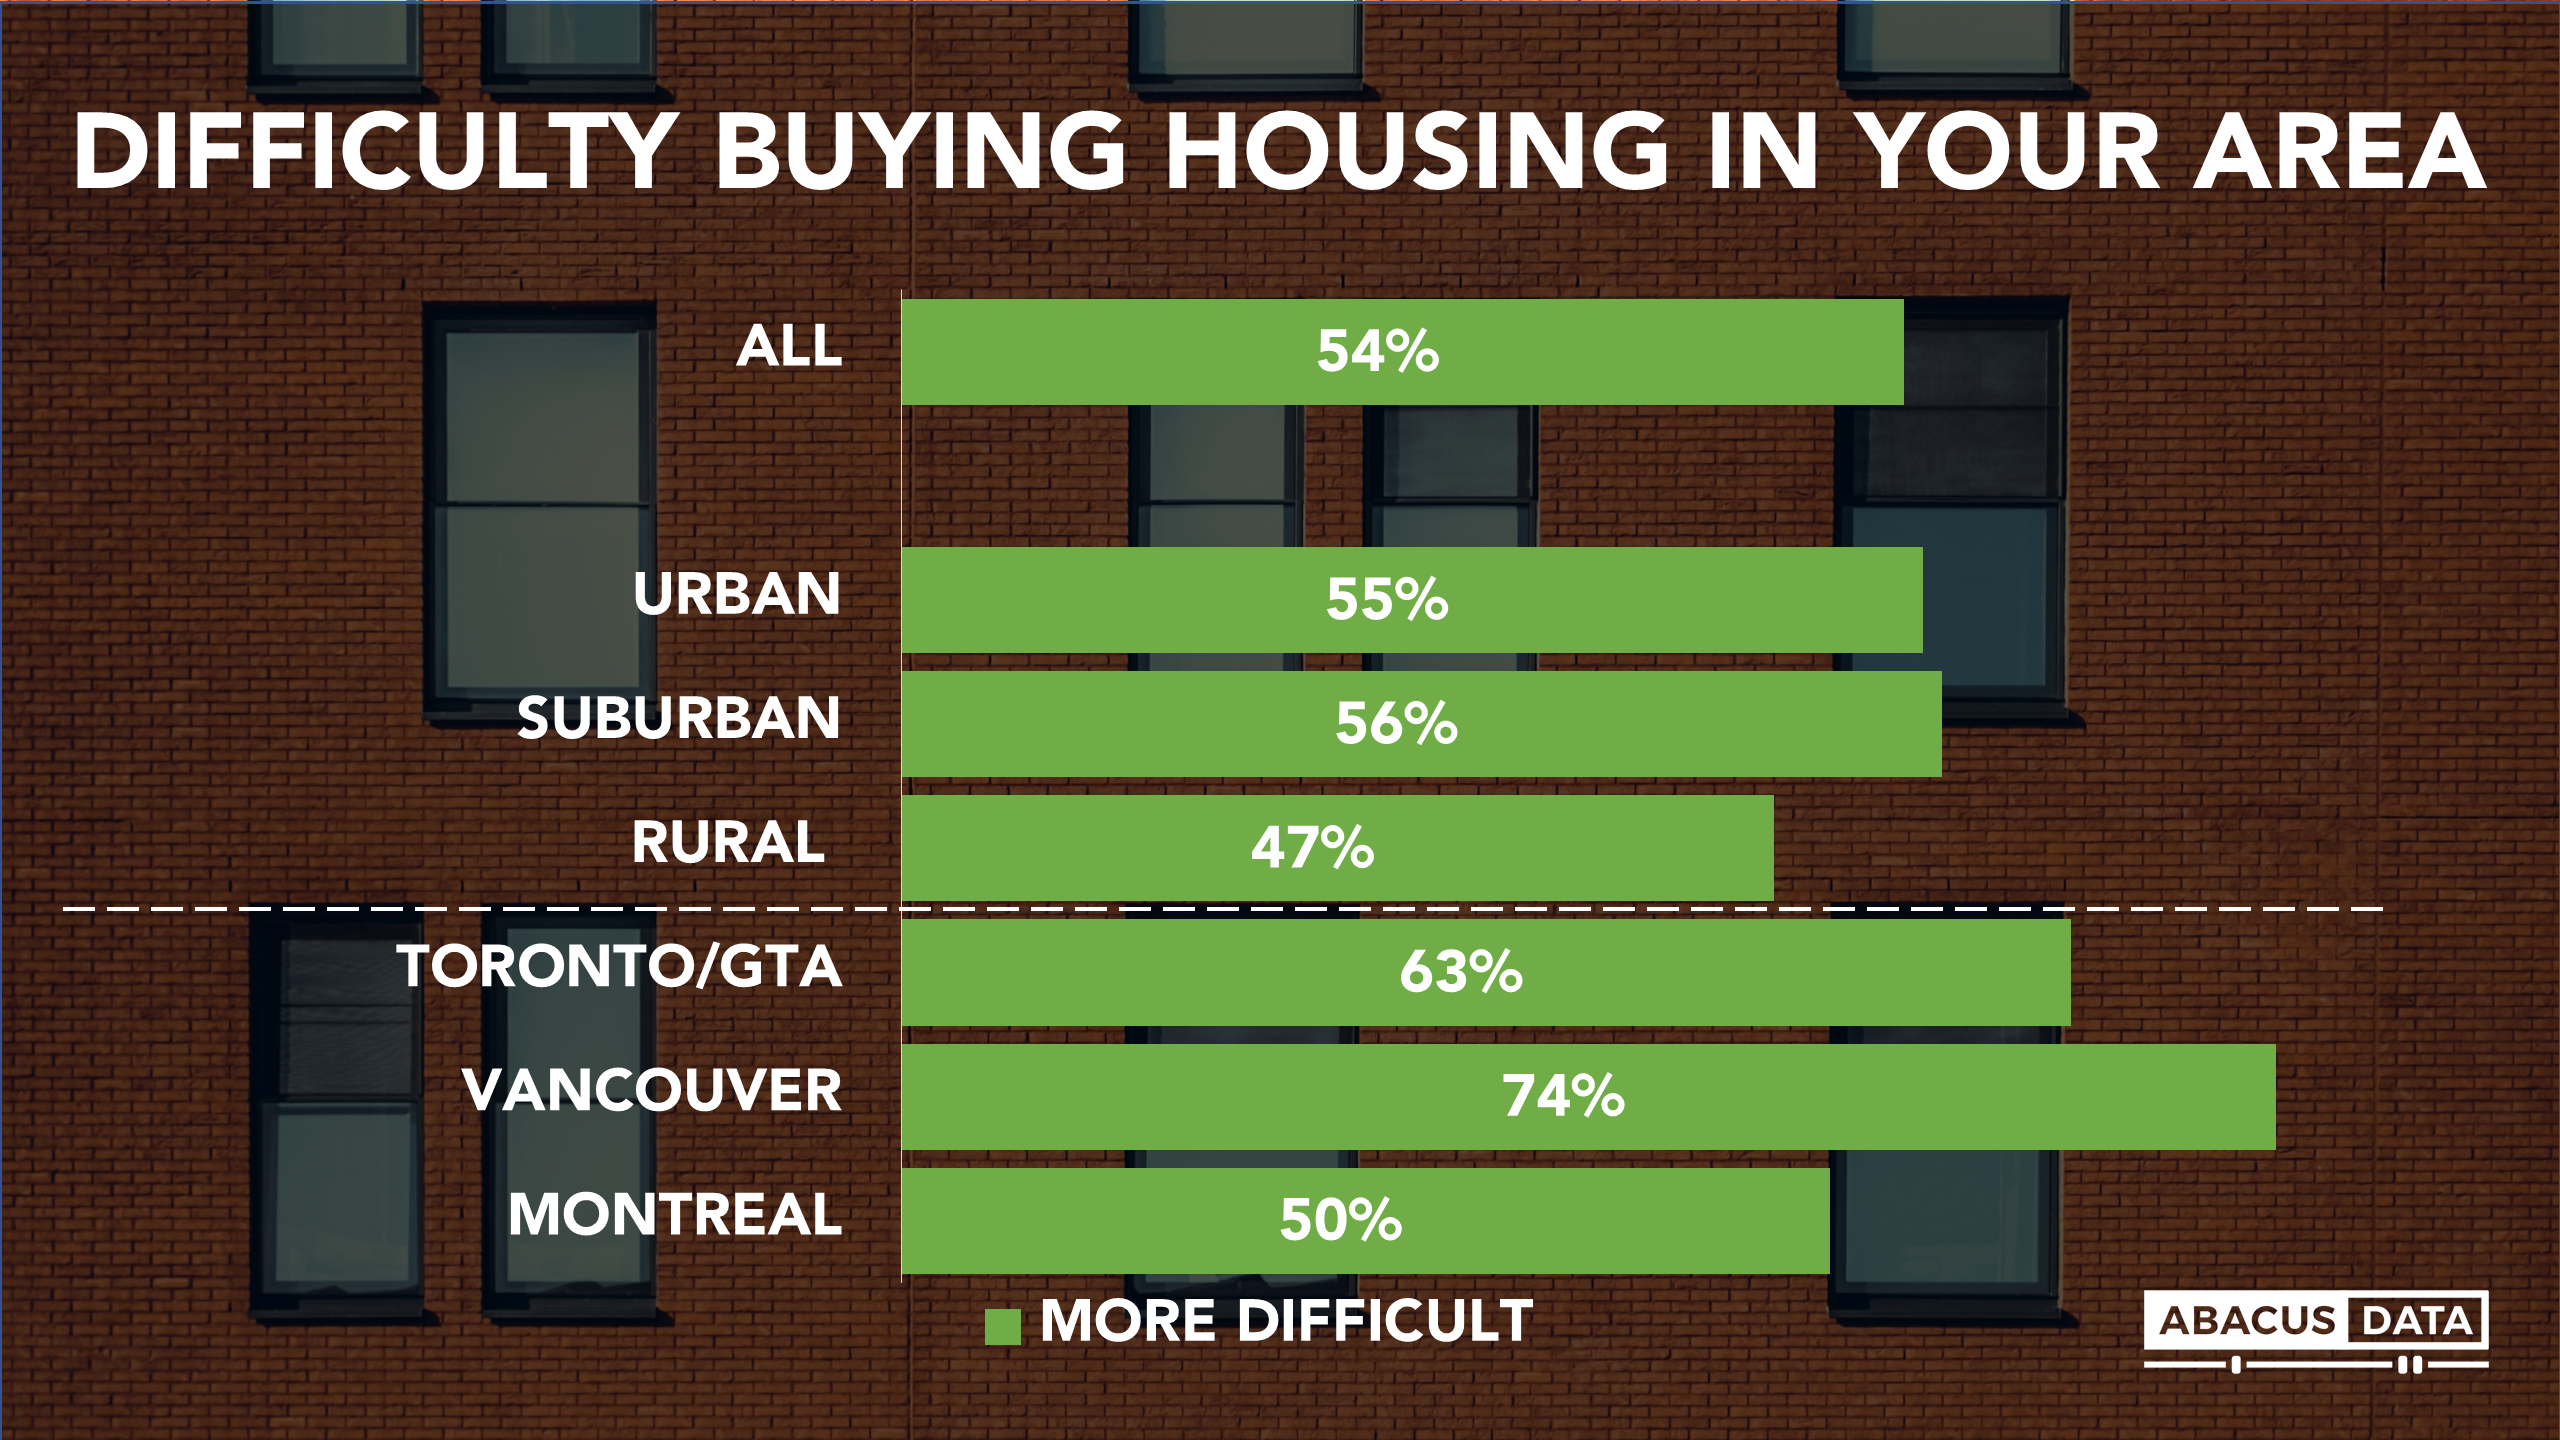
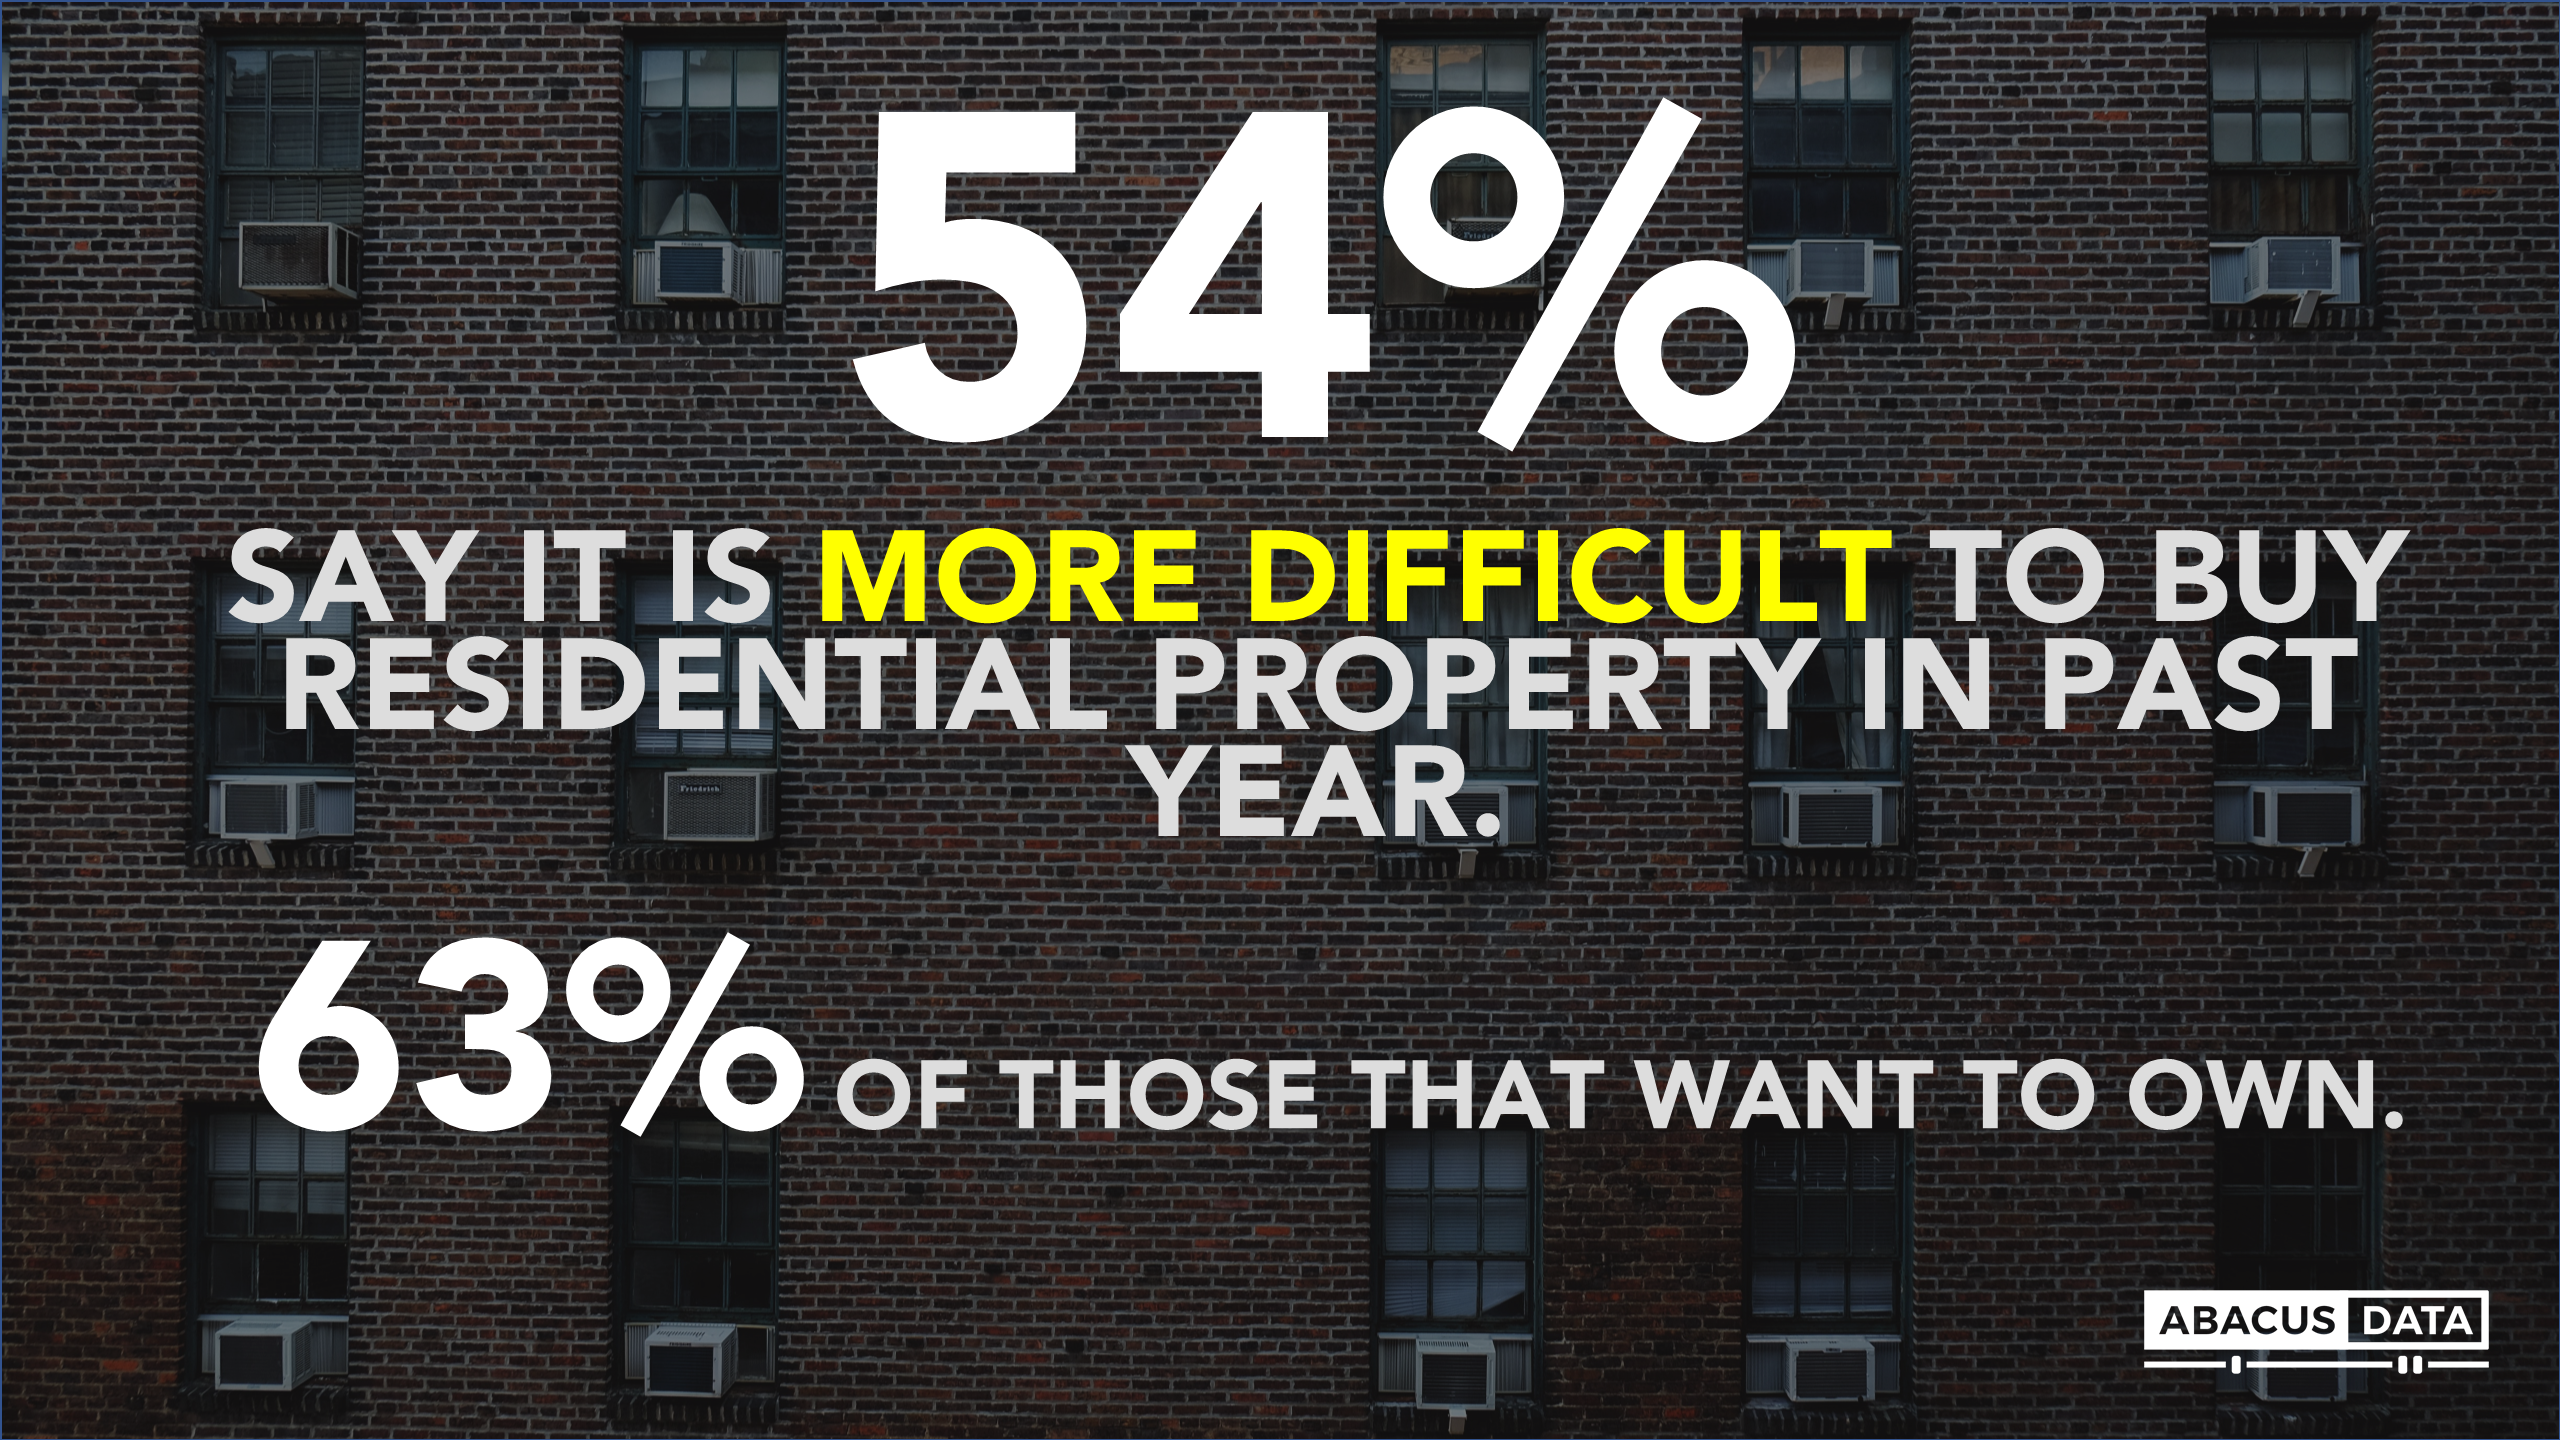
MOST MILLENNIALS FEEL IT HAS BECOME MORE DIFFICULT TO BUY A RESIDENTIAL PROPERTY IN THE PAST YEAR.
But the dream to own is up against growing anxiety about their ability to get into the housing market. Most millennials say that it has become more difficult to buy a residential property in the past year, including 63% of those who don’t currently own but want to.
And again, these feelings are not isolated to those living around Toronto, Vancouver, or Montreal – although perceptions are more acute in those regions. In urban, suburban, and rural communities across the country, a majority or a large plurality of millennials say it has become more difficult to buy a home in the past year.
When asked what affects affordability millennials are more likely to cite saving enough for a down payment (47%), the cost of carrying the home with monthly mortgage payments (44%), or specifically mortgage interest rates (38%). Fewer, but still a sizeable minority, feel that low supply or foreign buyers are a very big factor impact housing affordability in Canada.
MILLENNIALS FEEL THAT SOME POLICY CHANGES ARE HAVING A NEGATIVE IMPACT ON HOUSING AFFORDABILITY.
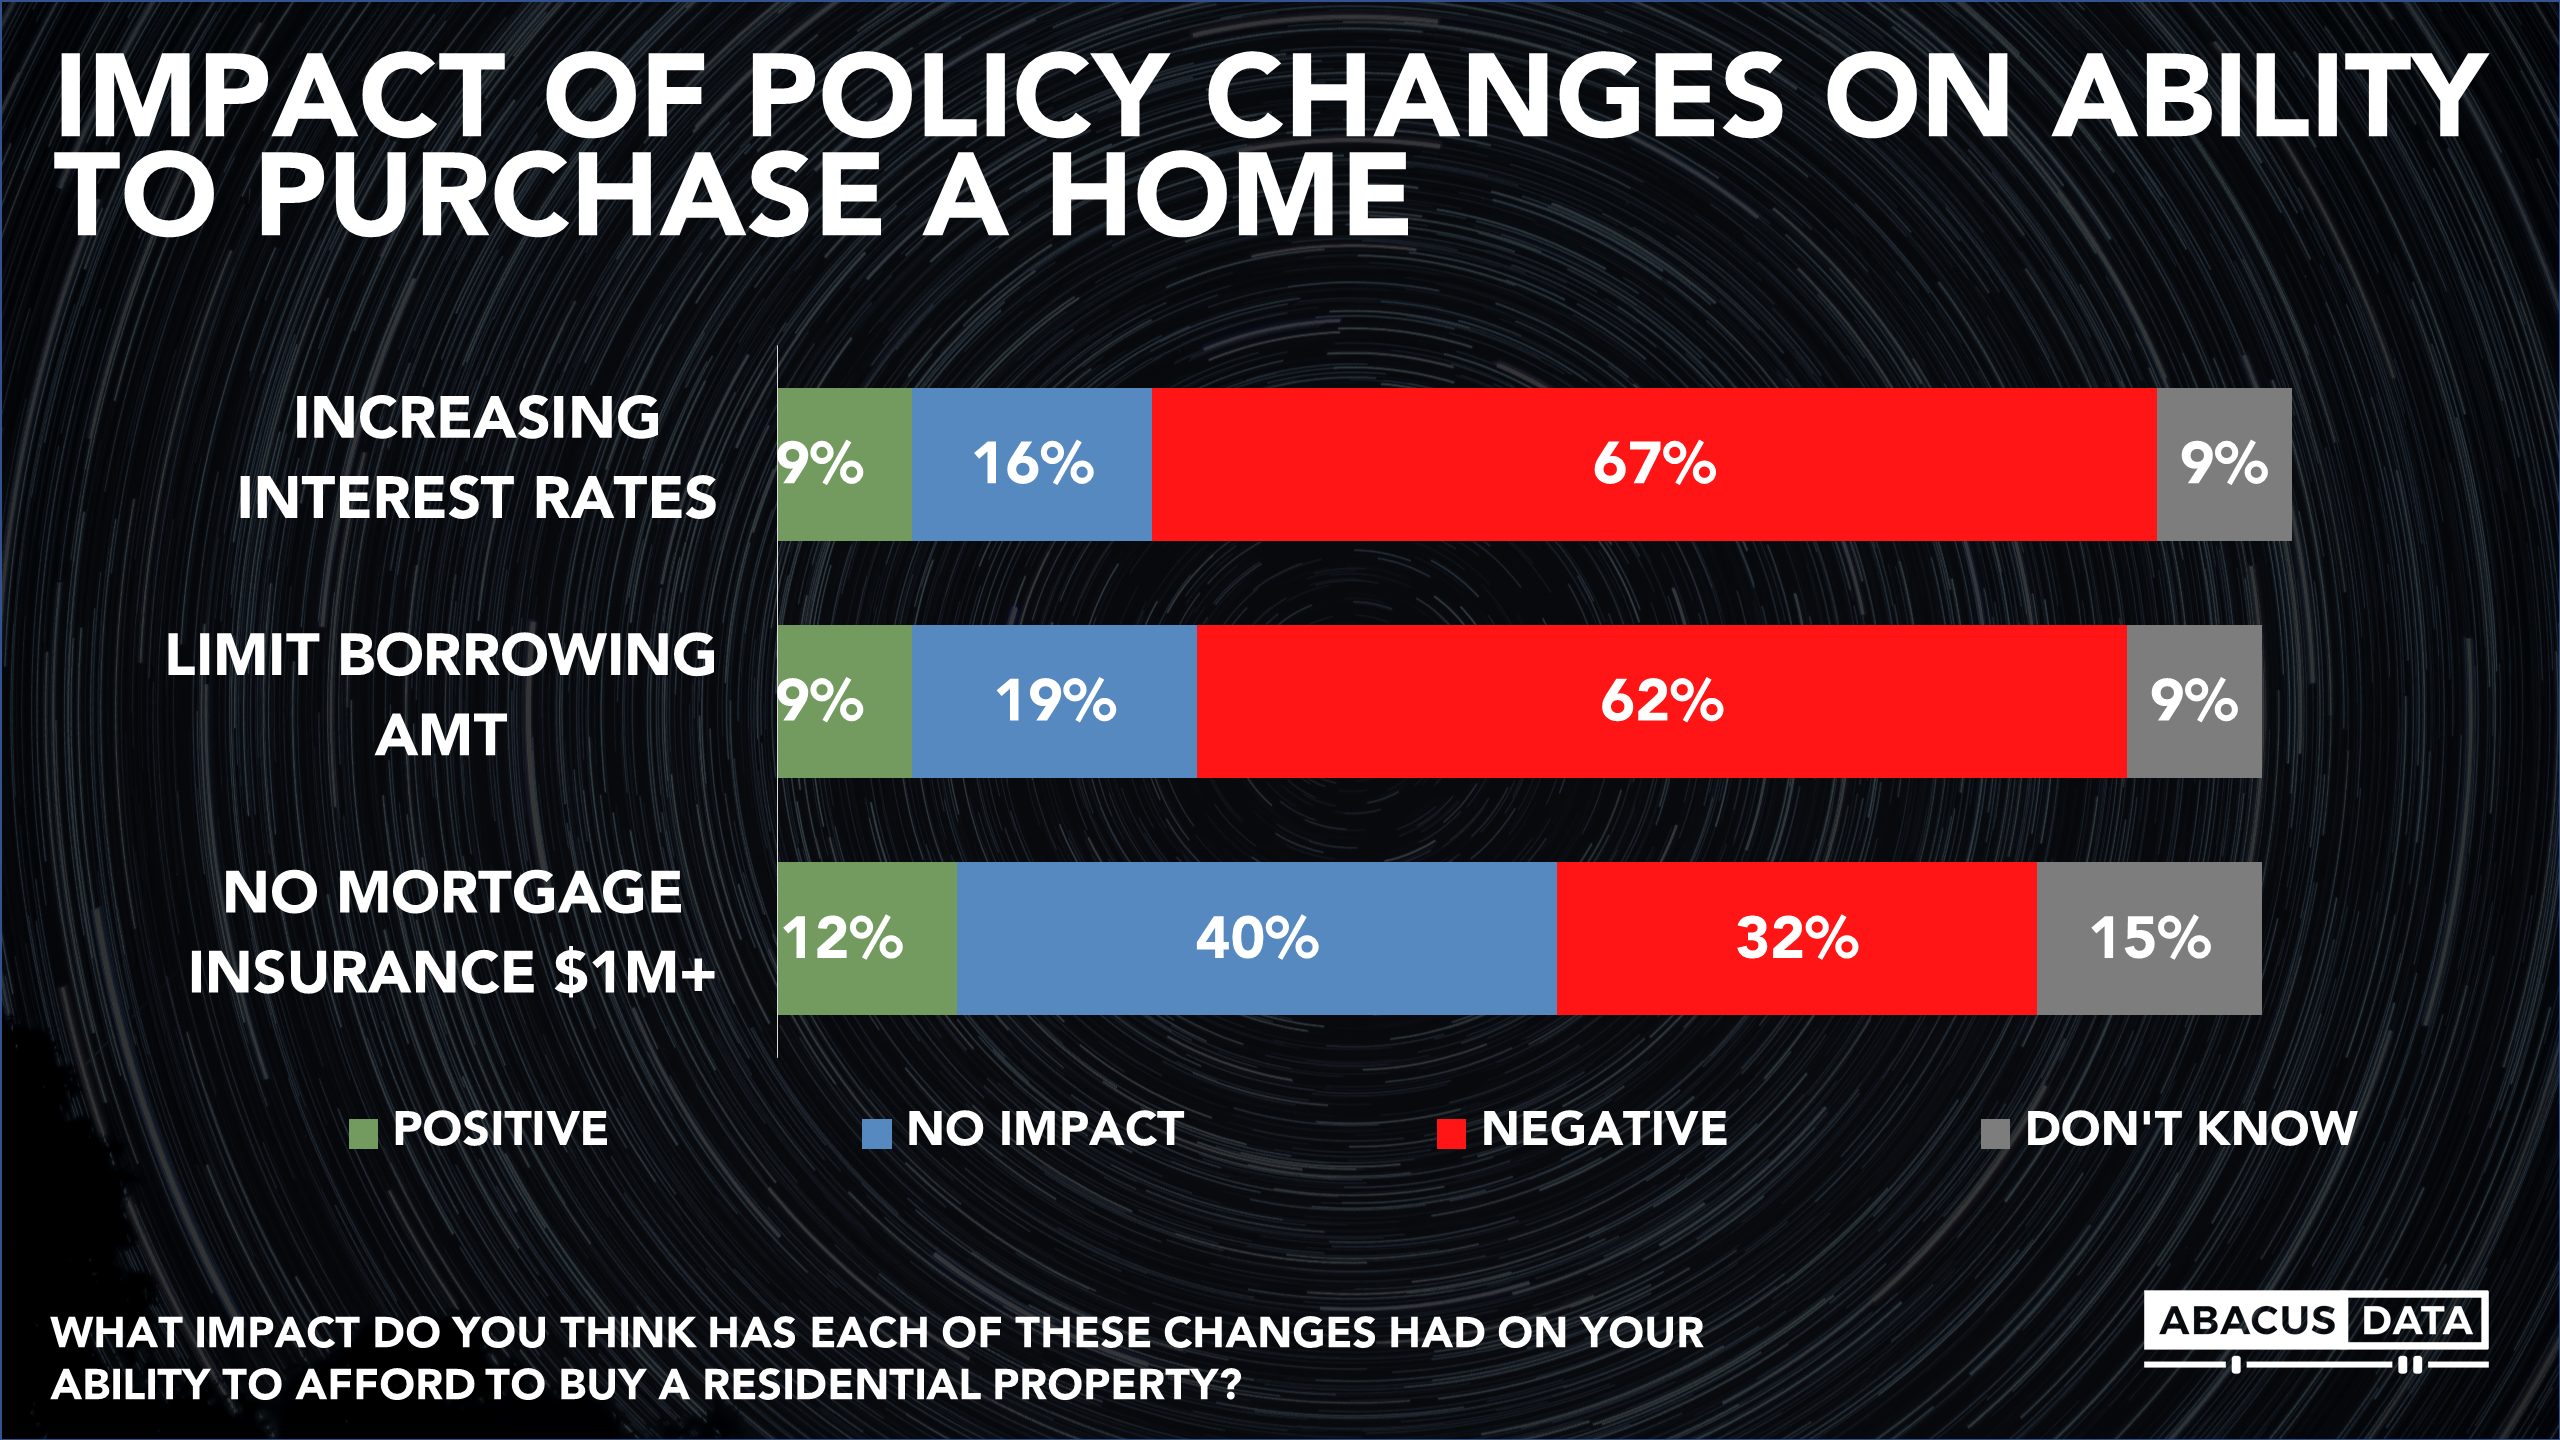
When we asked what impact three policy changes have had on housing affordability, most feel that interest rate increases and government decisions that make it more difficult for people to get a mortgage have had a negative impact on housing affordability. One in three feels the same way about the new government rule that imposed new restrictions on when it will insure some properties worth more than $1 million.
INCREASING THE FIRST TIME HOME BUYERS TAX CREDIT IS HIGHLY APPEALING TO MILLENNIALS.
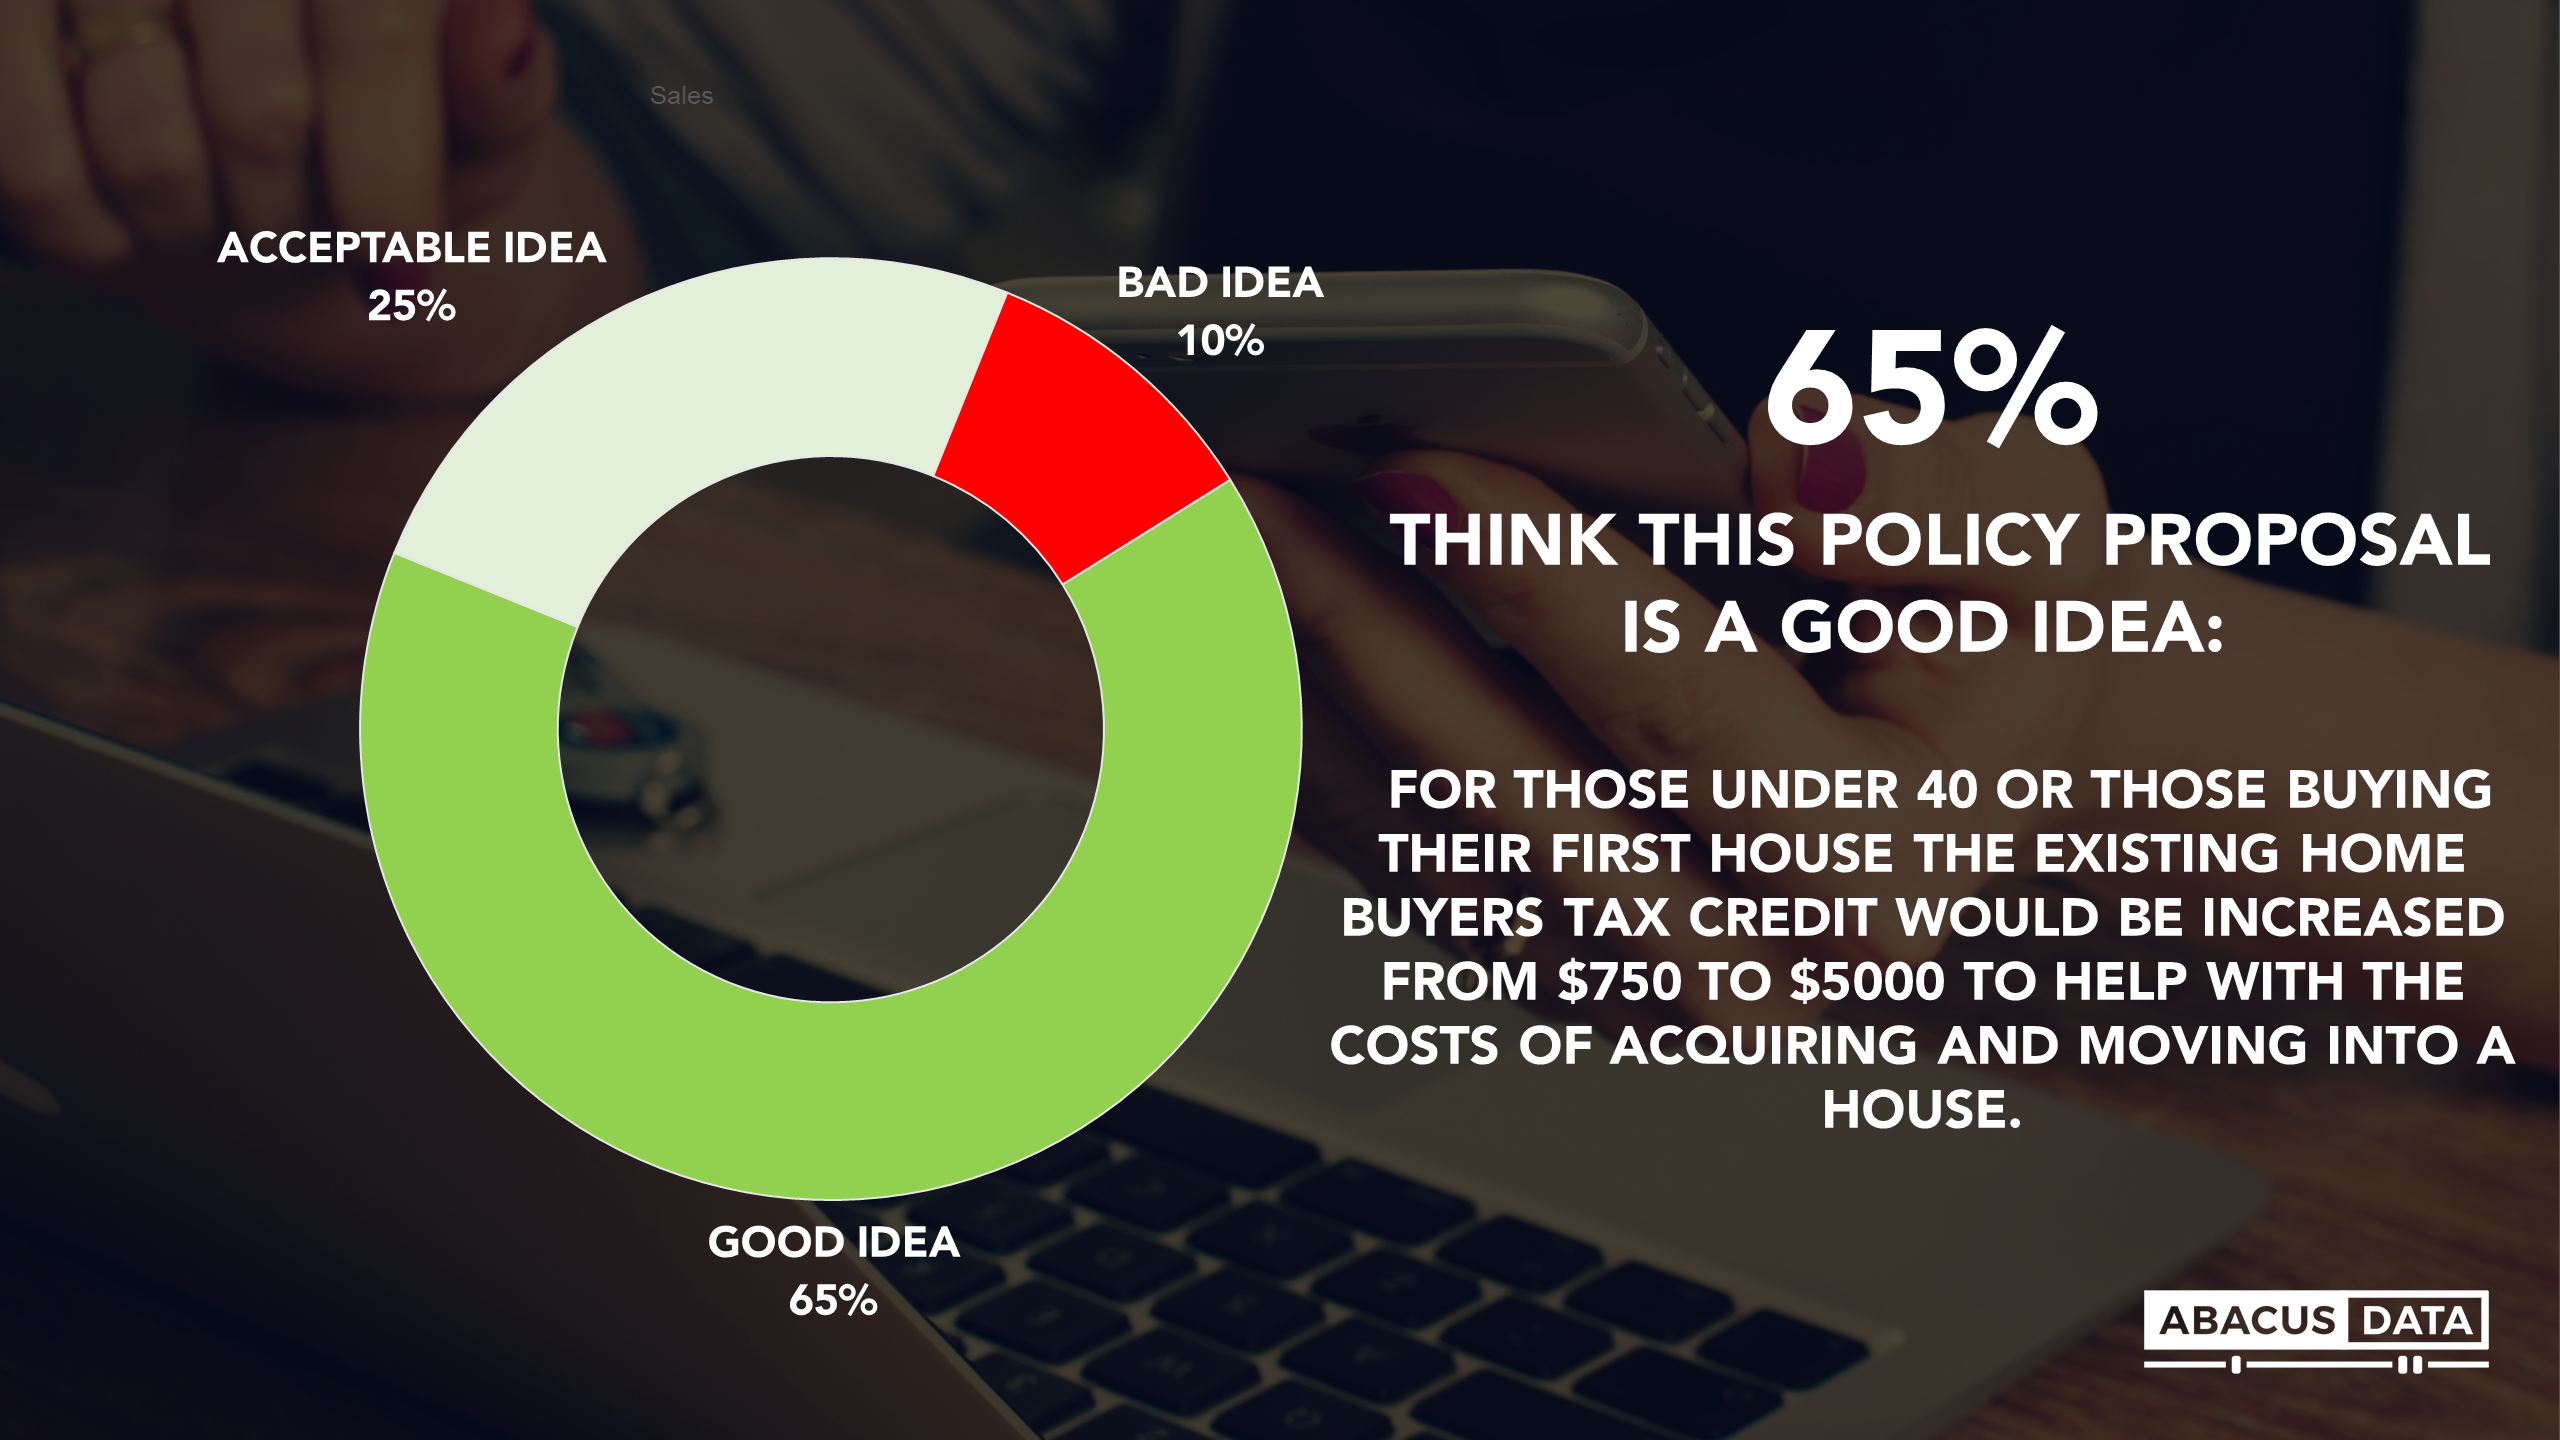
One policy opinion being recommended by the Canadian Real Estate Association is highly appealing to millennials. We presented a proposal that would increase the existing First Time Home Buyers Tax Credit from $750 to $5000 for those under 40. Overall, 65% felt it was a good idea and another 23% thought it was an acceptable idea. Few felt that it was a bad idea.
THE UPSHOT
Over the past few years, I’ve noticed that housing affordability has been rising as a top concern for Canada’s millennial generation. This survey adds further evidence as young Canadians are increasingly concerned about their ability to afford a place to live and the dream of homeownership is slipping away from them.
Most want to own a home and many are passionate about the topic. It monopolizes conversations not just around Toronto and Vancouver, but in communities across the country as millennials feel that it is becoming more difficult to buy a home. Many feel that decisions being made by the federal government are having a negative impact, and there’s a clear desire for policy solutions to make the dream easier to achieve.
Housing is an issue that could activate millennials to engage in politics and turnout to vote in the next election. There’s a clear opportunity for political leaders to empathize with young Canadians, lead on the issue, and offer solutions to a challenge that most feel hopeless to solve.
METHODOLOGY
The survey was conducted online with 2,500 Canadians aged 18 to 38 (Millennials) from April 18 to May 9, 2018. A random sample of panelists was invited to complete the 20-minute survey from several online panels of Canadians.
The data were weighted according to census data to ensure that the sample matched Canada’s millennial population according to age, gender, educational attainment, and region. Totals may not add up to 100 due to rounding.