Abacus Data’s Final Poll: Conservatives and Liberals are statistically tied on the eve of Election Day in Canada
ABACUS DATA’S FINAL POLL FOR #ELXN44
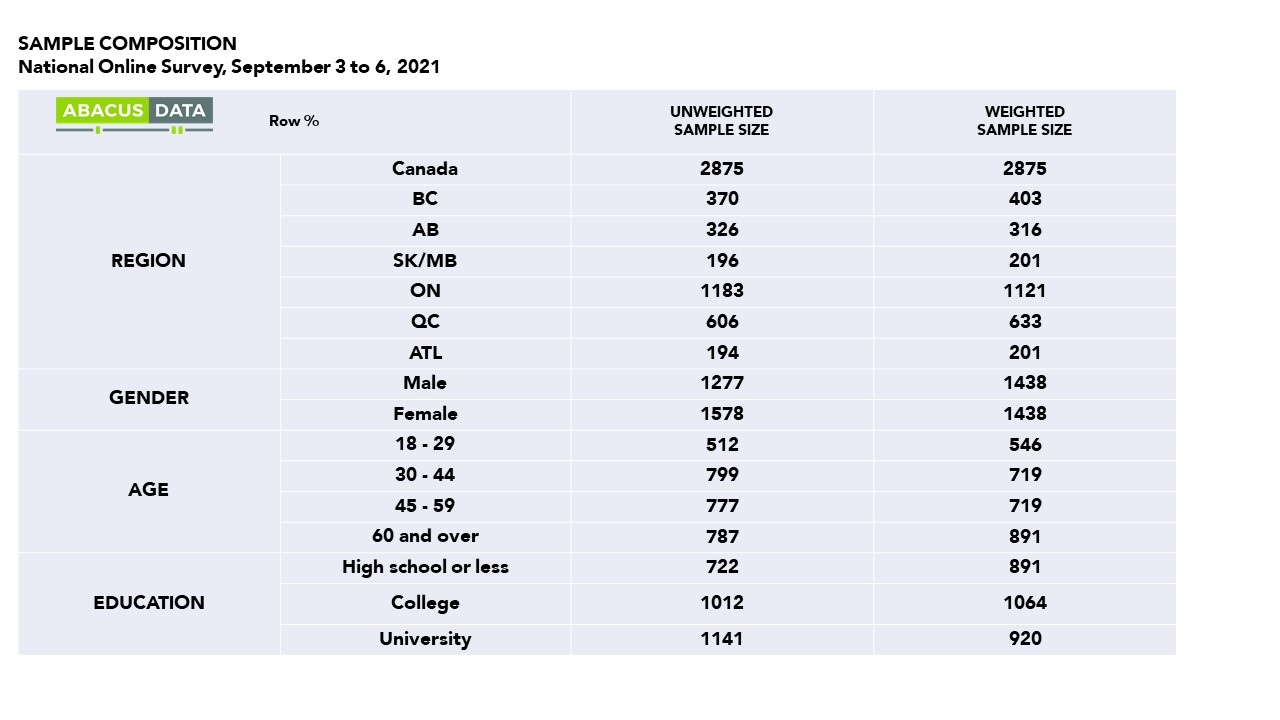
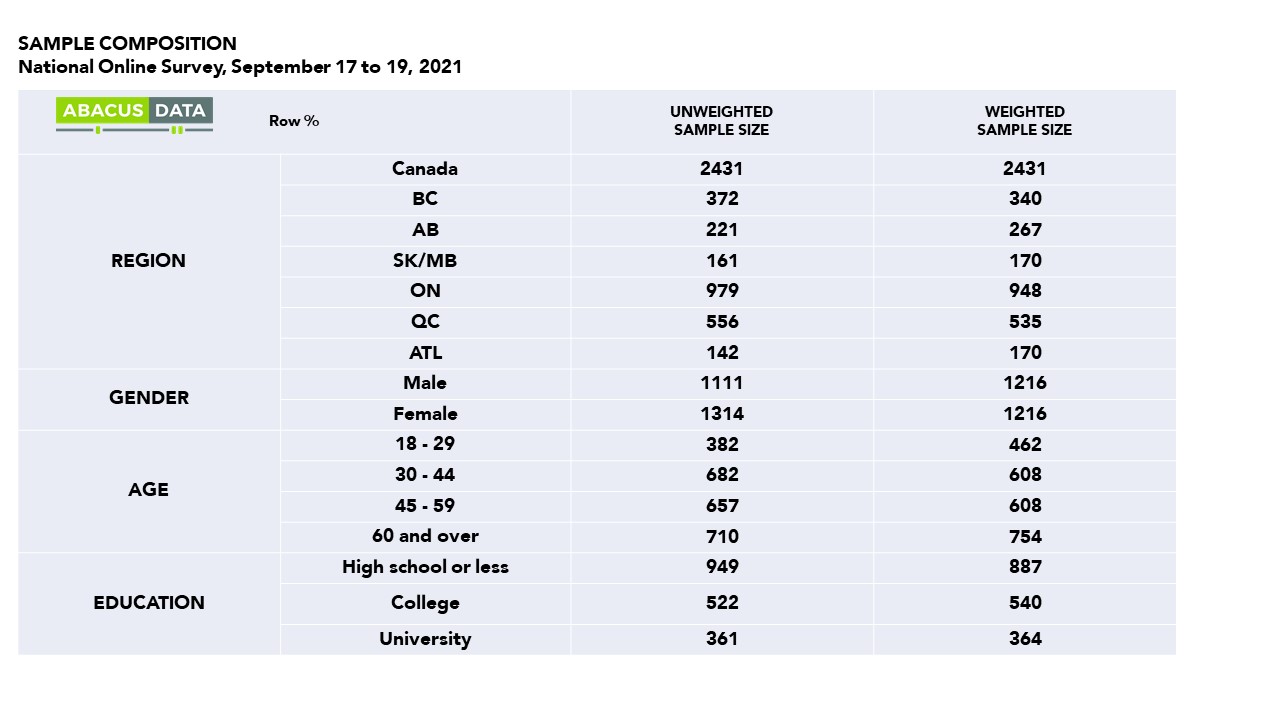
Earlier today we completed our final survey of Election 44, interviewing 2,431 Canadians eligible to vote from Friday to Sunday at 1:30pm ET. Here is our take on Canadian public opinion as polling stations are set to open tomorrow morning.
THE MOOD OF THE COUNTRY & THE DESIRE FOR CHANGE
Just before the election was called, 46% of Canadians felt the country was headed in the right direction compared with 40% who thought it was off on the right track.
Today, the mood has become more negative with 39% who think it’s headed in the right direction (down 7) and 48% who feel it’s off on the wrong track (up 8)
Regionally, Albertans (58%) are the most likely to feel things are off on the wrong track while views are fairly consistent in other provinces: BC (38%), ON (41%), Quebec (40%).
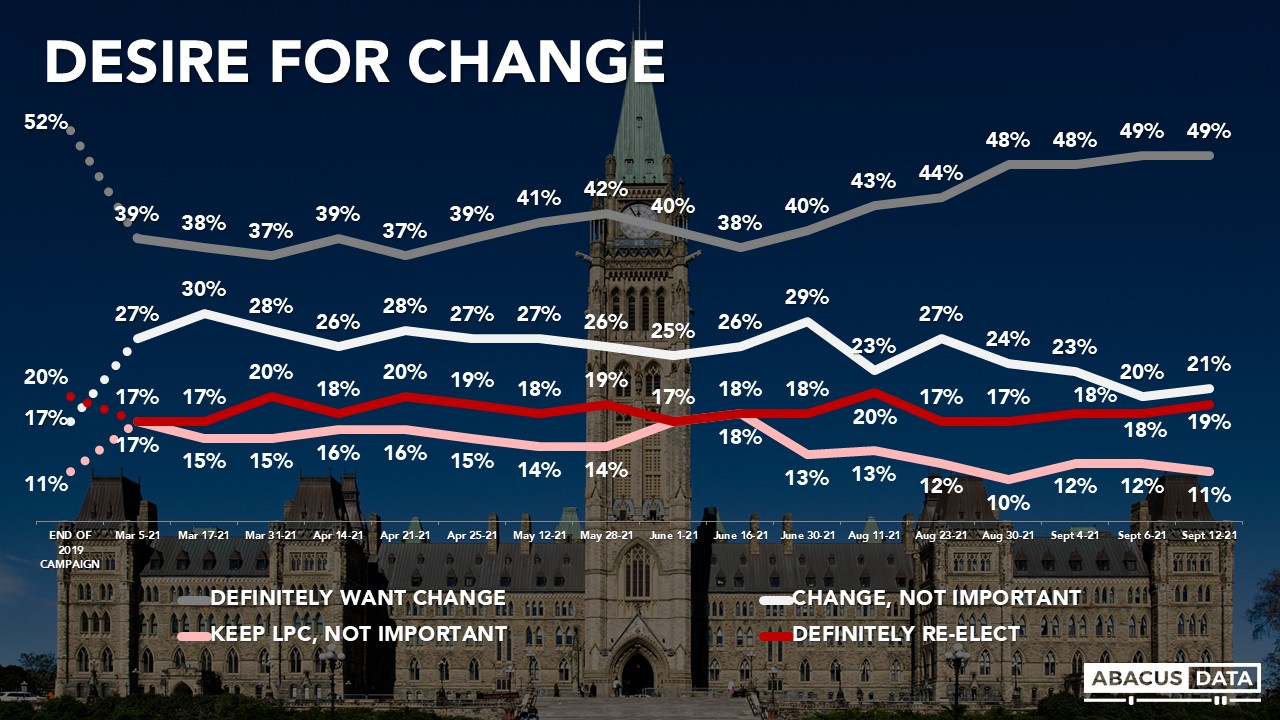
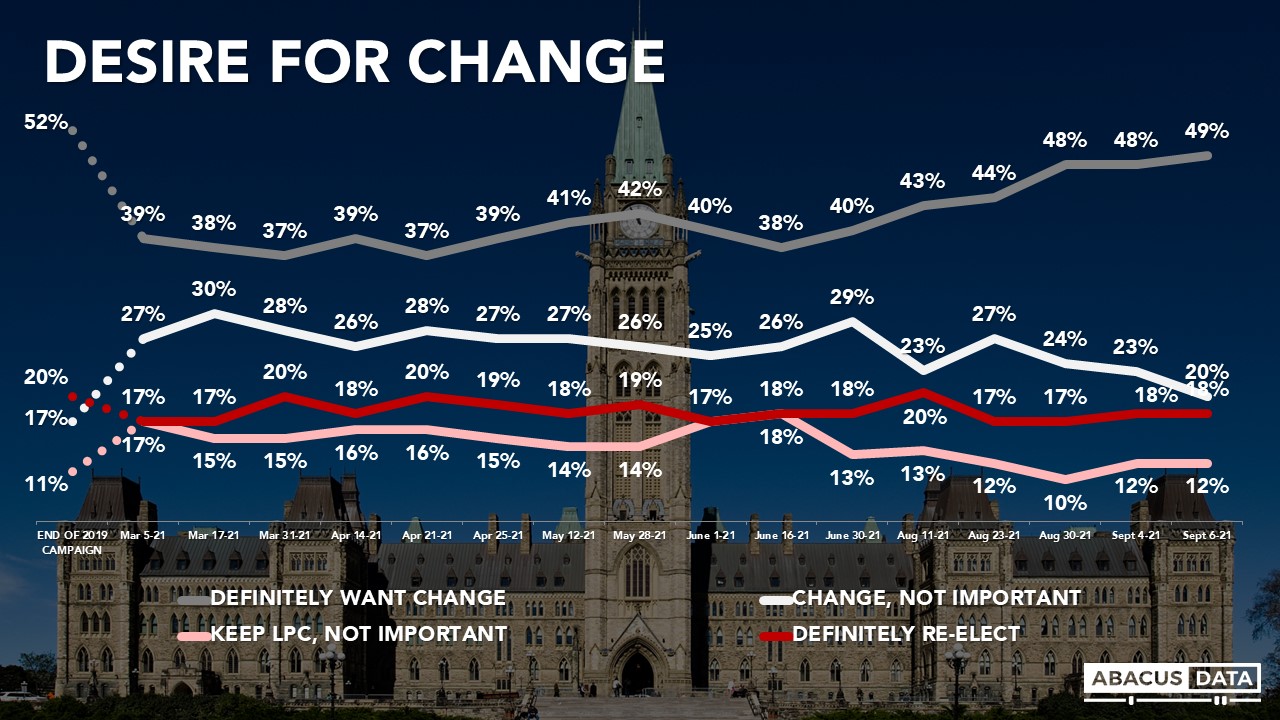
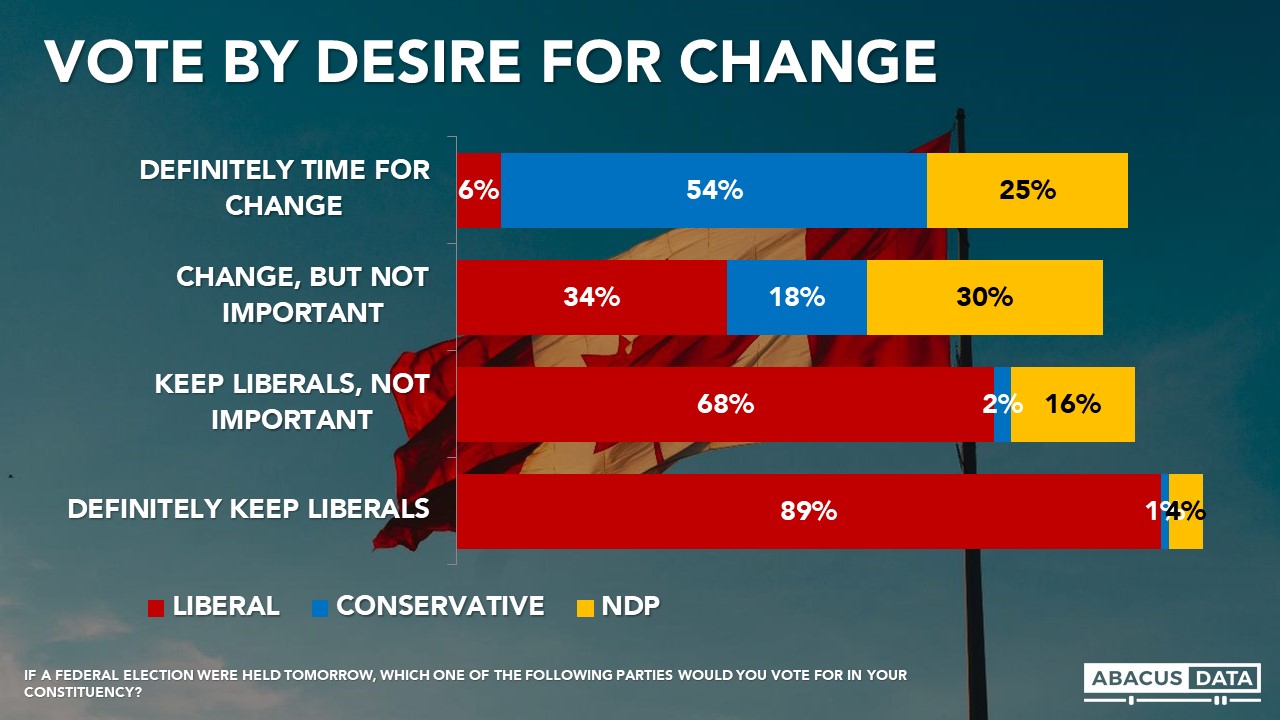
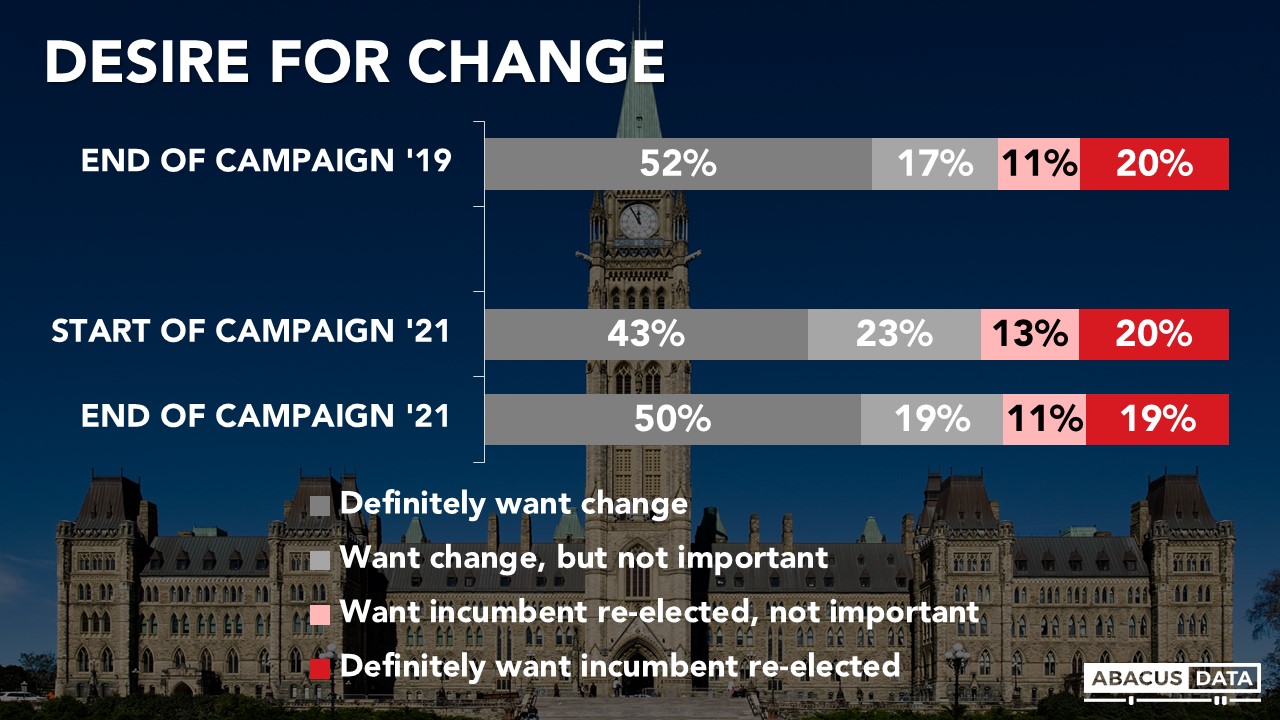
When asked whether they want to see a change in government or see the Liberals re-elected, 50% definitely want a change in government, 19% want a change but say it’s not important, 11% want the Liberals re-elected but say it isn’t important while 19% definitely want to see the Liberals re-elected. Since the start of the campaign, the more intense desire for change is up 7-points while those definitely wanting to see the Liberals re-elected is holding pretty steady.
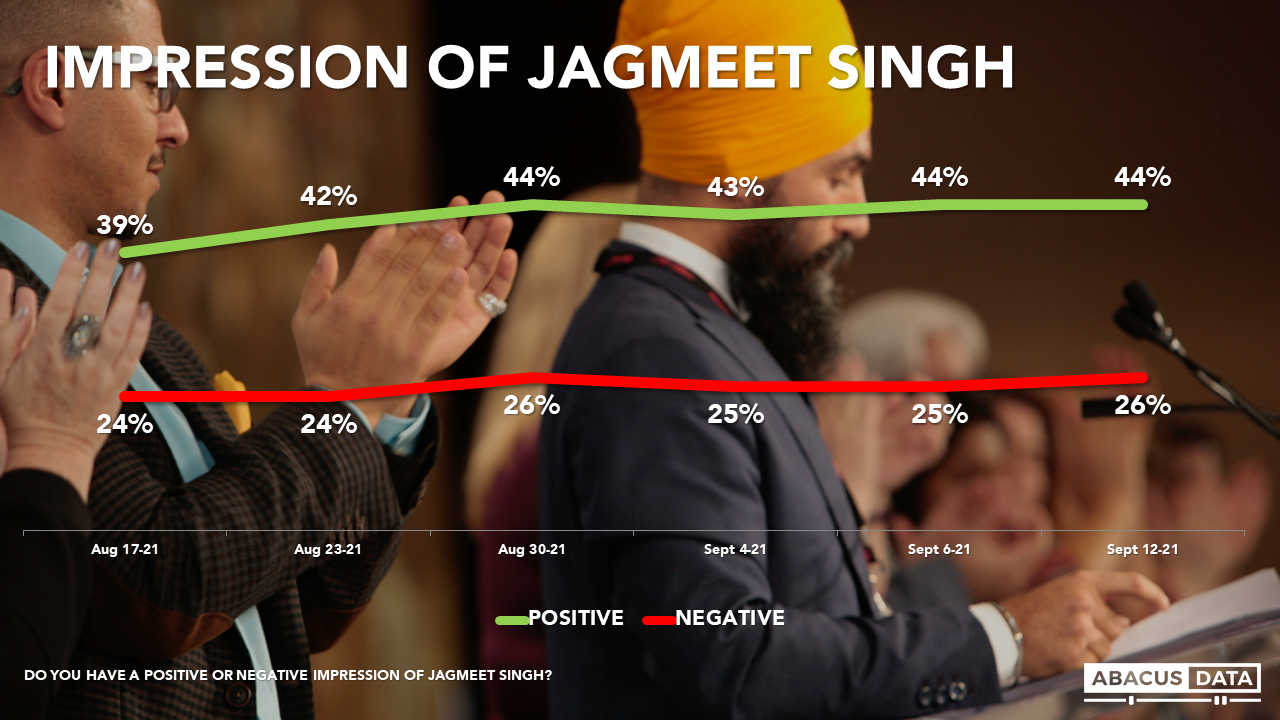
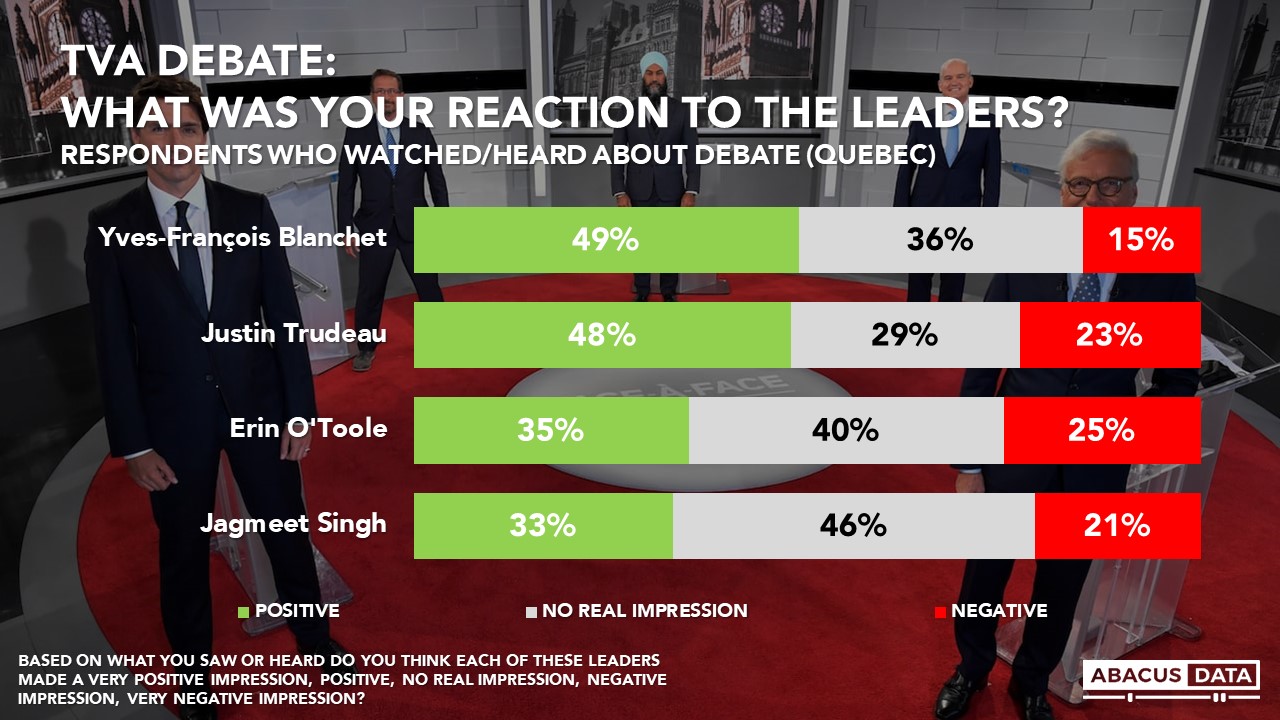
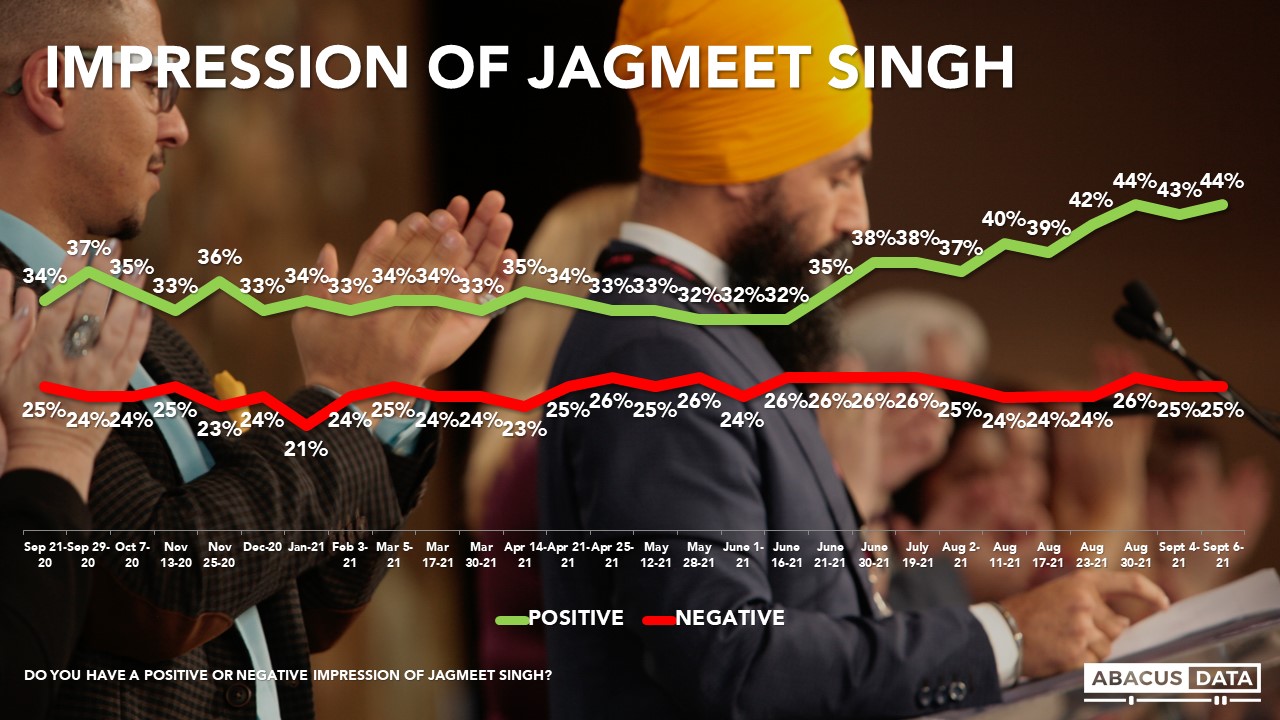
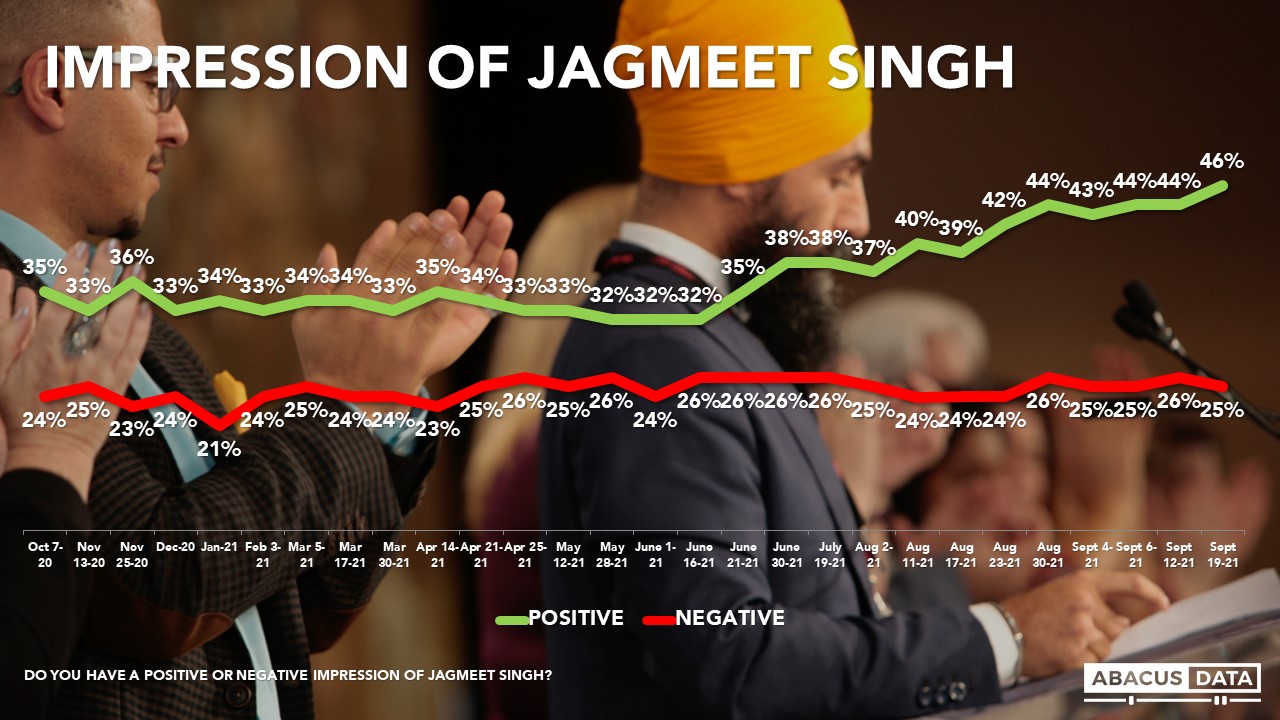
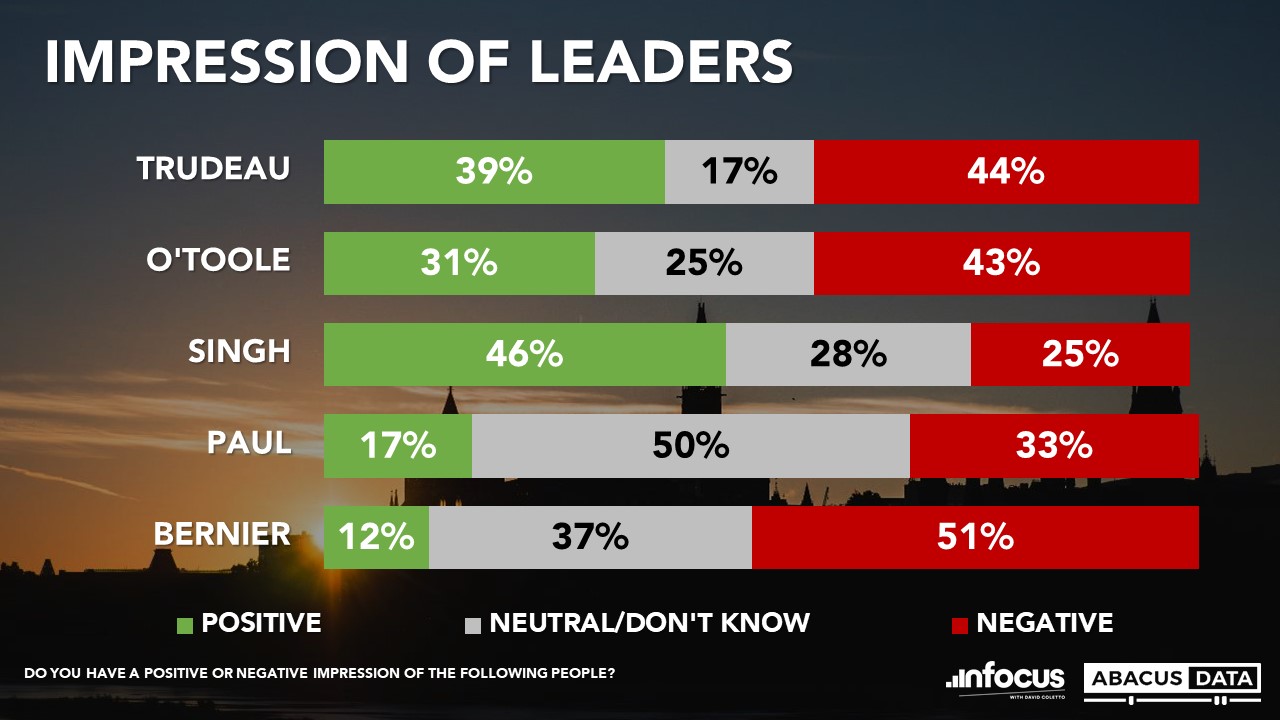
LEADERS: SINGH ENDS CAMPAIGN WITH THE BEST IMAGE
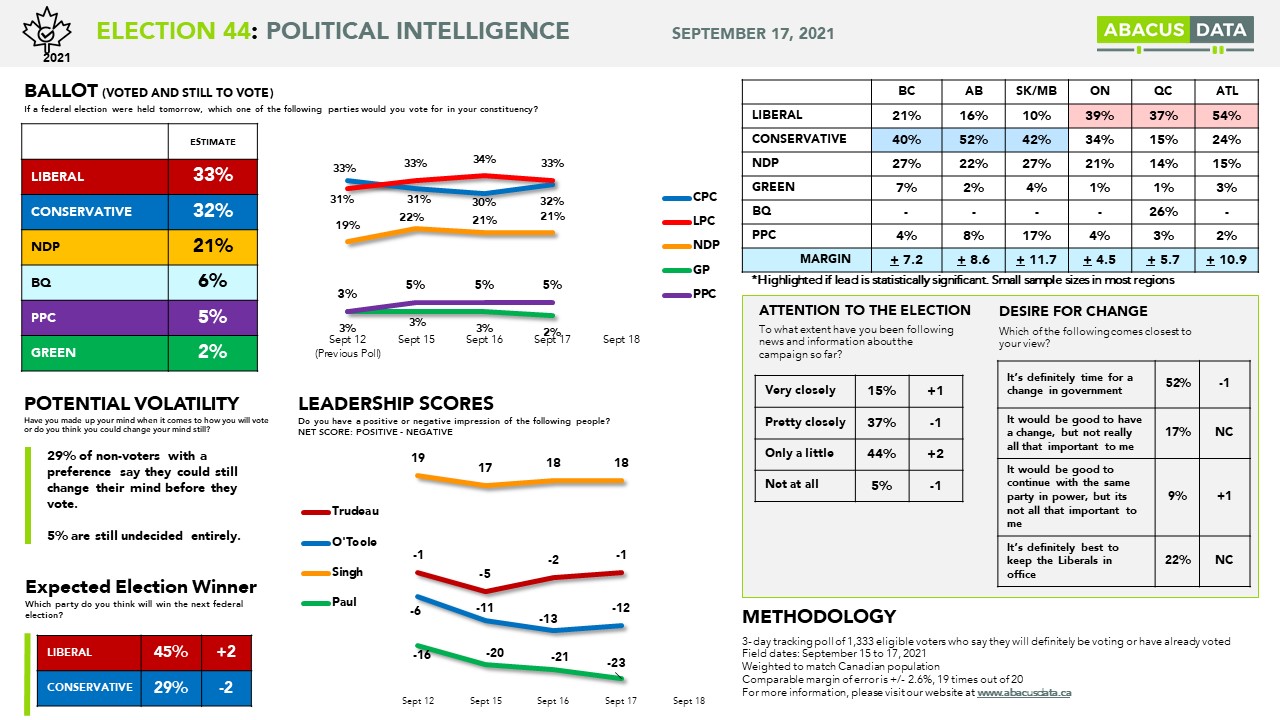
NDP Leader Jagmeet Singh ends the campaign with the most favourable image: 46% positive and 25% negative for a net score of +21. Mr. Singh’s personal image hasn’t changed much over the campaign but he does end the campaign with higher positives than when the campaign started. Regionally, Mr. Singh’s net score is +26 in BC, +12 in Alberta, +29 in Ontario, and +2 in Quebec.
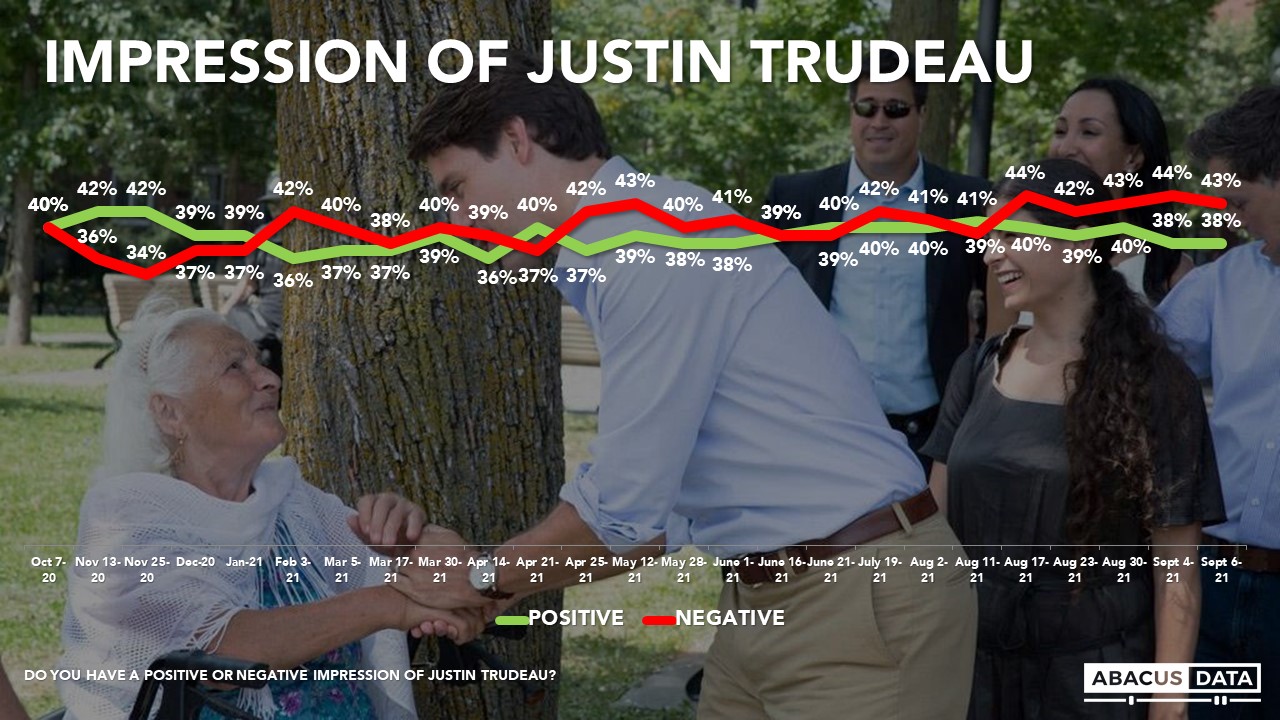
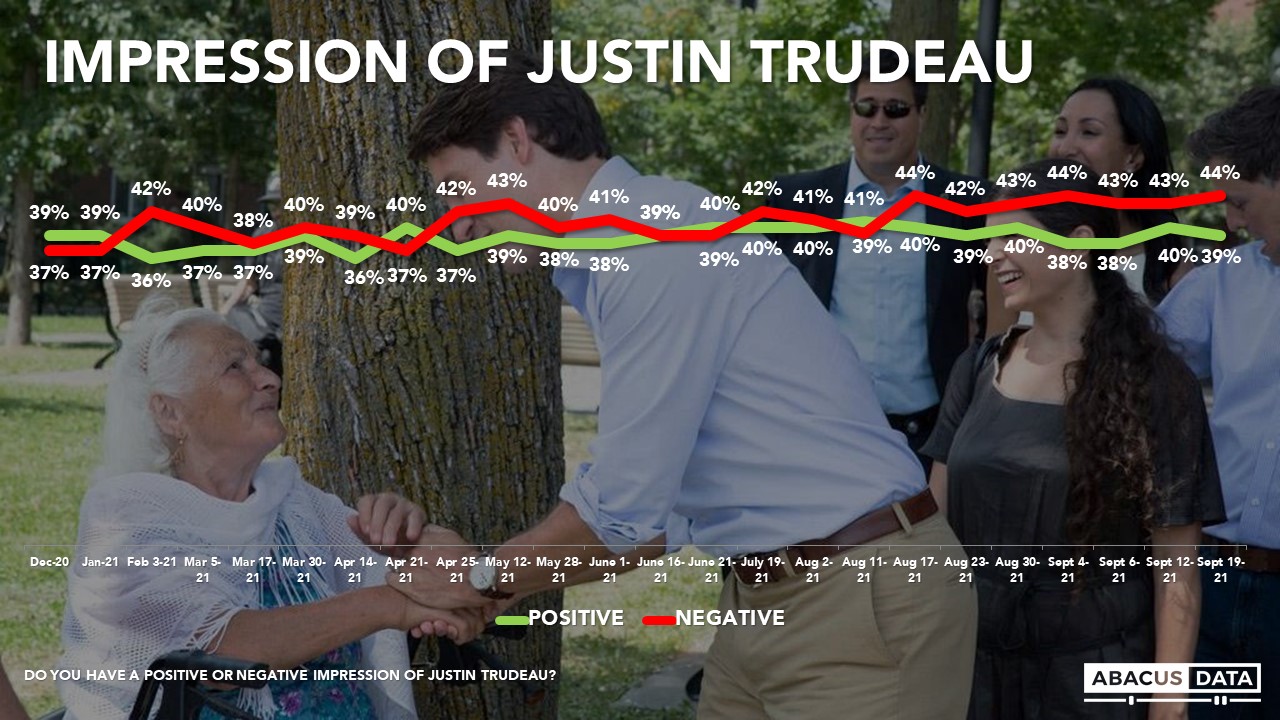
Mr. Trudeau’s personal numbers have also stayed relatively stable over the campaign. 39% have a positive view of Mr. Trudeau compared with 44% who have a negative view for a net score of -5. Regionally, Mr. Trudeau’s net score is -7 in BC, +2 in Ontario, and -1 in Quebec.
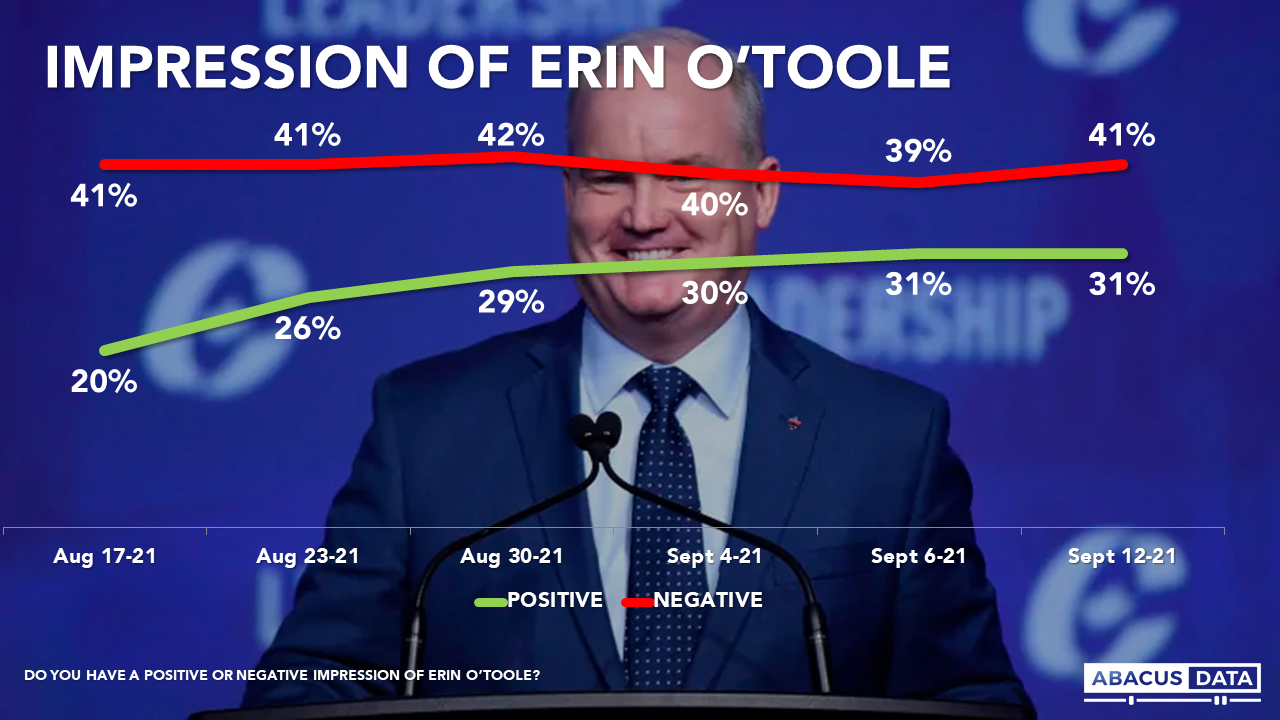
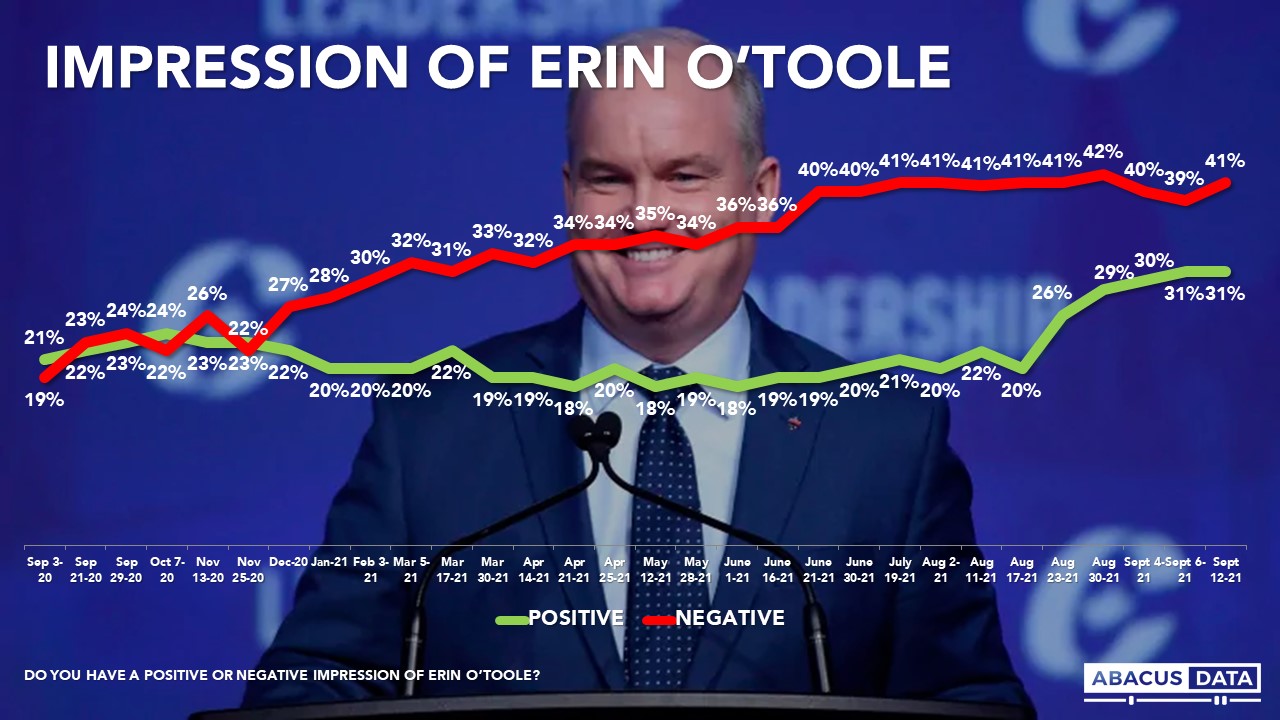
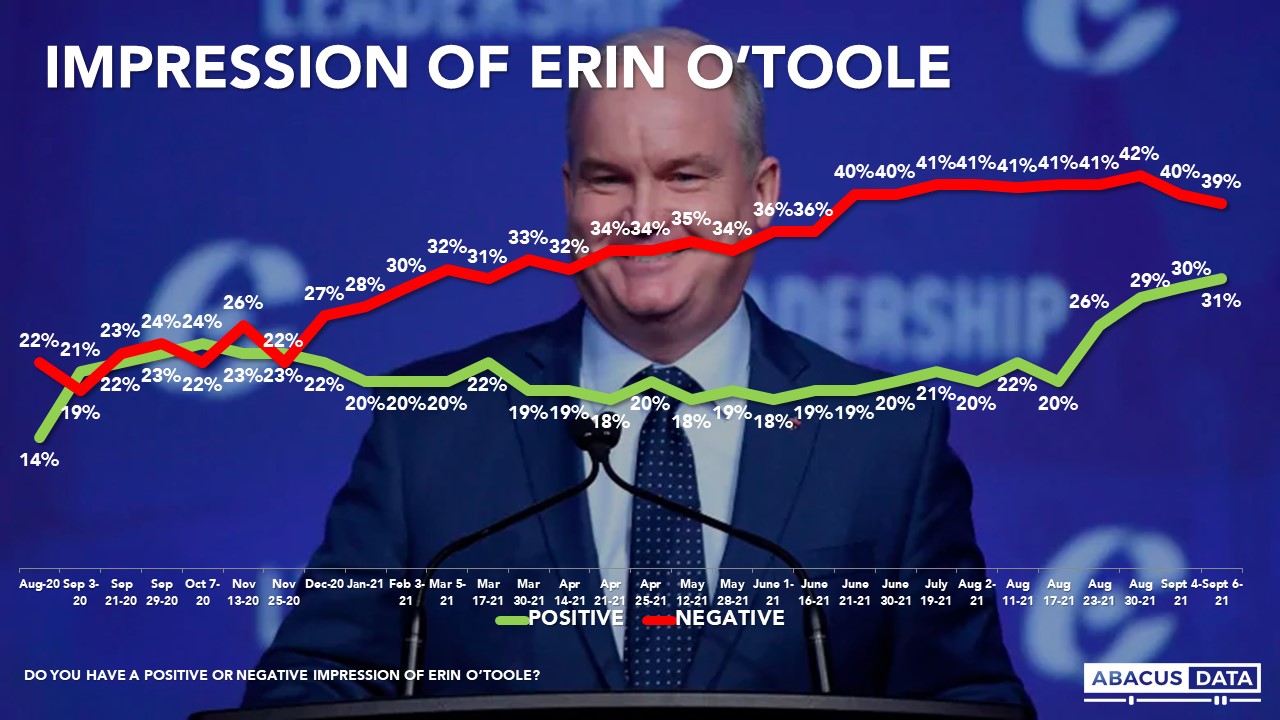
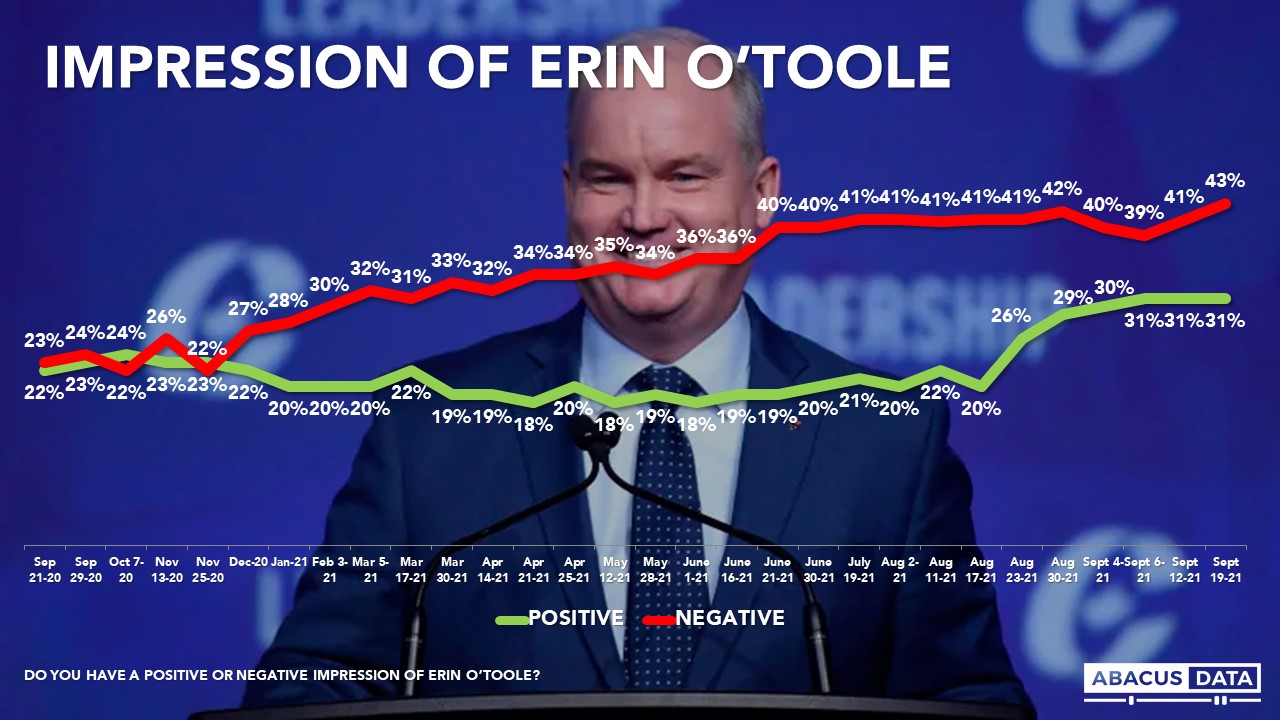
Mr. O’Toole’s positives improved in the early weeks of the campaign but plateaued in the final weeks. 31% have a positive impression of the Conservative leader while 44% view him negatively for a net score of -13. Regionally, Mr. O’Toole’s net score is -12 in BC, +10 in AB, -15 in Ontario and -16 in Quebec.
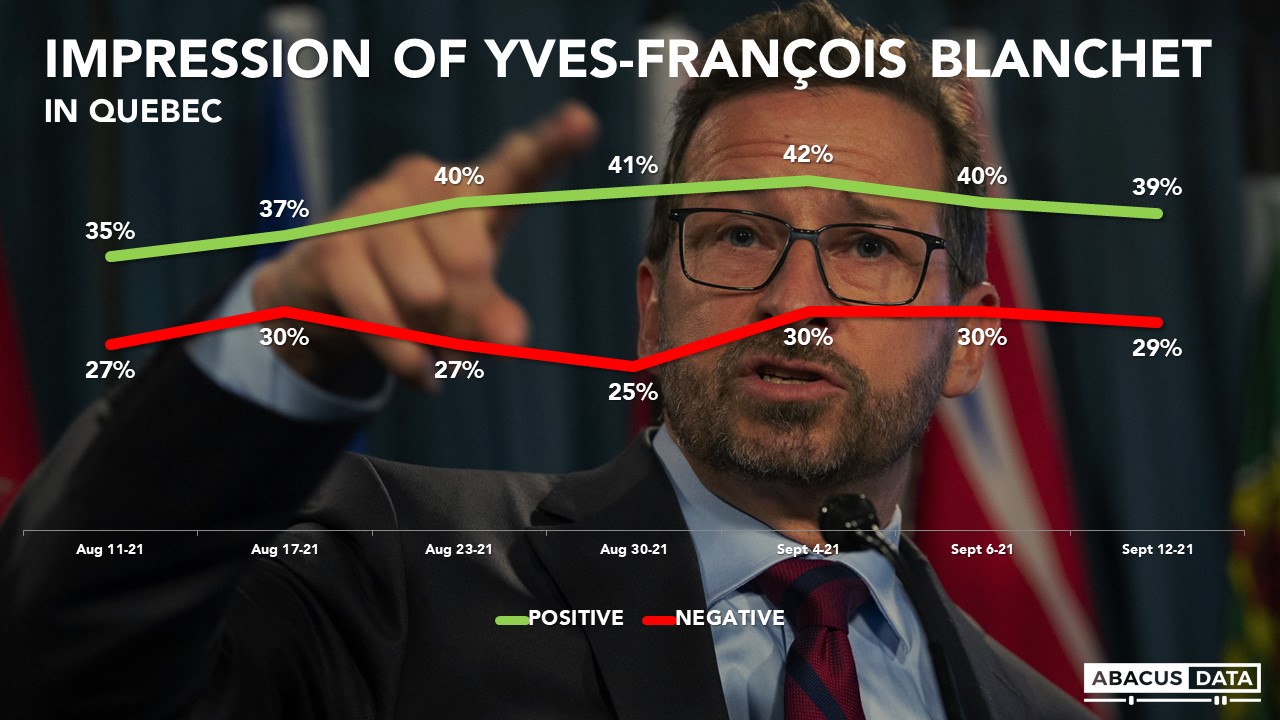
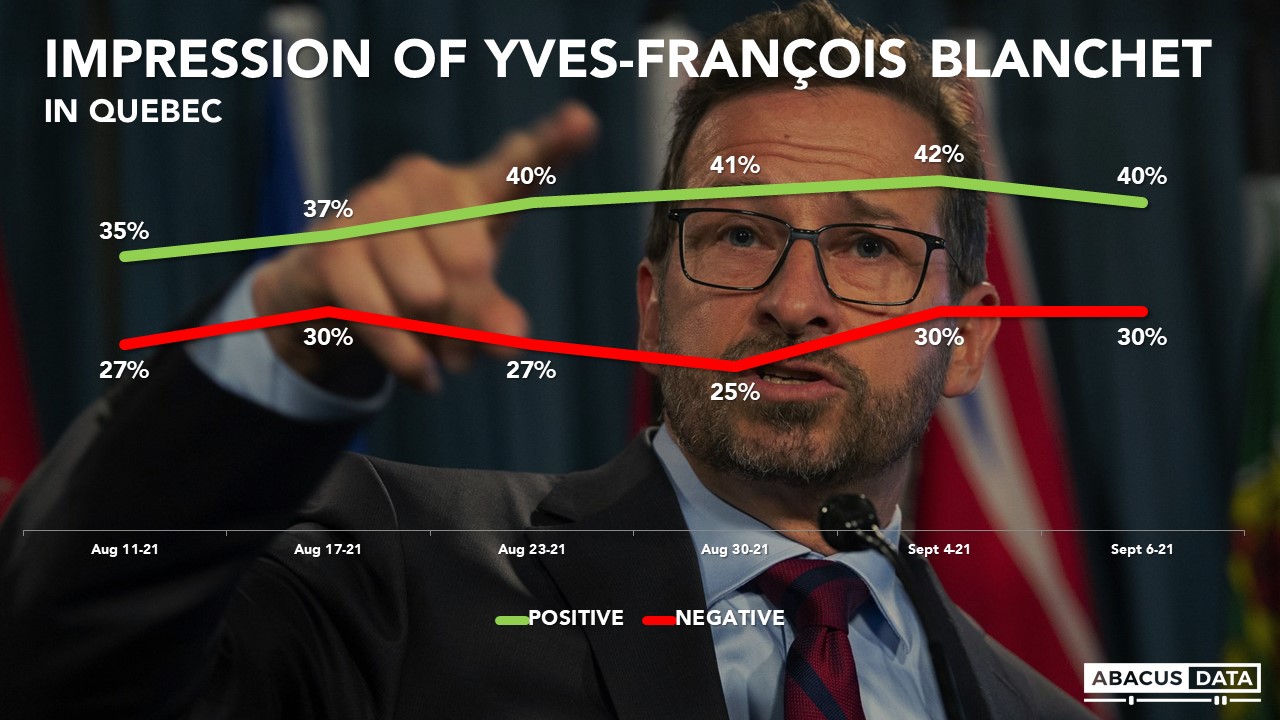
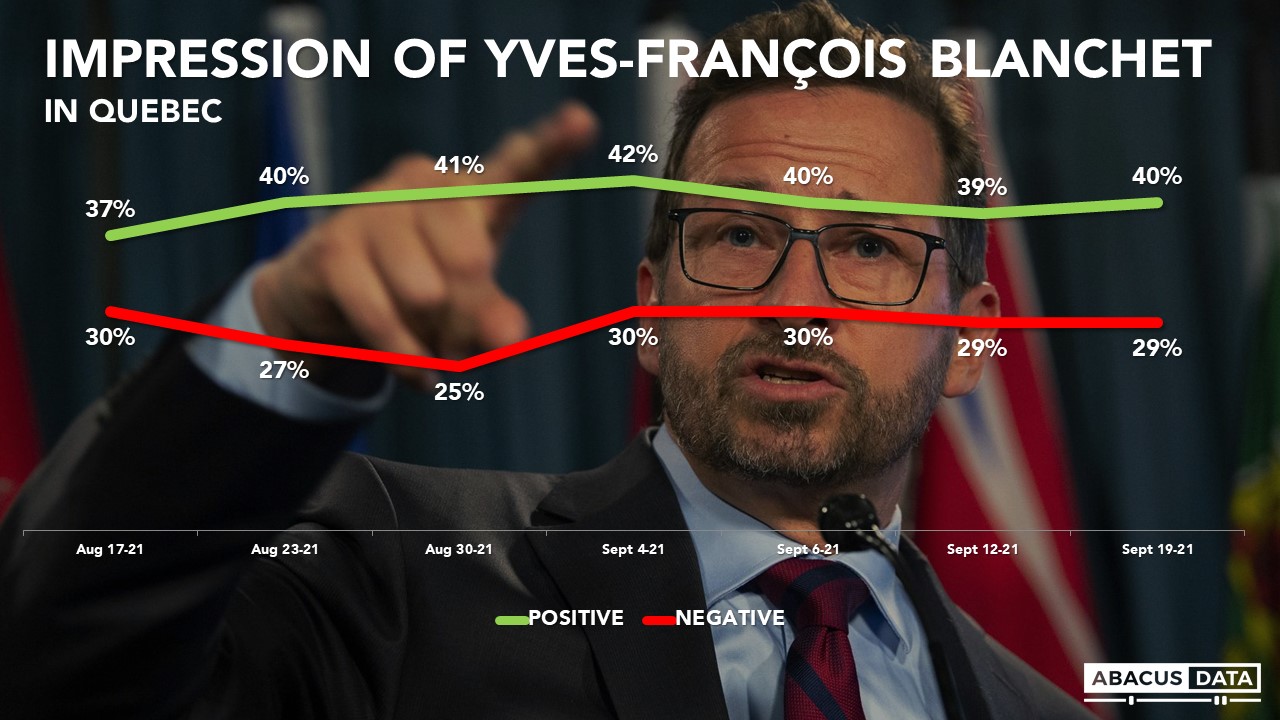
In Quebec, Mr. Blanchet is viewed quite positively. 40% have a positive impression with 29% negative for a positive image of +11. This is largely unchanged since the start of the campaign.
Maxime Bernier remains the most unpopular leader in federal politics, by a wide margin. 12% have a positive impression of him compared with 51% who have a negative view for a net score of -39.
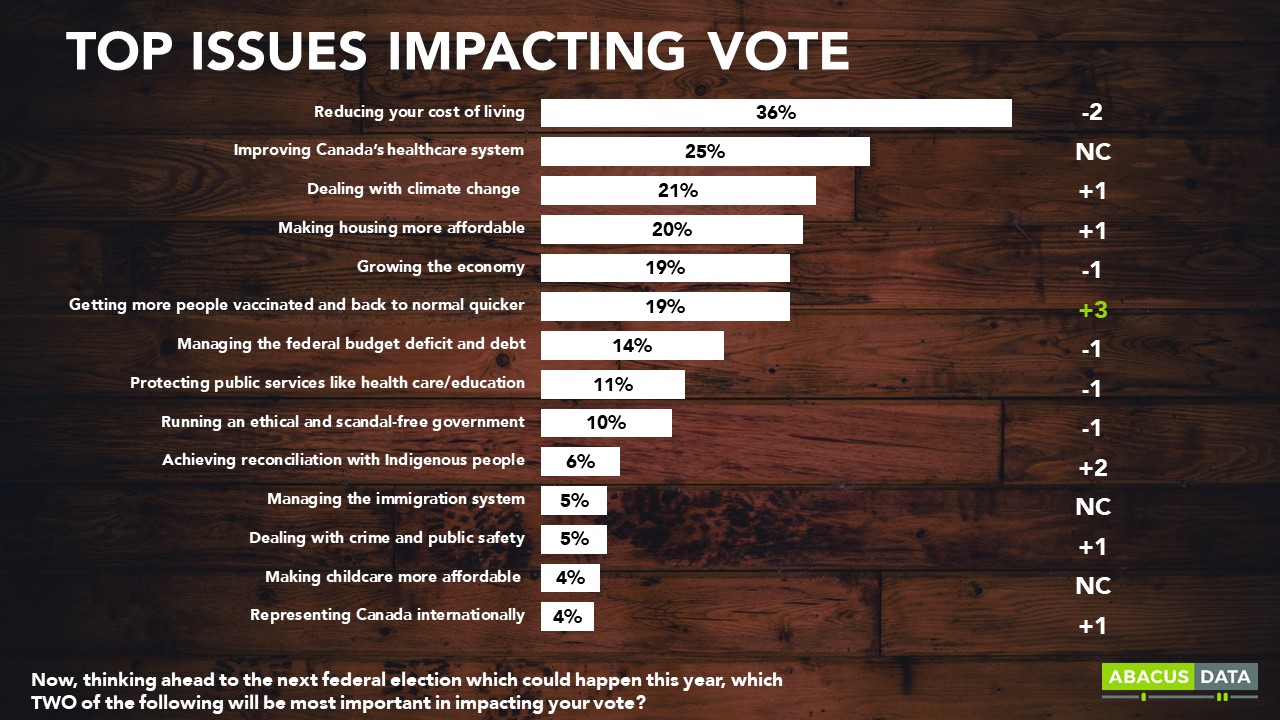
THE ISSUES
When we ask respondents to pick the top 2 issues that will determine their vote, the top most frequently chosen are reducing the cost of living (36%), improving Canada’s healthcare system (25%), dealing with climate change (21%), making housing more affordable (20%), and growing the economy (19%).
1 in 5 ranks “getting more people vaccinated and getting the country back to normal quicker”, up 3-points since the start of the campaign.
Today, 41% of eligible voters say they have become more worried about the pandemic over the past few days. This view is higher in Alberta (59%) and lower in Ontario (36%).
Housing affordability is a top issue for 26% of those under 45 compared with 16% for older respondents. Older respondents are more likely to rate “getting more people vaccinated” as a top issue than younger respondents (24% vs. 13%).
For Liberal voters, the top 5 issues are reducing the cost of living (32%), improving healthcare (29%), getting more people vaccinated (27%), dealing with climate change (26%), and growing the economy (19%). Only 7% rate managing the federal budget deficit in their top 5 issues.
For Conservative voters, the top 5 issues are reducing the cost of living (36%), managing the federal budget deficit (32%), growing the economy (31%), improving the healthcare system (22%), and running an ethical and scandal-free government (16%). Only 8% rate climate change as a top issue.
For NDP voters, the top 5 issues are reducing the cost of living (40%), making housing more affordable (29%), dealing with climate change (29%), improving the healthcare system (25%), and getting more people vaccinated (18%). 11% of NDP supporters rank reconciliation with Indigenous people as a top issue – the highest of any party supporters.
For People’s Party voters, the top 5 issues are reducing the cost of living (45%), making housing more affordable (28%), growing the economy (27%), running an ethical and scandal-free government (20%), managing the federal budget deficit (11%). Only 5% say getting more people vaccinated is a top issue – the lowest of any party’s supporters.
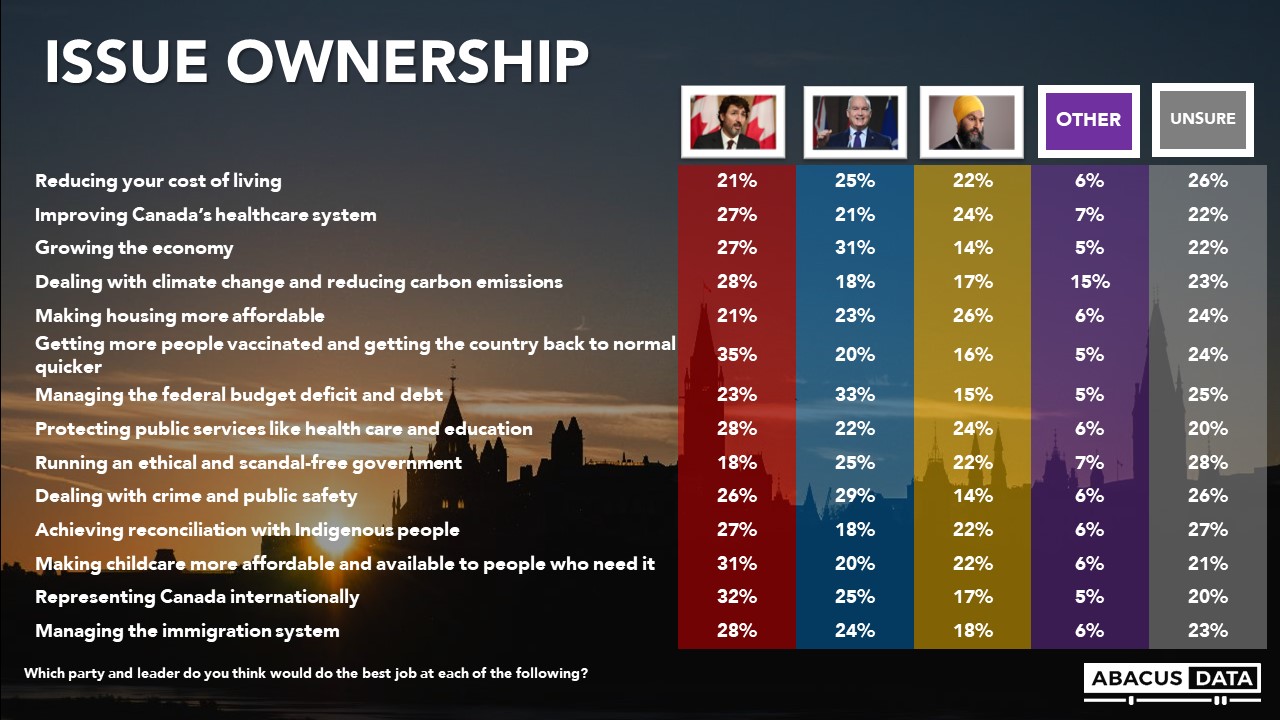
When asked which party and leader is best on each issue, the Liberals lead on “getting more people vaccinated and getting the country back to normal quicker”, “representing Canada internationally”, “making childcare more affordable”, “achieving reconciliation with Indigenous people”, and “dealing with climate change”.
The Conservatives lead on “growing the economy”, “managing the budget deficit”, and “dealing with crime and public safety.”
The NDP doesn’t lead on any policy area but is competitive with the other parties on “improving healthcare”, “making housing more affordable” and “protecting public services.”
On the issue most people cite as important to their vote – the cost of living – no party has a clear advantage.
AN UNNECESSARY ELECTION VS. THE PROSPECT OF A CONSERVATIVE GOVERNMENT
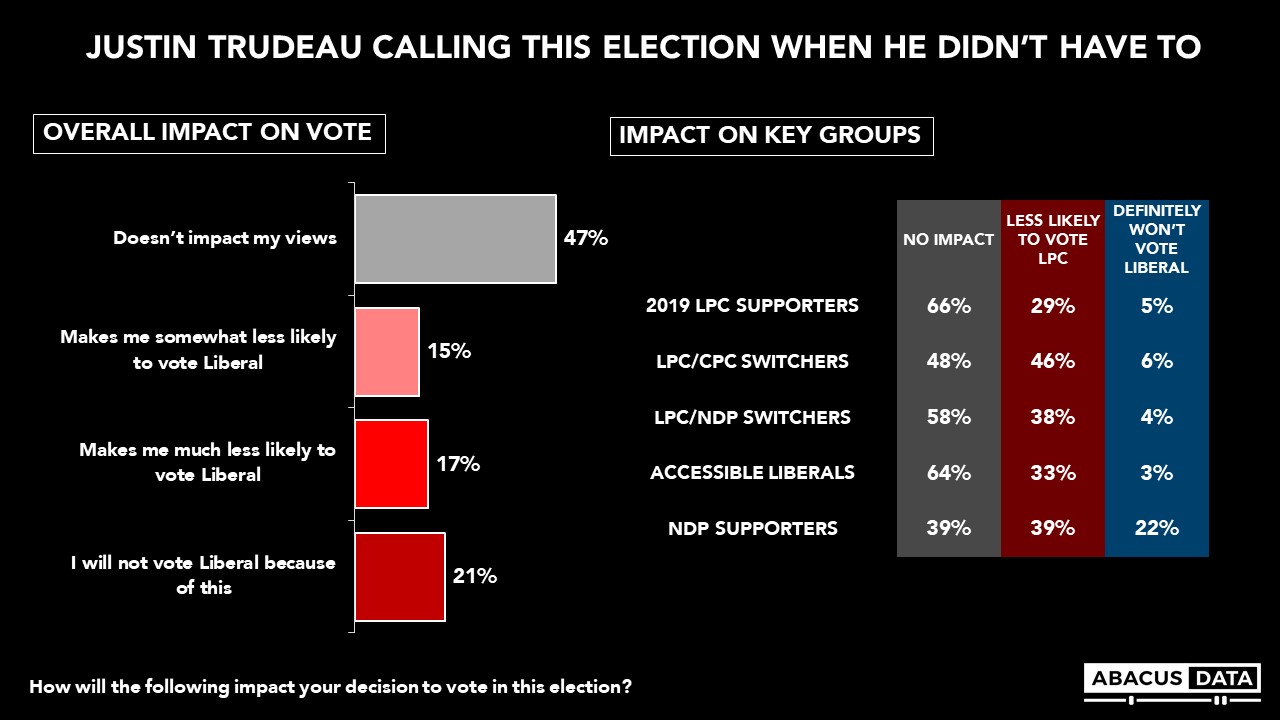
The election call itself continues to be a source of frustration for many eligible voters and has coloured their voting decision. More than half of eligible voters say that “Justin Trudeau calling the election when he didn’t have to” has made them less likely to vote Liberal. 21% say they will not vote Liberal because of this, 17% say they are much less likely to vote Liberal, while 15% say it makes them somewhat less likely to vote Liberal.
Among NDP supporters, 61% say they are less likely to vote Liberal because of the election call. Among those who voted Liberal in 2019, 34% say they are less likely to vote Liberal, including 5% who say they won’t vote Liberal because of this decision.
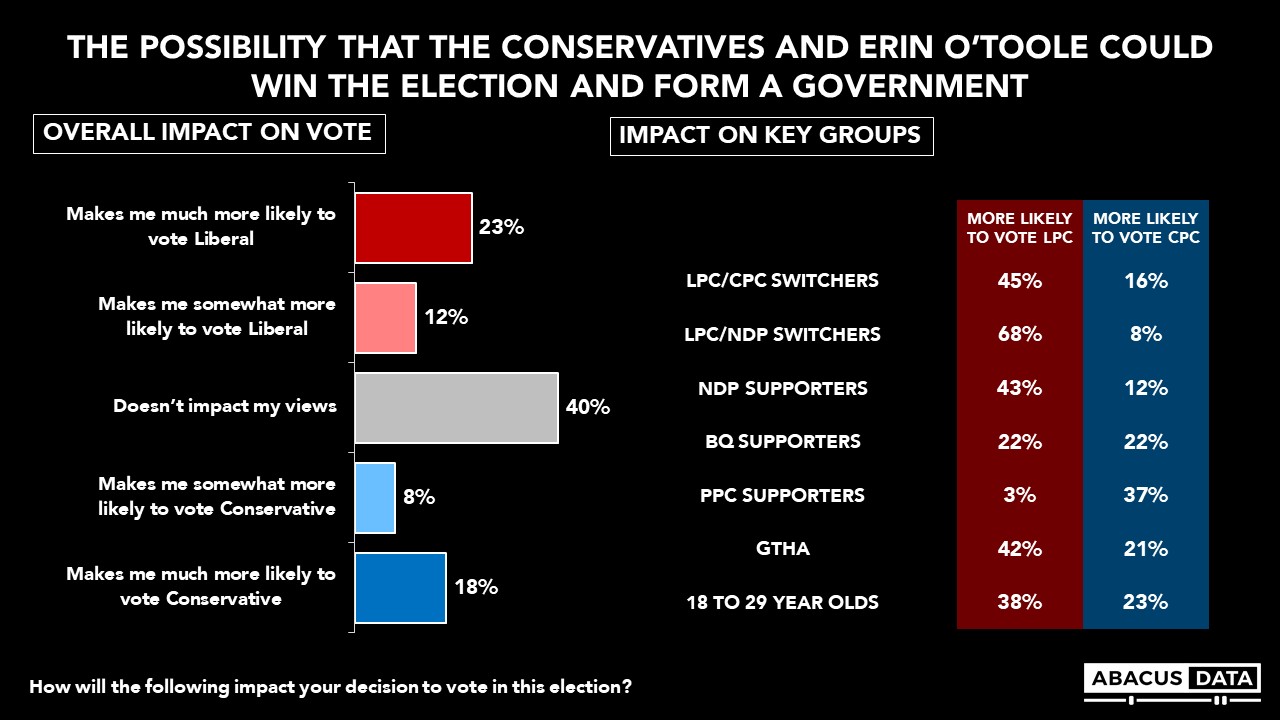
But a similar tension exists regarding the prospect of a Conservative win in the election. When we asked what impact the possibility that the Conservatives could win the election and form a government, 35% say they are more likely to vote Liberal, 25% say they are more likely to vote Conservative while 40% say it doesn’t impact their views or behaviour.
Among LPC/CPC switchers (those whose first or second choice is the Liberals or Conservatives), 45% are more likely to vote Liberal compared with 16% who are more likely to vote Conservative if there’s a possibility of a Conservative win. Among LPC/NDP switchers, 68% say they are more likely to vote Liberal while only 8% say they are more likely to vote Conservative.
So, on the one hand, the election call has likely hurt Liberal support while the prospect of a Conservative government has helped it. Depending on how voters tomorrow balance this tension could ultimately decide the election.
INTEREST AND ATTENTION TO THE ELECTION
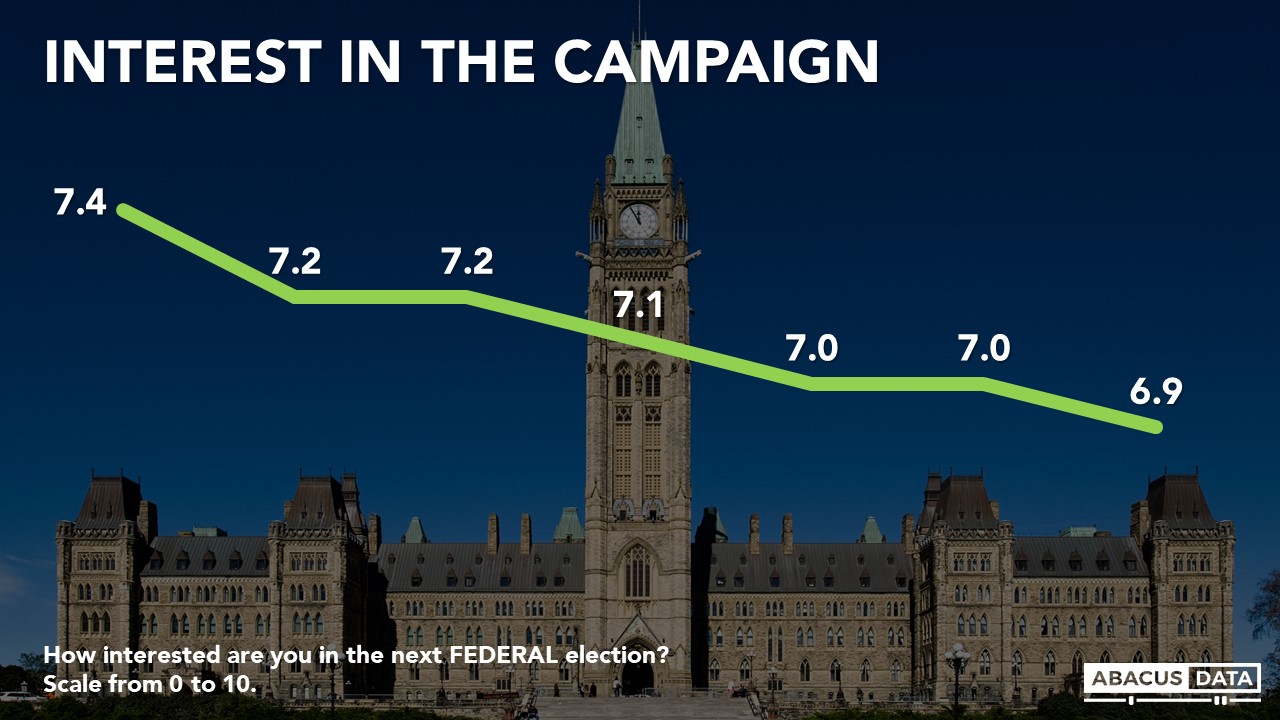
Over the course of the campaign, interest in the election has wanned from an average interest score of 7.4 when the campaign began to 6.9 today.
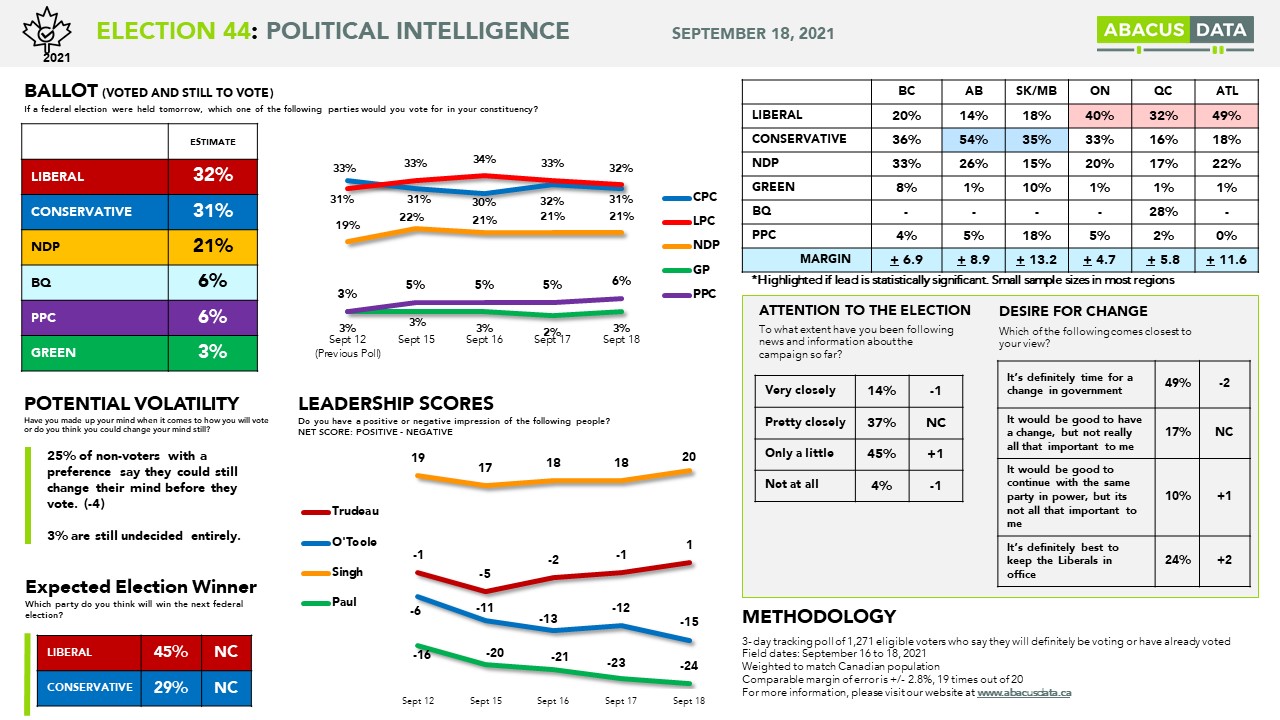
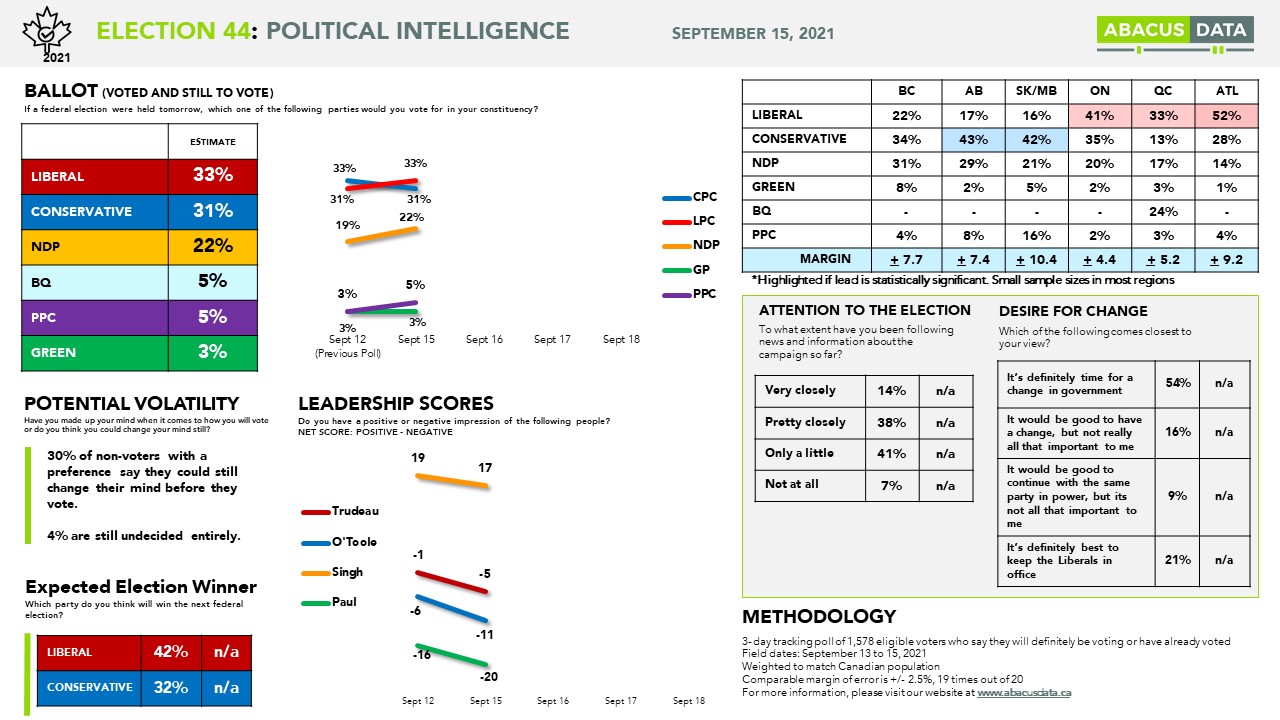
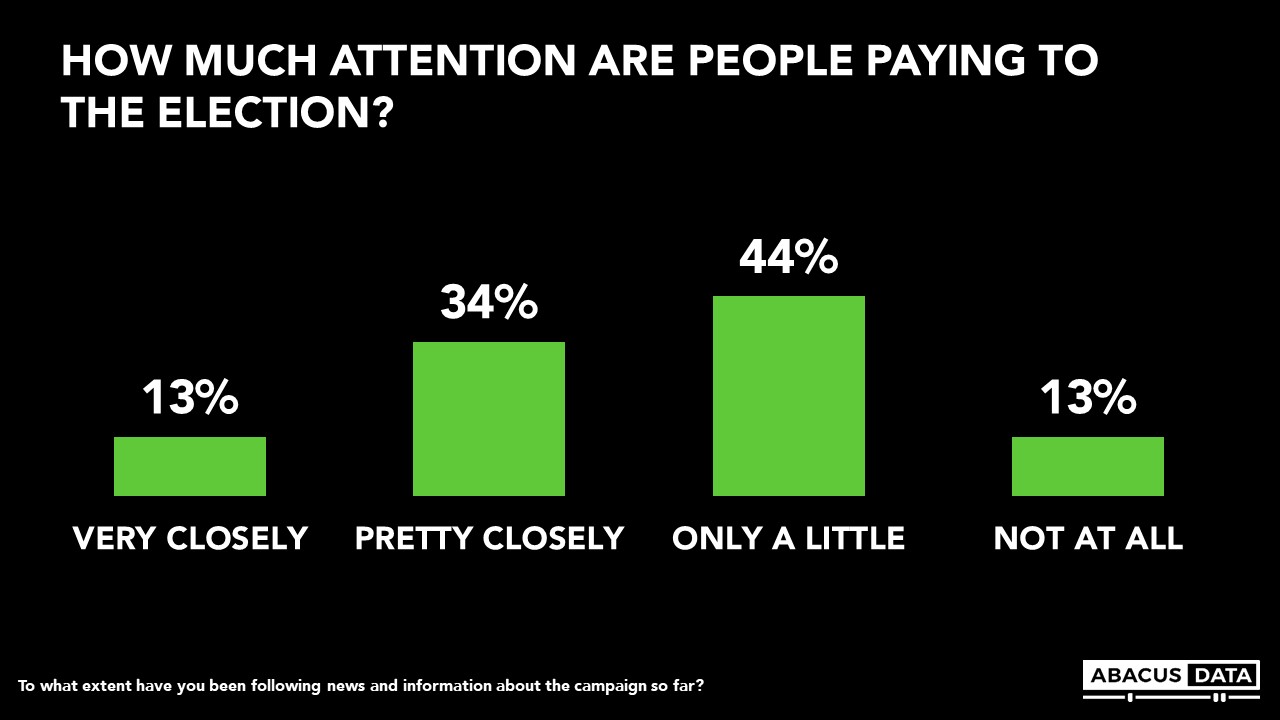
Similarly, when asked how much attention they are paying to the election, 13% say they are following it very closely, 33% pretty closely, 45% only a little, while 9% are not following it at all.
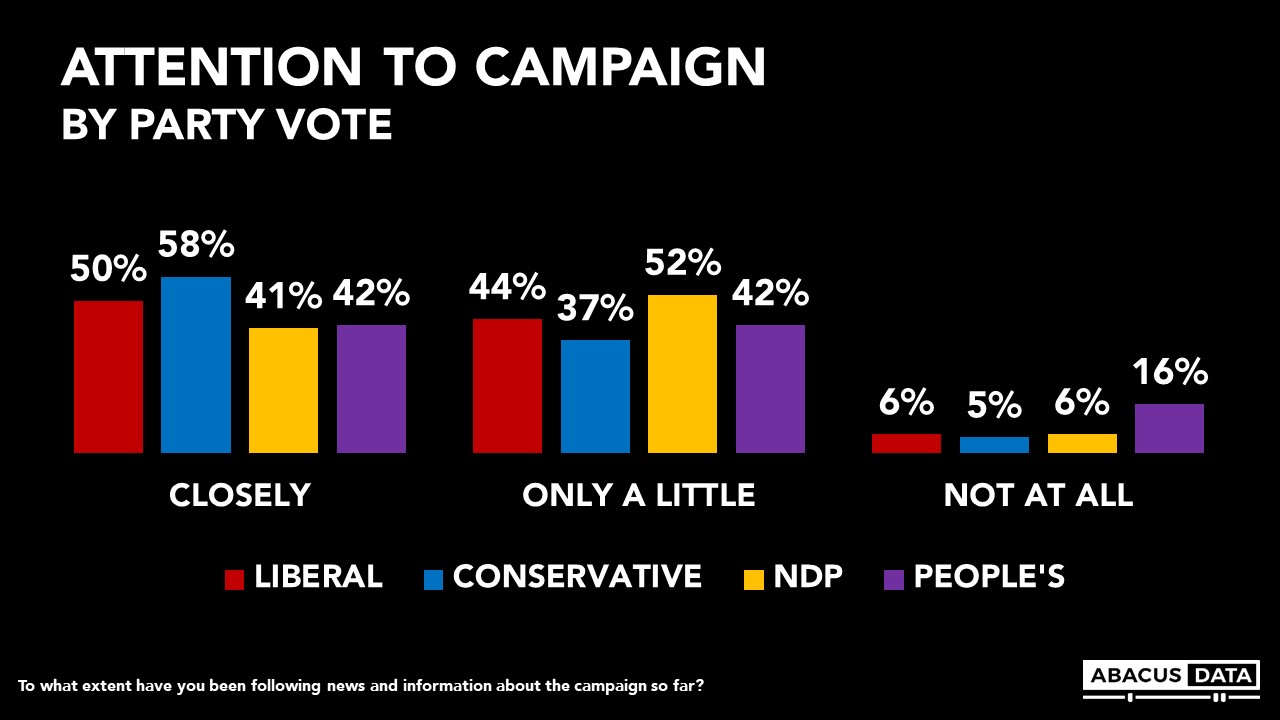
As a measure of engagement and possibility, a predictor of turnout tomorrow, 58% of Conservative supporters says they following the election closely, 8-points higher than Liberal supporters, and 17-points higher than NDP supporters. Only 42% of People Party supporters say they are following the election closely.
CANADIANS THINK THE RESULT WILL BE CLOSE & MORE THINK LIBERALS WILL WIN
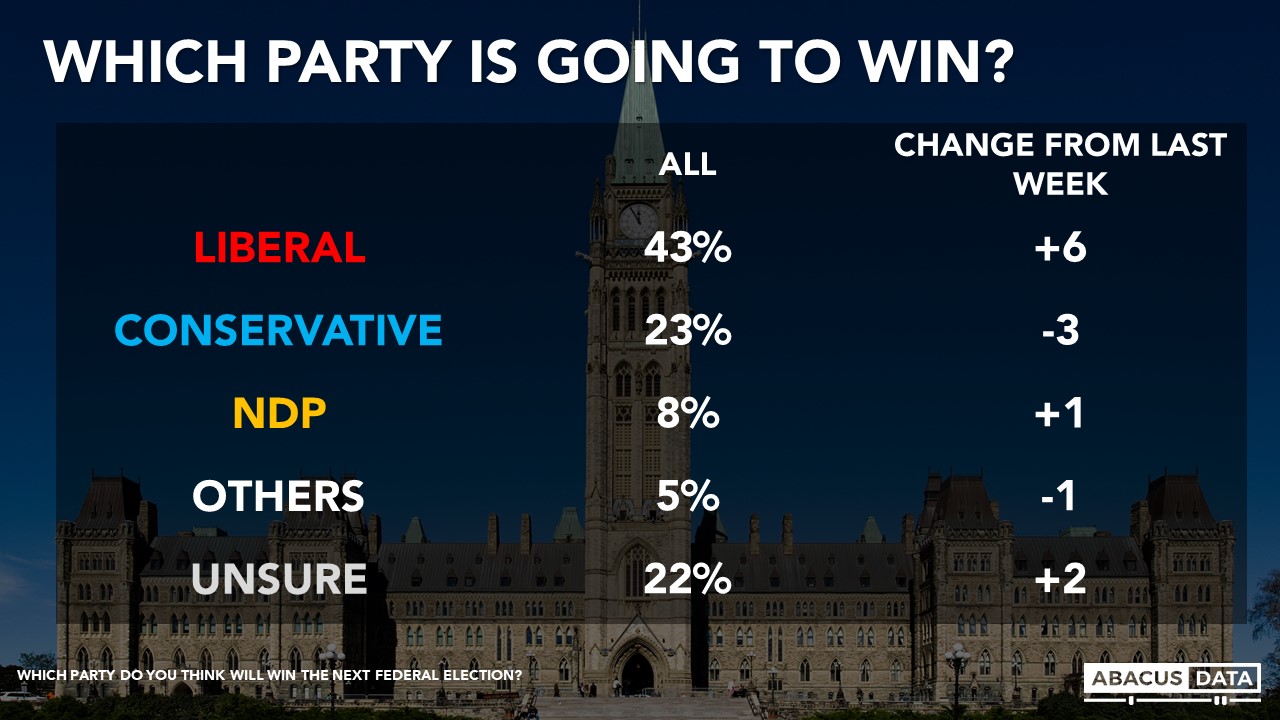
Most Canadians believe the election result will be close (78%) while 10% think one party will win by quite a bit.
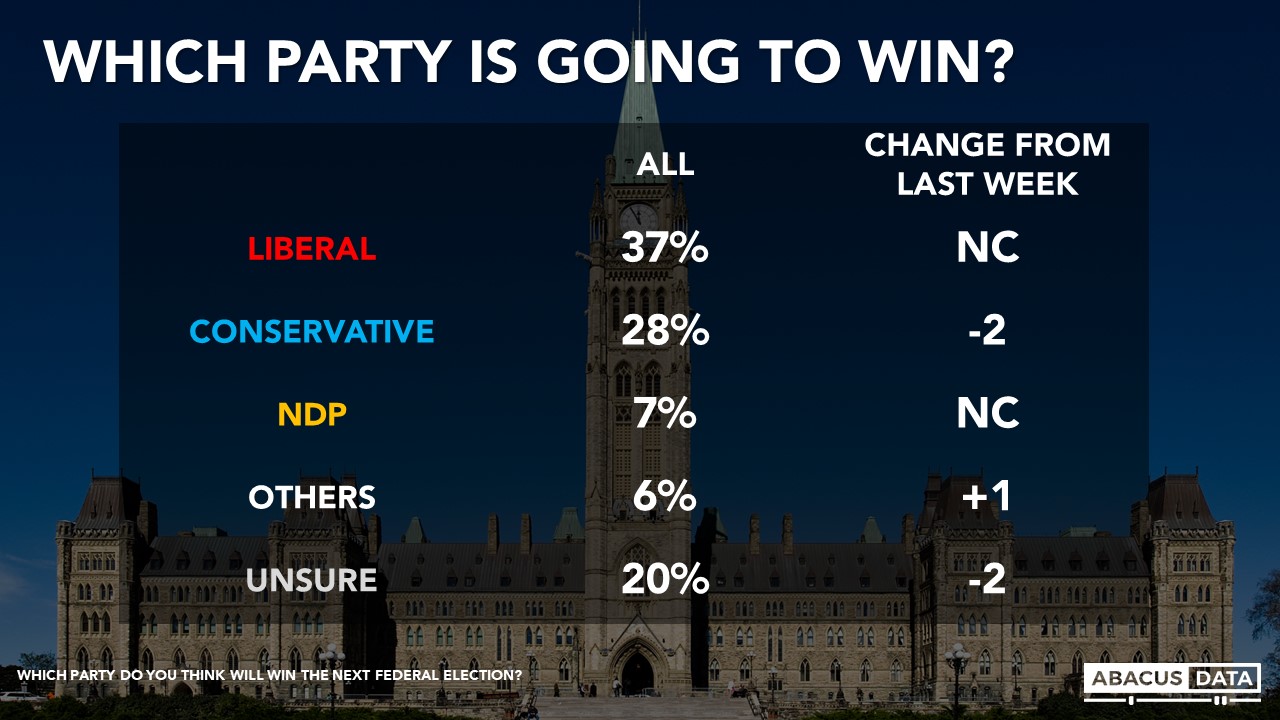
When asked which party will win tomorrow, 43% of eligible voters think the Liberals will win (up 6 since last week), 23% think the Conservatives will win (down 3) while 22% are unsure.
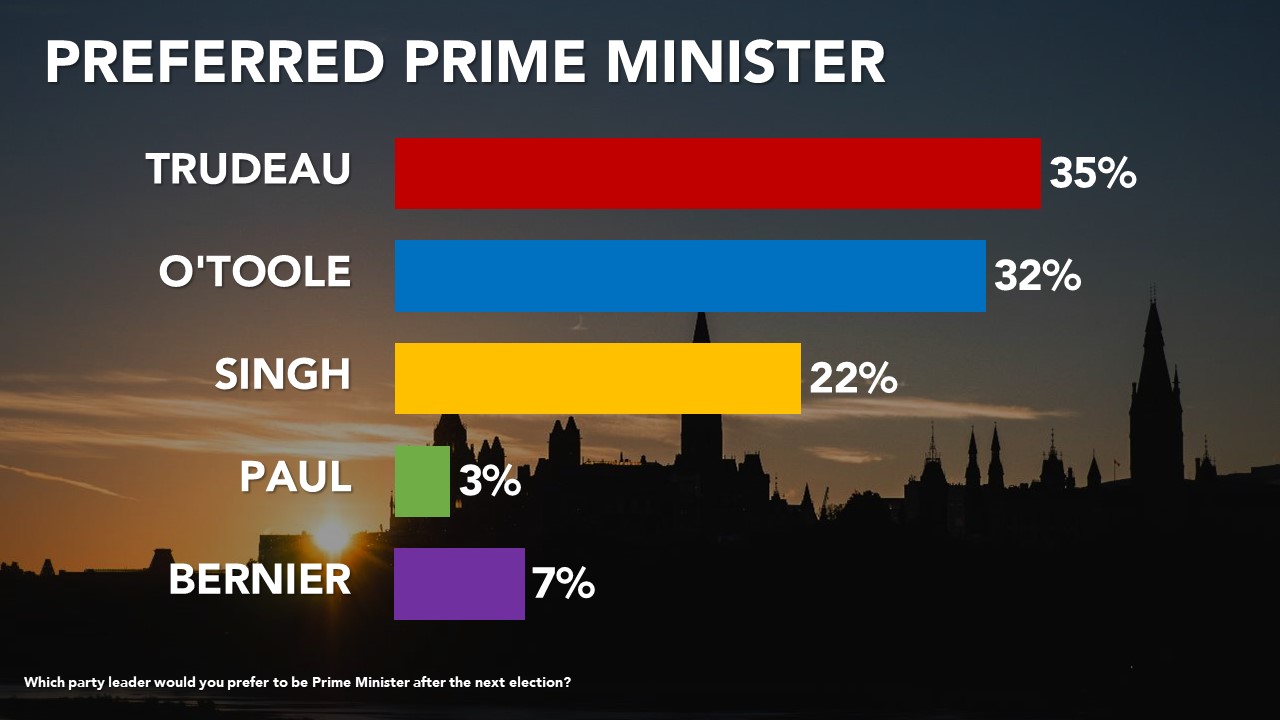
PREFERRED PM: TRUDEAU LEADS MR. O’TOOLE BY 3
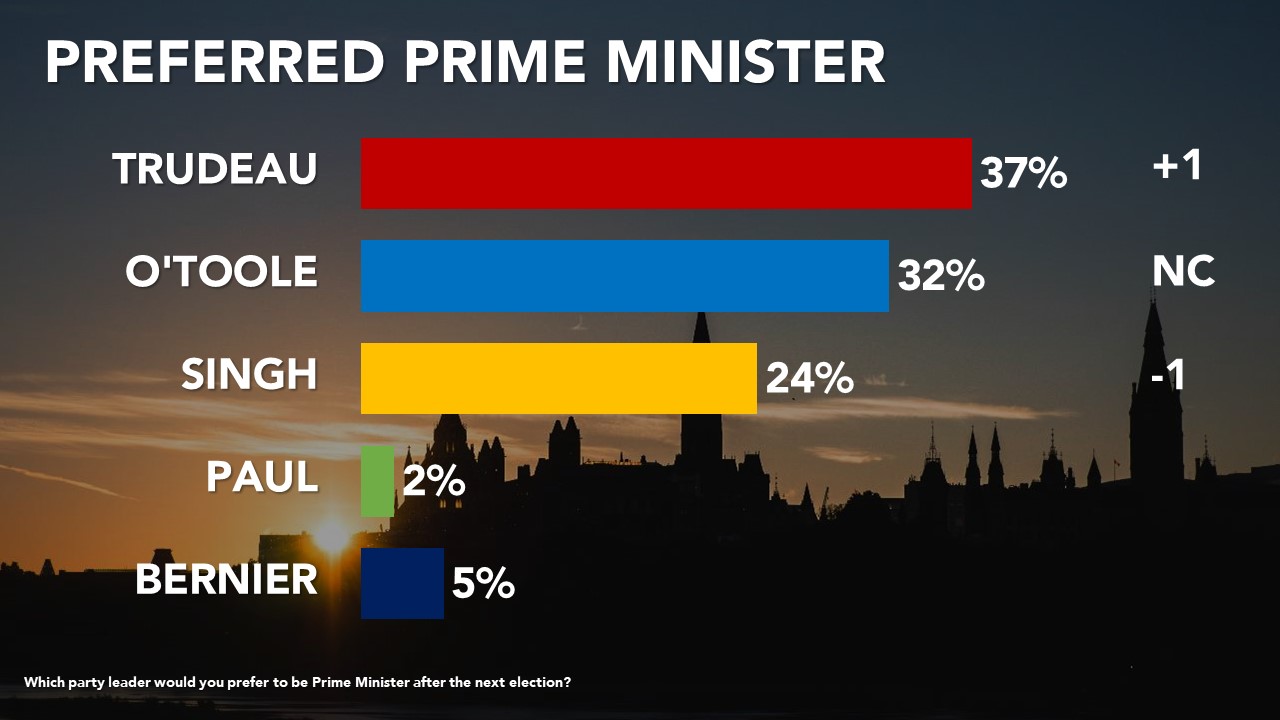
When asked who they would prefer to be PM after the election, 35% picked Mr. Trudeau while 32% would choose Mr. O’Toole. 1 in 5 would prefer Mr. Singh (22%) to become prime minister while 7% prefer Mr. Bernier and 3% Ms. Paul.
In BC, it’s a three-way race with Mr. Trudeau (32%), Mr. Singh (31%), and Mr. O’Toole (30%) all bunched around 30%.
In Ontario, Mr. Trudeau has an 8-point lead on preferred PM over Mr. O’Toole (37% to 29%) with Mr. Singh at 23%.
In Quebec, 47% would prefer Mr. Trudeau compared with 28% for Mr. O’Toole and 15% for Mr. Singh.
WHAT ELECTION OUTCOME DO CANADIANS WANT?
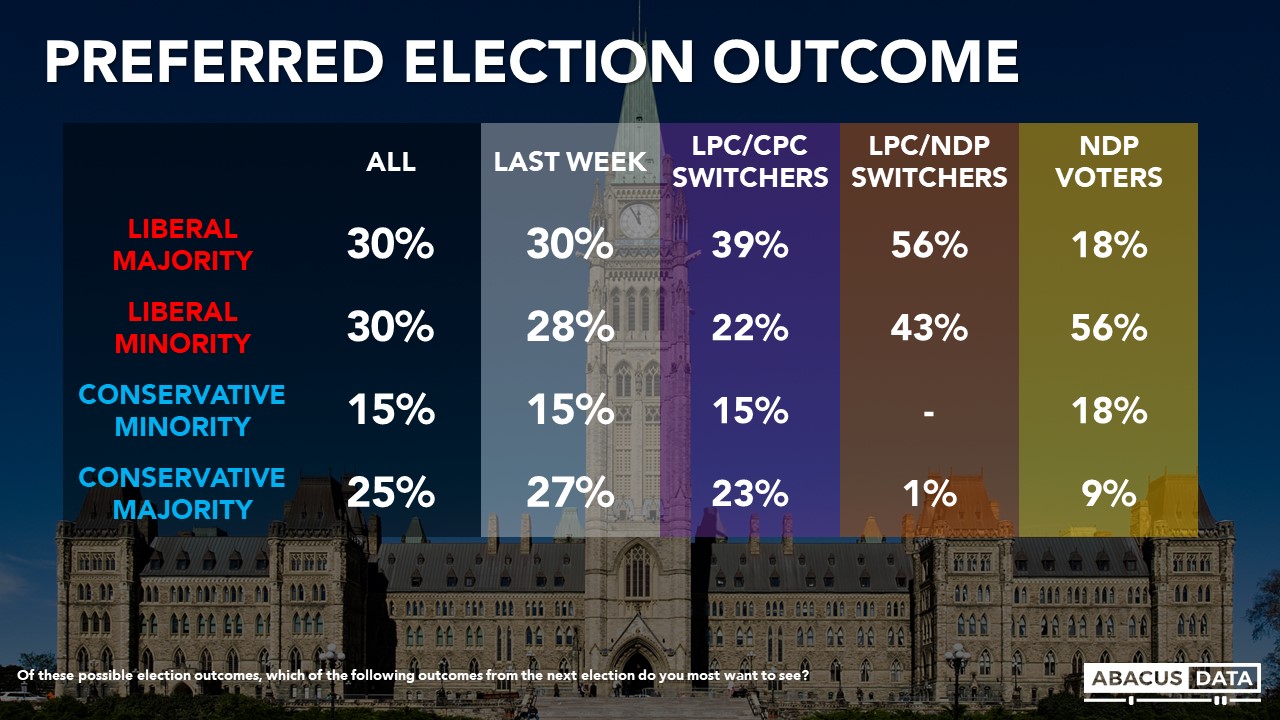
Asked which of four (most likely based on today’s numbers) outcomes they would prefer, 60% would prefer a Liberal victory (28% majority, 32% minority) while 40% would prefer a Conservative win (15% minority, 25% majority). This is mostly unchanged from our last survey and has been consistent throughout the election.
Among NDP supporters, 74% would prefer a Liberal government over a Conservative one (58% want a Liberal minority) while BQ supporters are split. 51% want a Liberal government (45% want a Liberal minority) while 49% want a Conservative government (with 43% wanting a Conservative minority).
Among People’s Party supporters, 78% want a Conservative government (including 41% who want a Conservative majority) while 22% would prefer a Liberal government.

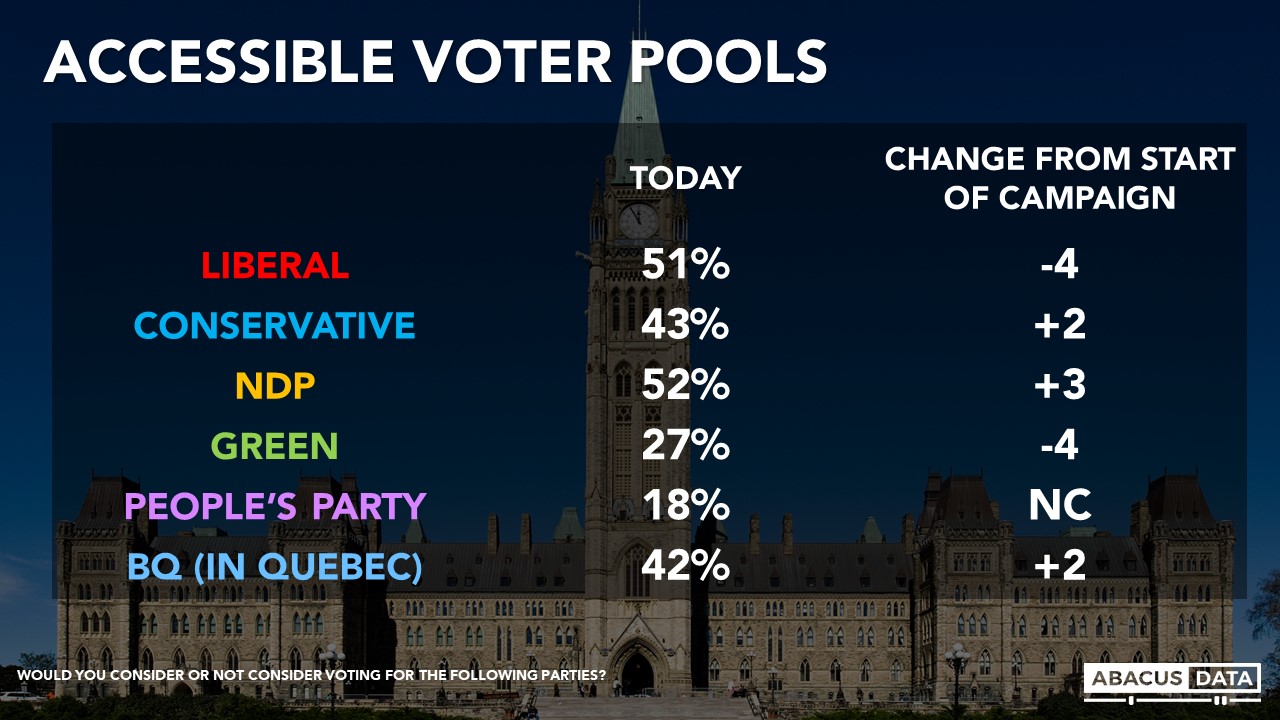
ACCESSIBLE VOTER POOLS
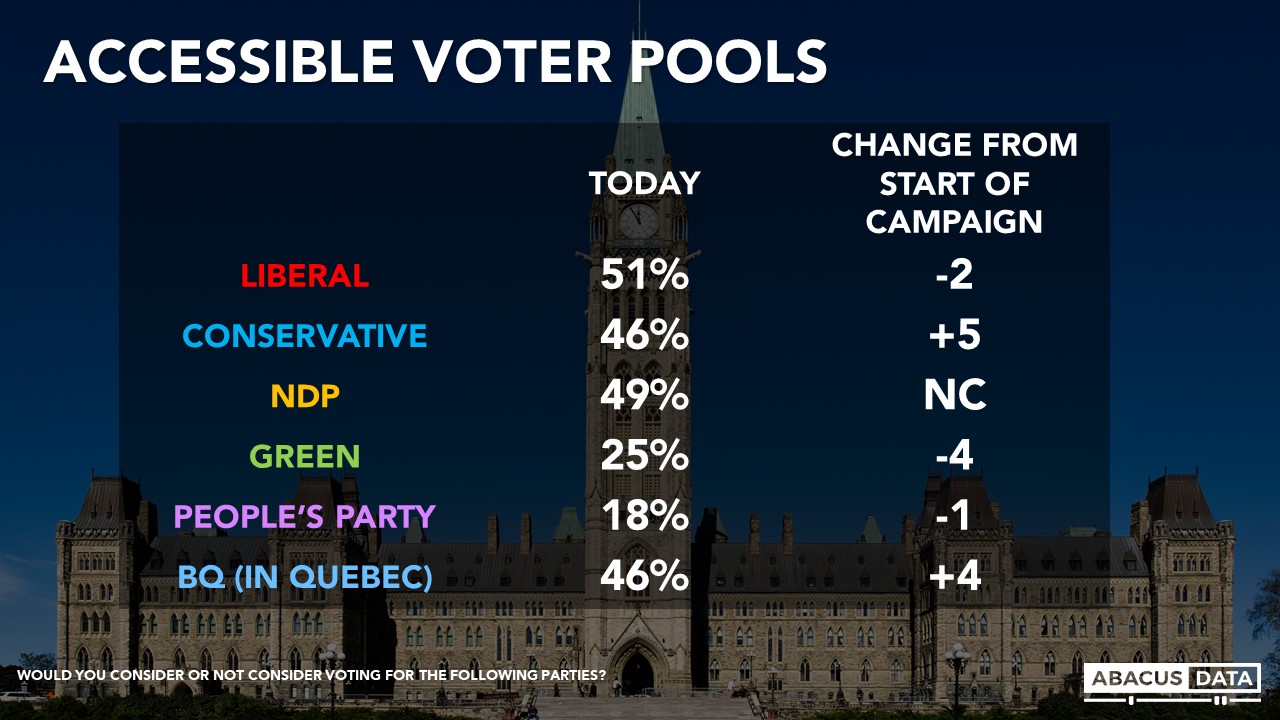
As the campaign comes to an end, the Liberals and NDP continue to have the largest pool of accessible voters compared with the other parties. 51% are open to voting Liberal while 52% are open to voting NDP. 43% would consider voting Conservative and 27% would be open to voting Green. 18% are open to voting for the People’s Party across the country In Quebec, 42% say they are open to voting for the BQ.
Over the campaign, the Liberal and Green accessible voter pools have declined 4-points, while the NDP pool is up 3 and the Conservative pool is up 2. The People’s Party pool of accessible voters is unchanged.
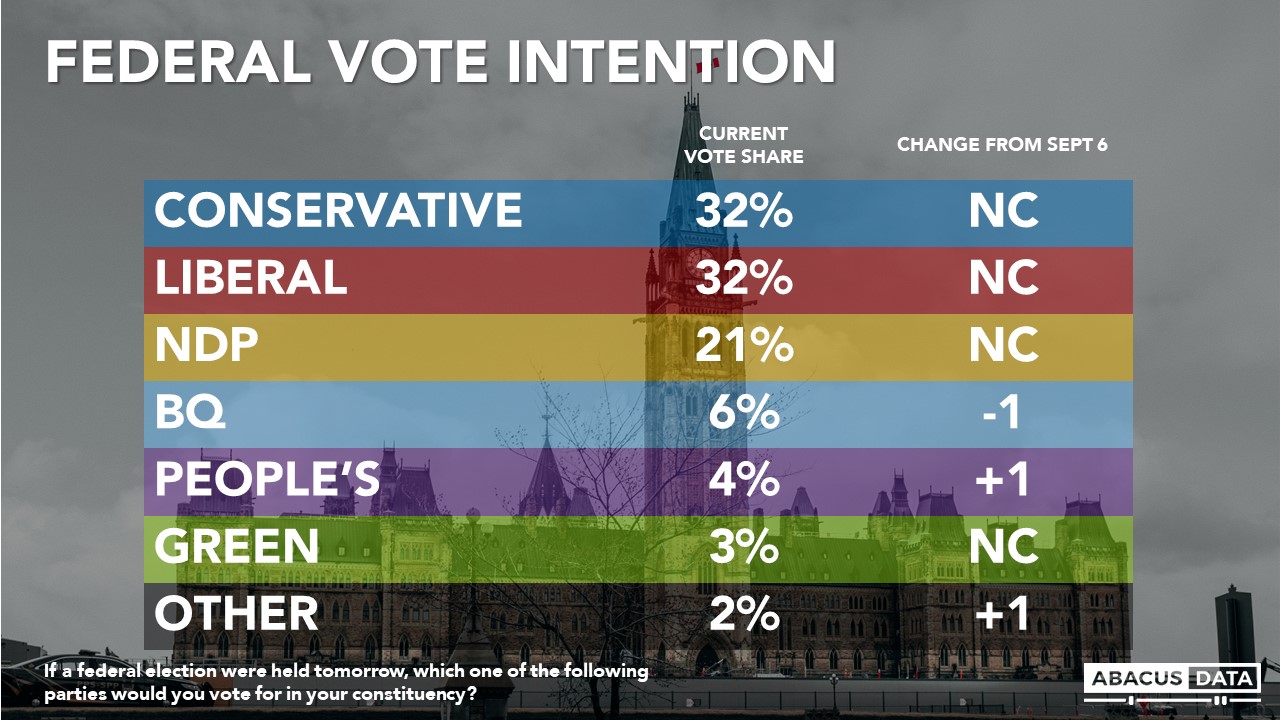
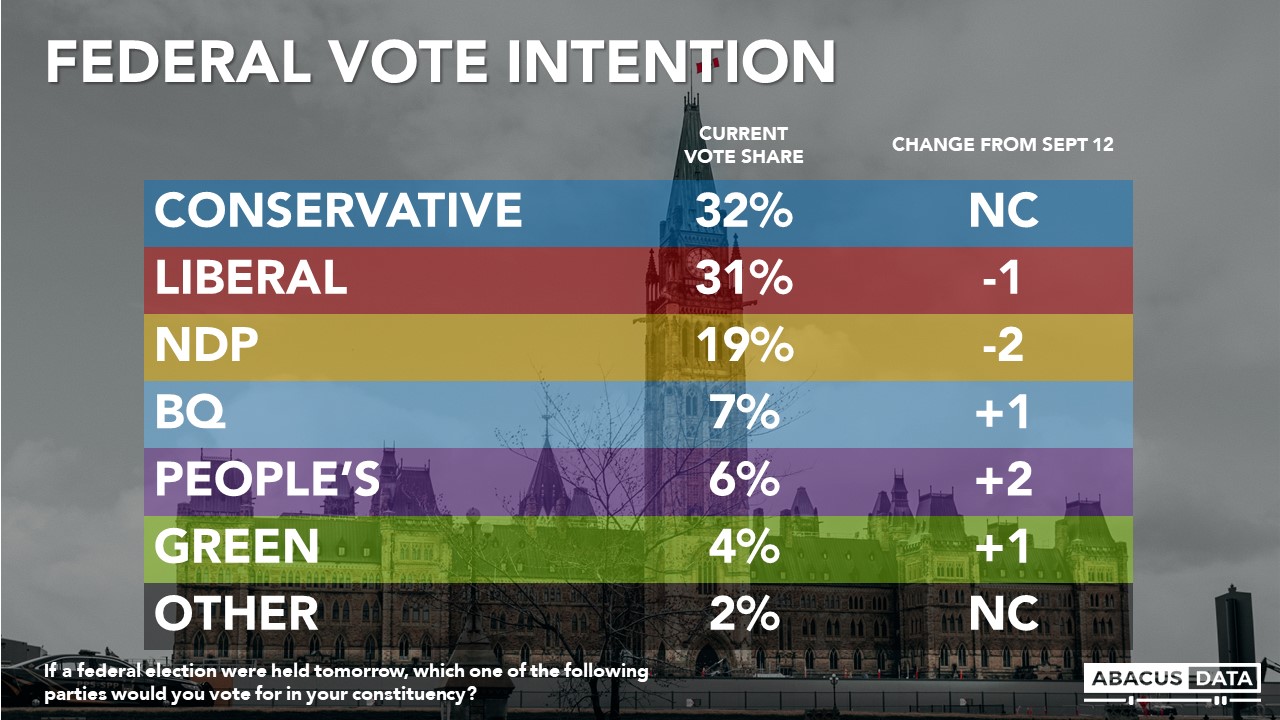
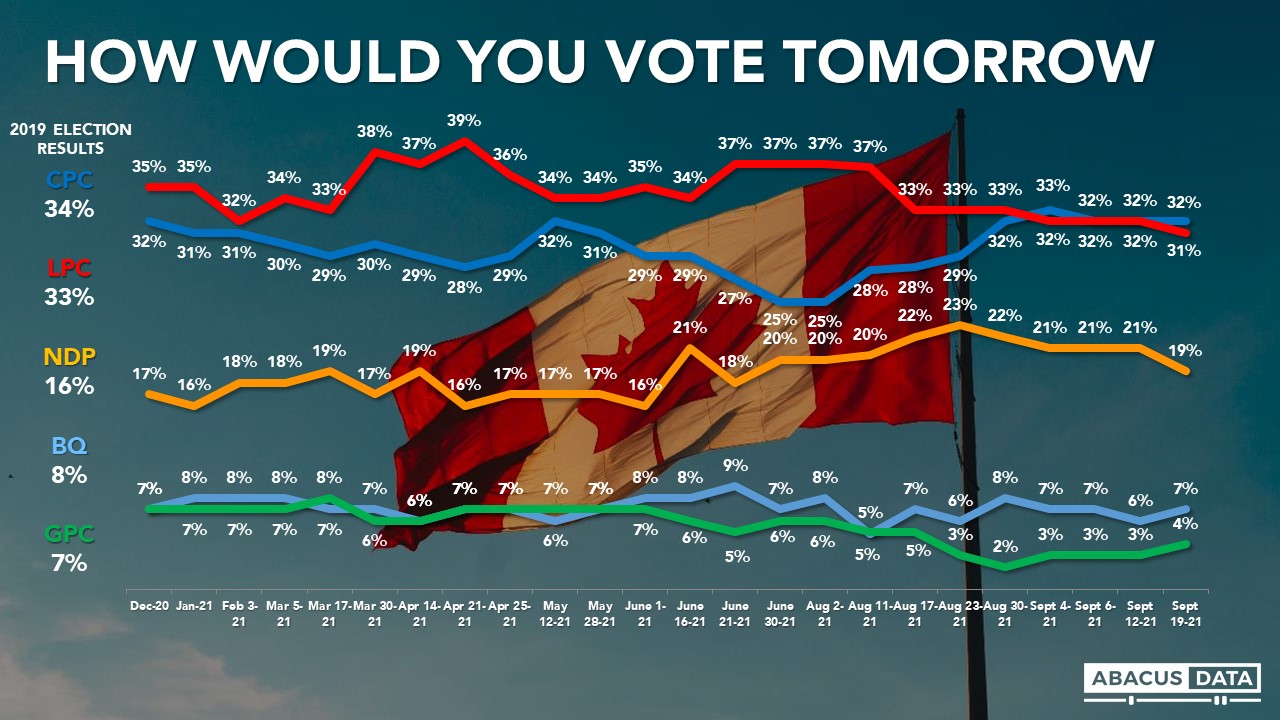
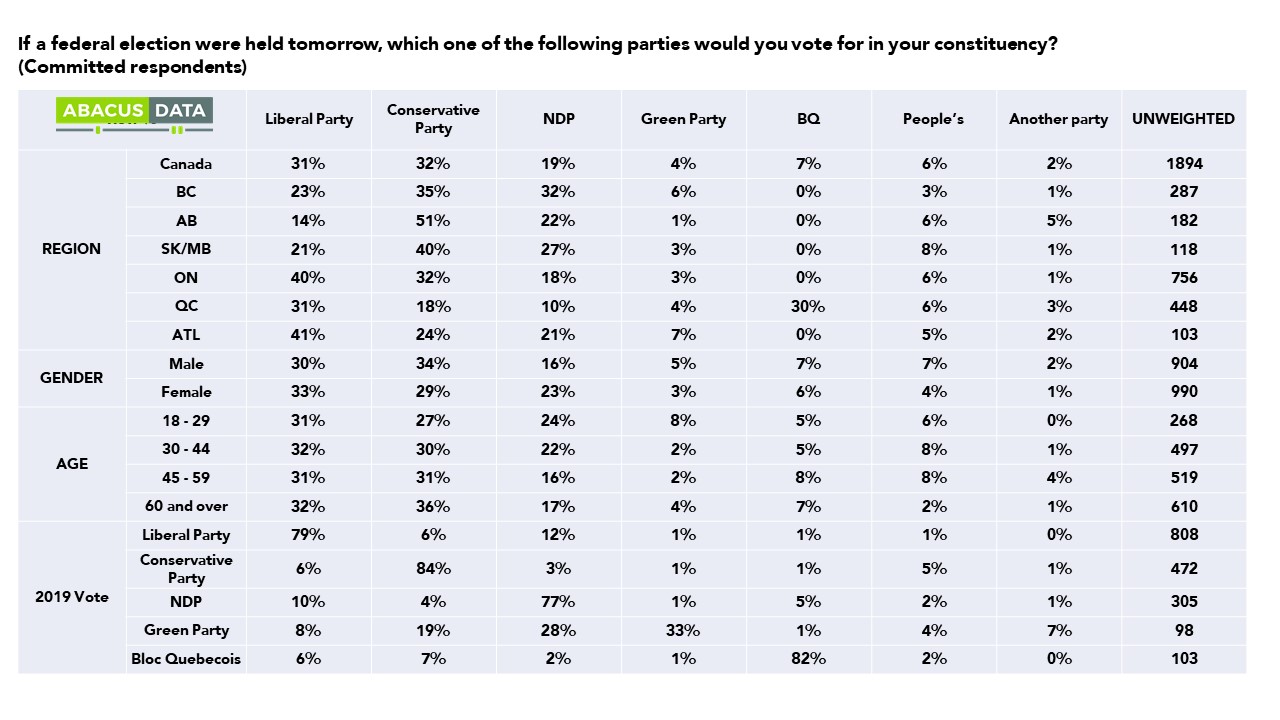
OUR FINAL POPULAR VOTE ESTIMATE: CONSERVATIVES AND LIBERALS STATISTICALLY TIED
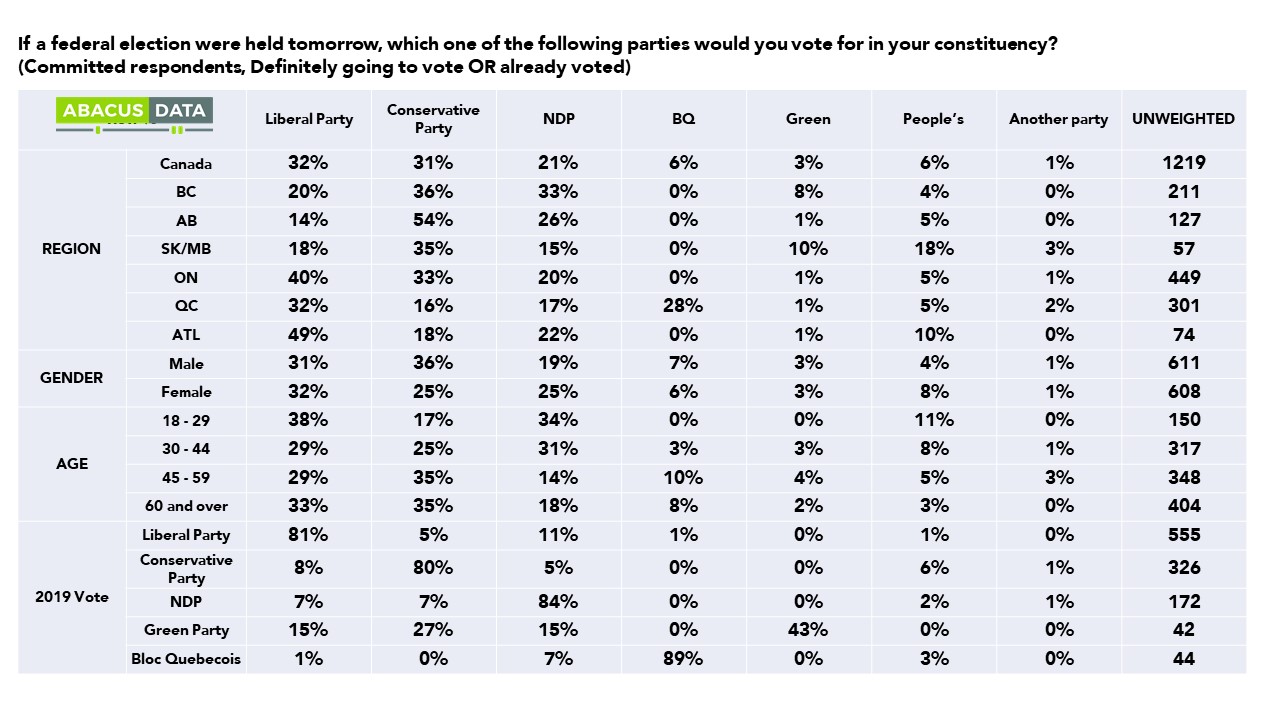
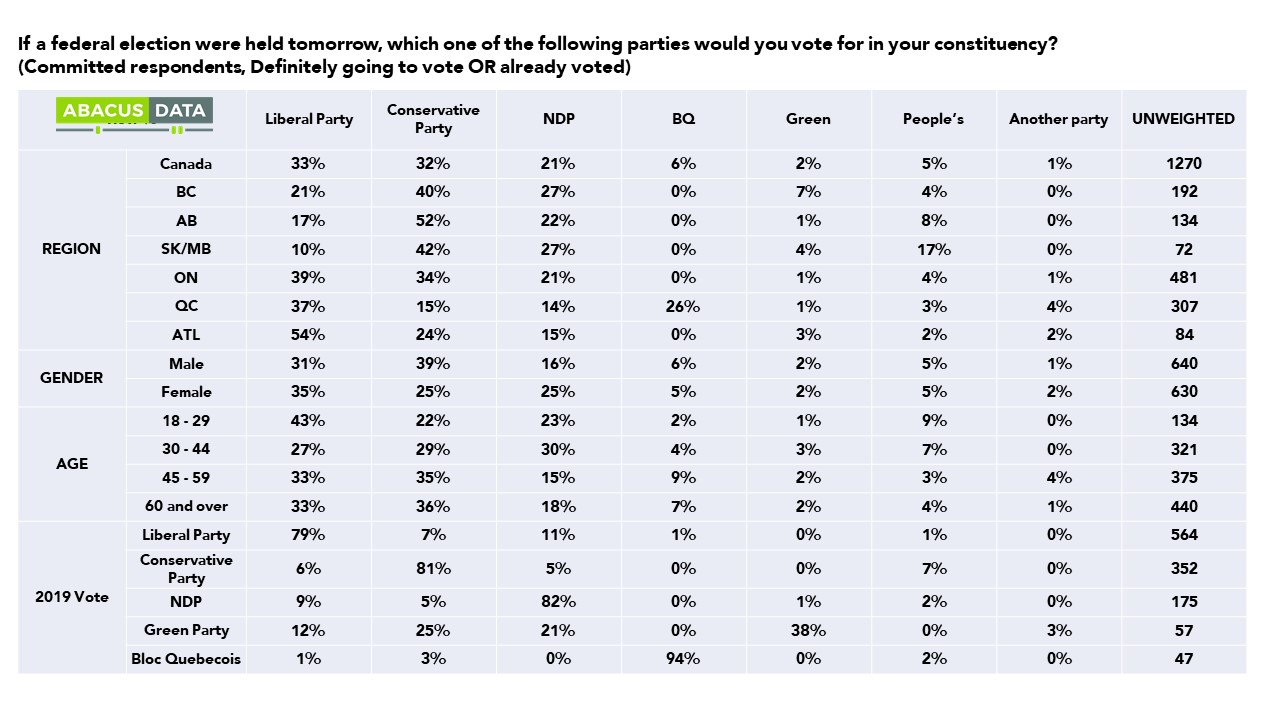
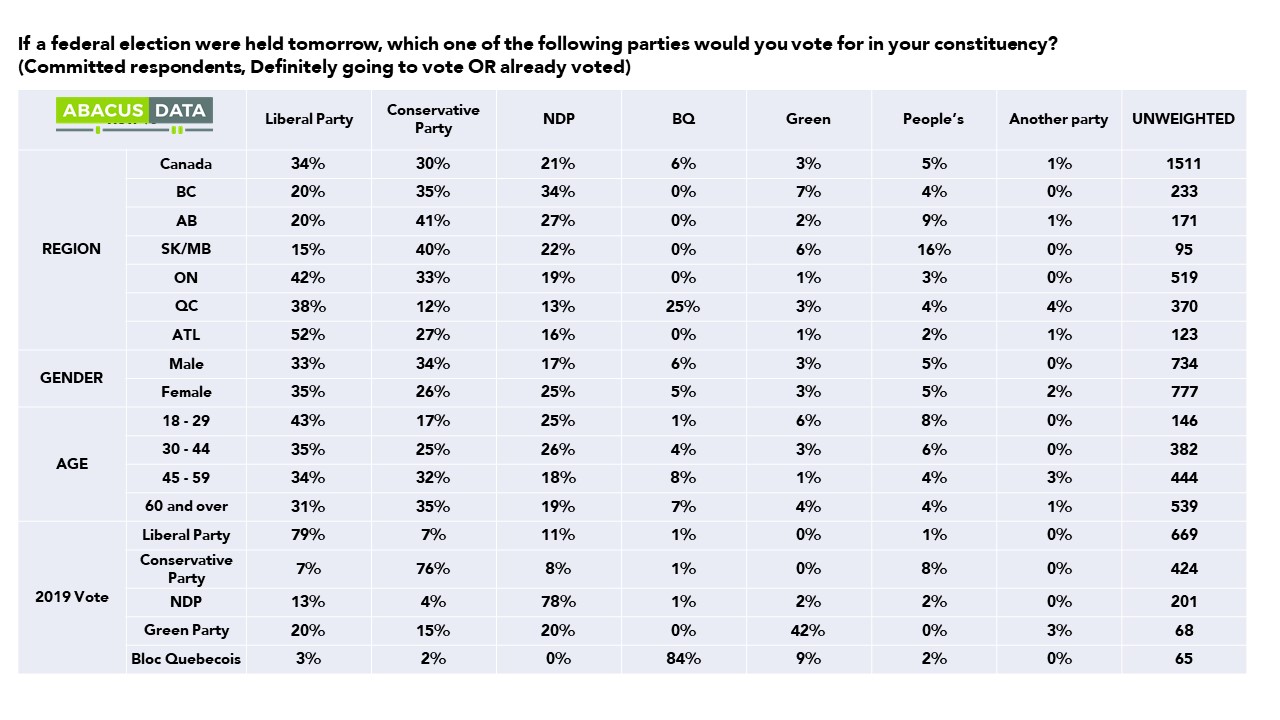
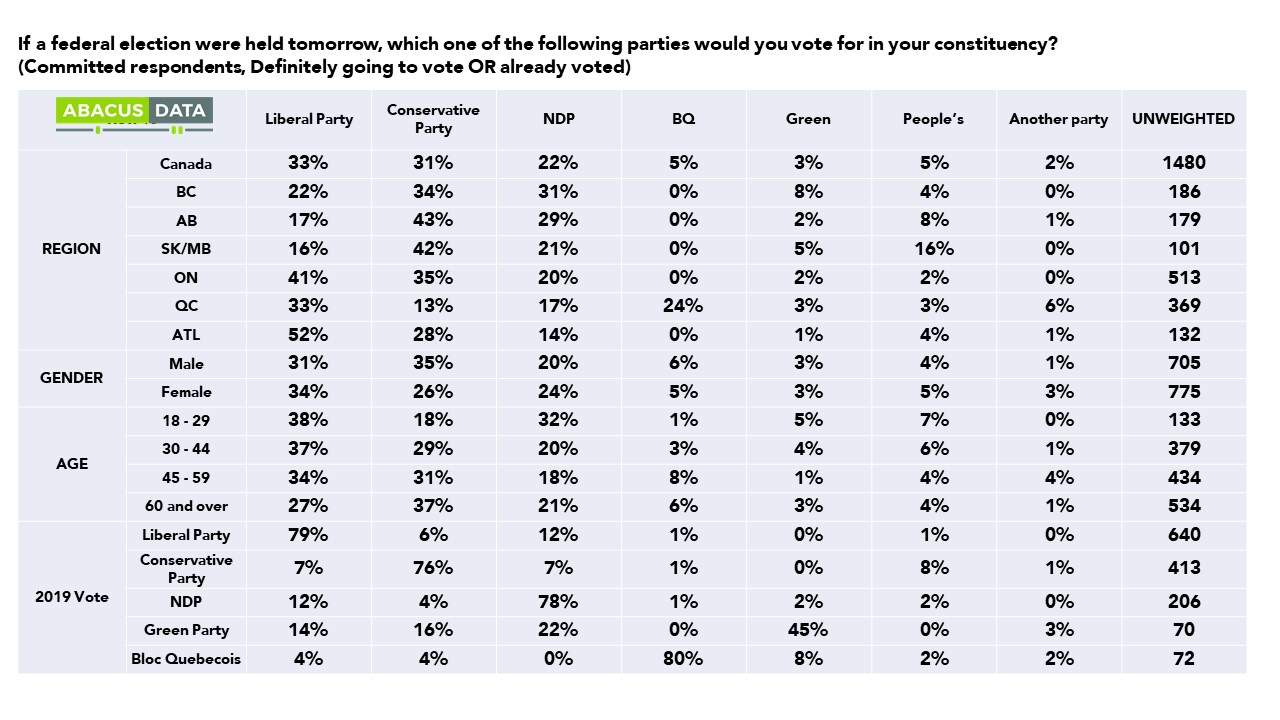
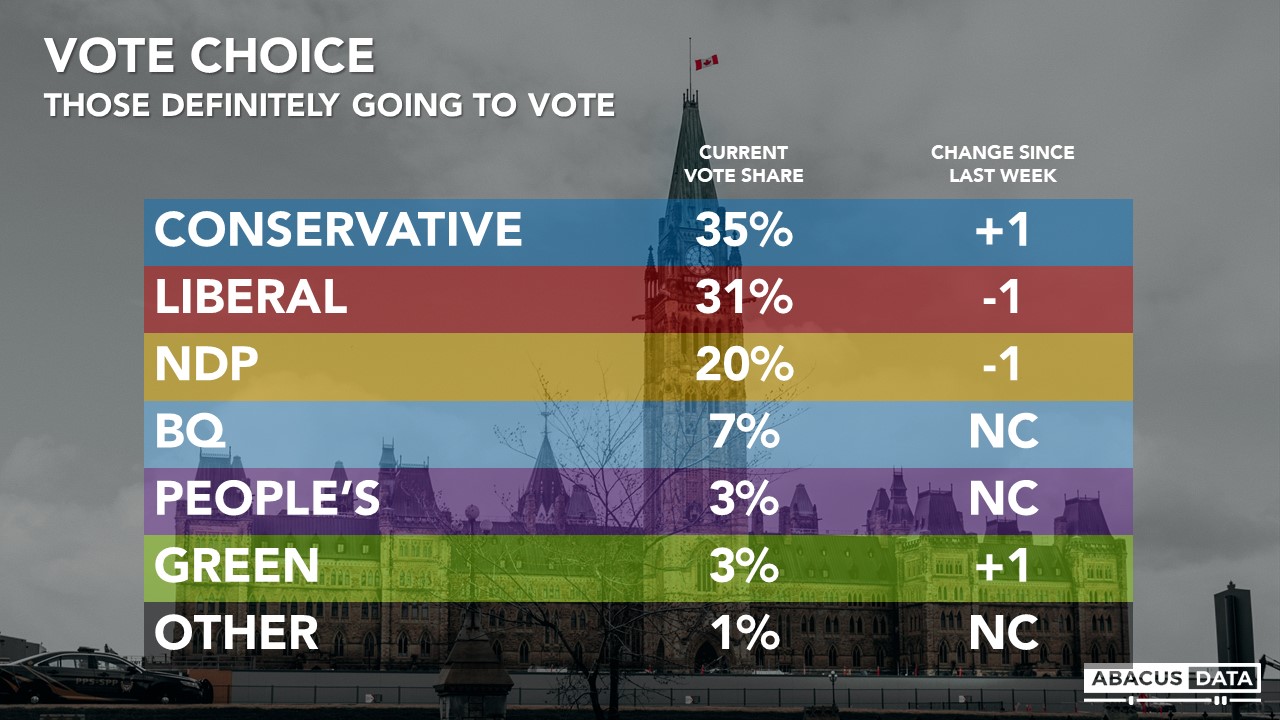
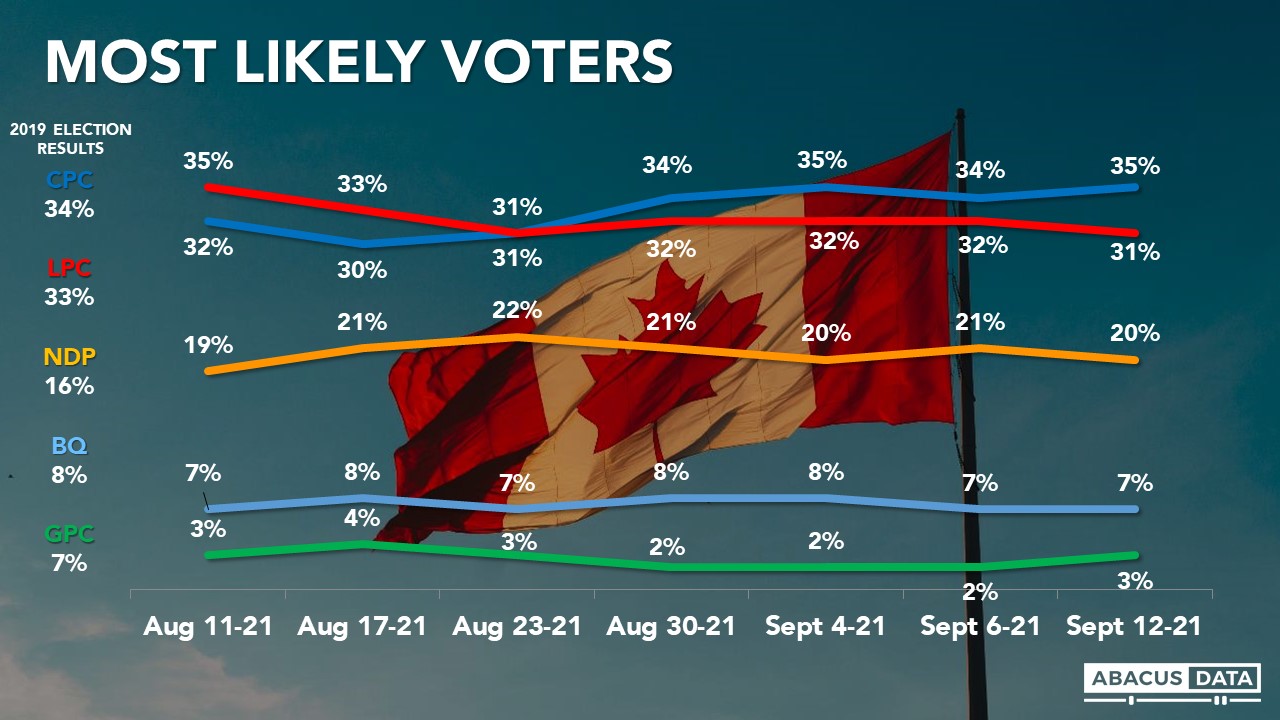
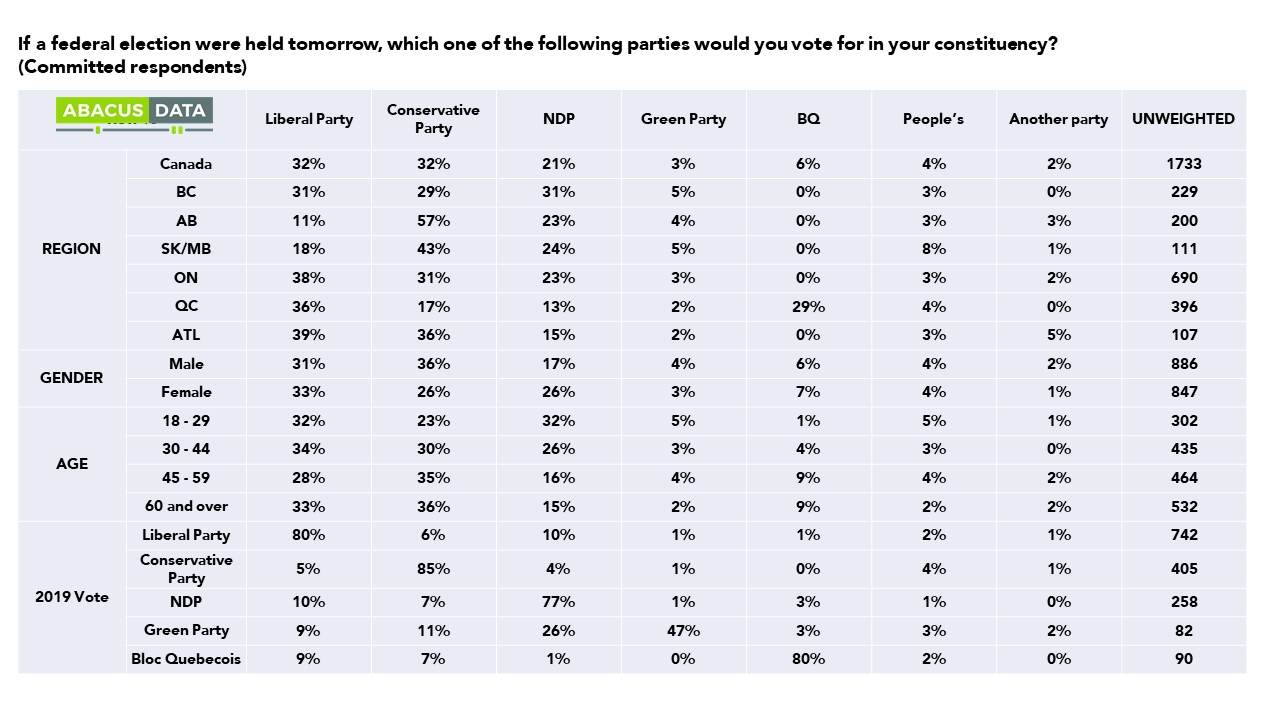
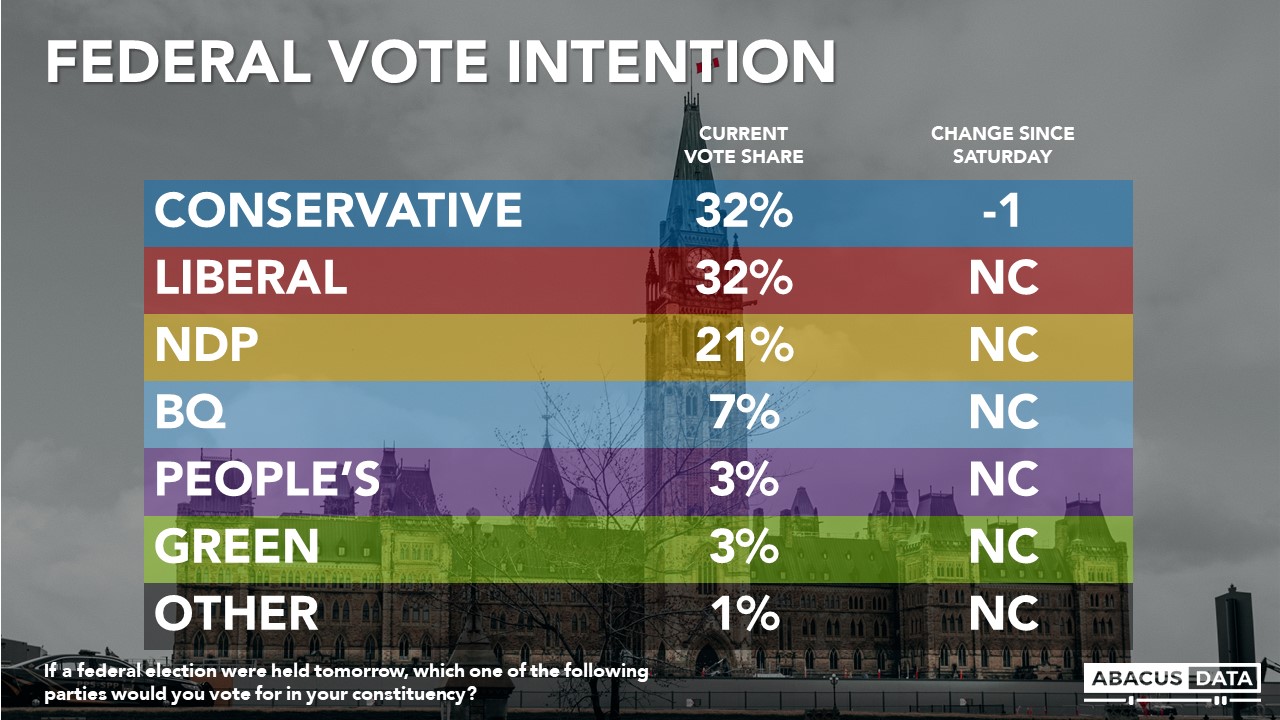
Combining those who have already voted and those likely to vote tomorrow, Conservatives and Liberals are statistically tied with the Conservatives at 32%, the Liberals at 31% and the NDP at 19%. Since last weekend, the Conservative vote share in unchanged, the Liberals are down 1 and the NDP is down 2. We have the People’s Party at 6%, up 2 since last week while the Greens are at 4%, up 1.
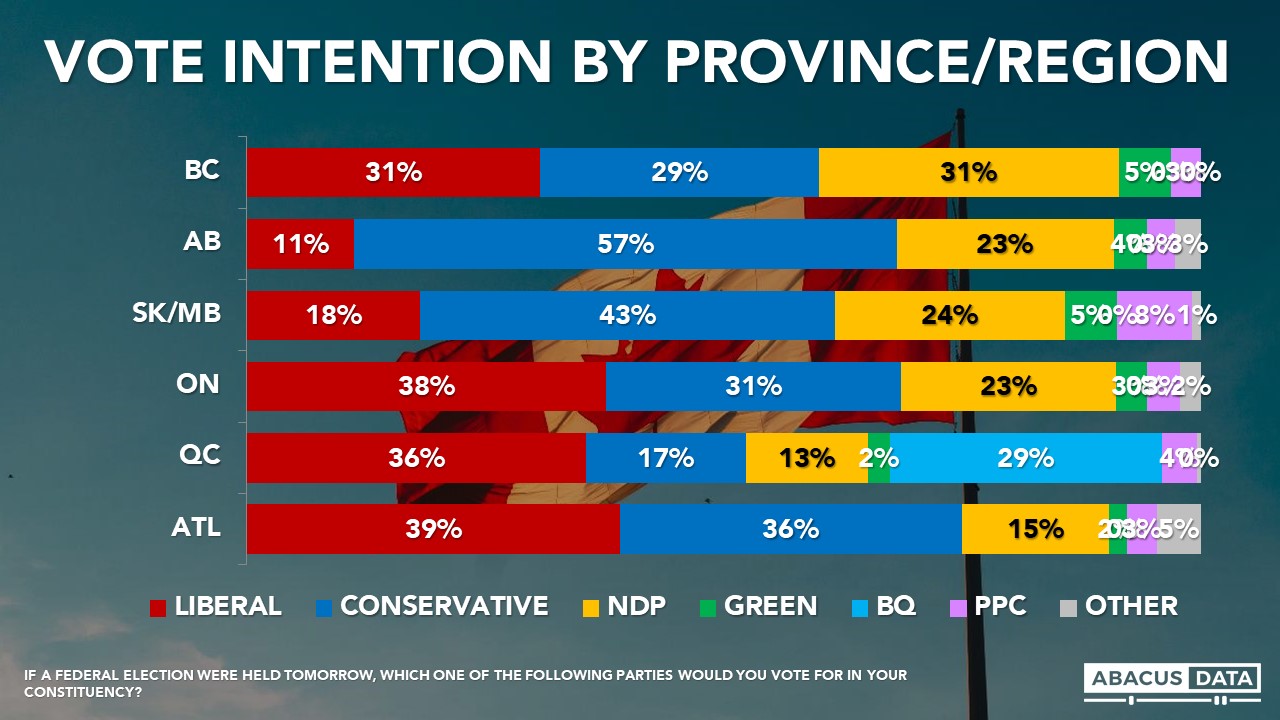
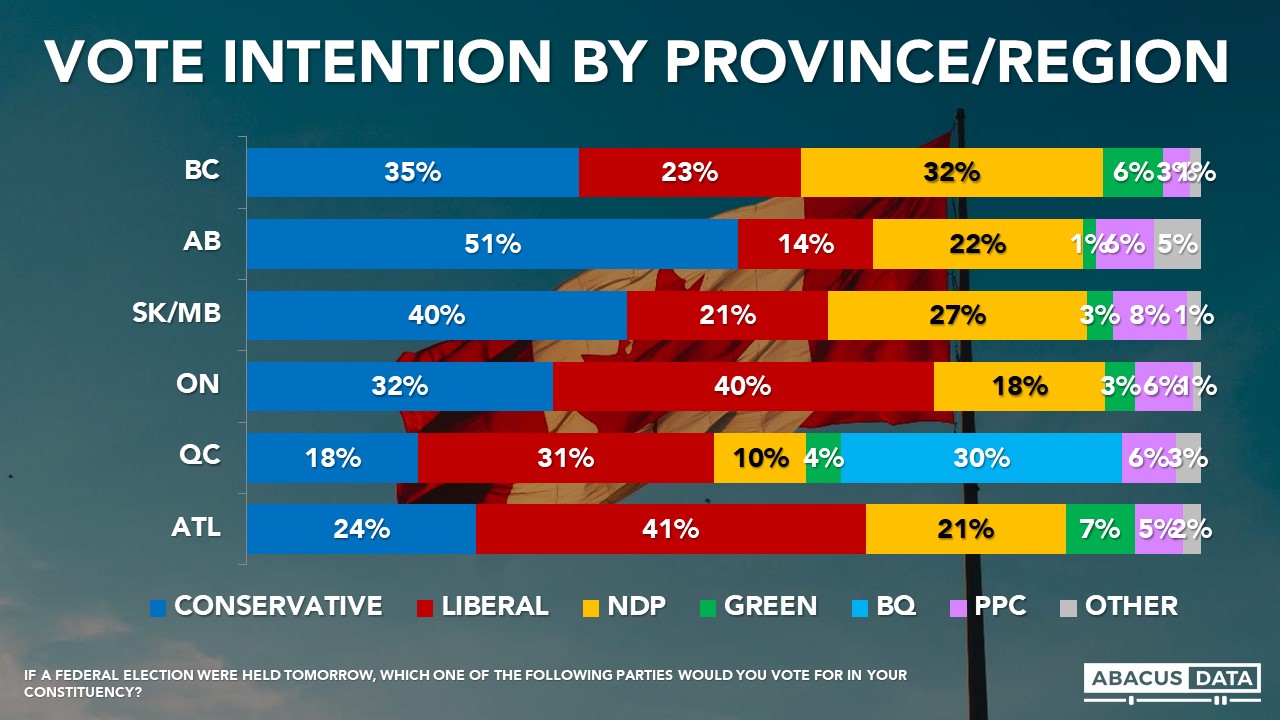
In BC, we see the Conservatives slightly ahead of the NDP (35% to 32%) with the Liberals at 23%. In Alberta, the Conservatives are well ahead of the NDP (51% to 22%) with the Liberals at 14%. The People’s Party is at 6%. In Ontario, the Liberals lead by 8 over the Conservatives (40% to 32%) while in Quebec, the Liberals and BQ are statistically tied (31% to 30%) with the Conservatives in third at 18%.
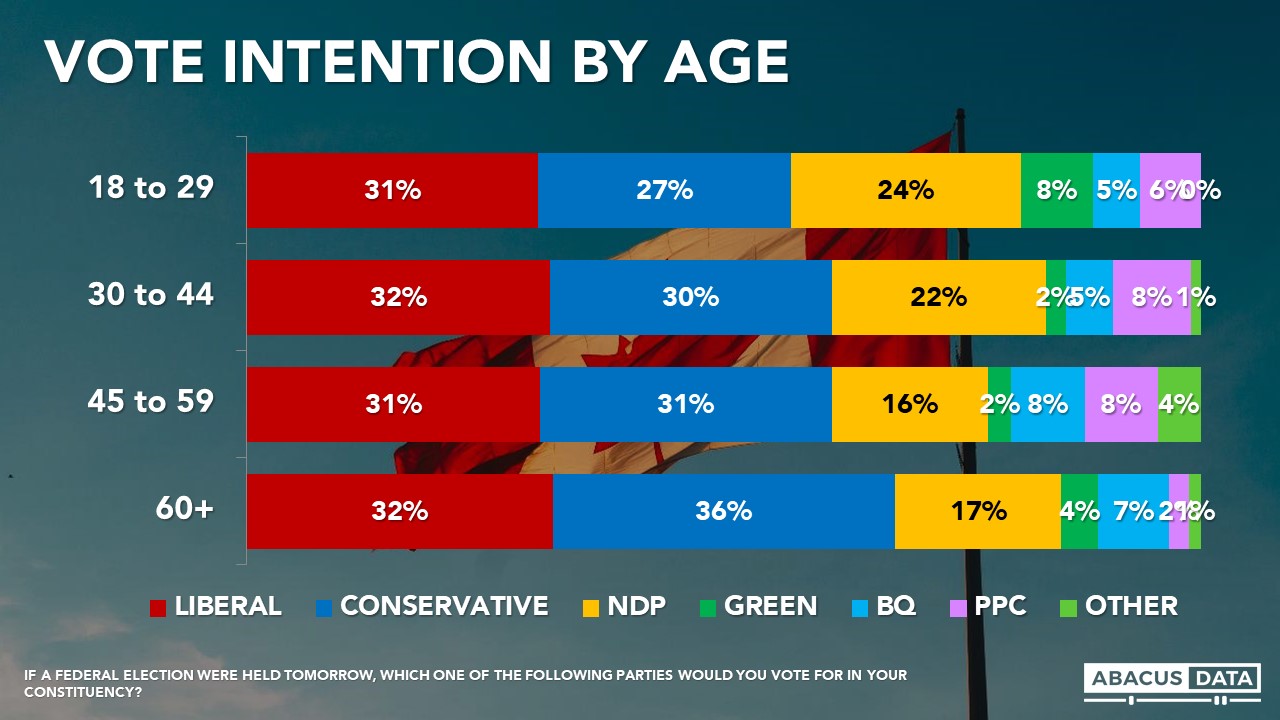
NDP support is strongest among those aged 18 to 29 at 24% and drops to 16% among those 45 to 59. Liberal support is consistent across age groups, while the Conservatives are stronger among older voters and weaker among younger ones.
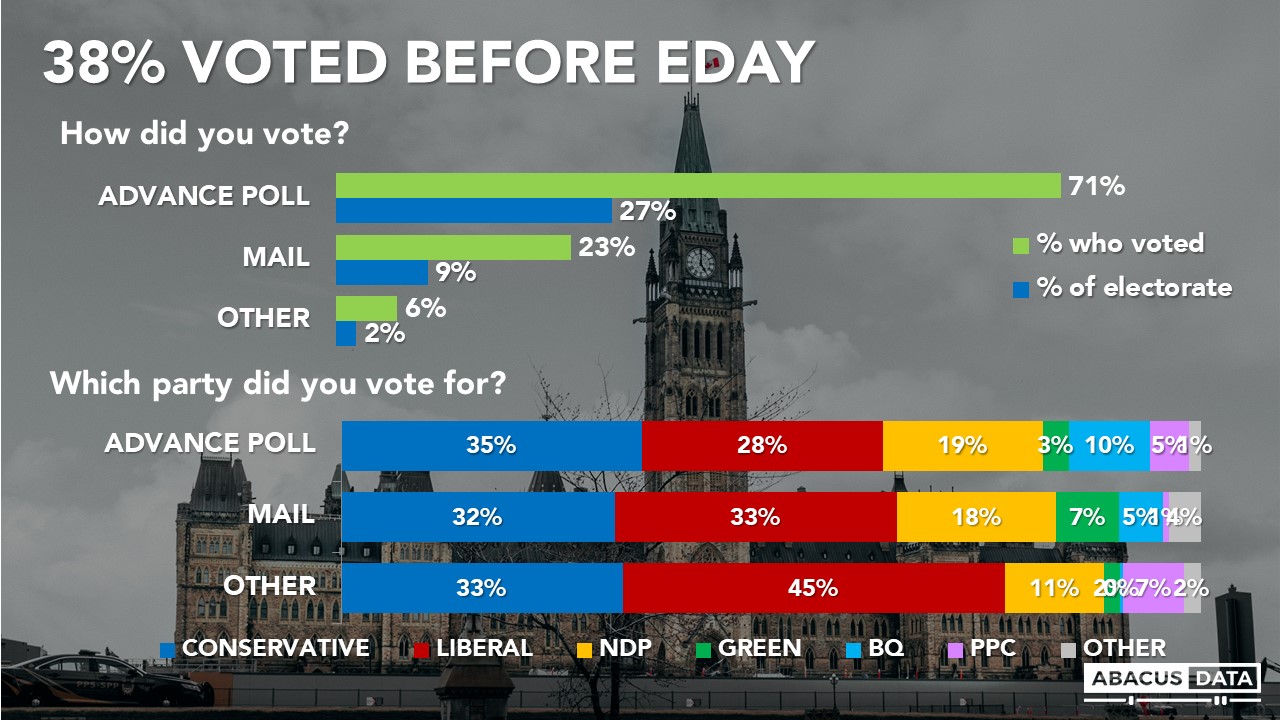
In our survey, 38% of eligible voters said they cast a ballot either by mail or at an advance poll. Among those who voted at an advance poll, the Conservatives are ahead by 7 (35% to 28%) with the NDP at 19%. Among those who said they voted by mail, the vote is split 33% Liberal, 32% Conservative, 17% NDP.
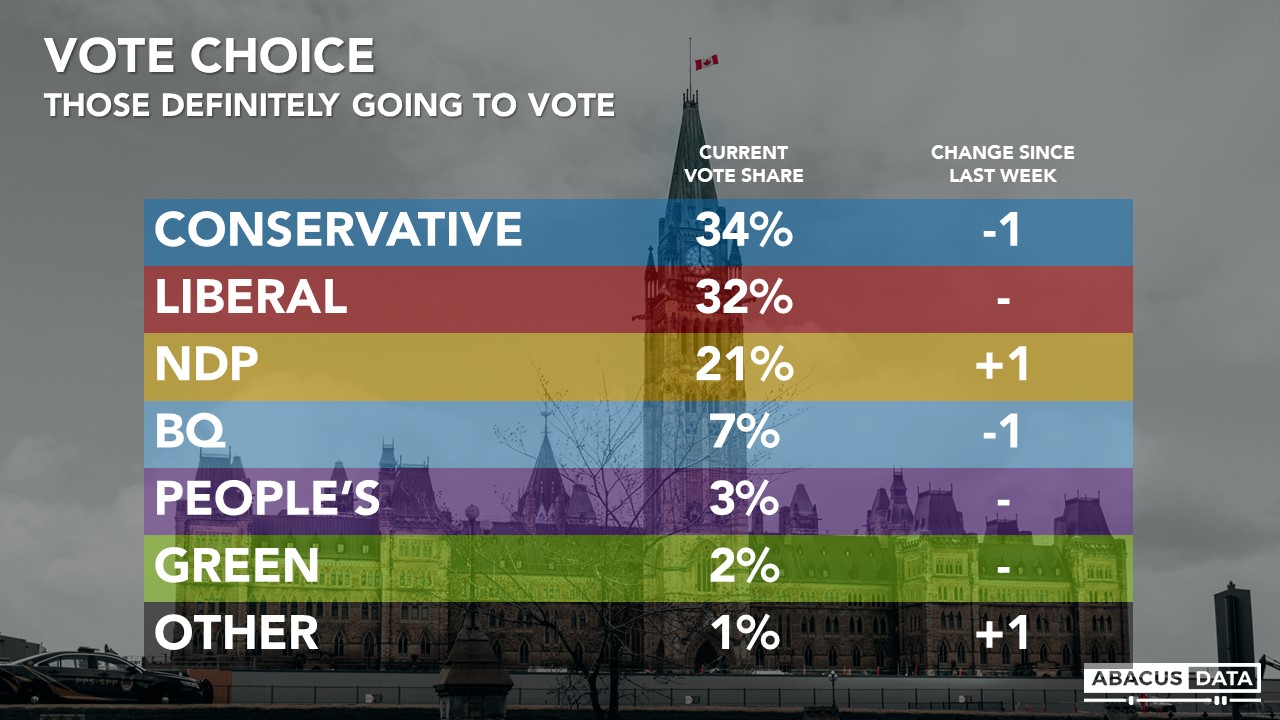
Among those likely to vote tomorrow, the vote is: Liberal 33%, Conservative 29%, NDP 21%, People’s Party 7%, BQ 5%, and GPC 4%.
UPSHOT
Our final poll of the 44thCanadian General Election indicates that the election outcome is far from certain as the Conservatives and Liberals seem locked in more or less a tie nationally. The Liberal lead in Ontario along with a competitive race with the BQ in Quebec may ultimately help it win the most seats. But our extensive review of the data leaves us unable to make a confident projection except that every vote will count and we are heading towards another minority parliament.
This has been an election campaign that Canadians have largely tuned out. Over the five weeks of the campaign, we find that interest has wanned.
For the Liberals, general approval over its handling of the pandemic has been largely overshadowed by the negative reaction most felt when the election was called. They have been unable, to this point, to entice many NDP supporters into their camp in part because only a small minority believe the Conservatives are likely to win the election. You can’t fear an outcome you don’t think is likely to happen.
For the Conservatives, despite effectively litigating the “unnecessary election” theme throughout the campaign, the desire for change remains lower than in 2019 and they haven’t been able to galvanize enough voters who want to see the Liberals replaced. While their pool of accessible voters has grown over the campaign, Mr. O’Toole’s personal image plateaued after a quick rise in the early weeks of the campaign.
More still would prefer to see a Liberal government to a Conservative one.
Ultimately, for swing voters, the choice in this election is likely between punishing the Liberals for the election call or sticking with the incumbents in the face of rising COVID-19 cases and growing anxiety about the pandemic.
Turnout, more than ever, will be critical to the final outcome. With longer than expected wait times to vote, the final outcome may hinge or a few hundred votes in a dozen or so seats scattered across the country.
If the final results come close to our estimates, this would be the lowest share of the popular vote the two largest parties would have earned since the 1997 federal election. The level of fragmentation in our party system is very high.
METHODOLOGY
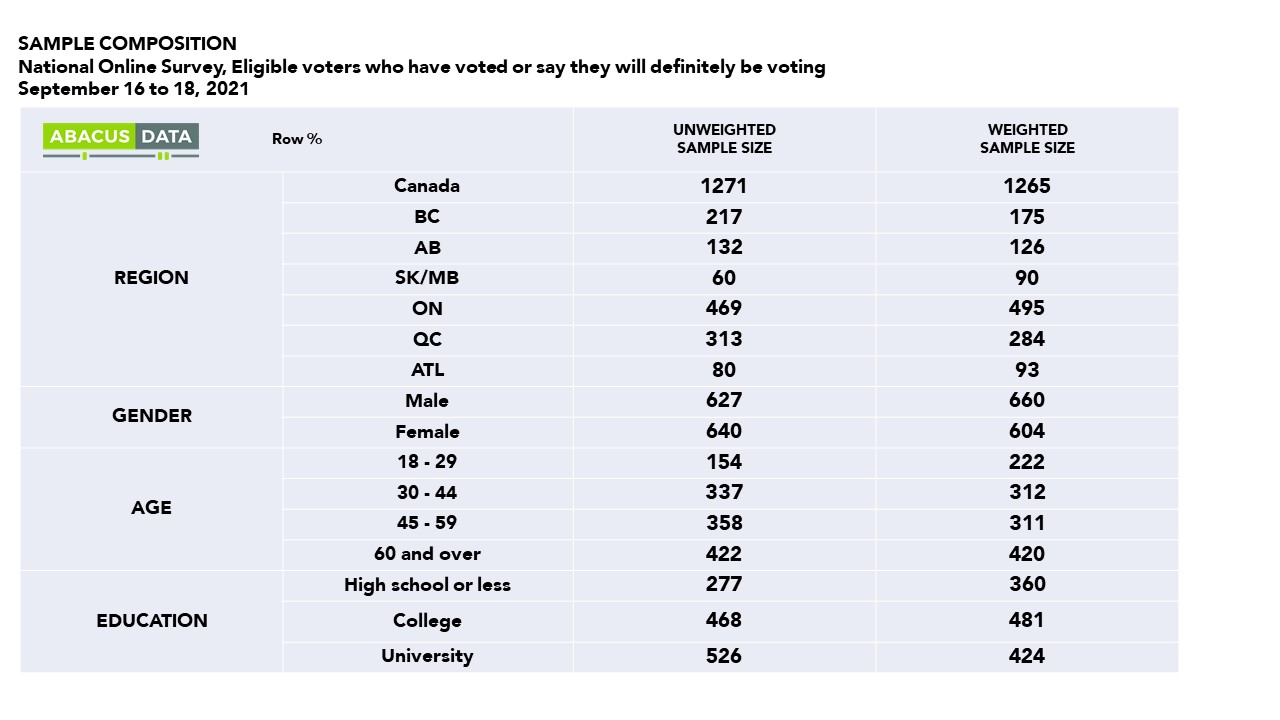
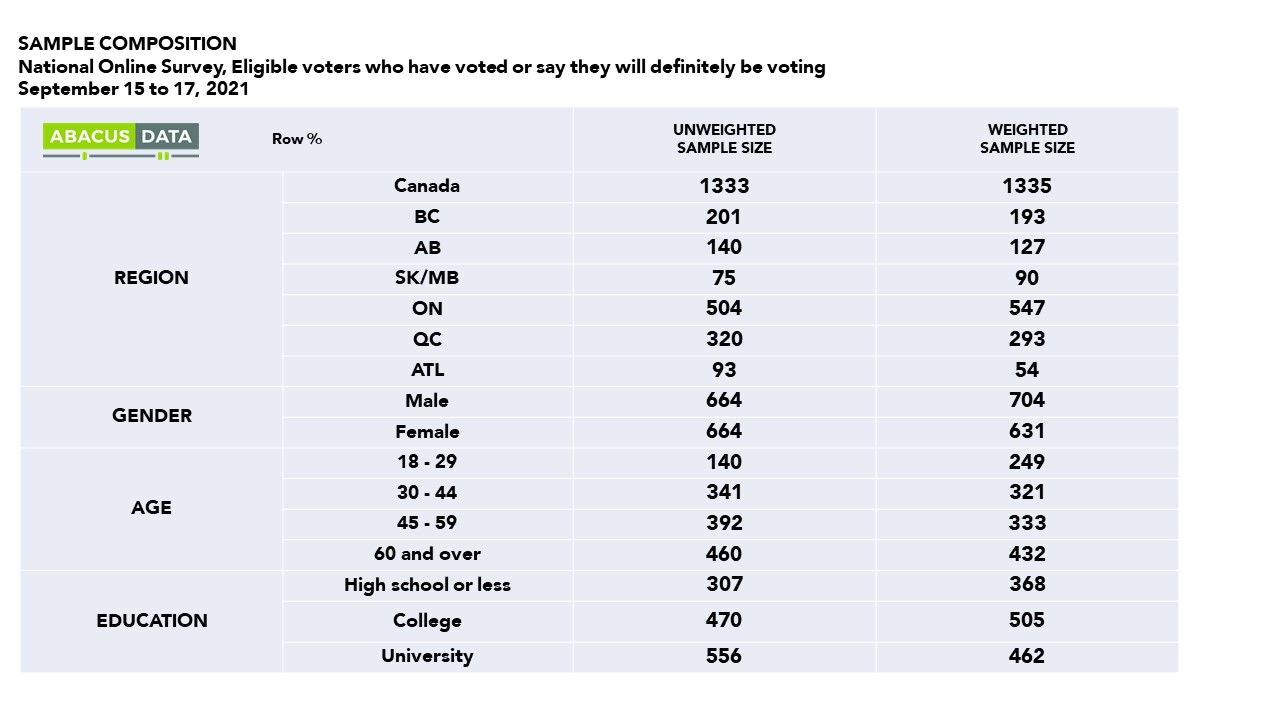
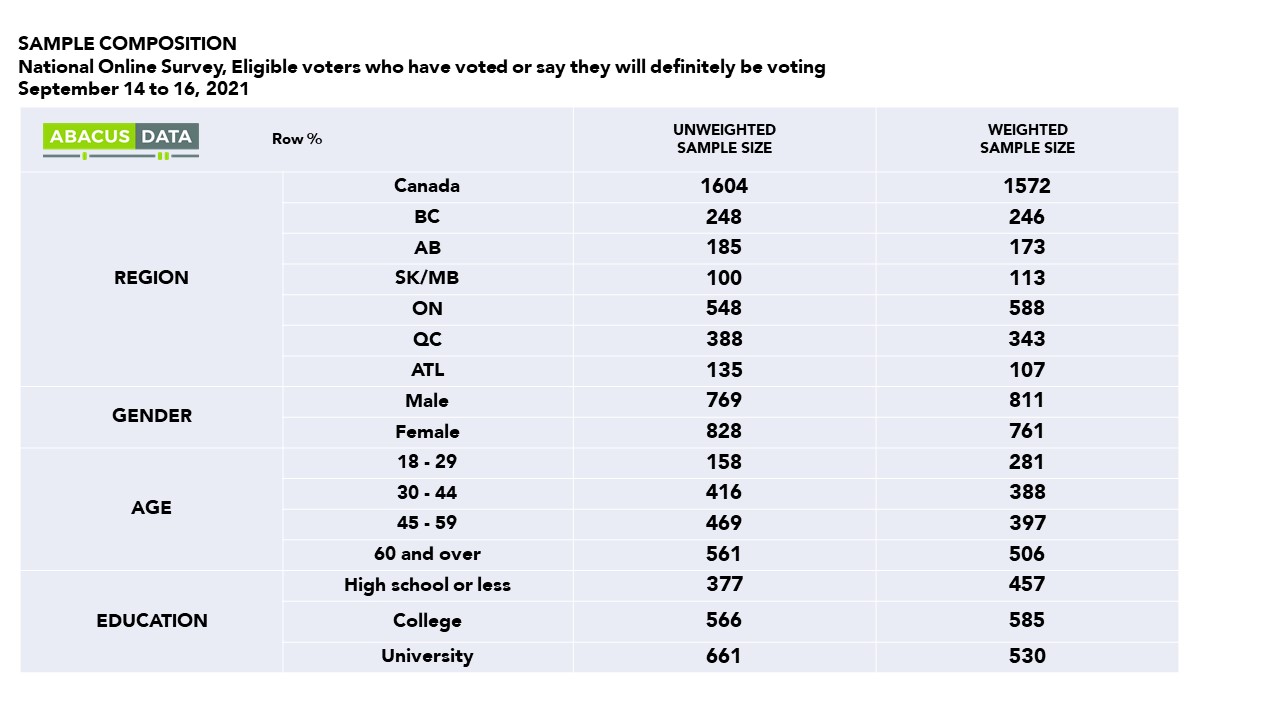
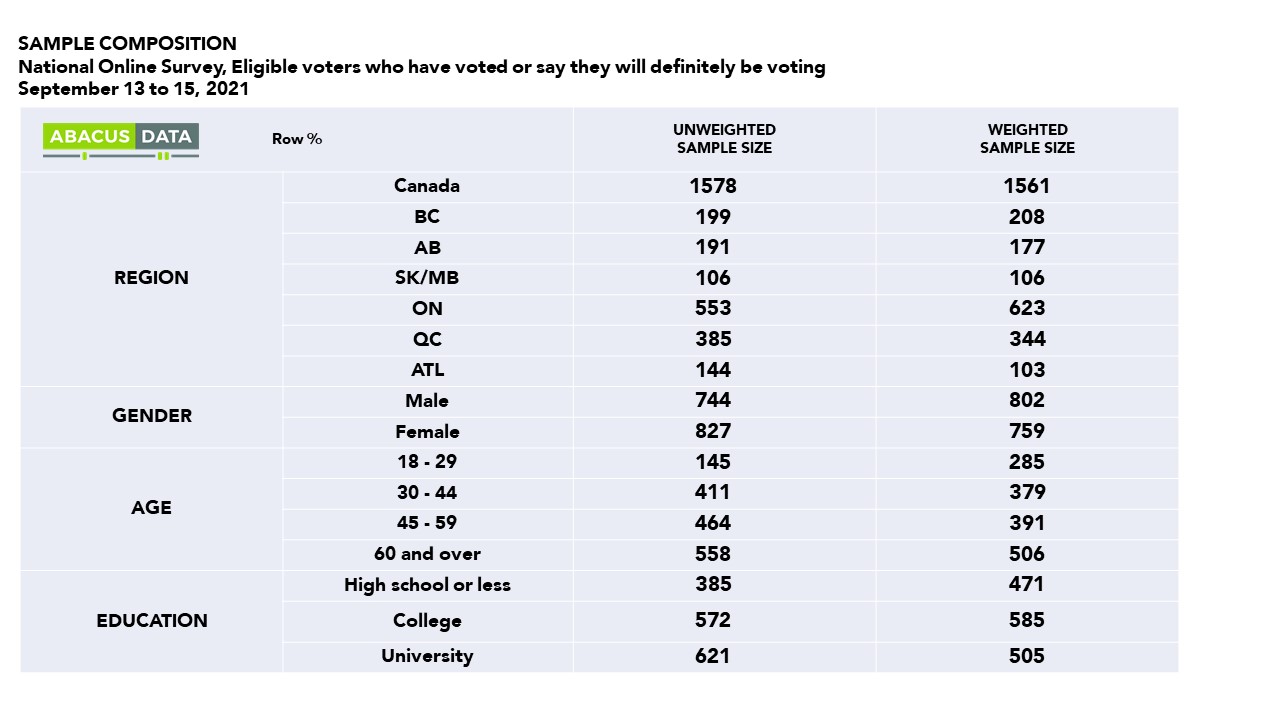
The survey was conducted with 2,431 Canadian adults eligible to vote from September 17 to 19, 2021. A random sample of panelists were invited to complete the survey from a set of partner panels based on the Lucid exchange platform. These partners are typically double opt-in survey panels, blended to manage out potential skews in the data from a single source.
The margin of error for a comparable probability-based random sample of the same size is +/- 2.0%, 19 times out of 20.
The data were weighted according to census data to ensure that the sample matched Canada’s population according to age, gender, educational attainment, and region. Totals may not add up to 100 due to rounding.
This survey was paid for by Abacus Data Inc.
Abacus Data follows the CRIC Public Opinion Research Standards and Disclosure Requirements that can be found here: https://
ABOUT ABACUS DATA
We are the only research and strategy firm that helps organizations respond to the disruptive risks and opportunities in a world where demographics and technology are changing more quickly than ever.
We are an innovative, fast-growing public opinion and marketing research consultancy. We use the latest technology, sound science, and deep experience to generate top-flight research-based advice to our clients. We offer global research capacity with a strong focus on customer service, attention to detail and exceptional value.
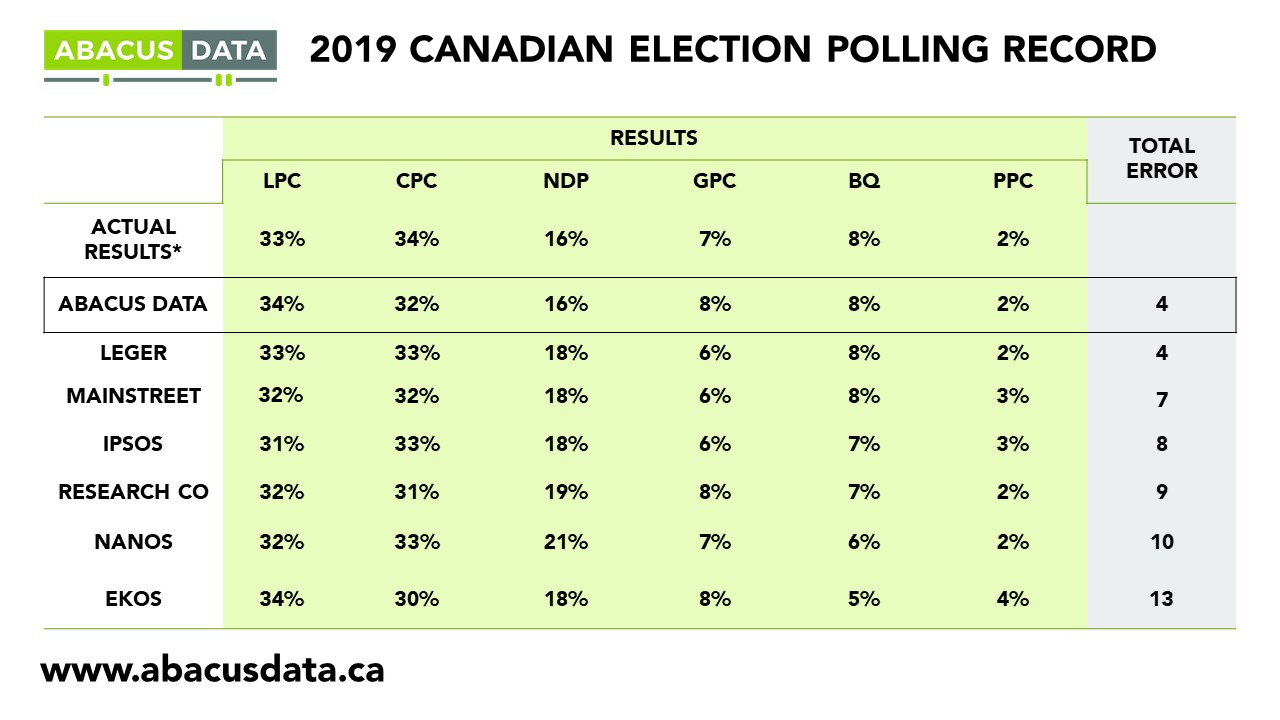
We were one of the most accurate pollsters conducting research during the 2019 Canadian Election.
Contact us with any questions.
Find out more about how we can help your organization by downloading our corporate profile and service offering.