So, you’re a NOT-SO-empty-nester. Your Millennial went out, got an education and came back with a degree, a lot of debt, and no job. Your experience is not in isolation, indeed 1 in 3 Canadian households are experiencing this exact scenario today. Let’s be clear, no one in your household is a huge fan of the situation. At first it was novel, little Jonny came back from his college or university career, full of energy and knowledge he was ready to commit towards a well-paying and fulfilling job. Four years on and the energy has waned, the job is not so fulfilling, and the pay…well, Jonny’s glad you decided not to charge him rent.
What the labour market is telling your Millennial that they are probably going to have to re-skill and/or move to find more better paying or more fulfilling work. However, the effect this delayed home ownership or renter-ship is having on the housing market has wider implications which will be witnessed over the next 20 years.
As commented on in their Financial Post column, Dr. Murtaza Haider and Stephen Moranis foresee this delayed exit from the parental home as having two general affects on the housing market. The first, is that it postpones Boomers’ natural inclination to down-size. As Baby Boomers are entering their senior years mobility decreases, incomes become fixed, and a need for a family-sized house is reduced. The third of Boomers that are still hosting an adult child are unable to fulfill this natural inclination which both increases personal financial strain and reduces the number of potential houses on the market which artificially increases the market price. Meanwhile, Millennials are at home because both rental and ownership options are unattainable due to an inflated price and their comparatively low incomes.
Nevertheless, Haider and Moranis believe that Millennials will eventually own homes and when they do, they will have many housing options available to them. The Millennials, nominally, are a smaller generation and while housing supply in urban centres will continue to be highly competitive, prices elsewhere could conceivably fall due to excess supply. The long-term effects of the Millennial nester will play out over the next few decades but for many, home ownership might just be on the horizon of a not-so-distant future.
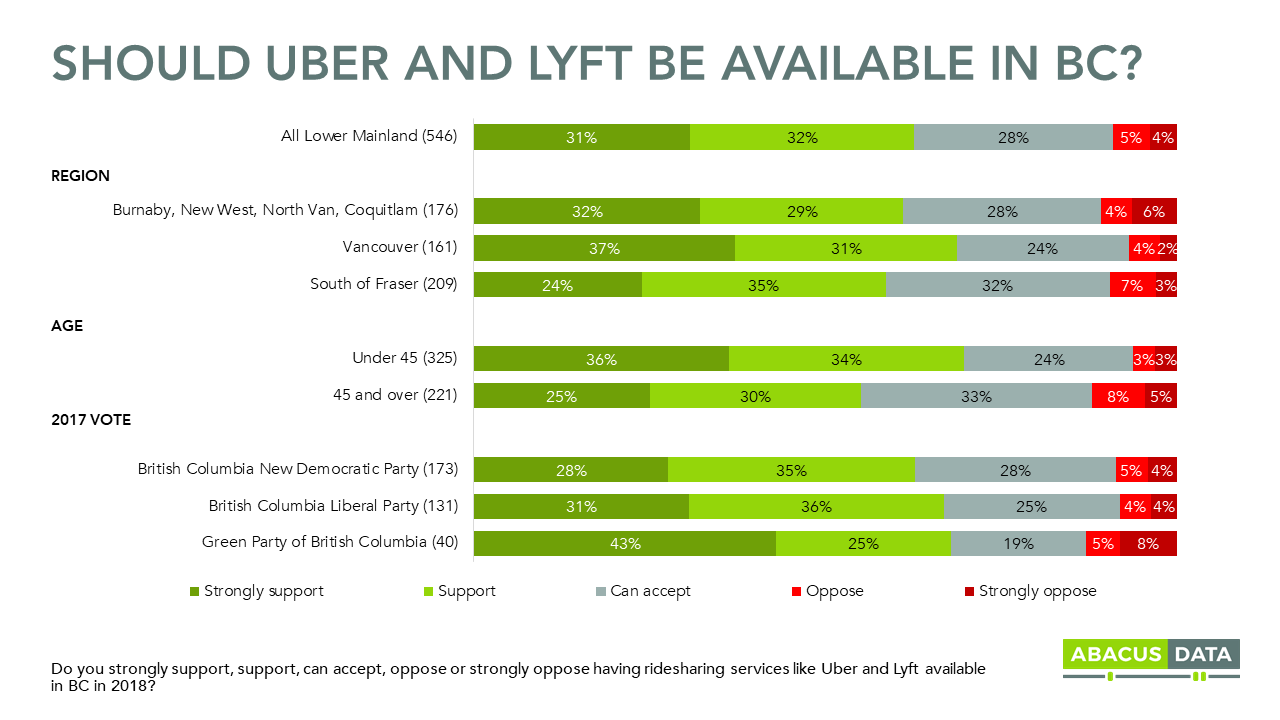
Support is consistent across the region and among NDP, Liberal, and Green voters.
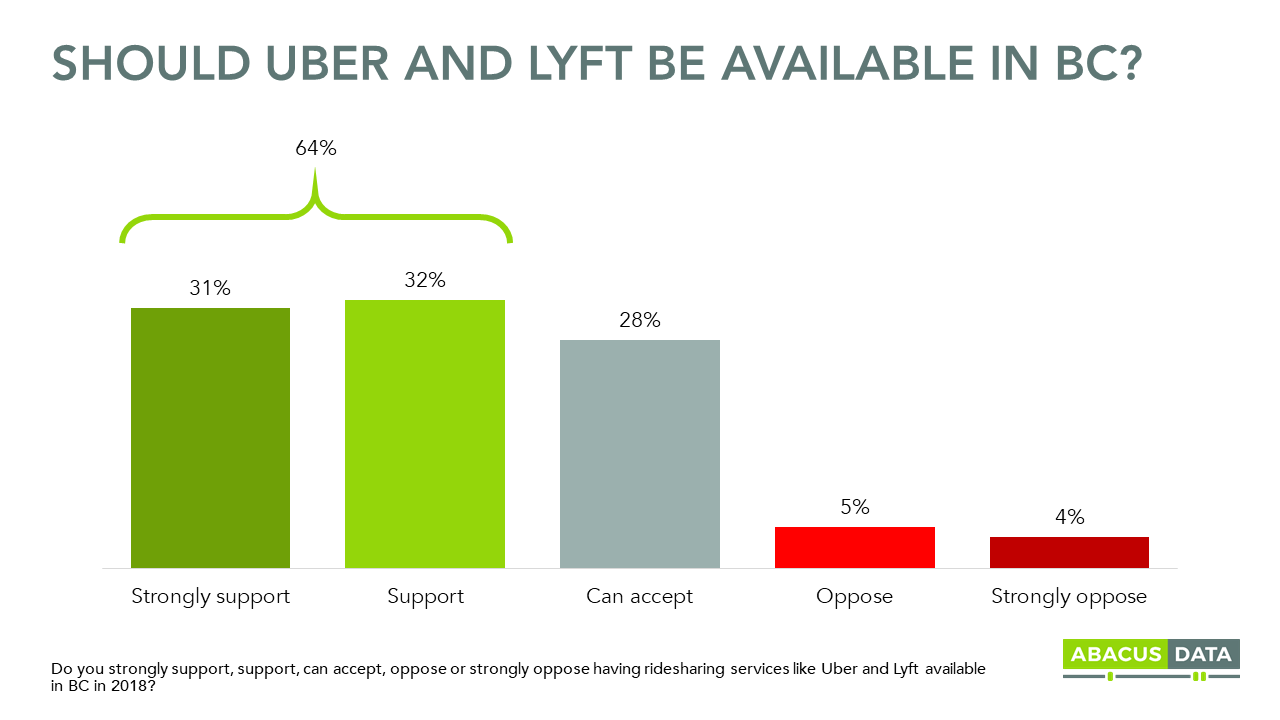
Residents living in the Greater Vancouver region are ready for ride sharing services in British Columbia, based on a survey of 546 residents, conducted for Ridesharing for BC over the past week.
Overall, 64% of residents strongly support (31%) or support (32%) having ride sharing services like Uber and Lyft available in BC in 2018. Another 28% accept the idea of the service being introduced. Only 9% are opposed.
Support is broadly based, crossing region, demographic, and political lines:
63% of BC NDP, 67% of BC Liberal, and 68% of BC Green Party voters.
Marginally higher in Vancouver (68%) but is also broad in surrounding municipalities (61% in Burnaby, New Westminster, Coquitlam, Port Coquitlam, North Vancouver, and West Vancouver and 59% in Delta, Surrey, Richmond, Langley, White Rock, and Maple Ridge).
Support is higher among those under 45 (70%) but opposition among older people is only 13%.
Opposition to making Lyft or Uber available was limited. 10% of those living in municipalities around Vancouver and 6% of those in Vancouver opposed making Uber or Lyft available in BC. Similarly, opposition was limited among BC NDP, BC Green, and BC Liberal voters.
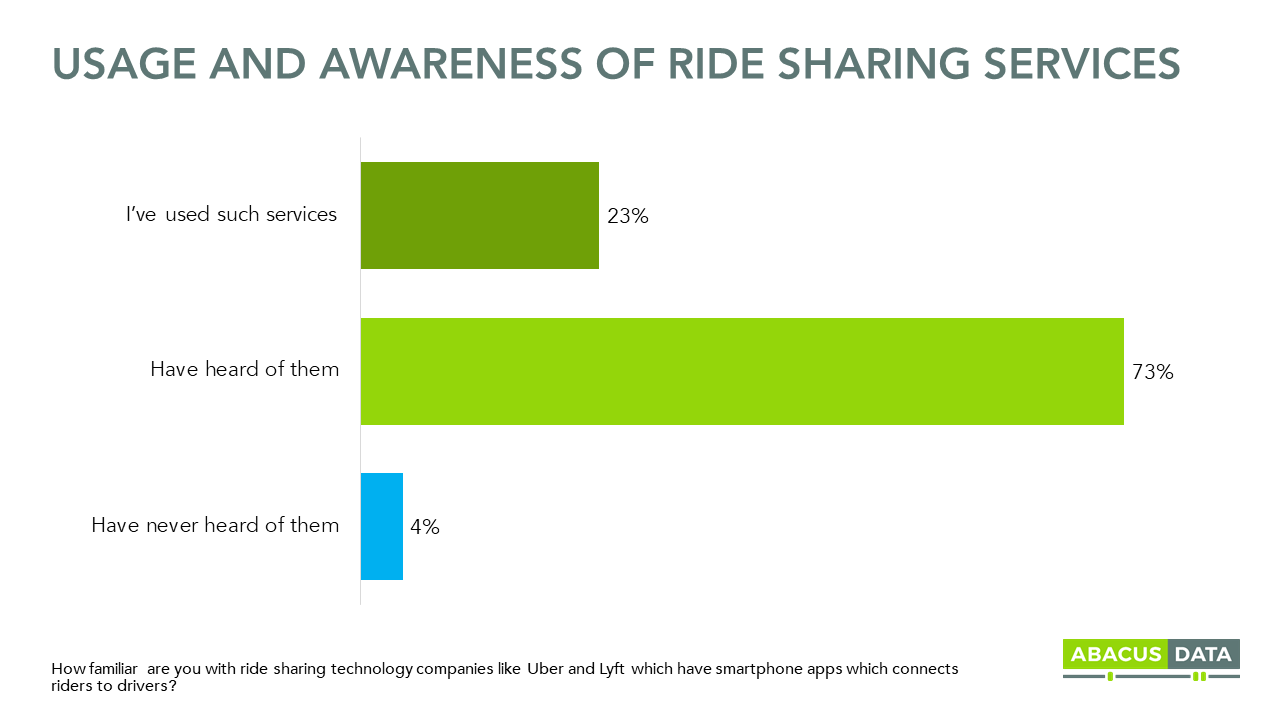
While these would be new services in the region, more than 95% have heard of them, and one in four (23%) have already used Uber or Lyft somewhere else.
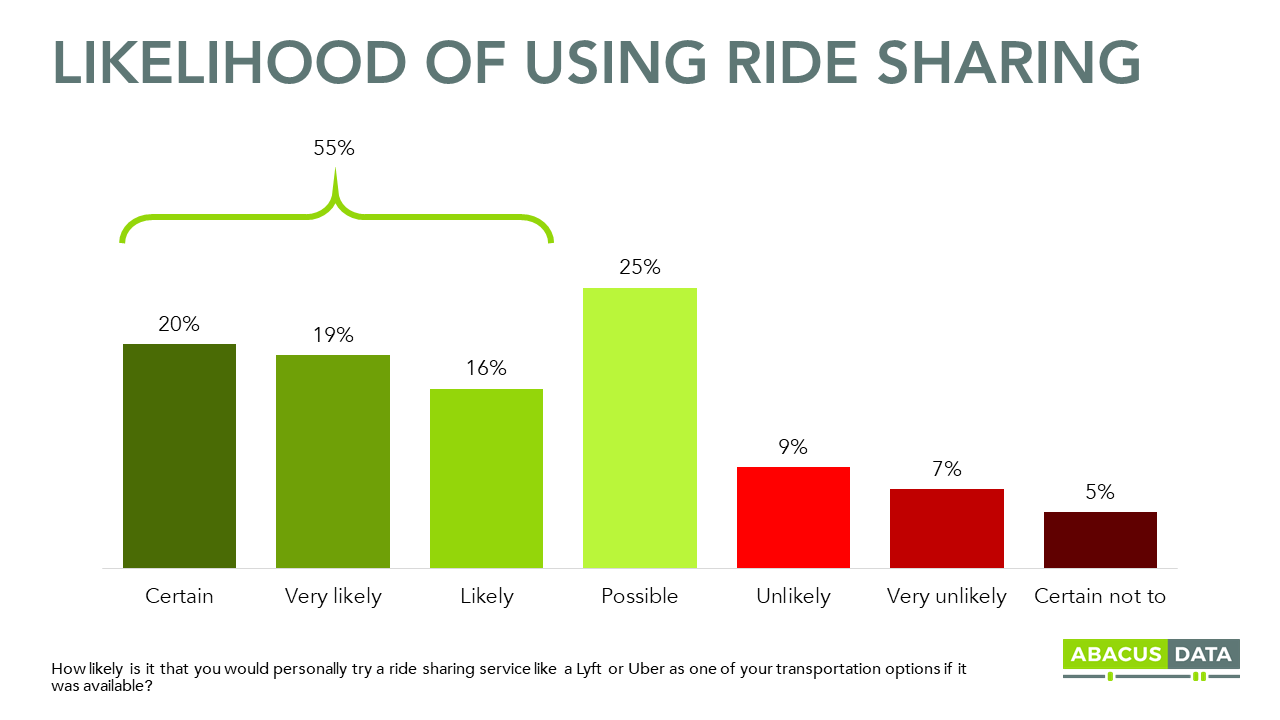
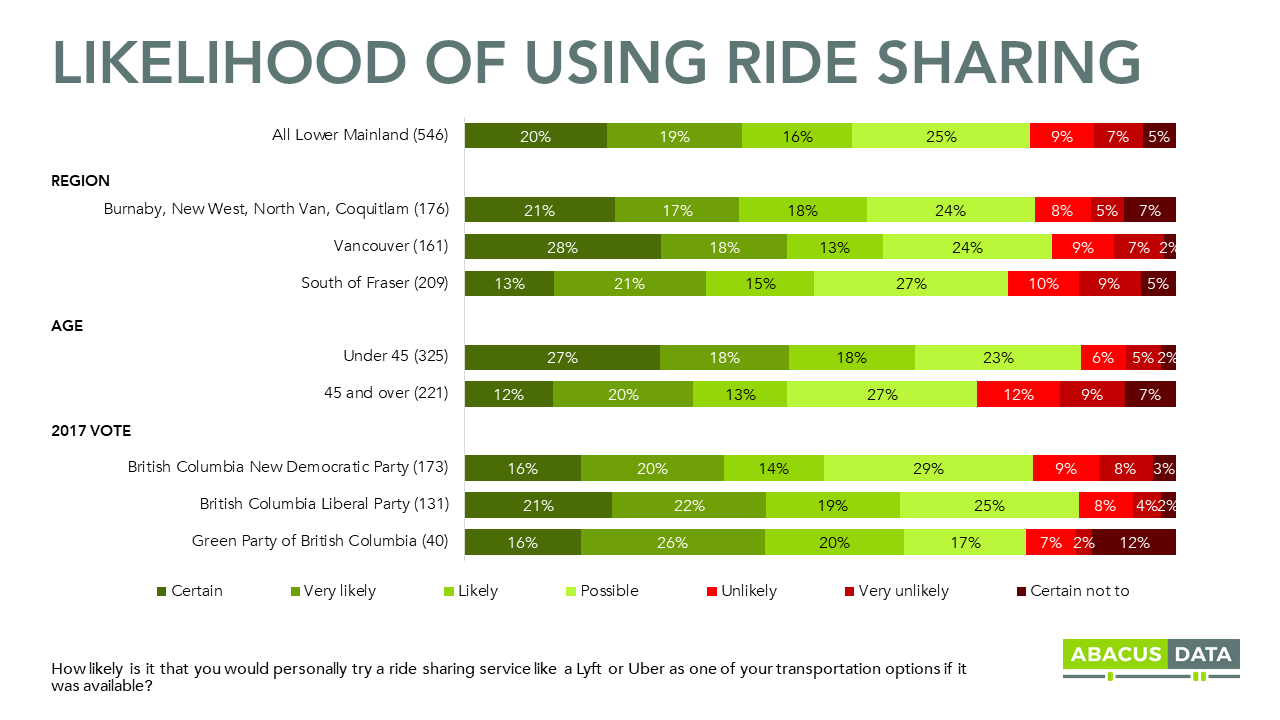
One in every two local residents (55%) say they are certain, very likely, or likely to personally try a ride sharing service like Lyft or Uber if available. Likelihood to use ride sharing is highest among younger people and Vancouver residents.
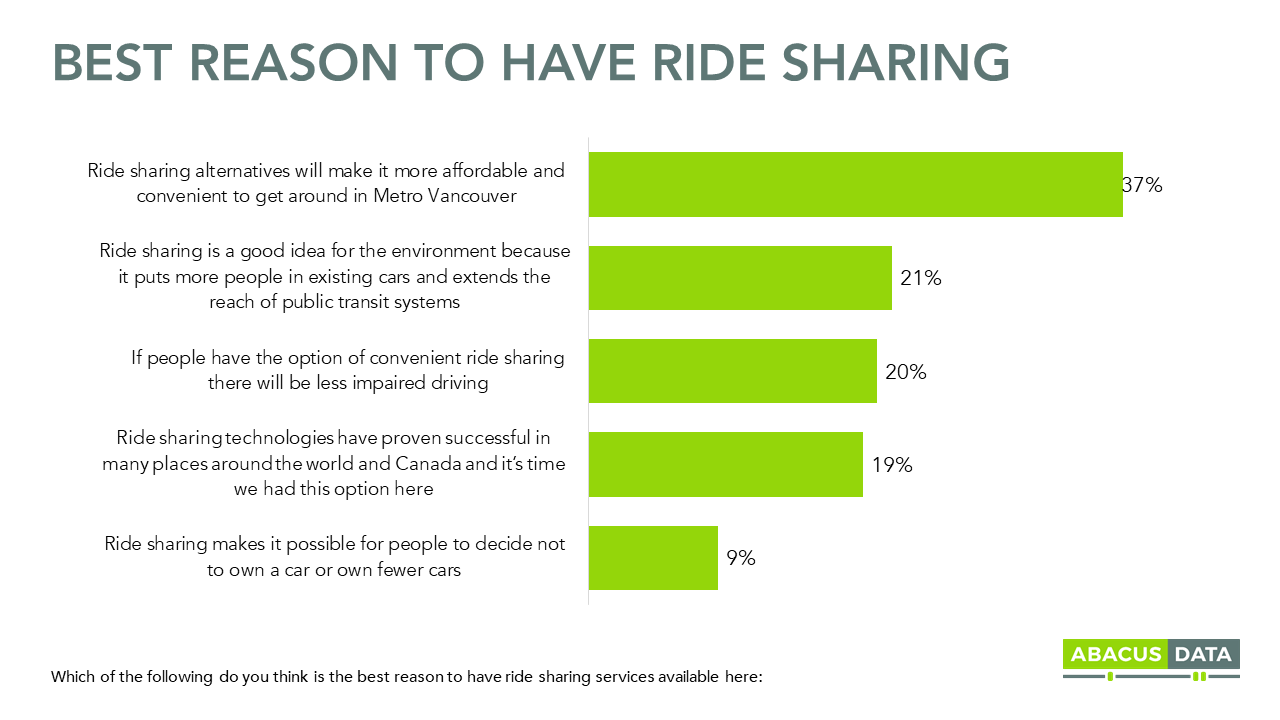
Residents see several good reasons for having ride sharing available: at the top of the list is affordability and convenience — but many also see it as a sustainability solution, and a help in the fight to limit impaired driving.
We also found broad interest in driving for a ridesharing service. 74% of respondents felt that being able to earn extra money as driver for Uber or Lyft was a good argument to allow ride sharing services to operate in the province.
UPSHOT
“The introduction of ride sharing services like Uber and Lyft is not a controversial idea for residents of the Greater Vancouver area. Lots of people imagine that they would use these services, and opposition to their introduction is very limited. People feel that there would be benefits in terms of affordability and convenience and upsides in terms of environmental issues and impaired driving. This doesn’t look like tentative or conditional support – but more like people who are ready for this change to happen in the local marketplace.”
METHODOLOGY
The survey was conducted online with 546 adult residents of Greater Vancouver from February 5 to 12, 2018. A random sample of panelists was invited to complete the survey from a set of partner panels based on the Lucid exchange platform. These partners are typically double opt-in survey panels, blended to manage out potential skews in the data from a sole source
The Marketing Research and Intelligence Association policy limits statements about margins of sampling error for most online surveys. The margin of error for a comparable probability-based random sample of the same size is +/- 4.6%, 19 times out of 20.
The data were weighted according to census data to ensure that the sample matched Canada’s population according to age, gender, educational attainment, and region. Totals may not add up to 100 due to rounding.
ABACUS DATA INC.
We offer global research capacity with a strong focus on customer service, attention to detail and value-added insight. Our team combines the experience of our Chairman Bruce Anderson, one of Canada’s leading research executives for two decades, with the energy, creativity and research expertise of CEO David Coletto, Ph.D.
On Friday, I participated in a panel discussion at the Manning Networking Conference in Ottawa. The title of the panel was Spotlight on The Next 10% and we discussed how the federal Conservative Party might grow towards winning the next election in 2019.
In preparing for that panel, I had a quick look at some recent public opinion data Abacus Data collected earlier this year.
In January, we interviewed over 1,450 Canadian adults and asked our core political questions plus a number of other questions meant to understand their broader political attitudes.
And here’s the basis of my analysis:
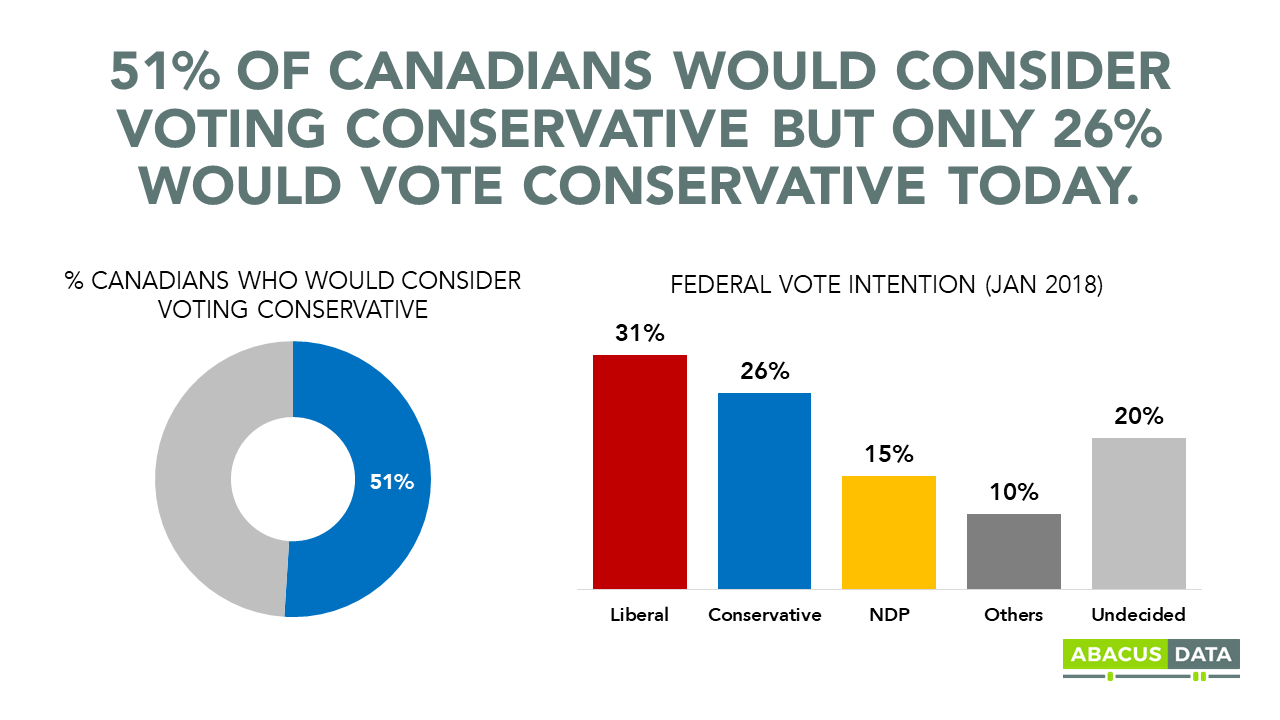
51% of Canadians are open to voting Conservative. This is the accessible pool of voters available to the Conservative Party. This pool is about the same size as the NDP (50%) and smaller than the Liberal Party’s (56%).
This pool of accessible voters has increased since the 2015 election. In November 2015, only 42% of Canadians said they would consider voting Conservative. Today its about 8 points higher.
At the same time, 26% of Canadians said they would vote Conservative if an election was held at the time of the survey. That’s five points fewer than the Liberals and 11 points more the NDP. 20% overall said they were undecided.
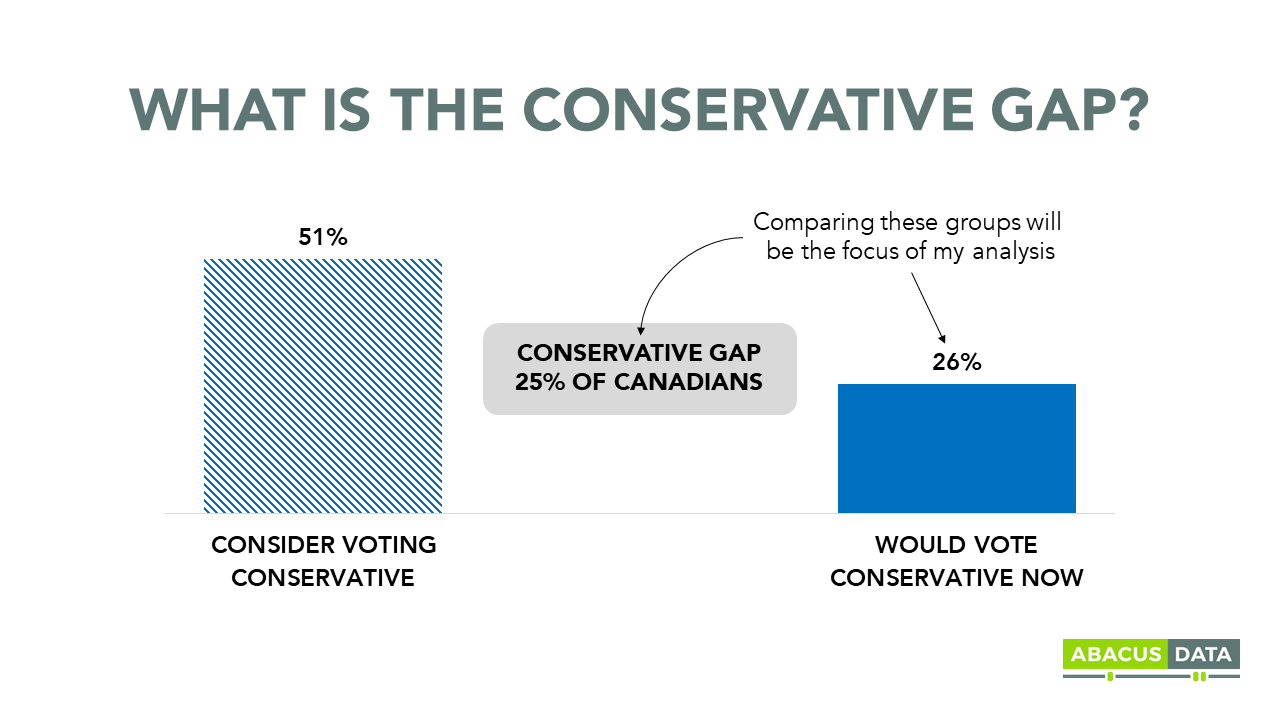
It’s this 25-point gap between those open to voting Conservative and those who would actually vote Conservative that I find interesting. In order to win in 2019, the Conservative will need to find a way to hold their current support base together while finding a way to convert about half of those who are currently open to voting for them but are either committed to another party or undecided. I call these eligible voters potential Conservative supporters.
By comparing those who currently support the party with those potential supporters, we might better understand what the party needs to do and who it needs to attract to grow its support.
Here’s what I see:
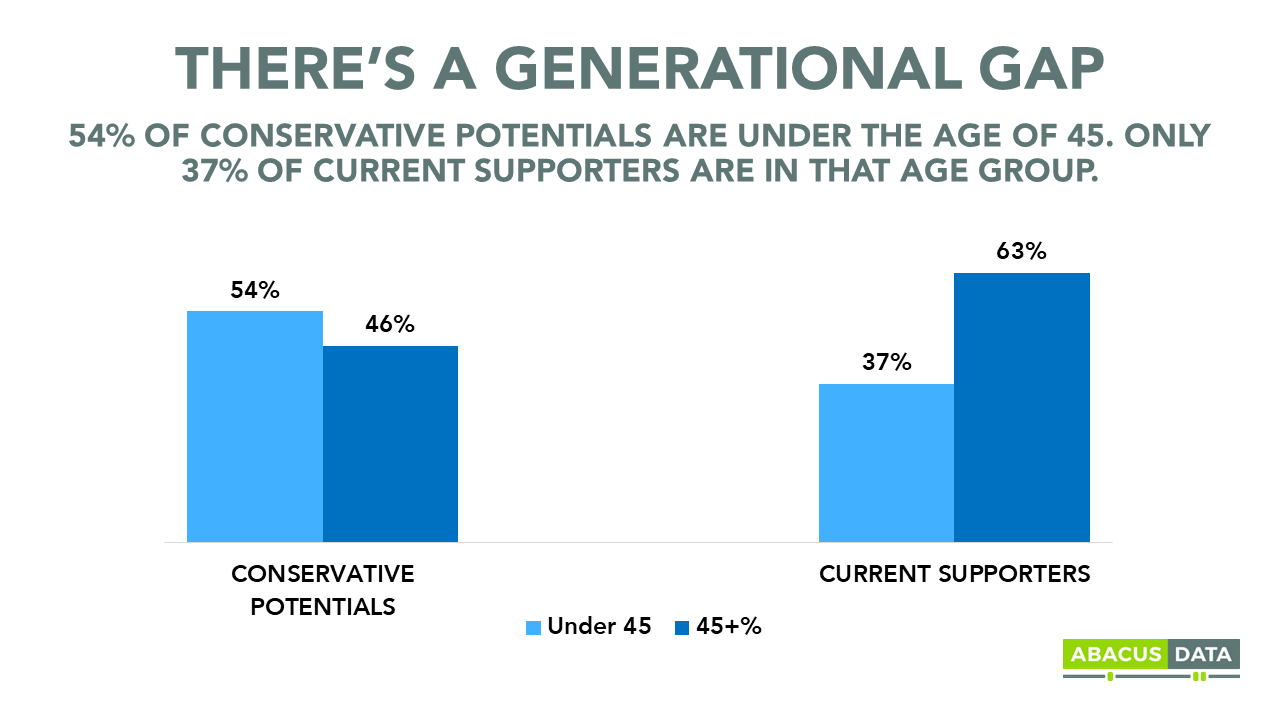
Current Conservative supporters are older than the group it needs to convert. Finding a way to engage and connect with Canadians under 45 is not a necessity to win, but failing to convert at least some of them will make it harder to do so. Remember, in 2019 all Millennials will be eligible to vote and they will make up the largest generational cohort in the electorate, Conservatives don’t need to win this group, but they have to do better than they did in 2015.
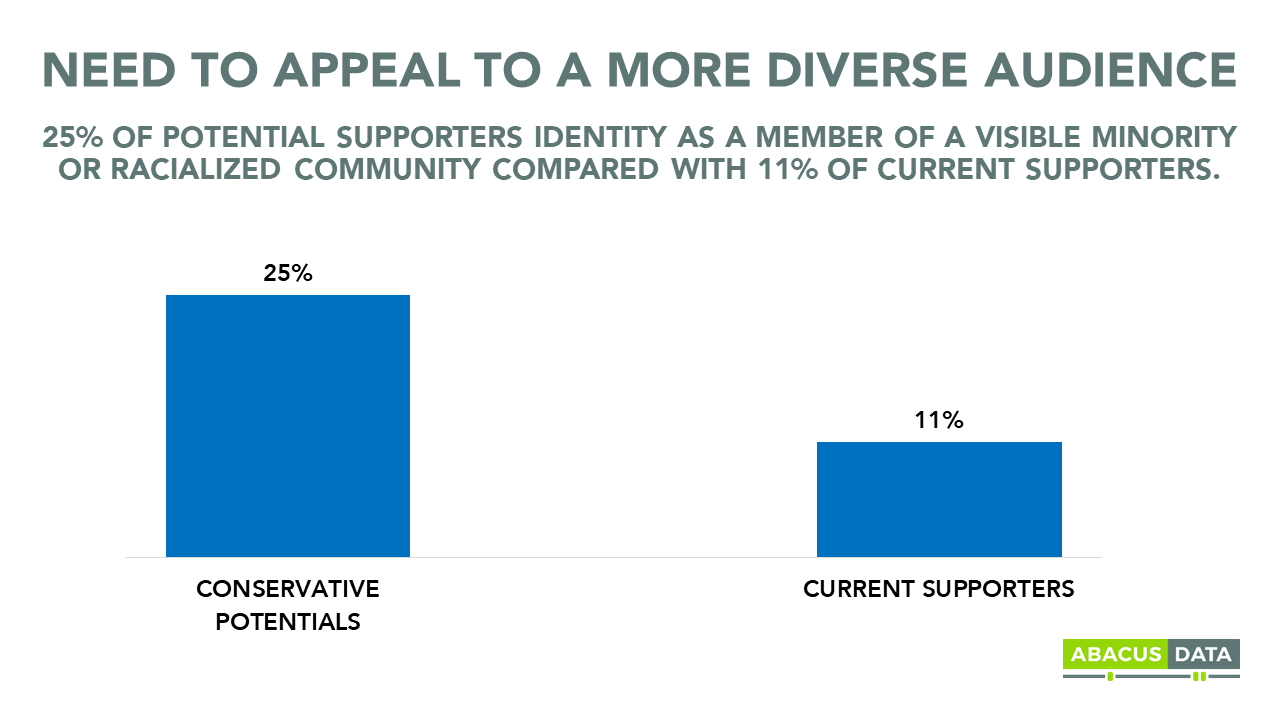
Potential supporters are more diverse ethnically than current supporters. Only 11% of current Conservative supporters identify as a member of a visible minority or racialized group compared with 25% among its potential support group. Appearing open to diversity and immigration worked well for the party in the past. Since the 2015 election, the Conservatives have not made much ground in growing support among this important and expanding voter group.
Housing affordability is a top issue to many Canadians, especially younger ones looking to enter the market. A third of potential voters are currently renters, almost 9-points more than among Conservative supporters. What is the party’s answer to the affordability crisis in the housing market?
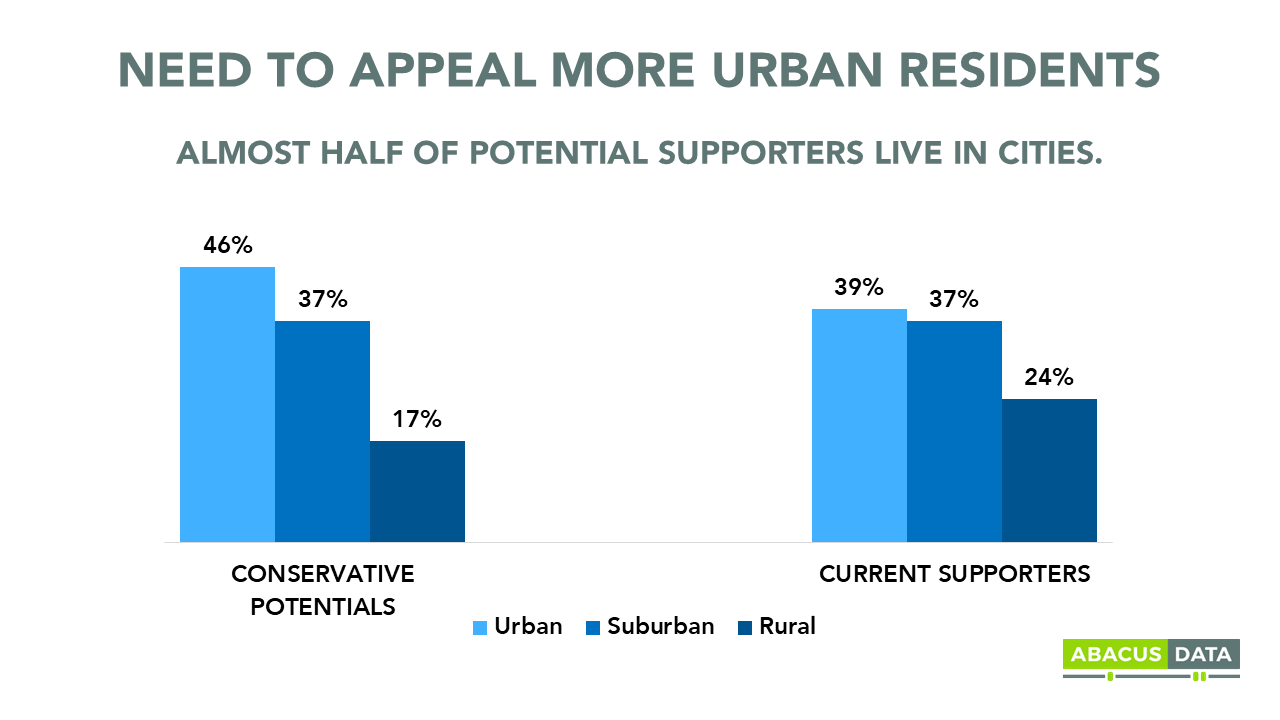
At the same time, potential Conservative supporters are more likely to live in cities than those currently supporting the party. Growing the party’s appeal to urban voters is important if it hopes to expand support. Issues around transit, traffic congestion, affordability and quality of life matter to these potential supporters.
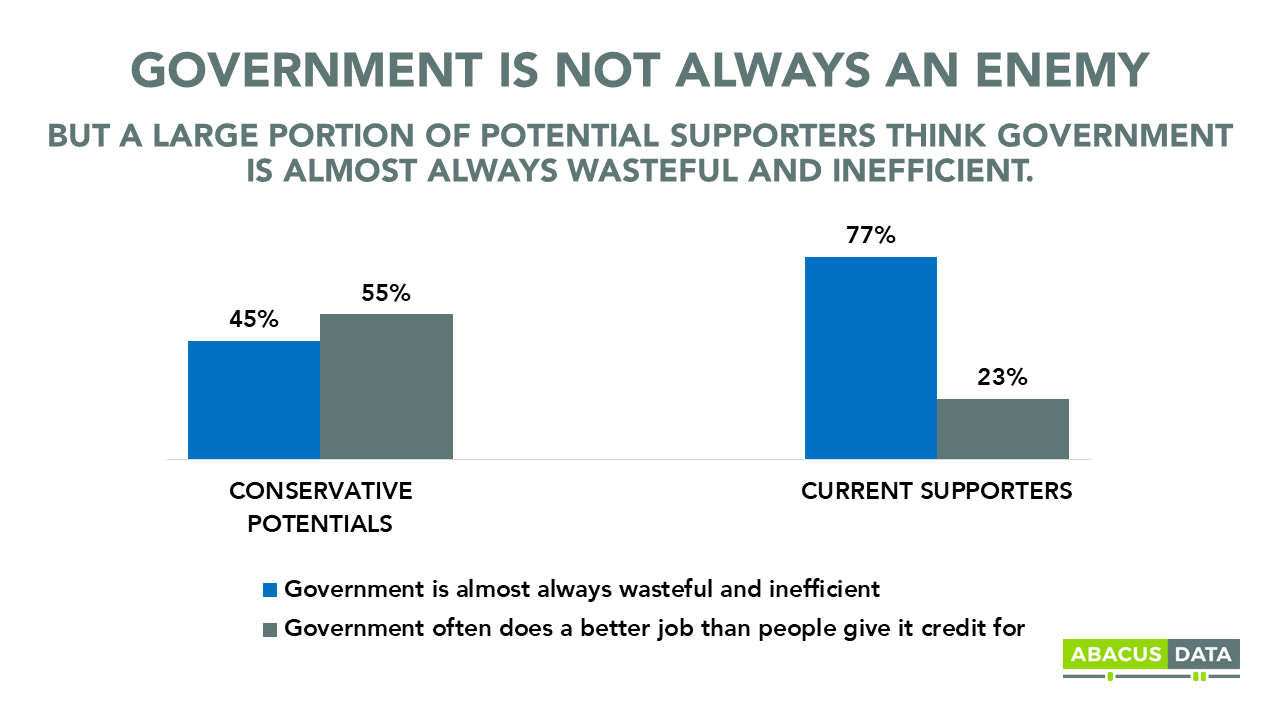
Most Conservative supporters (77%) believe that government is almost always wasteful and inefficient while only 45% of potential supporters feel the same way. Many see a role for government, especially in evening out the inadequacies of the market.
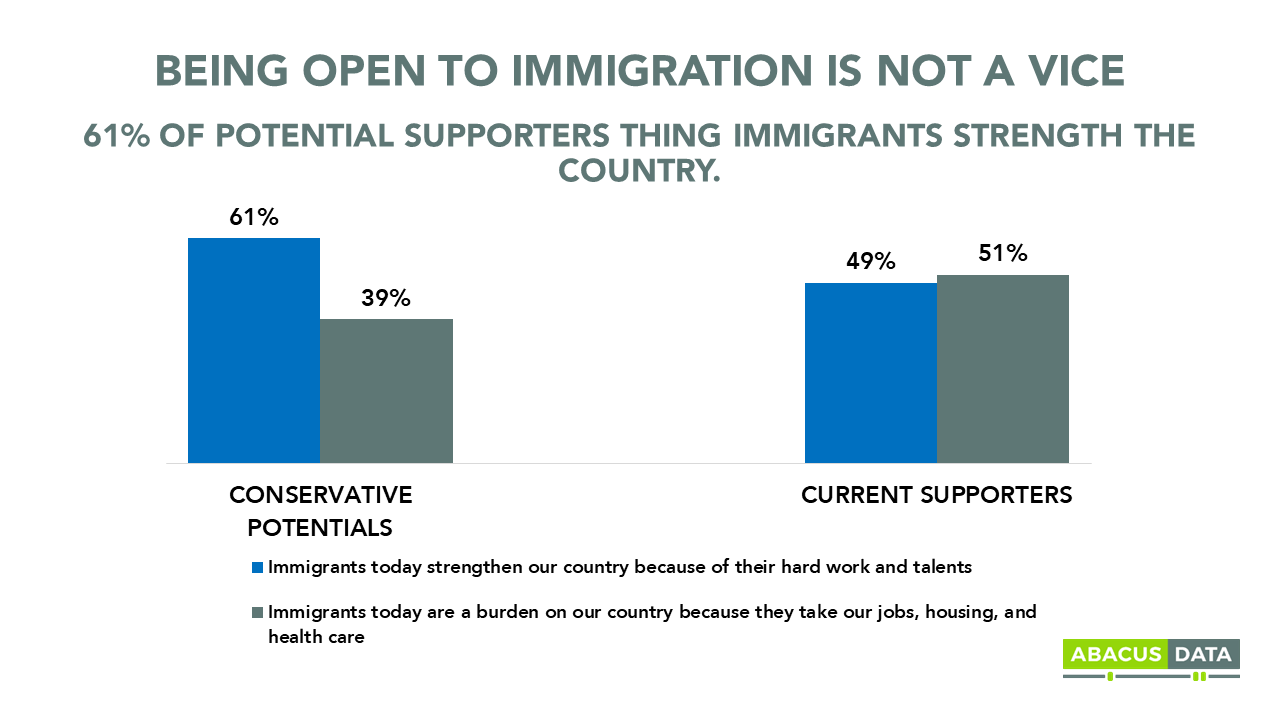
Conservative supporters are split on the impact of immigration on the country but potential supporters are more likely to believe immigrants strengthen the country. Potential supporters are also more likely to feel that diversity is a virtue as opposed to a vice in Canada.
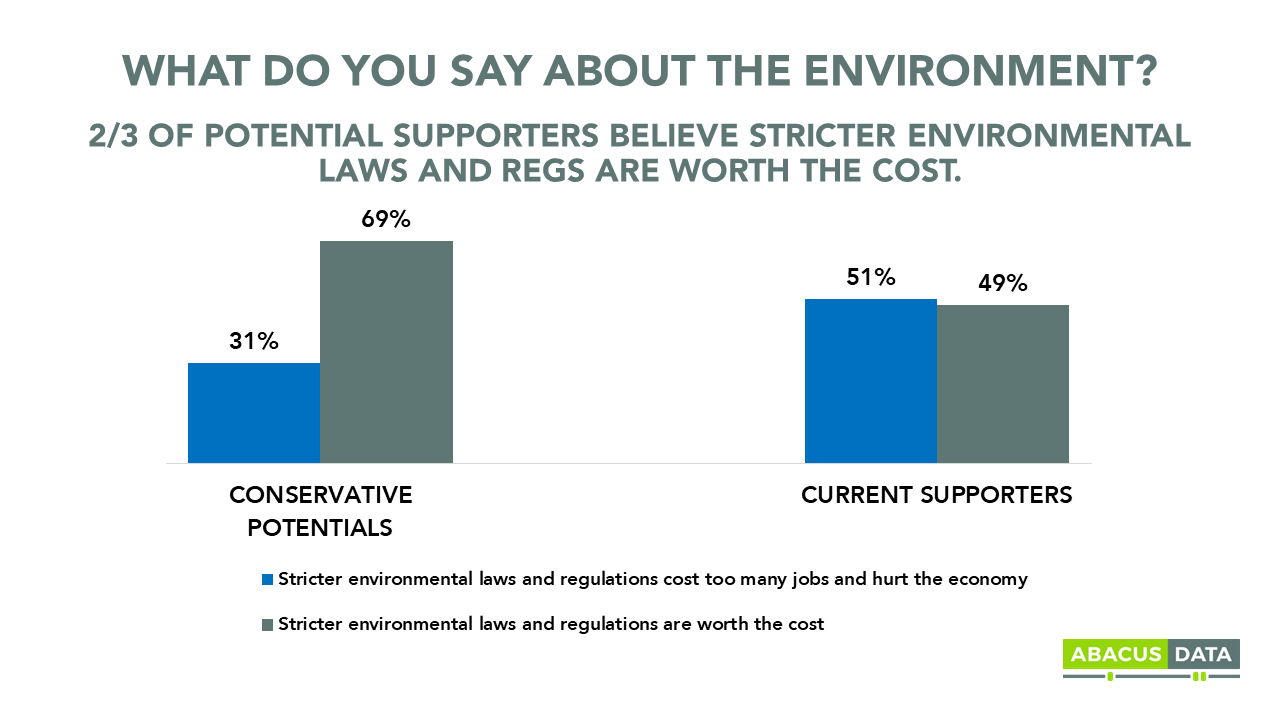
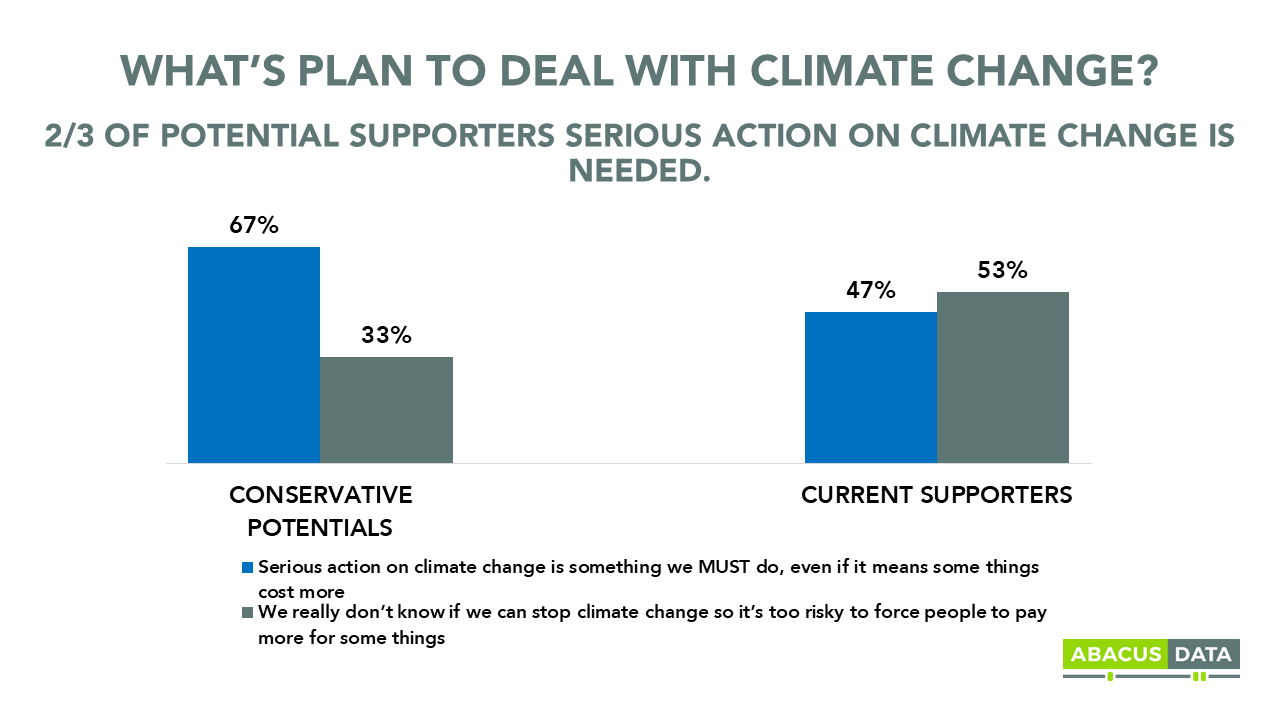
Perhaps where Conservative supporters and potential supporters are split the most are on issues related to the environment and climate change. 69% of potential supporters believe that stricter environmental laws and regulations are worth the cost compared with 49% of Conservative supporters. Likewise, two thirds of potential supporters believe that serious action is needed on climate change, even if it means some things cost more. 47% of Conservative supporters feel the same way.
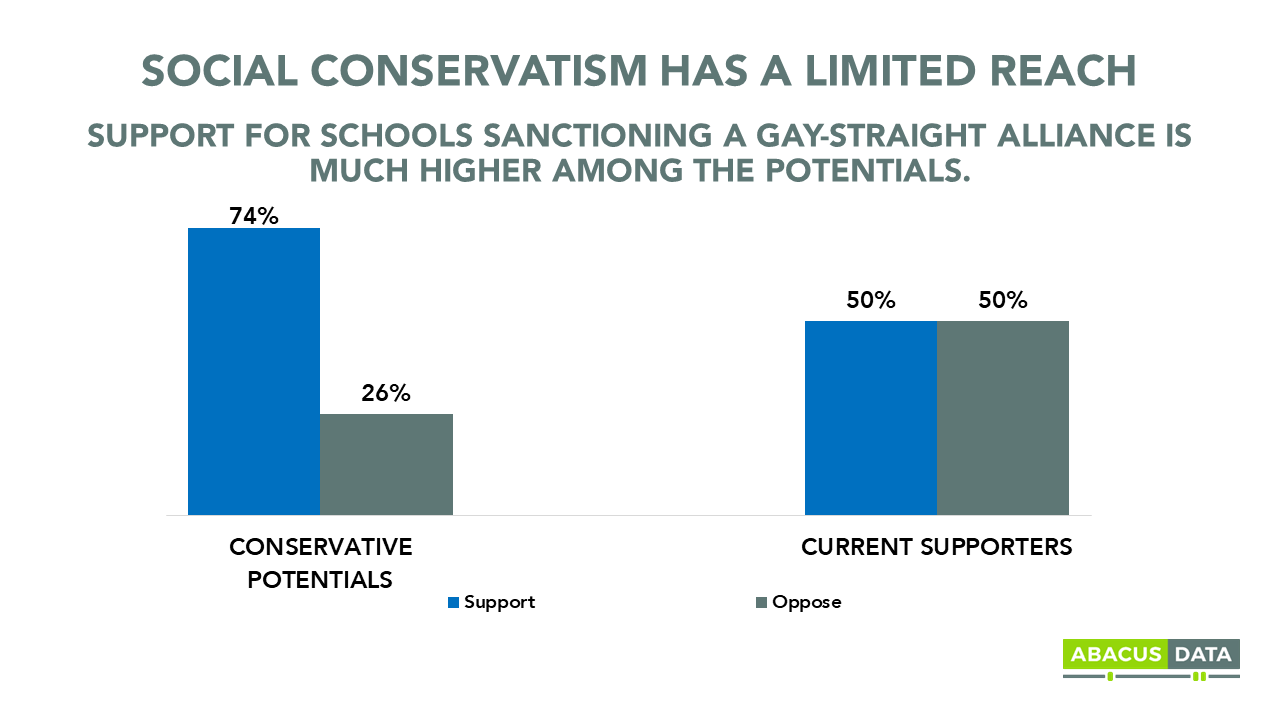
Social conservatism has its limits. There’s a shrinking audience for political leaders who don’t treat all people equally. As an example, look at the gap in support for schools sanctioning gay-straight alliances.
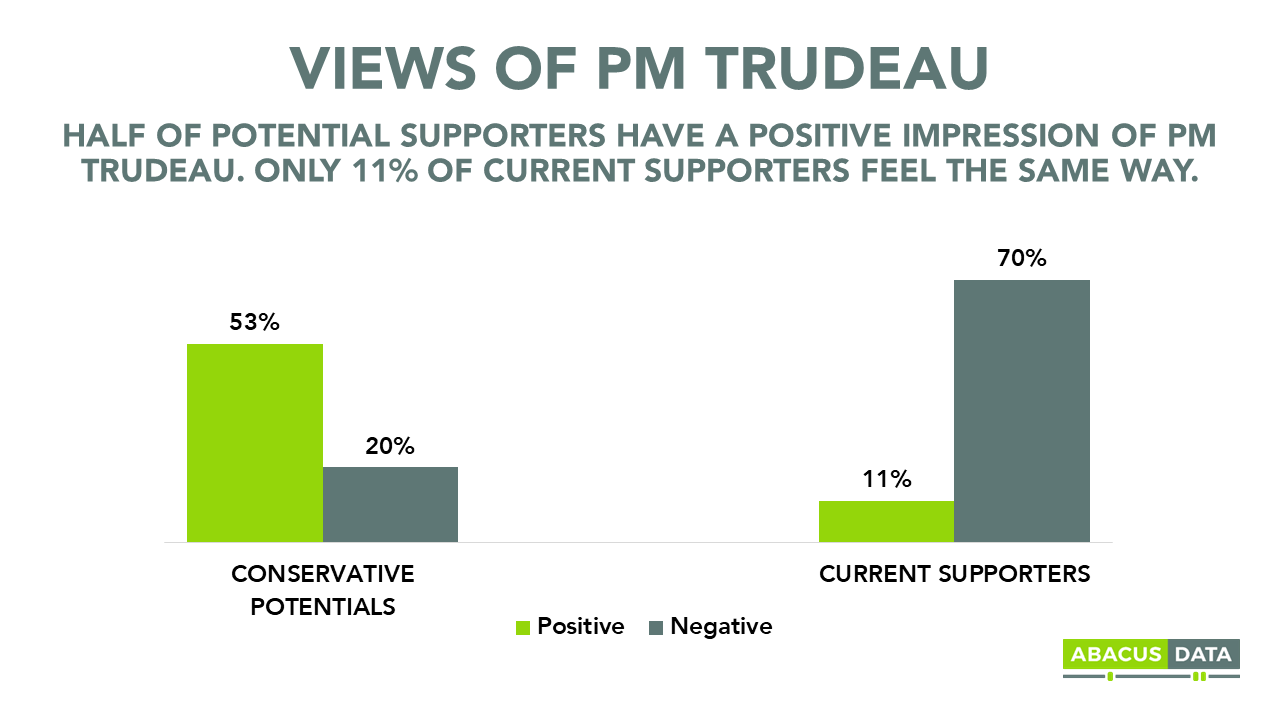
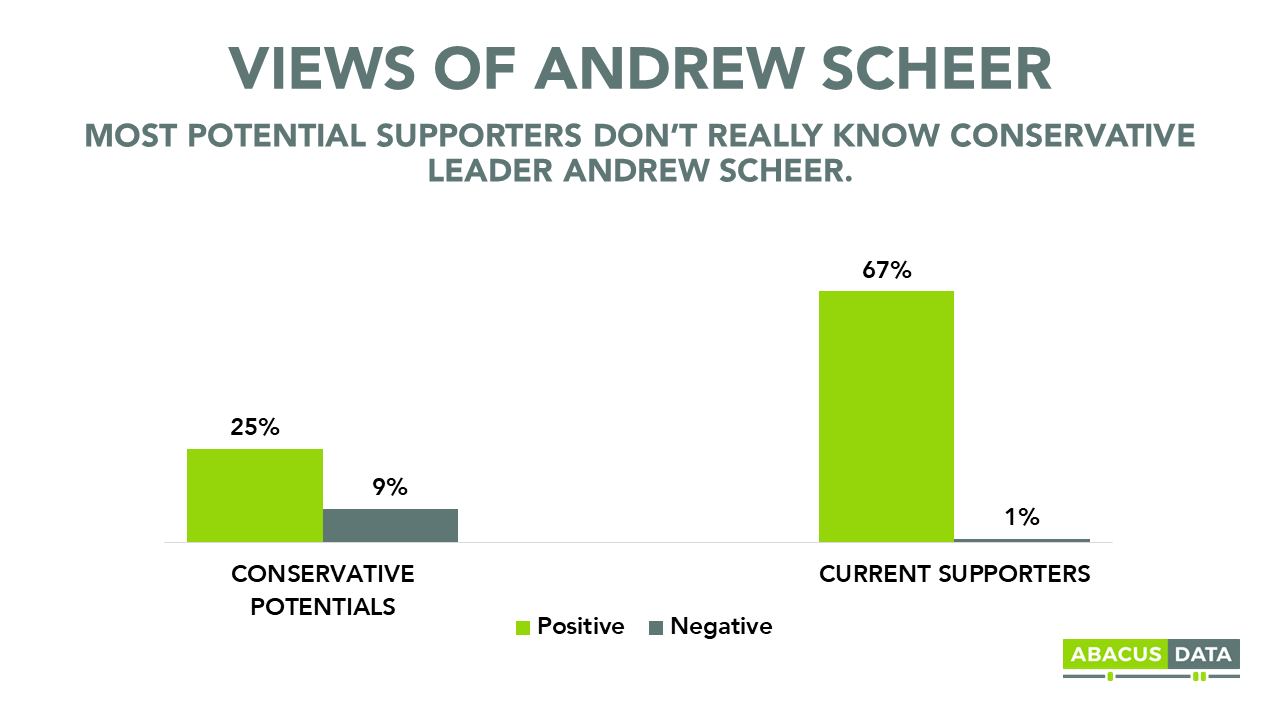
Finally, when it comes to how both groups feel about political leaders in the country, there’s quite a large gap. While Conservative supporters almost unanimously have a negative view of Prime Minister Trudeau, only 20% of potential supporters feel this way. And while Mr. Scheer is well likely among current Conservative supporters, he remains a largely undefined figured in the minds of those open to voting Conservative.
THE UPSHOT
These results suggest that the Conservative Party does have a path back to power. And it doesn’t mean it has to move completely to the centre and mimic the Liberal Party. I think it means its leaders have to talk about the big questions of our day: equality, climate change, and economic security.
But to do so, a few things likely have to occur.
First, impressions of Mr. Trudeau must change among those open to voting Conservative. Right now, only 20% have a negative view with a majority feeling positive about the Prime Minister. At the same time, Mr. Scheer needs to introduce himself to this group, build a relationship, and demonstrate he’s a viable alternative as Prime Minister.
Second, while there is runway for the Conservatives to appeal to the more conservative and populist elements of the potential supporter group, such a strategy requires converting almost all of those who share views with the majority of Conservative supporters.
In contrast, a route more likely to “widen the tent” may be one in which the party better aligns with these potential supporters on some key issues. It needs to be seen as having a credible plan to deal with climate change. It has to offer an open minded and welcoming attitude to those from more diverse backgrounds and different lifestyles and it needs to offer conservative solutions to those living in cities and among younger Canadians.
Unless the party can appeal more broadly to these groups, the road to majority is tenuous at best.
Half of NL residents think the province is likely to go bankrupt in the new few years. Most are looking for political leadership to solve the crisis.
There’s a clear sense that something must change or else the outcome will be catastrophic for Newfoundland and Labrador.
That’s the message we heard in a recent survey Abacus Data conducted in Newfoundland and Labrador that explored how residents feel about the future of their province, the challenges it faces today, and the political will needed to turn things around.
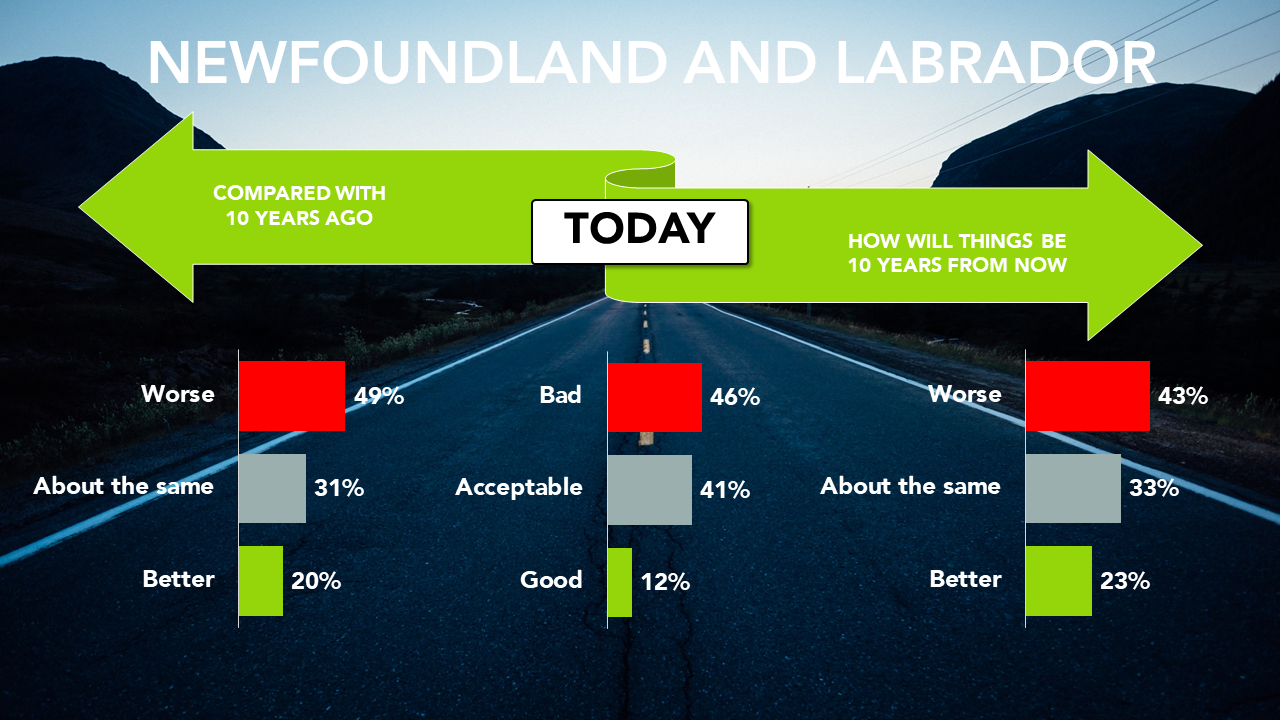
The level of anxiety is quite elevated across the province. Almost half feel that life in the province has become worse over the last 10 years, about half describe things in the province as pretty bad or horrible, and only one in four residents are optimistic that things will get better over the next 10 years.
So, what’s driving this anxiousness?
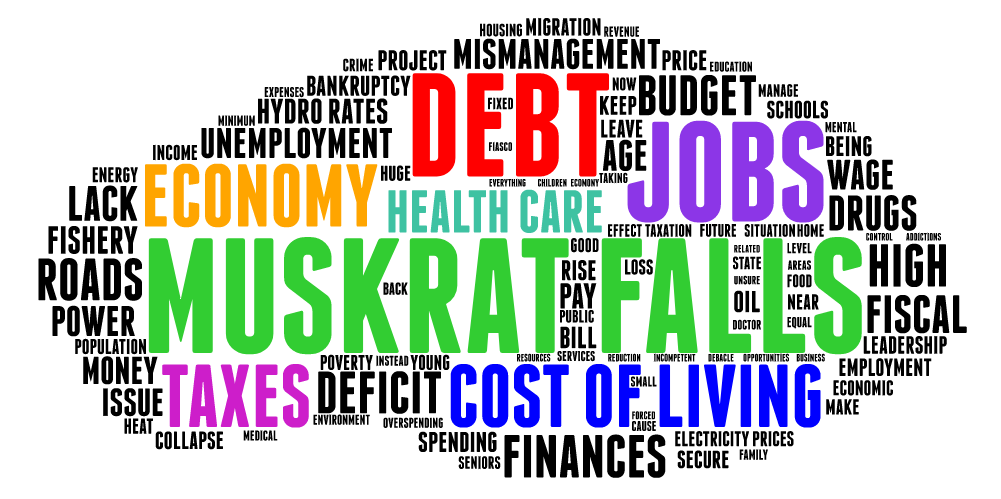
When we ask residents to identify the most important issue facing the province today, a few issues are mentioned more than others. Muskrat Falls, provincial debt, jobs, the economy, cost of living, taxes, and healthcare are mentioned by large numbers of people.
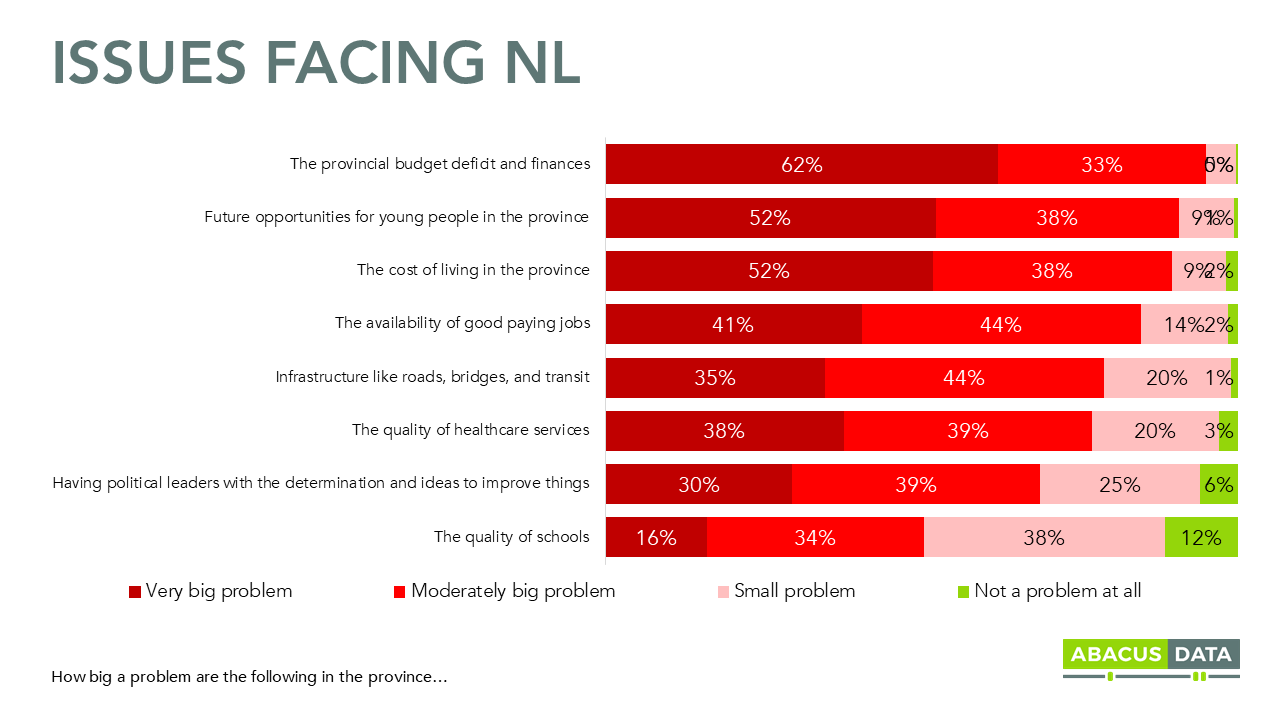
When we ask residents to diagnosis the problems facing Newfoundland and Labrador, majorities point to the provincial deficit and finances, future opportunities for young people in the province, and the cost of living as “very big problems”. In fact, except for the quality of schools, at least three in ten residents felt that all issues were very big problems.
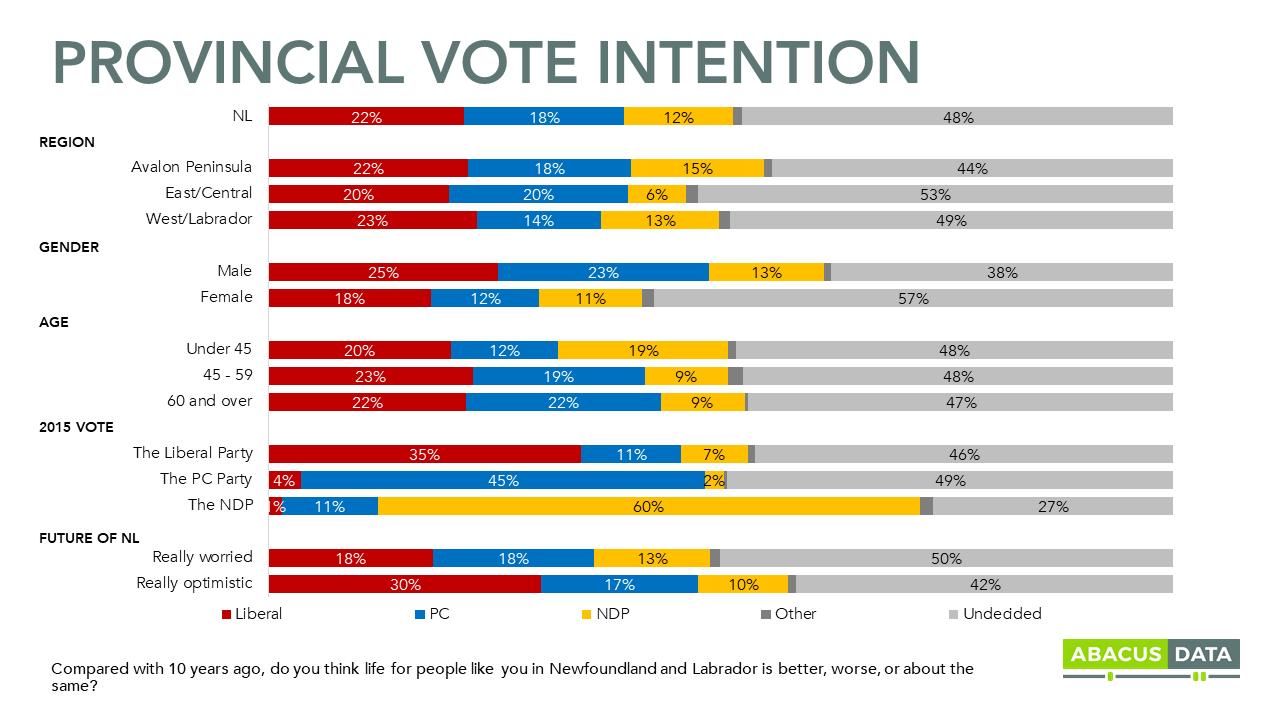
And what’s striking about the results is the level of consensus across different regions, age groups, and partisan leanings. For example, while 62% of NL residents felt the provincial budget deficit and finances were a very big problem for the province – that view was shared most of all by those who voted NDP in 2015 (79%) but was the majority view among PC (64%) and Liberal (57%) voters.
Not surprisingly, younger residents were more likely to feel that the availability of good paying jobs was a very big problem while older residents were more inclined to feel the budget deficit was a very big problem.
PERCEPTIONS ABOUT PROVINCIAL FINANCES
Recently, there were news reports that found the province was on the brink of not being able to pay government employees in 2016. Almost half of residents were aware of this news.
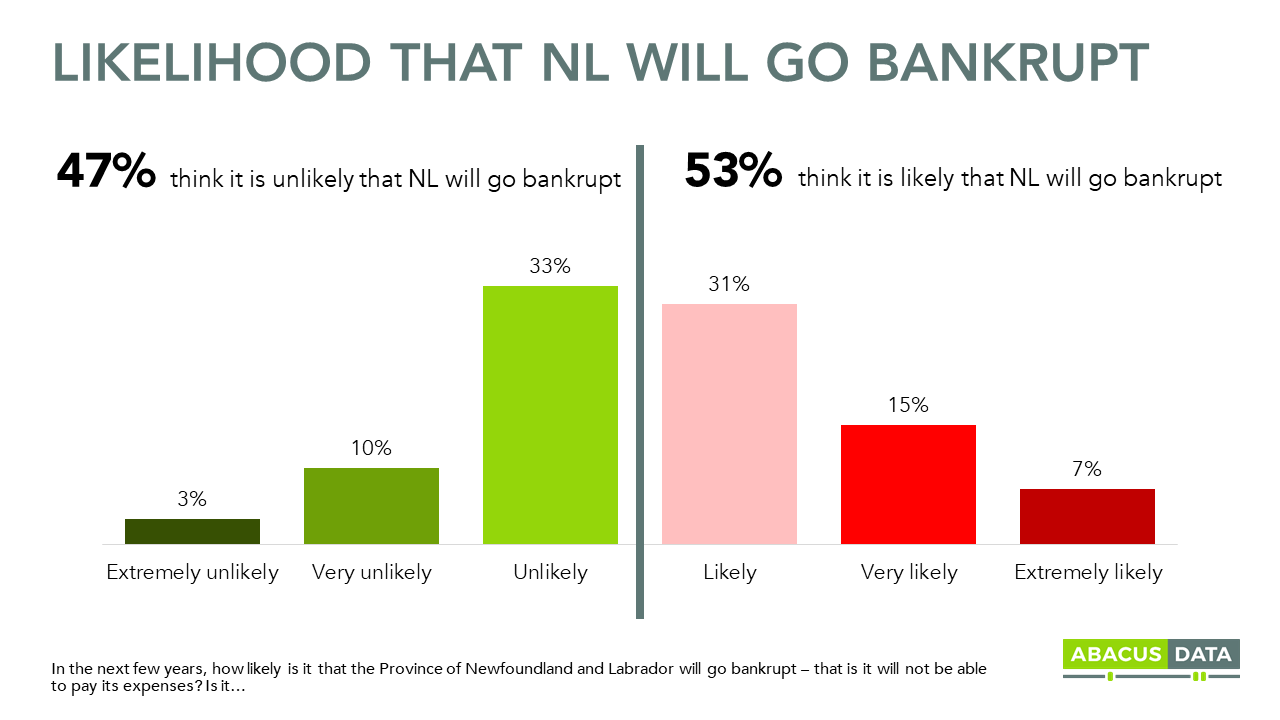
Most striking of all though is that a majority of Newfoundland and Labrador residents think it is likely that the province will go bankrupt in the new few years with 22% thinking it is either very or extremely likely to happen.
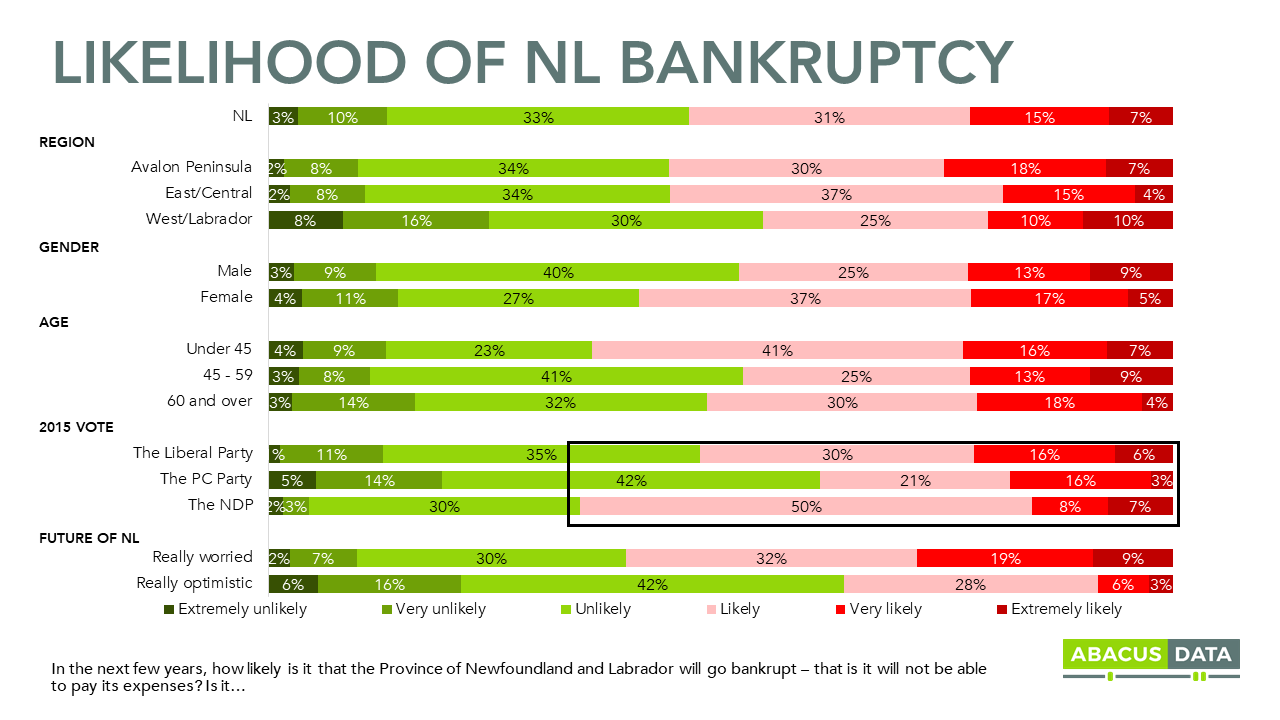
And this alarm is not isolated to opposition party supporters. In fact, PC Party voters were the least likely to think the province was likely to go bankrupt (40%) while NDP (65%) and Liberal Party (52%) were more likely to think provincial bankruptcy was likely to happen.
There was more concern among younger residents (those under 45) with 64% feeling the province was likely to go bankrupt.
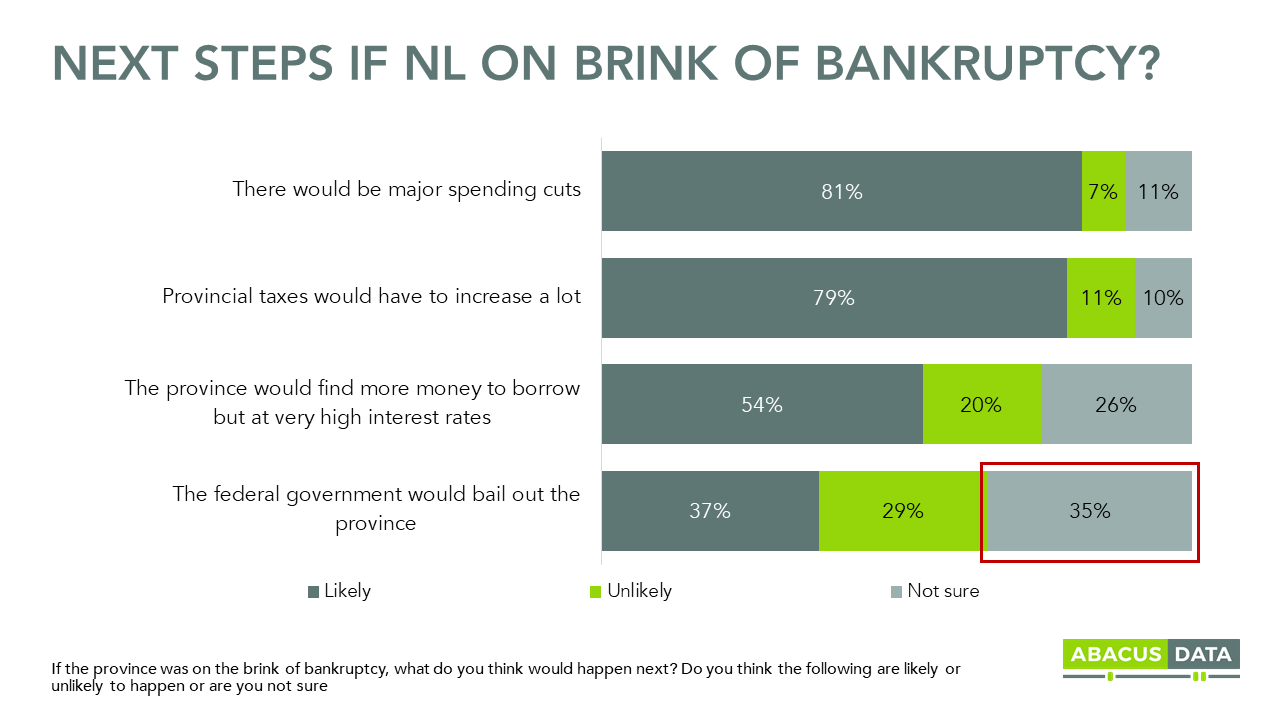
Next, we asked respondents what would likely happen if the province was on the brink of bankruptcy. Most felt that there would have to be major spending cuts and provincial taxes would have to increase a lot. A majority also felt that the province would find more money to borrow but at very high-interest rates.
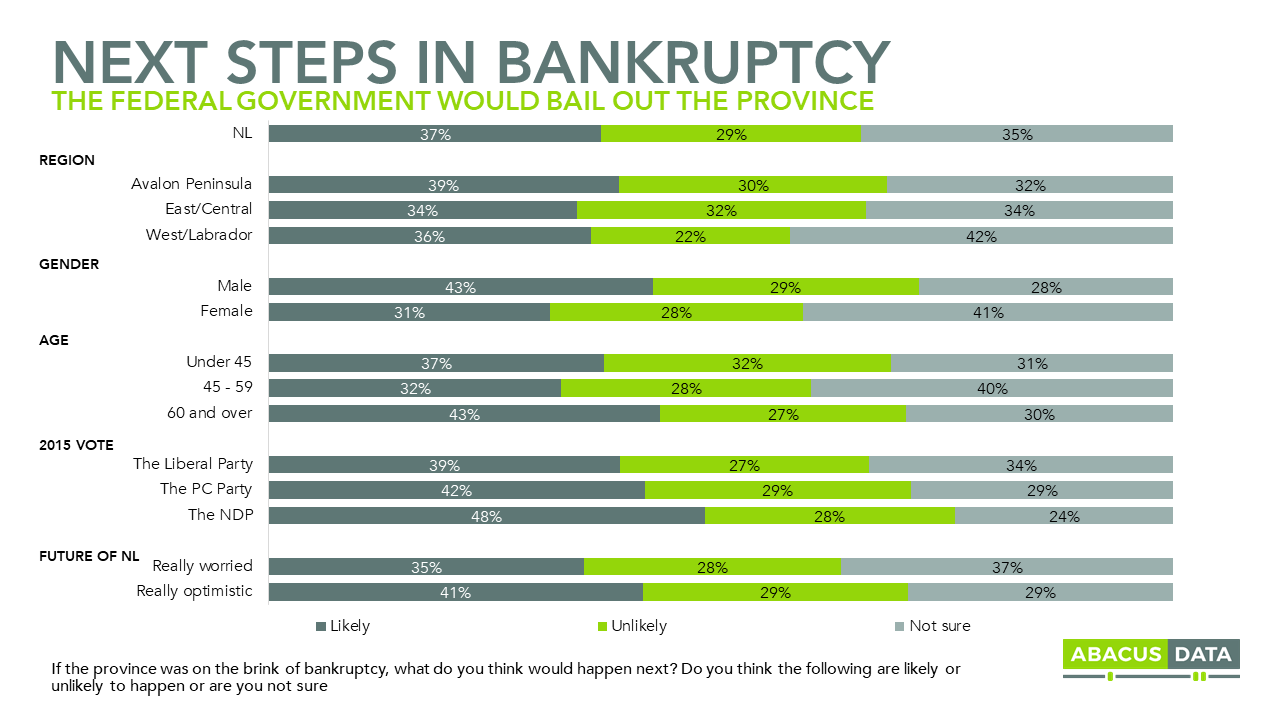
Perhaps most interesting was opinions about the likelihood of a federal government bailout of the province. Province-wide 37% felt a bailout was likely compared with 29% who felt it was unlikely to happen. 35% were unsure whether a federal bailout would likely happen or not.
Older residents were more likely to think a bailout was likely than younger residents, while NDP voters (43%) were more likely than Liberal voters (39%) to think it was likely to happen.
NEWFOUNDLAND AND LABRADOR IN THE NEXT 20 YEARS
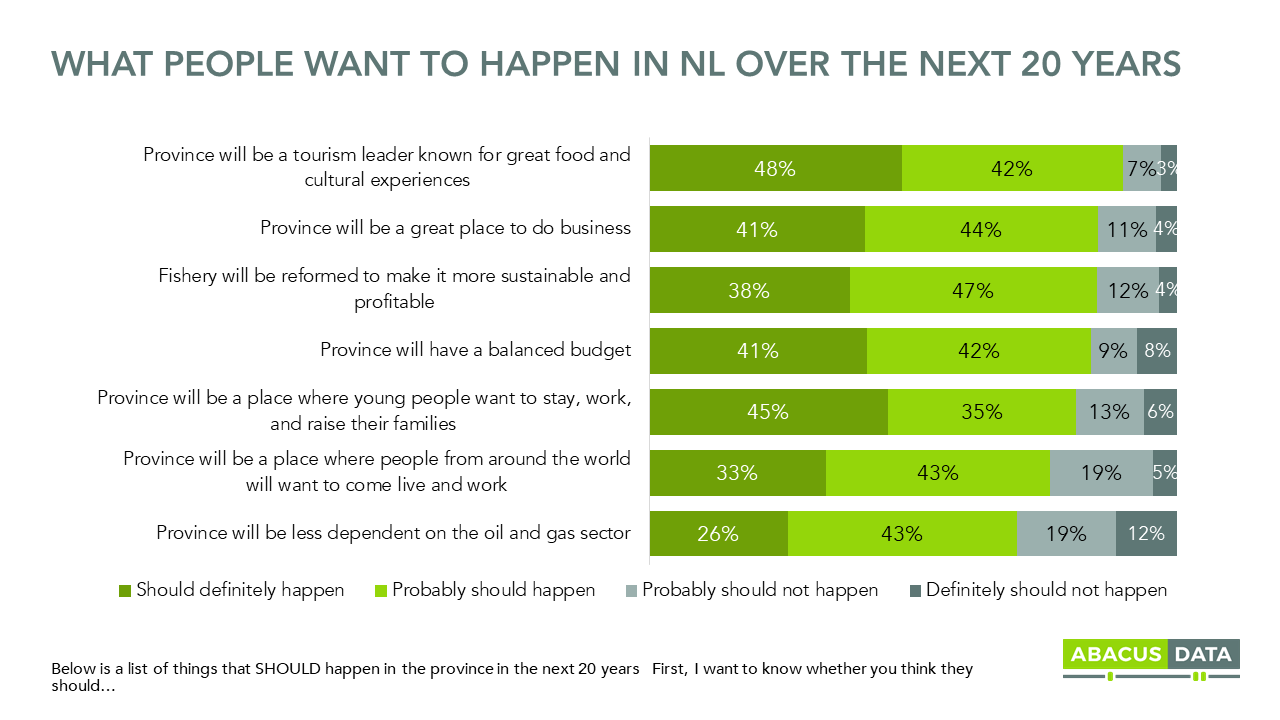
Later in the survey, we asked respondents whether they thought several things should happen and whether those same outcomes are likely to happen.
Overall, we found that people generally want the province to become a tourism leader, they want the fishery to be reformed, they want the province to be a great place to do business and for young people to come establish themselves and they want a balanced budget. Fewer say they want the province to become less dependent on the oil and gas sector although a clear majority (69%) think it definitely or probably should happen in the next 20 years.
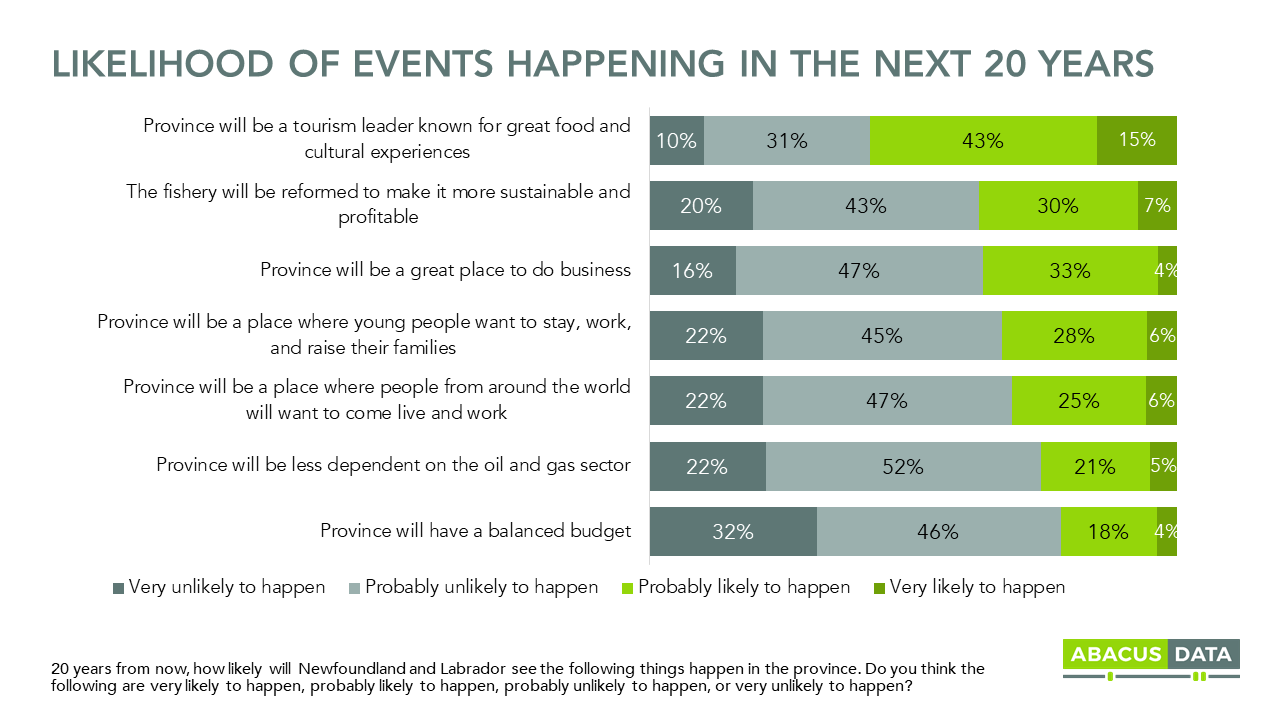
But when we ask whether they think these same things will happen, few are optimistic, especially when it comes to balancing the budget and positioning the province as a good place to do business. Most residents feel that the province will be a tourism leader known for great food and cultural experiences but only a minority feel that it will be a good place to do business, to raise a family or work, or attractive to people from around the world. And perhaps most striking is the fact that 78% think that the province will not have a balanced budget in the next 20 years.
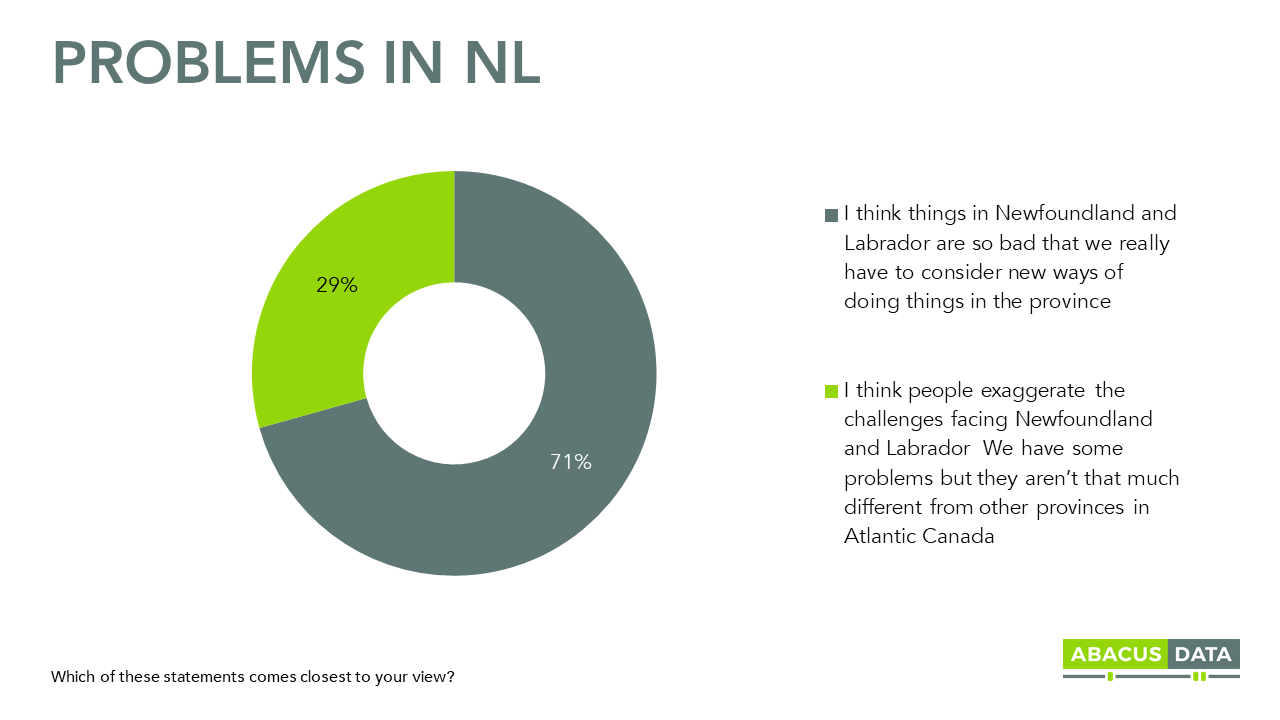
Given these challenges and the mood of the province, it should not come as a surprise that 71% of residents feel that things in the province are so bad that they “really have to consider new ways of doing things in the province.” Only a minority are of the view that “people exaggerate the challenges facing Newfoundland and Labrador.”
POLITICAL ENVIRONMENT
The level of anxiety about the province carries over into uncertainty over who should lead it.
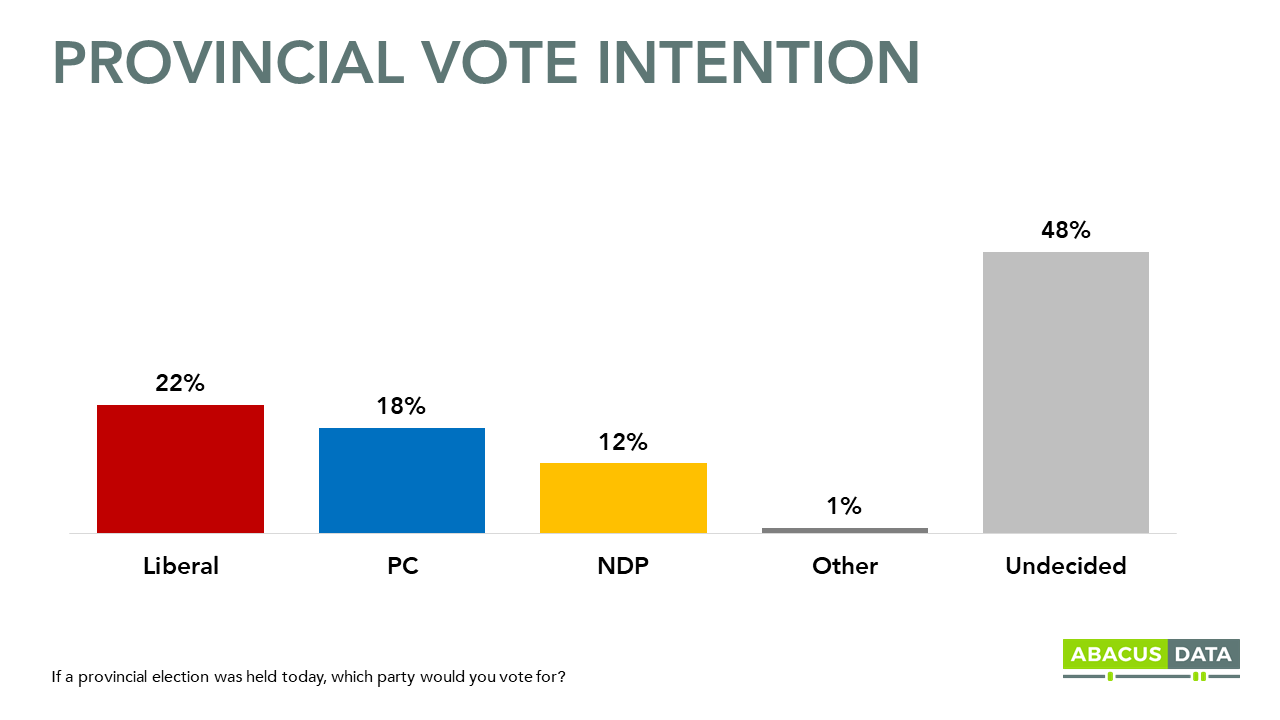
When asked how they would vote if a provincial election was held at the time of the survey, almost half of respondents reported being undecided (48%) with 22% saying they would vote Liberal, 18% voting PC, and 12% voting NDP.
These results suggest a highly volatile political environment. Consider that half of past Liberal and NDP supporters say they are undecided about which party they would vote for. 57% of women are undecided (almost 20 points higher than men).
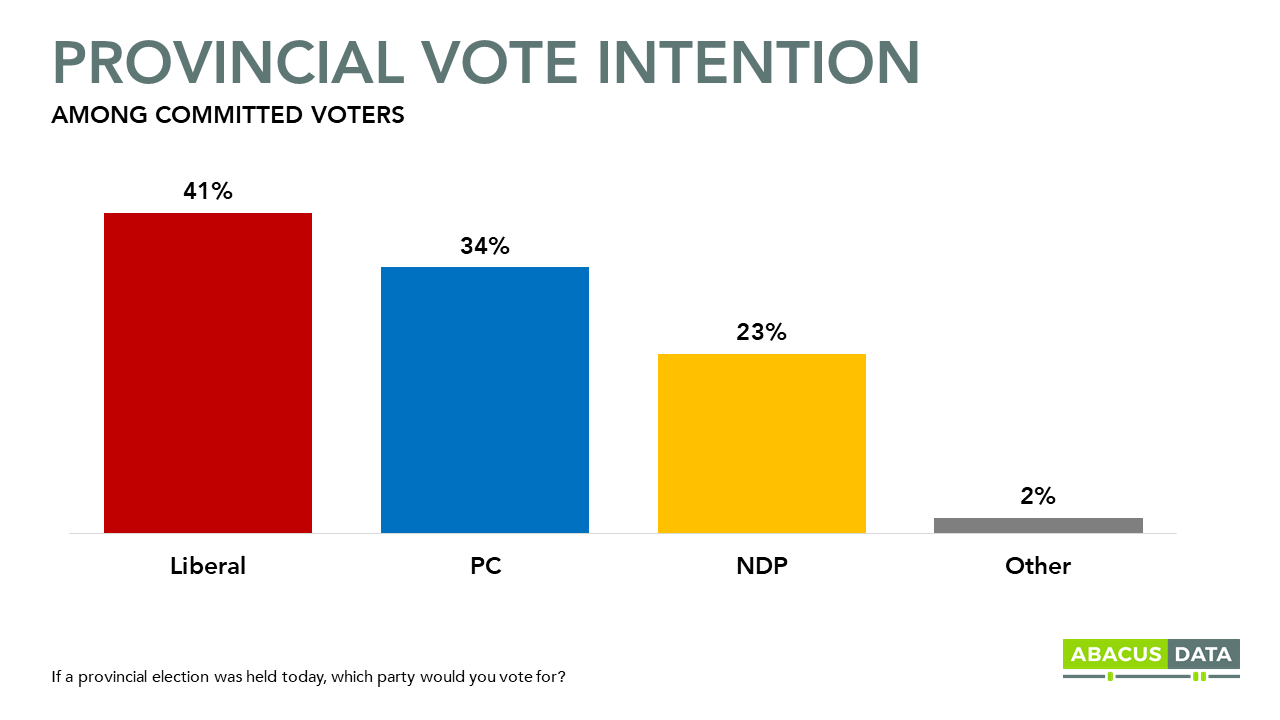
With those undecideds removed, the ballot would be Liberal 41%, PC 34%, and NDP 23%.
UPSHOT
“The public diagnosis of Newfoundland and Labrador’s looming fiscal crisis is clear and broad. So much so that half the public believes that the province is likely to go bankrupt in the next few years and over 70% feel the problems are so severe that they are willing to accept new ways of solving the problem. The public is craving political leadership willing to tackle this unfolding crisis and it appears most of the public is willing to take the bad medicine that will come with curing what ails the province.”
METHODOLOGY
Our survey was conducted online with 600 Newfoundland and Labrador adults conducted between January 8 and 15, 2018. A random sample of panelists was invited to complete the survey from a large representative panel of over 500,000 Canadians.
The Marketing Research and Intelligence Association policy limits statements about margins of sampling error for most online surveys. The margin of error for a comparable probability-based random sample of 600 is +/- 4.1%, 19 times out of 20.
The data were weighted according to census data to ensure that the sample matched Newfoundland and Labrador’s population according to age, gender, educational attainment, and region. Totals may not add up to 100 due to rounding.
We offer global research capacity with a strong focus on customer service, attention to detail and value-added insight. Our team combines the experience of our Chairman Bruce Anderson, one of Canada’s leading research executives for two decades, with the energy, creativity and research expertise of CEO David Coletto, Ph.D.
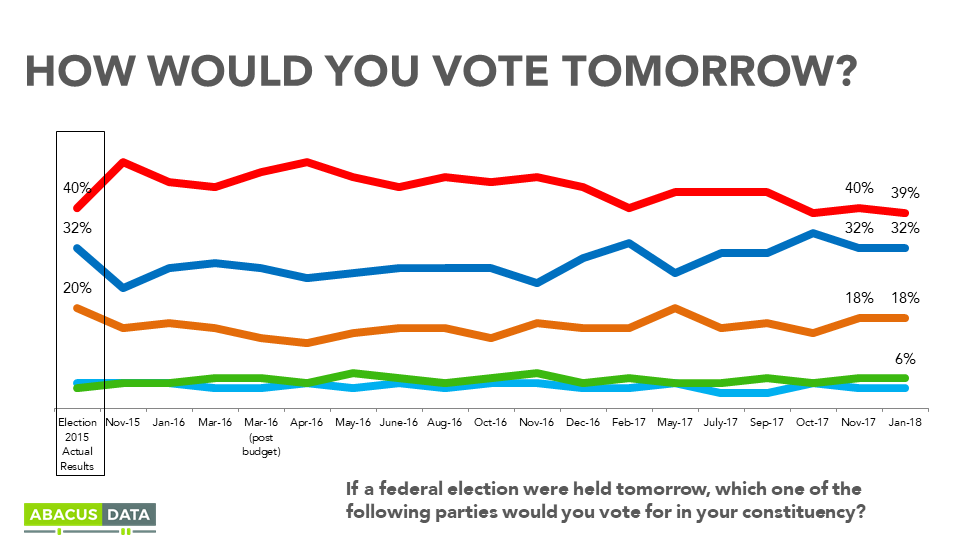
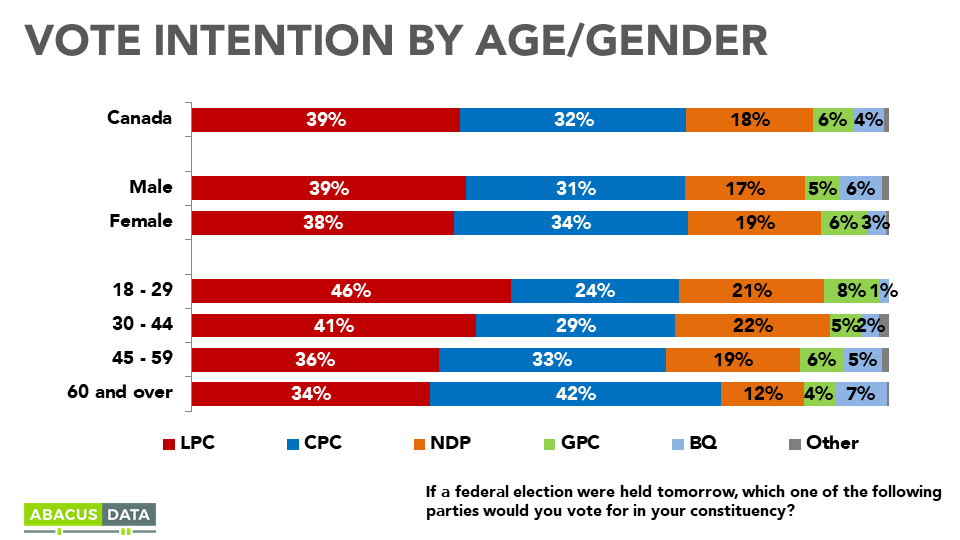
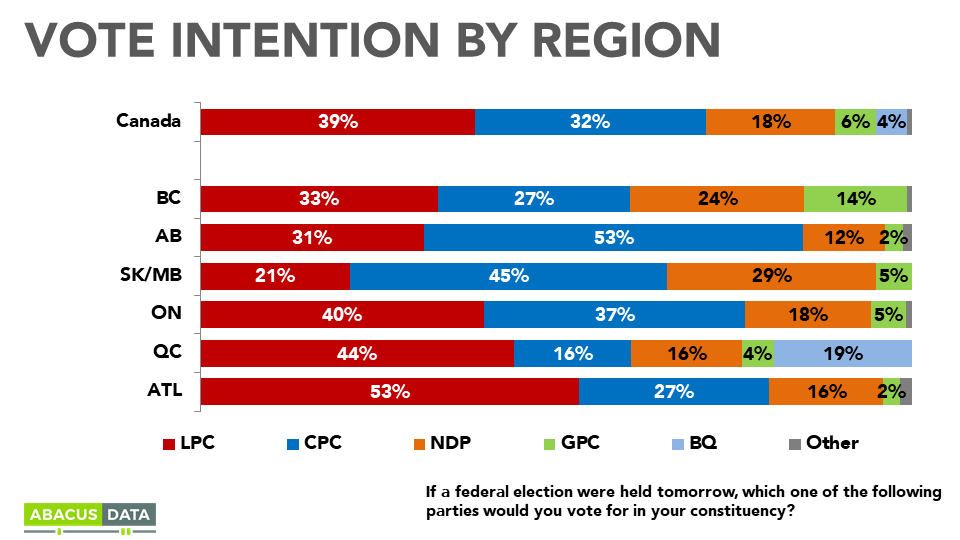
In our first survey of 2018, the Liberals have the support of 39% of decided voters compared with 32% for the Conservatives and 18% for the NDP.
The Liberals have a 3-point lead in Ontario, a 25-point lead in Quebec, and a 6-point lead in BC. In November, we noted gains for the NDP in BC. However, since then, we have seen a return to a Liberal lead with the Conservatives in second.
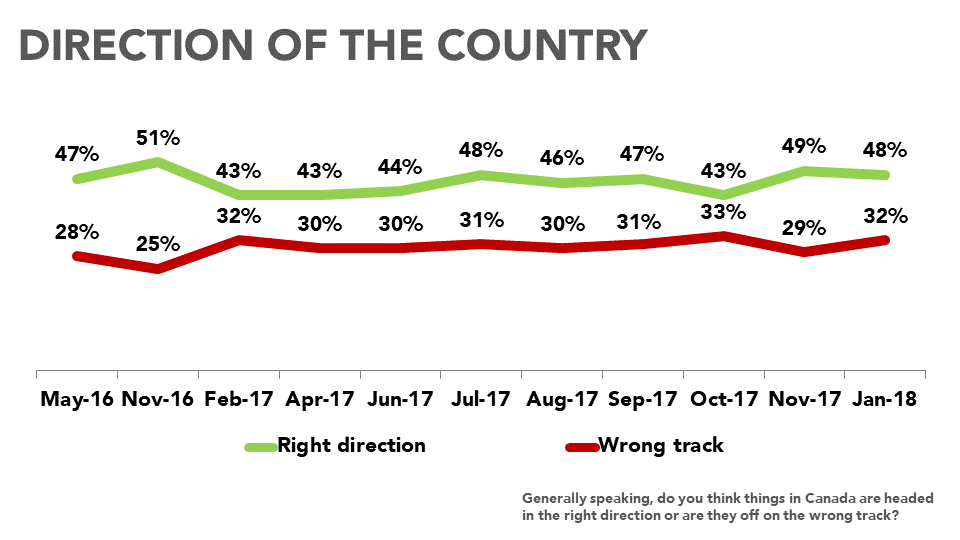
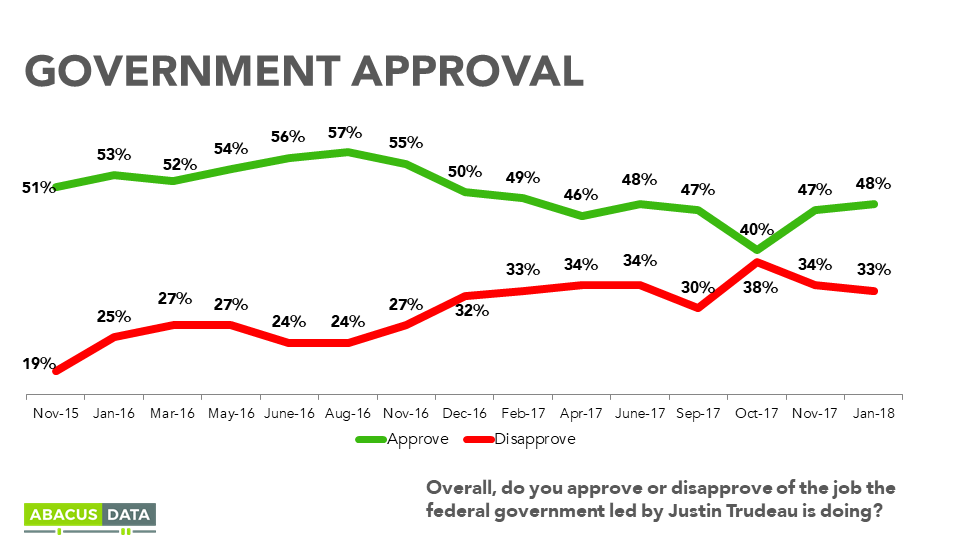
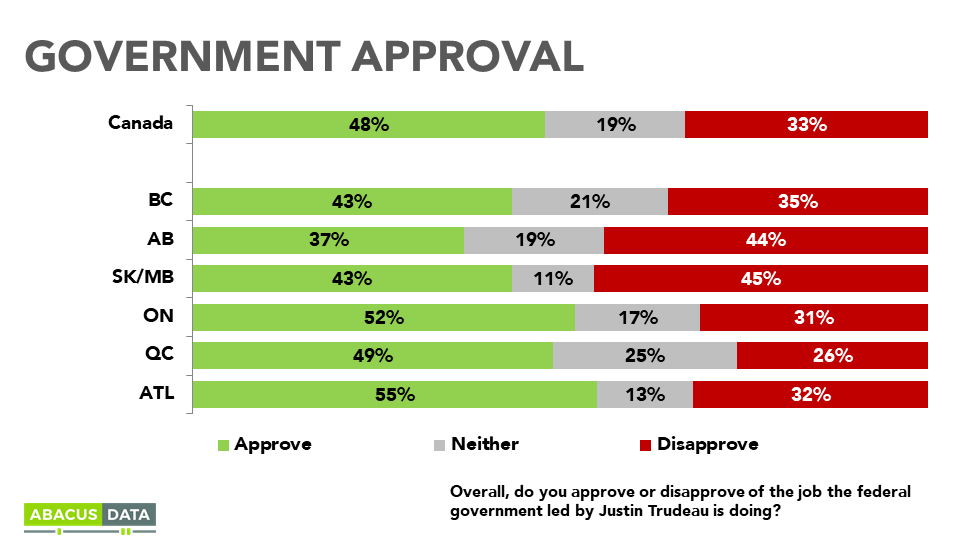
About half (48%) say the country is headed in the right direction, and 48% approve of the job the Trudeau government is doing. About one in three (32%) think the country is on the wrong track and disapprove (33%) of the Trudeau government.
Approval of the government is the plurality view in every place but the Prairies.
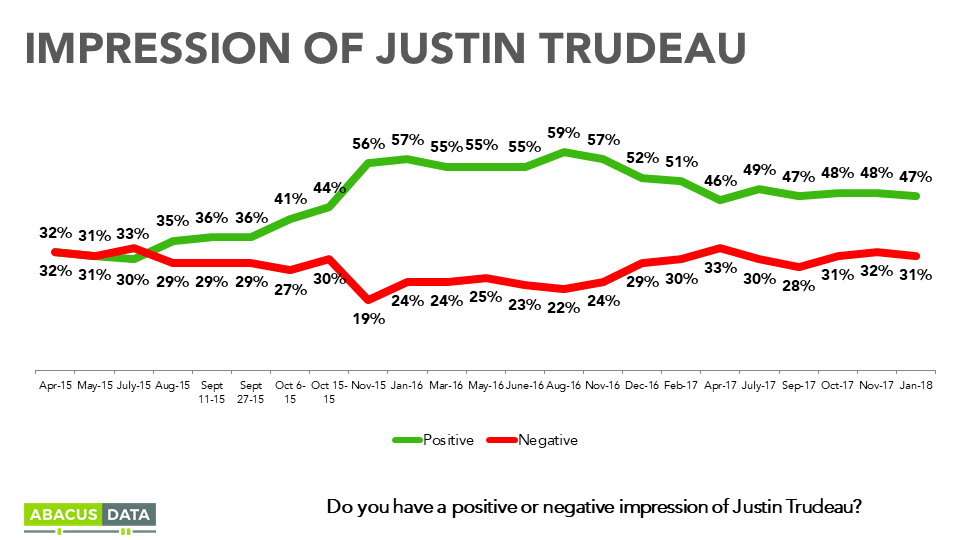
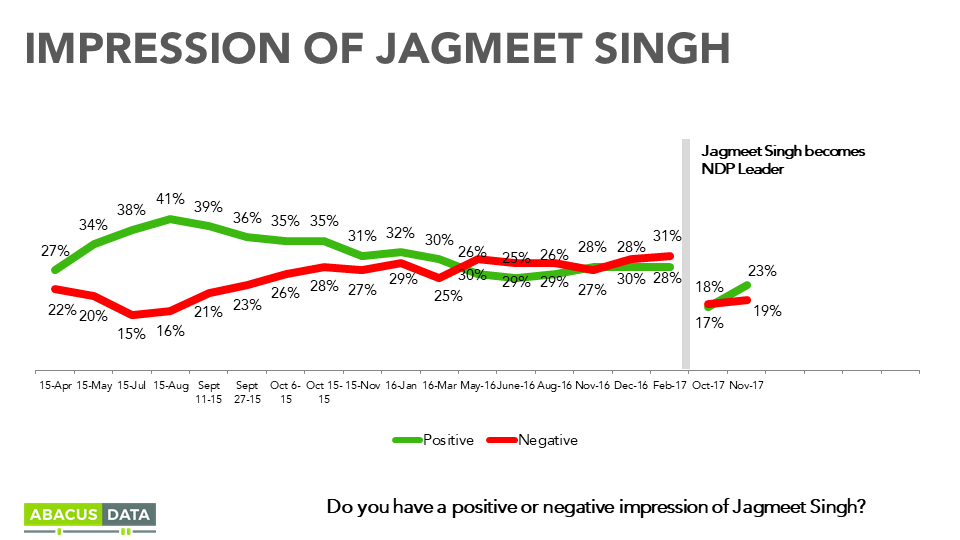
Impressions of Mr. Trudeau’s are a little bit above where they were when he won the October 2015 election, as 47% today say they have a positive view of the PM, 31% a negative impression.
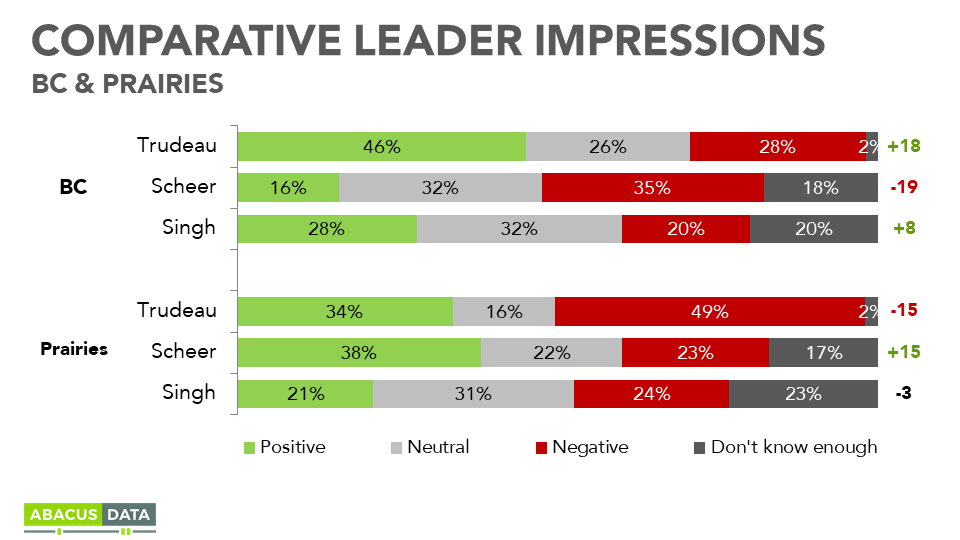
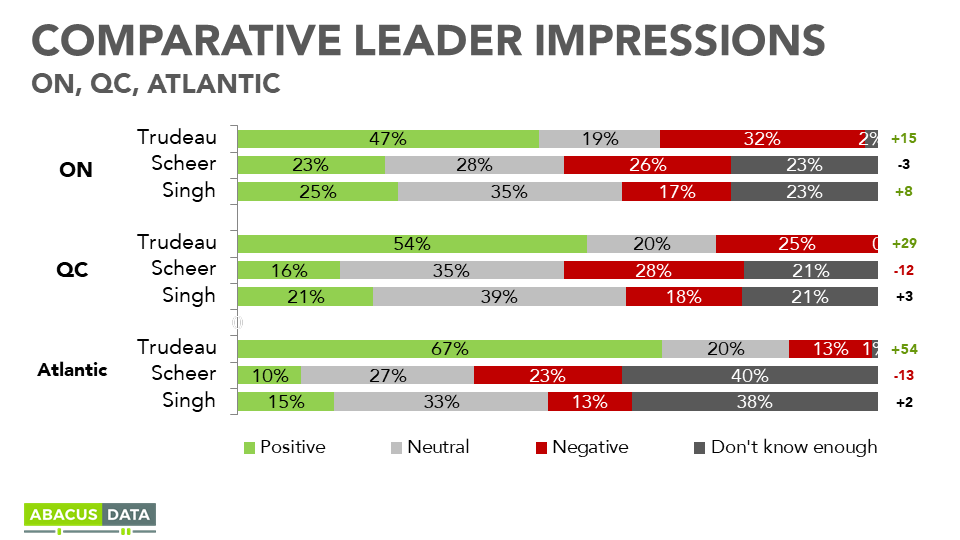
Mr. Scheer, has an equal number of positive opinions (24%) as negatives (25%). Both his positives and negatives have risen a bit since he won the leadership. In Ontario, 28% have a positive impression of the Conservative Leader compared with 23% who view him negatively. In Quebec and BC, more have a negative view (Quebec 27%, BC 25%) than positive (Quebec 19%, BC 21%).
Mr. Singh’s numbers are similar to those of Mr. Scheer, with 24% positive, 22% negative. In Ontario, 26% have a positive view of the NDP Leader while 18% have a negative view while Quebecers are almost evenly split: 26% positive versus 25% negative. In BC, 14% have a positive view while 19% view him negatively.
As we head towards the 2019 General Election, we will start to report on the dimension of desire for change within the electorate. This is an important way to anticipate consolidation of voters around who which party can best effect change or how to vote if you want to avoid a change.
Today, remembering that 39% voted Liberal in 2015, 45% would like to see the Liberals re-elected for a second term while 55% would prefer to see a change in government.
Three out of four who voted Liberal in 2015 want the government to be re-elected as almost half (47%) of those who voted NDP. Almost all 2015 Conservative voters (91%) would prefer to a change in government.
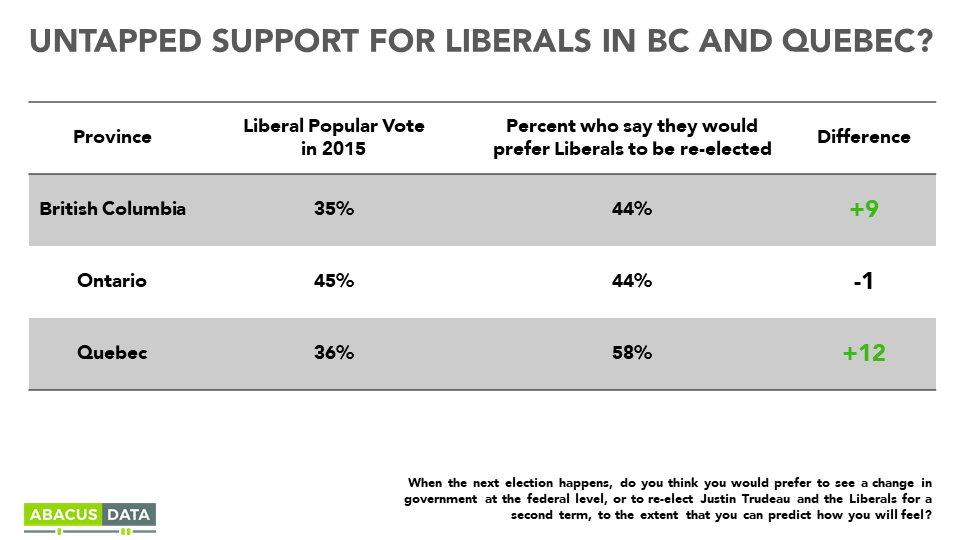
As a way of assessing the potential for growth in the incumbent party’s support, we compare the popular vote the Liberals received in the 2015 General Election with the percentage in the province who would prefer to see the Liberals re-elected. In BC and Quebec, more people would prefer to see the government re-elected than voted for the Liberal Party in 2015 while in Ontario, the numbers are almost equal. This suggests that in two of the three largest provinces in the country, the Liberals may have room to grow over their 2015 performance in those provinces.
UPSHOT
According to Bruce Anderson: “There is every indication that the next federal election will be highly competitive. Both opposition leaders enjoy low negatives, although they have the handicap of low visibility. The Liberal lead is built on satisfying 3 out of 4 of their 2015 coalition and half of those who voted NDP. If they can sustain those two elements, they will be in a good position to win another election.
For the Conservatives, their brand is competitive again, but the raw vote intention numbers should be observed with a bit of caution, due to the fact that the satisfaction levels with the government suggest the Liberals have a hidden level of support. The numbers also are another reminder that attacking Justin Trudeau has not proven hugely successful. Conservatives need to advance ideas appealing to more younger and urban voters and speak to issues they’ve been hesitant on in the past, such as climate change.
According to David Coletto: “As Parliament resumes this week, the federal Liberals are doing as well as they did near the end of 2017. Their support is where it was at the 2015 General Election, almost half of Canadians approve of the federal government, and almost half would prefer the Trudeau government be re-elected.
Mr. Trudeau remains an asset to his party and government as he sustains a generally positive image with most of the country. His primary opponents continue to be largely unknown and undefined in the minds of most voters.
The Conservatives can take solace in the fact that they lead among those aged 60 and over. However, unless they find a way to become more attractive to younger voters, the road to government for her Majesty’s Official Opposition will continue to be mathematically difficult.”
METHODOLOGY
Our survey was conducted online with 1,411 Canadians aged 18 and over between January 26 to 28, 2018. A random sample of panelists was invited to complete the survey from a large representative panel of over 500,000 Canadians.
The Marketing Research and Intelligence Association policy limits statements about margins of sampling error for most online surveys. The margin of error for a comparable probability-based random sample of 1,411 is +/- 2.7%, 19 times out of 20.
The data were weighted according to census data to ensure that the sample matched Canada’s population according to age, gender, educational attainment, and region. Totals may not add up to 100 due to rounding.
ABACUS DATA INC.
What: We are the only research firm that helps organizations respond to the unprecedented threat of generational change and technological disruption.
How: We offer global research capacity with a strong focus on customer service, attention to detail and value-added insight. Our team combines the experience of our Chairman Bruce Anderson, one of Canada’s leading research executives for two decades, with the energy, creativity and research expertise of CEO David Coletto, Ph.D.
They’ve been playing it since Thanksgiving and in some cases since Halloween. There are the old classics, the new classics, the redux of the classics, and then of course there’s my personal bane, George Michael’s discretionary tale of frivolous holiday romance. Please, give your heart away responsibly this holiday season. In the United States alone approximately 500 radio stations switch over to 24 hour holiday music broadcasts by American Thanksgiving. Can we just pause a moment to consider that? That means by December 25th there have been approximately 360, 000 hours of holiday music played across the United States. To add a little context, there are 8760 hours in a year, which means, through 500 radio stations over a 30 day period more than 41 years worth of Christmas music are played every year.
Right now you might be thinking, “Jiminy Christmas tree! That’s a lot of Christmas music!” (as we did) but this 24 hour Christmas flip is well worth the stations’ time. On average when a radio station makes the change they see a 72% rise in listenership during the holiday season and a growing proportion of that are millennials. Millennials can’t get enough of the holly jingles and there may be a sad reason for it. As Bridget Read from Vogue puts it, “There’s something about the naive brand of Americana that classic Christmas and holiday tunes so unabashedly, inanely embrace; it offers a surefire escapist route for the brain and heart.” The first wave of Millennials were welcomed into adulthood right around 9/11. The next wave were welcomed in 2008 with the Great Recession. Throughout that, they have been under the burden of large student debt and a slow-growth economy. Sure, they’re entitled and spend way too much on avocados but their lives are fairly mediocre and they’re staring down a future of increased automation and wage deflation. Its understandable how Millennials might gravitate to unapologetically up-beat nostalgia-ridden songs to escape their not-so-pleasant present.
So as you curse the producers of your favourite radio station for taking away your classic Eagles tunes and replacing them with a crooning Michael Bublé just remember, Michael is spreading the holiday cheer to those who could really use some cheering.
From all of us here at Abacus Data we would like to wish you and your family a very Merry Christmas and a safe and happy holiday season. Feliz Navidad!
Would you like to know more about Millennials as a consumer? Contact us to discover a full range of research and analytical services. Don’t for get to ask about our Millennial Audit, just one tool we use to make you competitive in the Millennial Marketplace.
Today our CEO David Coletto will deliver the keynote address at the National Events Conference in Glasgow, Scotland. The conference brings together events and festival professionals from across Scotland and the UK to discuss future and current trends of the experiential industry. In anticipation of his address, he was interviewed by EventsBase Magazine’s Kevin O’Sullivan who asked David for his insights on the future of festivals and events in the millennial context. Here’s their interview below:
KO: What do you think best defines a “millennial” and how are they changing the way events and festivals are being delivered?
DC: I define millennials as anyone born between 1980 and 2000. Although it is unwise to lump millions of us into one group, assuming we all think and act the same (because we are, in fact, the most ethnically and culturally diverse generation in history), there are some things shared by most of us. For example, most of us were raised by baby boomers who were far more protective of us, coddled us, and instilled a sense of optimism and can-do-anything attitude we see manifested in our outlook. We are also the first generation of digital natives, growing up in a world of rapid technological change. We adopt and adapt to new technology much faster than earlier generations and love being connected constantly. And so, these differences are bound to disrupt markets. Events and festivals are no exception.
KO: You have said that generational change is ‘disrupting’ many markets – including events and festivals – but how much of that is socio-economic and cultural as opposed to just technology based?
DC: Most of it is technological but it’s the cultural and socio-economic factors that have further accelerated generational differences and disruption. Certainly, the great recession was a major factor in many young peoples’ lives. The cost of living – whether it be housing, education, or transport – is a burden that impacts our disposable income. That’s true in Scotland, the UK, and with millennials in Canada and the United States. But the differences go beyond temporal events like a market crash or economic downturn. It’s also related to how we were raised. Many millennials experienced a very different upbringing then generations before them. Hierarchies in families were weakened, we were consulted regularly by our parents, teachers and other influencers in our lives.
Most of us were told to go after our dreams and the self-esteem movement instilled a sense of optimism and collaborative spirit that is unique to our generation. All these factors are changing our priorities, shaping our decision making, and leading us to disrupt markets – both consumer, and yes, political. Ask Theresa May what millennial disruption really feels like. It can sting and surprise! But technology has created the greatest gap in generational behaviour. As digital natives, the way we get information, communicate, and make decisions is different. And our digitally saturated lives have created an intense desire for more sensory experiences. Our obsession with food, music, travel, and yes, events – is a response to a life that is so centred around mobile devices and digital technology.
KO: The latest research has shown that people attend events to connect with others, experience something different, and share it via social media. How can events and festivals best hook into those motivations?
DC: It’s all about the experience and the ability to share that experience. When marketing your events, ask yourself, are we showcasing the programme, the venue, and the whole experience in a way that would make someone want to share it? If I attend this event, will it make someone else I know envy me? Social media has fed a natural desire for feedback that is particularly strong among millennials. Imagine you’re at this amazing music festival, listening to one of your favourite artists playing your favourite song. You pull out your smartphone and capture a short clip of the song and post it on Facebook. How quickly did you go back onto Facebook to see how many of your friends liked the post? I’d say you probably did that a few minutes after sharing.
KO: How can events and festivals create brand loyalty when millennial consumers are perhaps less likely to be repeat visitors?
DC: I think it’s a bit of a myth that millennials are not brand loyal. We are loyal to brands that continually delight us, make it easy for us to interact with them, and deliver unique, personal experiences. When those conditions change, however, we are not afraid to look for better alternatives. We are attracted to upstart brands and the newest trend (we all are to some extent) that have a compelling story and buzz. Every group has one or more influencers and many decisions are impacted by a referral or a review. Build a community of advocates, delight them with amazing experiences, and keep the programme fresh, unique, and real and you will have an easier time getting us to come back time and again. But I will say, it’s so important to know your audience really well. That’s the first step in marketing and it still surprises me how many marketers assume they know their audience and come to the wrong conclusions. You’d be surprised how much you can learn when you ask us what we want and how your event or festival might attract and delight us.
KO: What skills does a 21st century marketer need to connect with the millennial audience?
DC: How about this? Deliver a compelling, authentic message built around a story that aligns your event or festival with my personal brand on a platform I use regularly. Phew, that’s a mouthful. What I mean is that authenticity is critical to powerful marketing to millennials. That means your intentions need to be good, your message needs to be honest and real, and stories need to be central to the pitch. We live in the era of personal branding. Everything I share on Facebook, Twitter, or Instagram says something about who I am. They are our personal store fronts and if you want us to come to your event or festival it has to align with the kind of person we want to be perceived to be. In other words, what does it say about me that I attend your event or festival?
David Colleto will be a keynote speaker at the National Events Conference at the University of Strathclyde’s Technology and Innovation Centre on Monday
KO: Are the days of camping in a muddy field, drinking cheap lager, and watching a headline act from a mile away officially over?
DC: I hope not because those are the most authentic, memorable events. But I think you’ll find that the immense diversity within my generation will mean different people are looking for different experiences. Increasingly, we’re finding how important the quality of the food is at events. We want to experience not just the music or art, but the local influences of the place we’re visiting and food is a big part of that. This summer I took part in a bike event in Vermont, USA. It was called the Farm to Fork Fondo. Basically, it was a bunch of cyclists touring rural Vermont and stopping at farms to sample food made from products grown or raised on these farms. We became completely immersed in the local culture, we met farmers and chefs along the route, and we had an amazing experience along the way. This event merged my love of cycling with my love for food and I would do it again in a heartbeat.
Stop into any higher end restaurant in Glasgow, Edinburgh, or London and you’ll likely see a lot of young faces at the tables. Most of them really can’t afford to eat at those restaurants and yet they splurge for the ‘experience’. At the end of the day, the events and festivals you plan bring people together. Sometimes we experience something new while at other times we experience something familiar or comforting. But we are always with people sharing that experience. Millennials aren’t that different from older generations on this basic premise. We all want to make memories we can share, remember, and look back on. We all want to be delighted, entertained, and feel a connection that is missing in our day to day lives. Events and festivals have such an opportunity to grow and evolve with this new, powerful, and potentially disruptive consumer group.
For more interesting articles on the event and festivals industry check out EventBases‘ website for the latest scoop, opinion, and analysis.
Interested in understanding how Millennials will effect your business? Contact us to start a conversation and we can help you better understand the world’s largest and most diverse generation. Ask about our Millennial Audit where we analyse how Millennials perceive your brand. Let us be your guide as you navigate the Millennial marketplace.
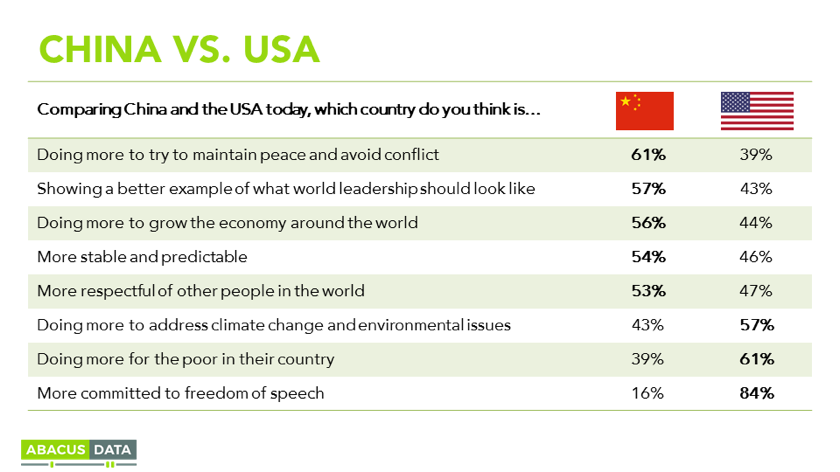
We found that Canadians recognize that China has become one of the world’s most important economic players and want to see Canada have a significant relationship with China when it comes to trade and investment flows.
This is not a view that is skewed by region: people across the country see the benefits of strong economic ties. Perhaps even more noticeable is that young Canadians are more open to strengthening our ties with China, as they will have the ability to influence policies and economic choices over the longer term.
However, as with most choices, Canadians also exhibit a degree of caution and prudence. This is not so much to do with China per se, as the majority believe that China is no less trustworthy than any other potential trading partner. Instead, Canadians are looking for the best of all possible worlds: more exports, but not necessarily more imports; healthy two-way investment flows, but ideally without seeing control of Canadian enterprises shifting to Chinese investors.
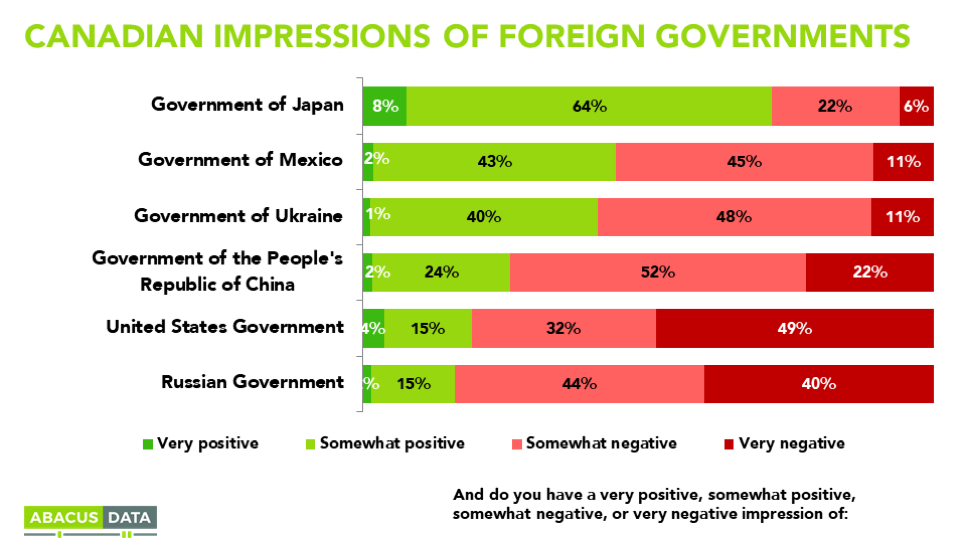
Consider this: More Canadians have an intensely negative view of the US government than the Chinese government. Back in August, we asked Canadians their feelings about a number of different governments. And while we felt less intensively negative to the Chinese government than we do to the Russian or American governments, a majority (74%) tended to have negative views of the Chinese government.
Canadians generally think trade and globalization are good for the country.
And Canadians are generally predisposed to supporting trading. For example, in May we found that 73% feel that globalization including trade agreements will be more helpful than harmful to the prospects of Canada’s economy. Moreover, more Canadians (58%) are “globalist” than “nationalist” (43%)in their general orientation. Sizeable proportions have particularly strong versions of these feelings: 24% could be called “ultra-globalist” and 16% “ultra-nationalist“. And immigration and diversity were stronger drivers of these attitudes than views around trade.
When it comes to the idea of a free trade deal with China, our research suggests a degree of openness that might not have been there a decade ago. Canadians will naturally have concerns about being competitive enough with Chinese companies, perhaps concerned with the nature of the Chinese government, but also recognize the potential economic upside is significant too.
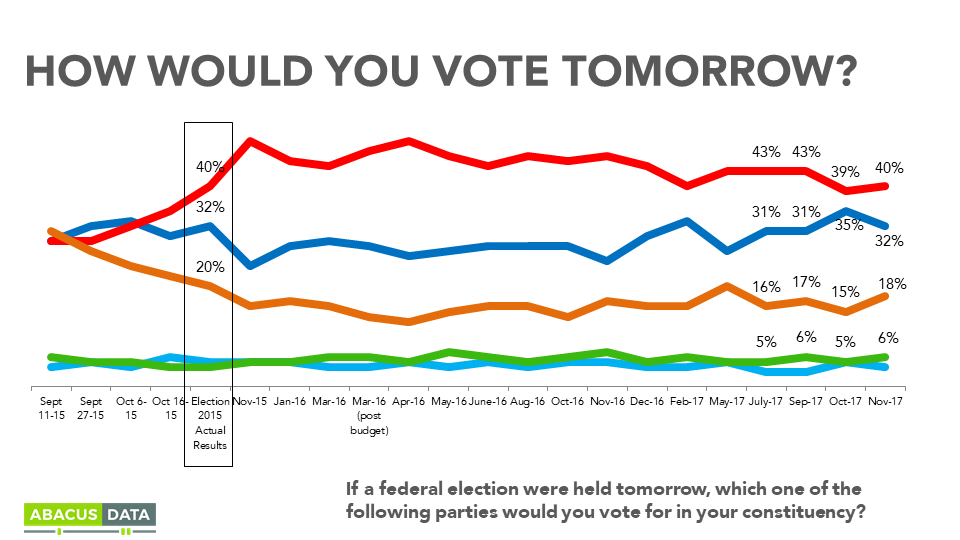
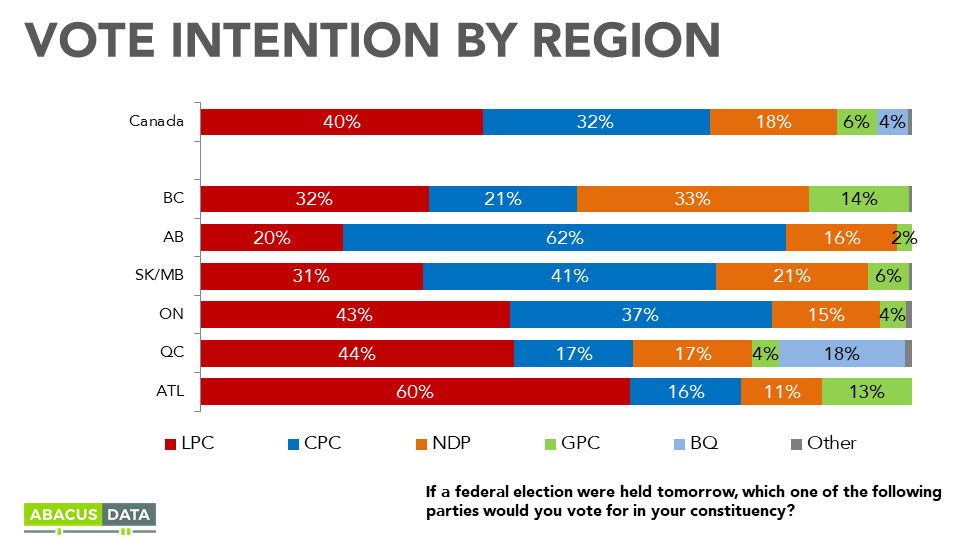
Last month we saw a four-point slip in Liberal Party support; in our latest survey the Liberals have stabilized and would win 40% support today. The Conservatives are at 32%. Both these numbers are identical to the results last election Day in 2015.
In the three seat richest provinces, the Liberals have a 6-point lead in Ontario, a 26-point lead in Quebec, and are tied with the NDP in BC. Healthy gains are evident for the NDP in BC, apparently at the expense of both the Liberals and Conservatives. Over the next month or two, we will closely monitor this shift to see if it is sustained, and if so, to what degree it has to do with positive feelings about Mr. Singh, less positive feelings about the Trudeau government, or a spillover of positive NDP sentiment from the provincial level.
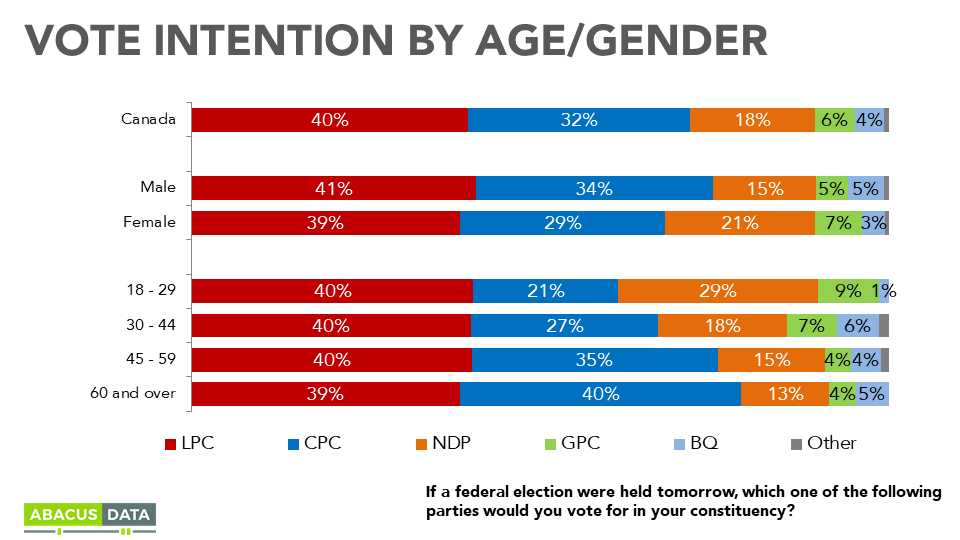
The Liberals lead among all age groups except for those 60 and over. Much of the Liberal lead nationally is thanks to its margin among those under 45. We have seen a boast in support for the NDP among those under 30, up 15 from last month.
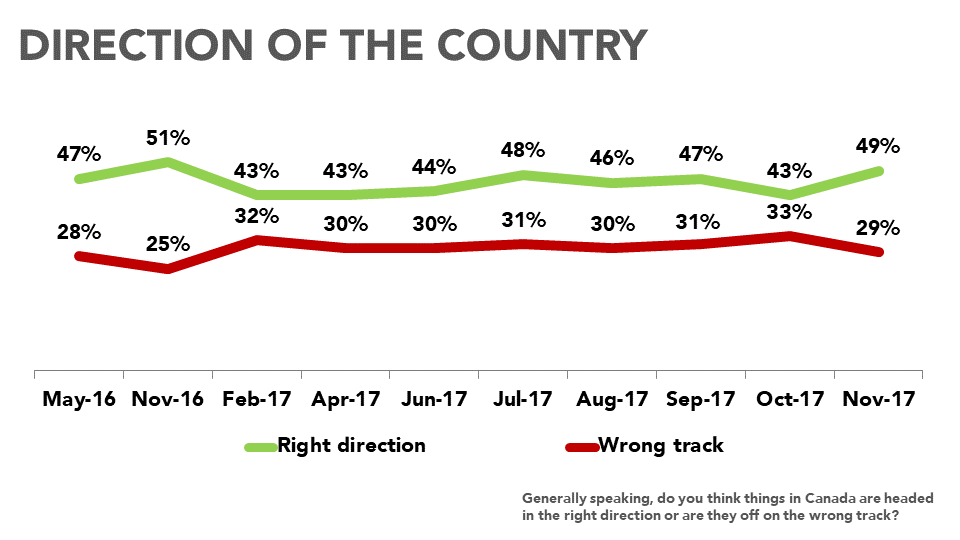
About half (49%) say the country is headed in the right direction, the highest number in a year and up 6-points from October’s dip. 29% say Canada is off on “the wrong track”.
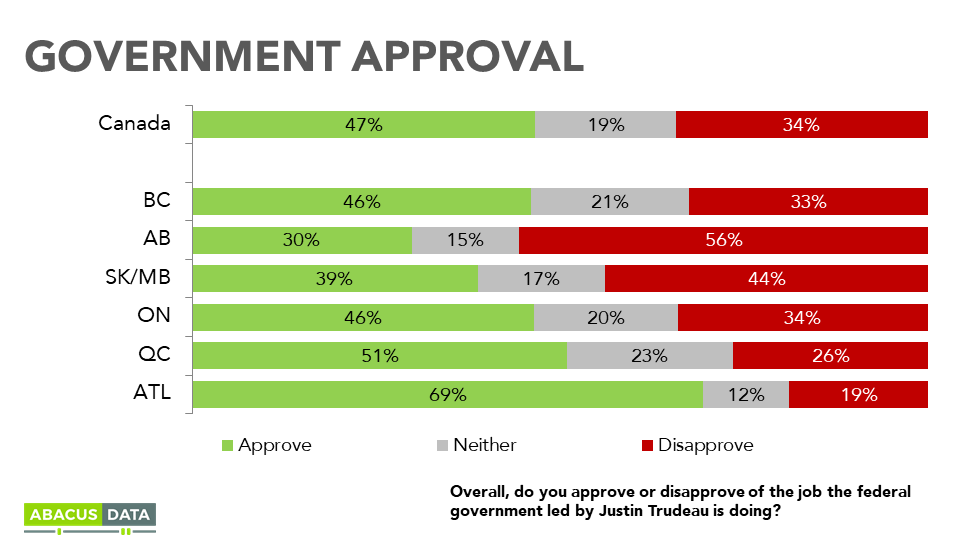
Approval of the federal government has also recovered from the 7-point drop noted last month. Today, 47% approve of the job the Trudeau government is doing, while 34% disapprove. This is closer to what we have tracked since the beginning of 2017.
Approval of the government is the plurality view in every place but Alberta and Saskatchewan and among all age groups under 60. 40% of those who voted NDP in 2015 approve of the Trudeau government performance while 75% of Liberal voters approve compared with 11% who disapprove.
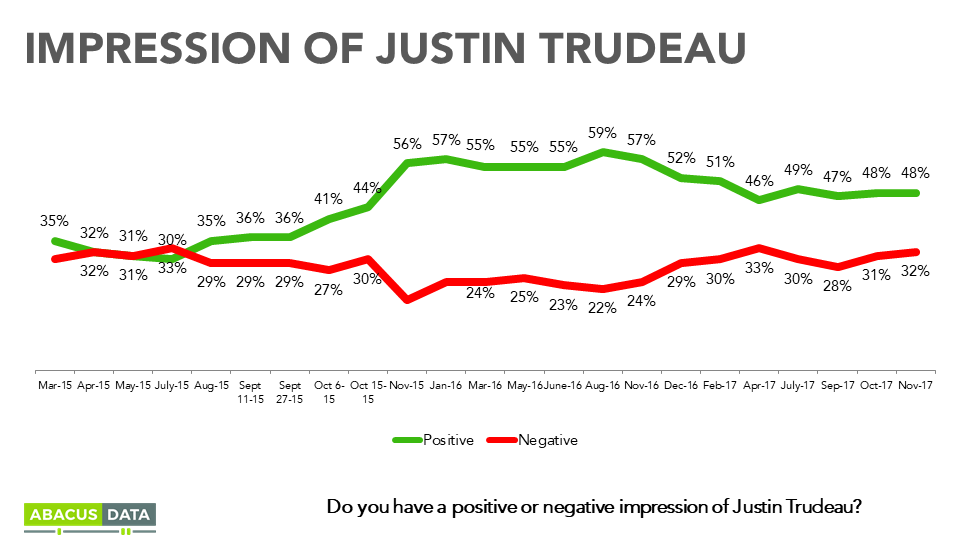
Impressions of Mr. Trudeau’s are stable with 48% saying they have a positive view of the PM, 31% have a negative impression.
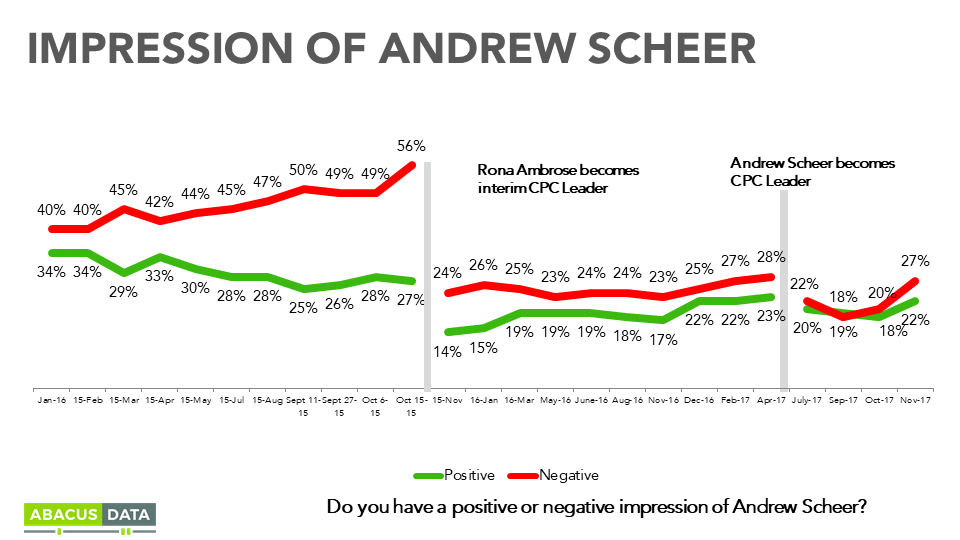
For Mr. Scheer, his positives rose 4-points, but his negatives rose 7-points over the last month.
For Mr. Singh, his positives are up by 5, and now has 23% positive, 19% negative opinion – marking the first time since March that the NDP has had a leader with higher positive than negative opinion.
Regionally, Mr. Trudeau has the highest net positive ratings in all regions except for the Prairies. Almost half in BC and Ontario have positive views of the Prime Minister while a majority in Quebec and two thirds in Atlantic Canada feel positively about Mr. Trudeau.
Mr. Scheer is strongest in the Prairies where he has a net positive impression of +13. His impression in Ontario is about even with 23% having a positive impression and 26% having a negative impression.
Mr. Singh is viewed positively in Ontario and British Columbia (+8) and is net neutral in other regions. In Quebec, more people view Mr. Singh positively than Mr. Scheer (21% vs. 16%).
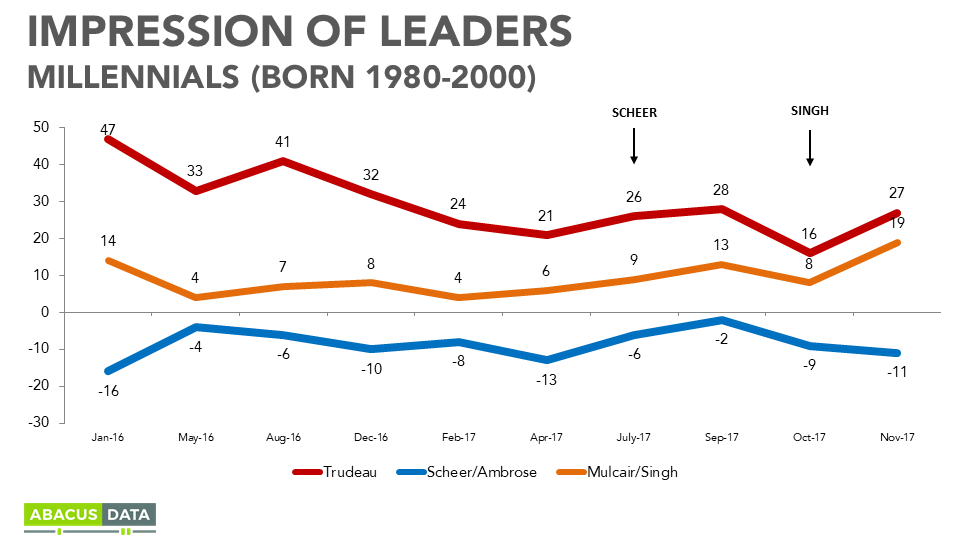
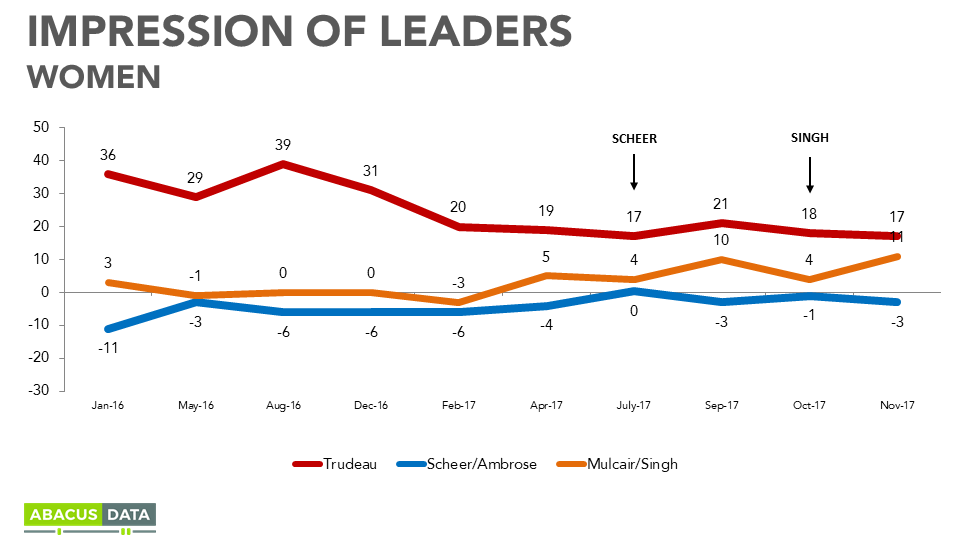
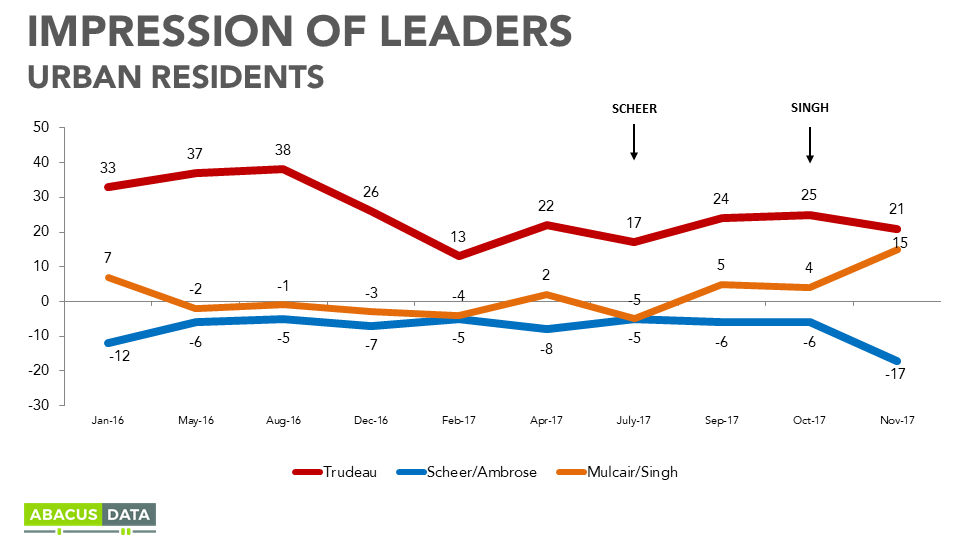
Over the next two years, we will also track impressions among three key groups of voters: Millennials, women, and those living in urban centres.
Among all three groups, Mr. Trudeau has held an edge over the other party leaders since the beginning of 2016. It’s worth keeping in mind for much of that time, the Conservative Party had an interim leader and Tom Mulcair was voted out by party members at the convention in Edmonton in early 2016.
As with impressions of Mr. Trudeau among all voters, there has been a softening of his image among these three groups. In January 2016, Mr. Trudeau had net positive scores of +47 among Millennials, +36 among women, and +33 among urban residents. Today, his numbers remain positive but the gap between those having a positive and negative impressions has shrunk in all three cases.
For the two new opposition leaders, Mr. Singh’s numbers are headed in a positive direction (after two months of our tracking) while Mr. Scheer’s are becoming more negative among Millennials and urban dwellers.
UPSHOT
According to Bruce Anderson: “We’re shifting towards a new evaluative framework, one where voters spend less time comparing the Trudeau government to the Harper government, or to their expectations of Mr. Trudeau, and as time goes on, more time comparing Mr. Trudeau’s Liberals to the Conservatives under Mr. Scheer’s leadership and the Singh-led NDP. In that context, current levels of comfort with the direction of the country and the health of the economy are buttresses for Liberal support.
For the Conservatives, no longer having Mr. Harper as leader has opened new opportunities, but it’s too soon to say whether Mr. Scheer looks like the kind of leader who can capitalize on these opportunities.
For the NDP, the shift from Mr. Mulcair to Mr. Singh has also been a positive one, and the spring in their numbers in BC will provide some encouragement for NDP partisans. The big challenges for the NDP are whether they can recover lost ground in Quebec and whether they can avoid being squeezed out in a polarized battle between progressive and conservative voters in Ontario.
According to David Coletto: “Last month we saw a more competitive political environment than at any point since the last election. This month, the environment is less competitive with the Liberals re-opening a healthy 8-point lead over the Conservatives. Our topline numbers are almost exact to the results of the last election.
The fundamentals also remain quite positive for the Liberals. Half the country thinks things are generally headed in the right direction and approval of the federal government has returned to levels we measured in the summer. Mr. Trudeau’s personal image is quite positive, especially among core parts of the Liberal coalition: millennials, women, and urban dwellers.
Mr. Singh has had a good month in our tracking. The NDP is up slightly nationally (thanks to a big boost in BC) and people feel more positively about Mr. Singh himself. He still remains unknown to many Canadians, but his numbers are headed in a positive direction.
The same can’t be said for Mr. Scheer. Despite a tough environment for the Liberals, Conservative support is down slightly since last month and people have become more negative towards Mr. Scheer. Still, few people have a good sense of who Mr. Scheer is so there’s still time to define and introduce himself to Canadians.”
METHODOLOGY
Our survey was conducted online with 1,500 Canadians aged 18 and over between November 10 and 14, 2017. A random sample of panelists was invited to complete the survey from a large representative panel of over 500,000 Canadians.
The Marketing Research and Intelligence Association policy limits statements about margins of sampling error for most online surveys. The margin of error for a comparable probability-based random sample of 1,500 is +/- 2.5%, 19 times out of 20.
The data were weighted according to census data to ensure that the sample matched Canada’s population according to age, gender, educational attainment, and region. Totals may not add up to 100 due to rounding.
ABACUS DATA INC.
We offer global research capacity with a strong focus on customer service, attention to detail and value-added insight. Our team combines the experience of our Chairman Bruce Anderson, one of Canada’s leading research executives for two decades, with the energy, creativity and research expertise of CEO David Coletto, Ph.D.
As avid readers of our blog know, Millennials have, by-far, the greatest online risk exposure as compared to any older demographic. Millennials spend on average, 3 hours or more of their waking hours on the internet per day. With such exposure it is unsurprising that they would encounter a greater number of nefarious persons seeking to separate them from their income. Yet, we rarely hear of the poor Millennial being cheated out of their savings by a mysterious Nigerian prince. A new study out of the UK suggest that Millennials are more likely to fall for an internet scam than their 55+ year old seniors. Get Safe Online – a public-private not-for-profit initiative that educates UK consumers and businesses on cyber threats – commissioned a study that compared cyber scam incident rates across generations.
What they found was that approximately 1 in 10 Millennials ( aged 18-24) fell victim to phishing and other cyber scams last year. On average these Millennials lost £612 ($1,027 CAD) in each instance. Nearly half as many Boomers ( aged 55+), around 1 in 20, fell for a scam during the same period. Boomers lost on average £214 ($359 CAD) during each instance. To put this into context with their relative pocketbooks; when comparing the average disposable household income per person in the UK for 2015/2016 we see that Millennials had on average £12,032 ($ 20,325 CAD) while Boomers had £31,578 ($ 53,343 CAD) in post-tax income. This means that one tenth of Millennials are losing around 5% of their income to scams every year. At the last population estimate there were around 8.5 million UK Millennials in the age range of the study. If one tenth of them lose £612 each, it represents a little less than £530 million ($895 million CAD) that are going into the pockets of these cyber scammers annually.
In a recent study we conducted, Abacus Data found that Canadian Millennials were particularly cavalier with their information online. Almost all Millennials have at least 3 social media accounts while many have as numerous as 5. Nearly 86% of Millennials are on social media; creating and sharing content throughout the day, every day. Furthermore, most Millennials have online store profiles, subscribed to mailing lists, and other online fora in which they share personal and financial information. This willingness to trust strangers with their sensitive data is reflected in this high incident rate. Millennials might be digital natives, but it looks as though they are still digitally naïve. This underlines the need for continued education and awareness for Canadians of all generations, including Millennials.
In another study we conducted for the not-for-profit organization MediaSmarts – a public-private partnership which promotes digital and media literacy for children and youth in Canada; we found that over a third of Millennials did not believe primary and secondary schools were providing adequate cyber-safety training to students. Governments from at all levels need to look at their current digital security strategies and work with their constituents from all ages to help them protect themselves from these nefarious persons who might steal their data and their money.
Here at Abacus we specialize in Millennials. If you want to learn more about the Millennial Marketplace and how your organization fits in it, feel free to contact us and we’ll be more than happy to talk. You should also check out our Millennial Audit. With it, we’ll discover how your organization stacks up in the eyes of Canada’s most influential generation.