Canadian Politics: 5 points separate 3 contenders, new poll finds.

NDP by a nose

PdfExport

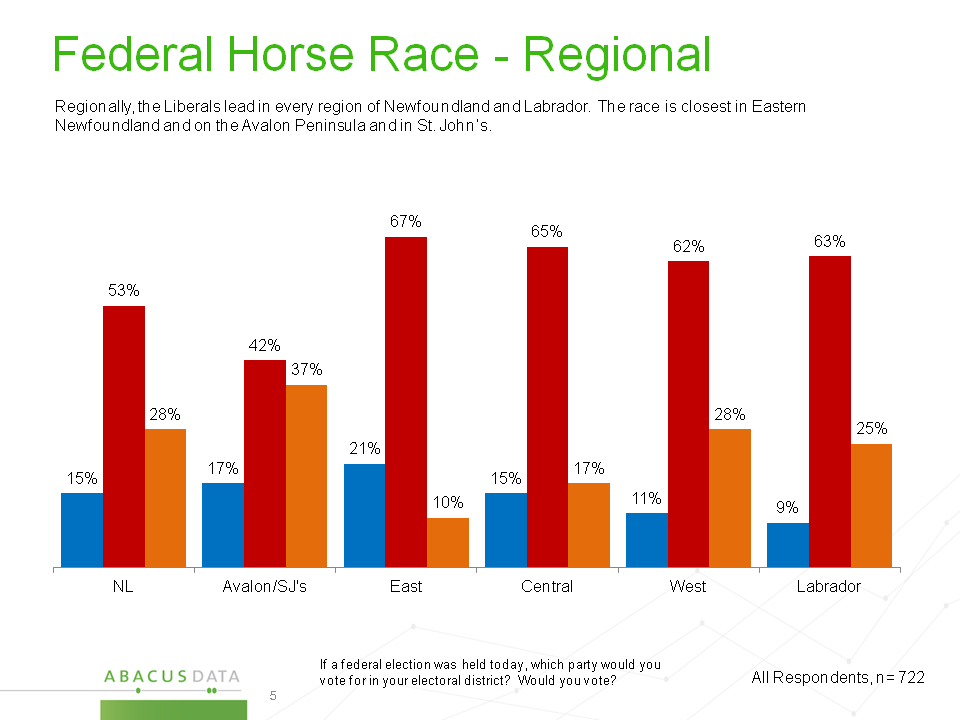
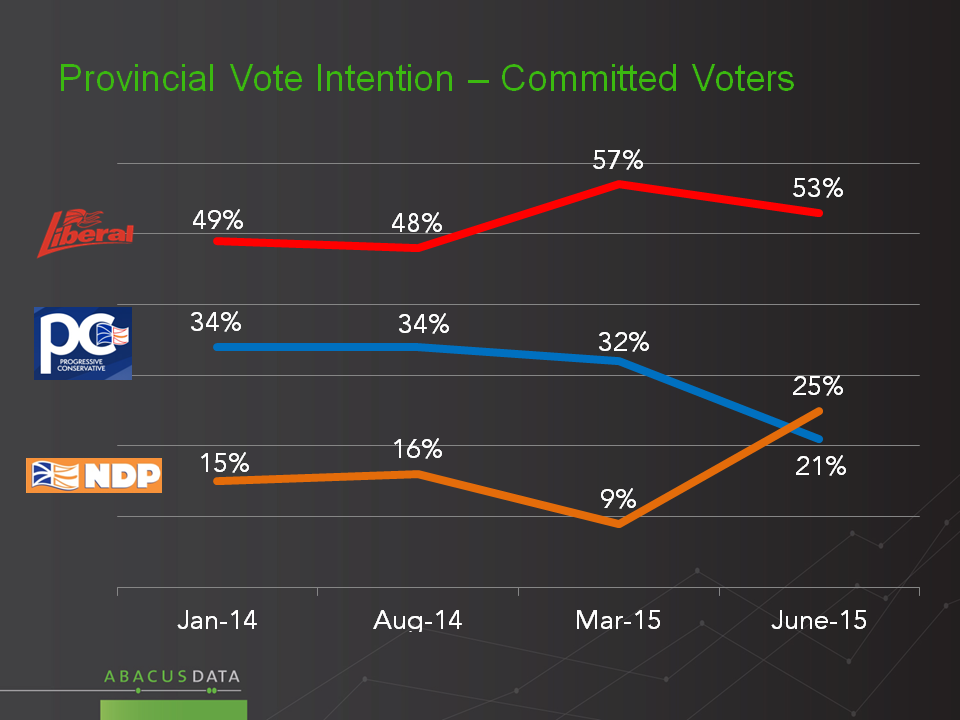
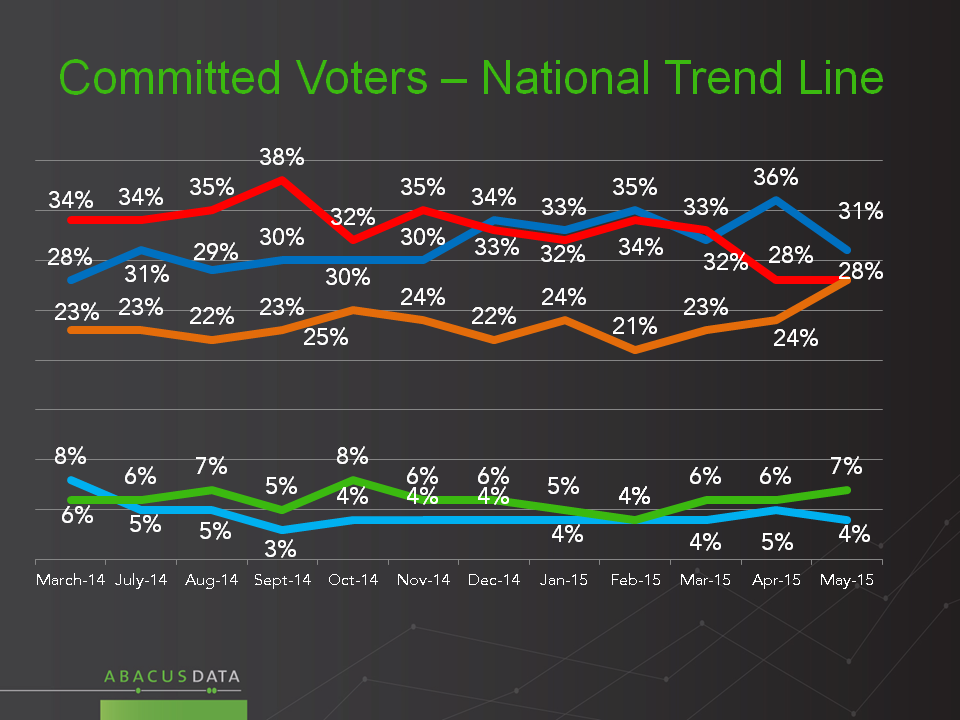
Our latest horserace “who would you vote for tomorrow” question has the NDP, at 32% followed by the Conservatives at 29 and the Liberals at 27%. Since February, the NDP have picked up 11 points while the Liberals have lost 7 and the Conservatives have shed 6.

Slide1

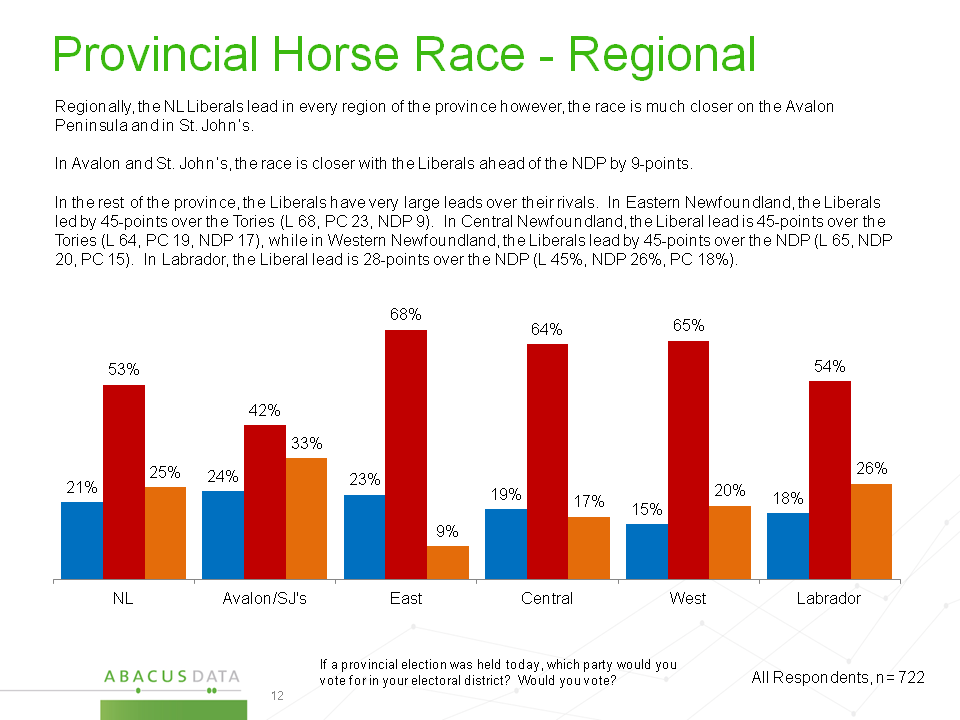
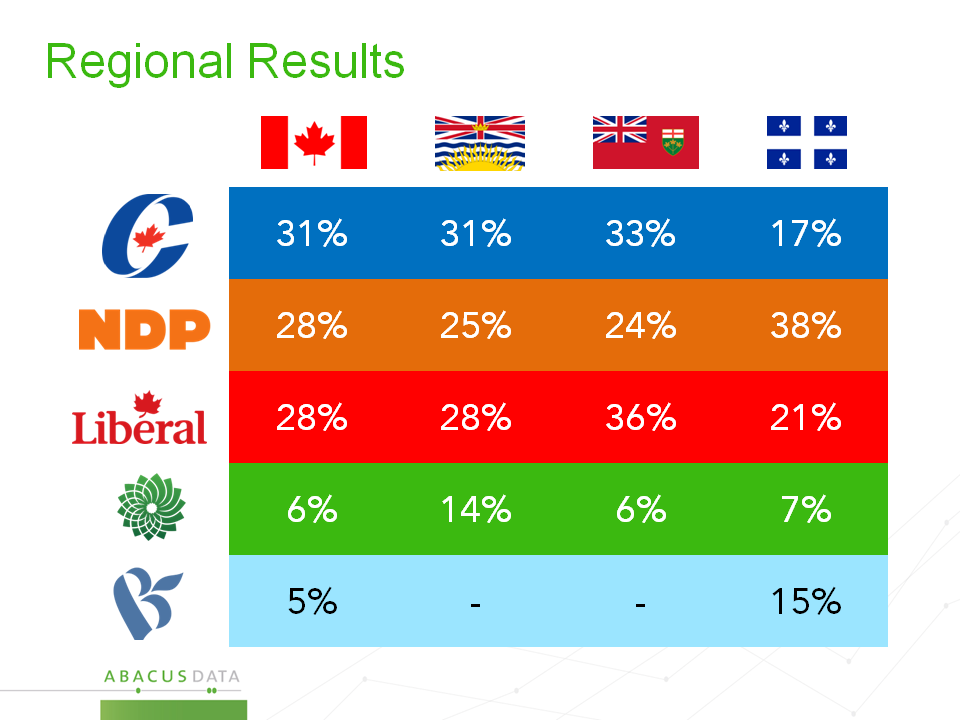
In the three biggest seat markets, the NDP is the story to watch. In Ontario, the NDP is neck and neck with the other major parties and have substantial leads in Quebec and BC.

Slide9

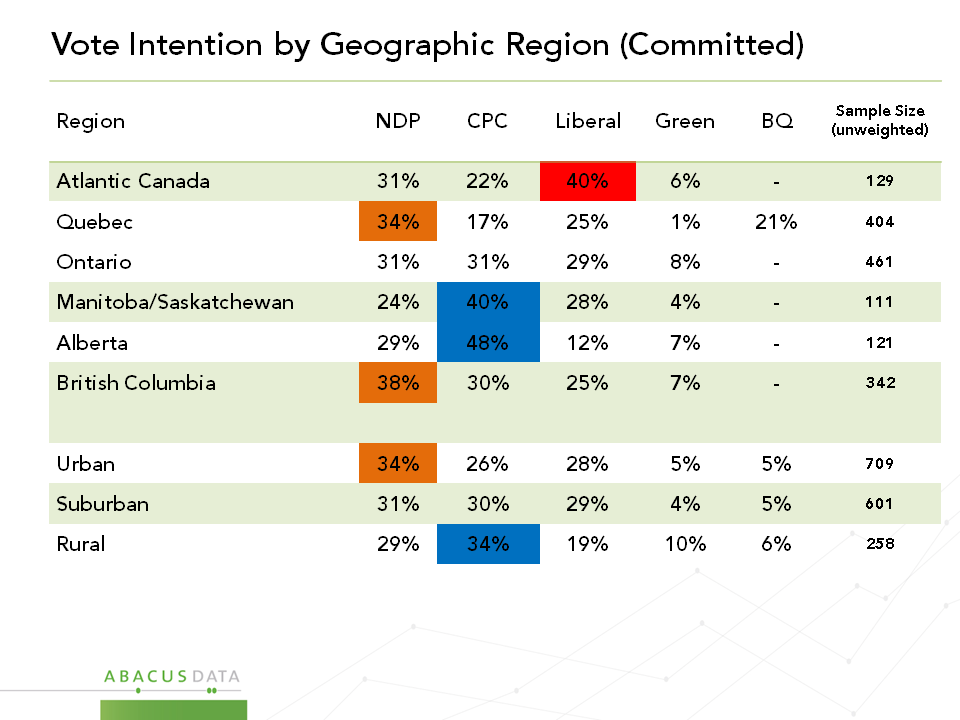
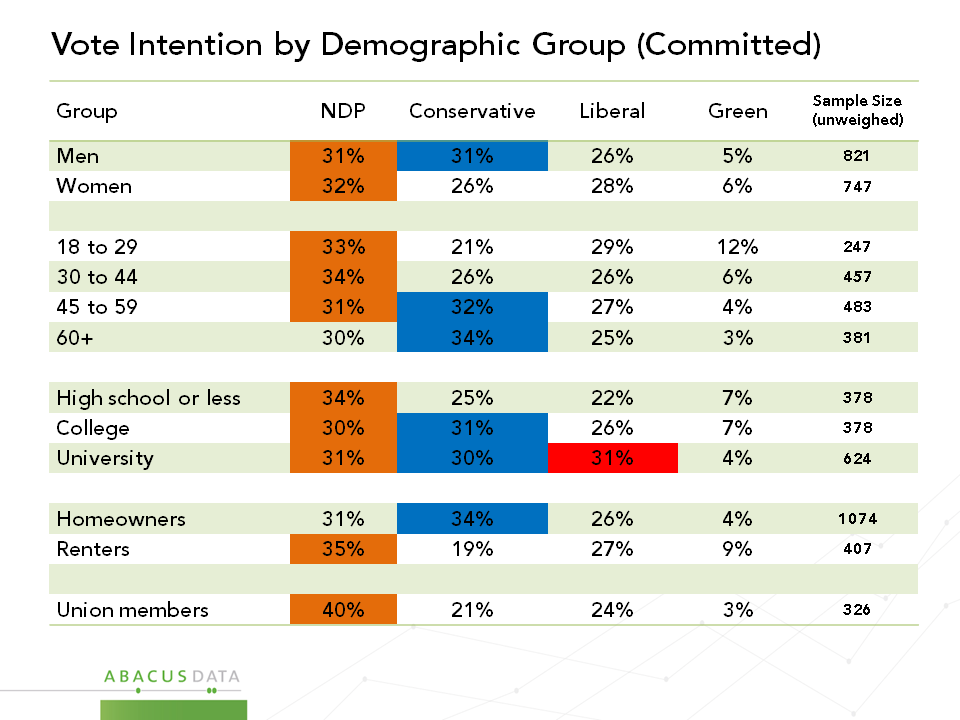
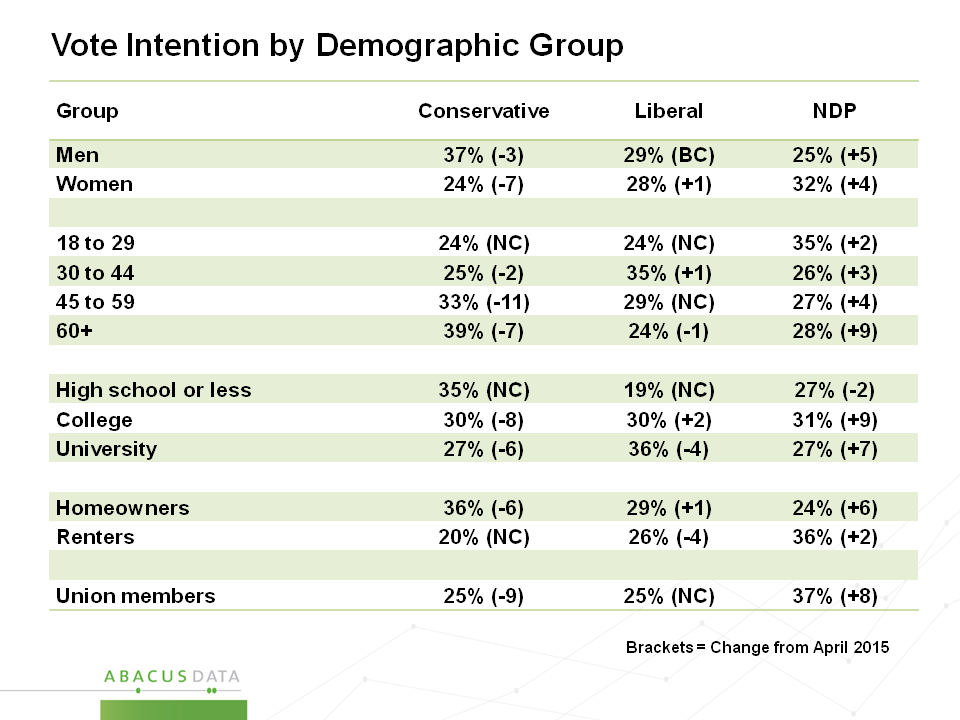
The NDP is currently competitive among segments of the population where they have lagged in the past, including among men, older voters, and homeowners.

Slide8

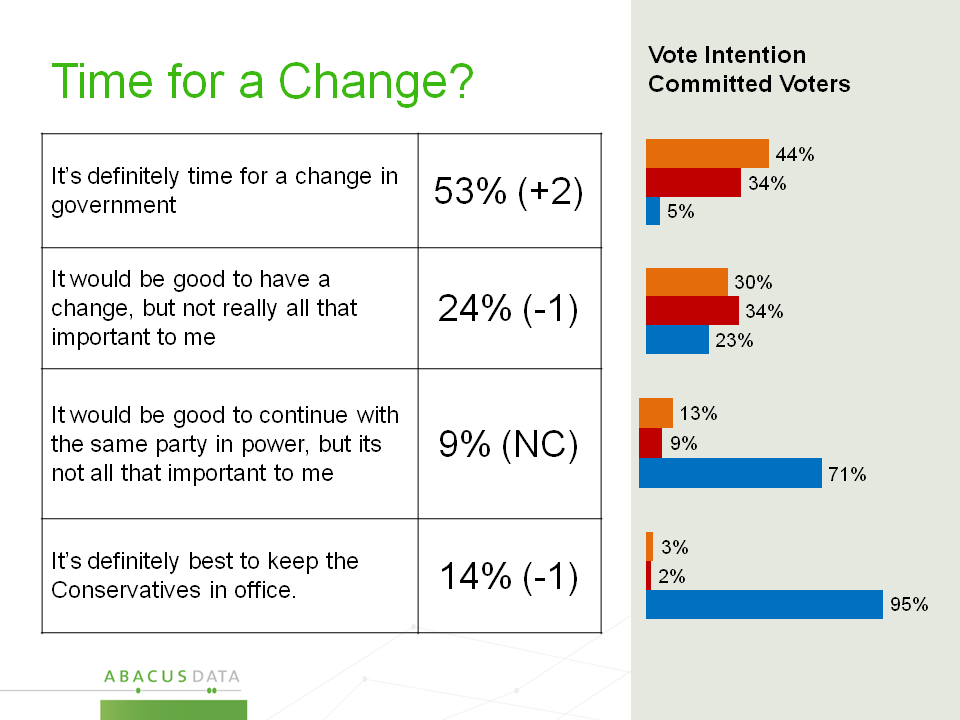
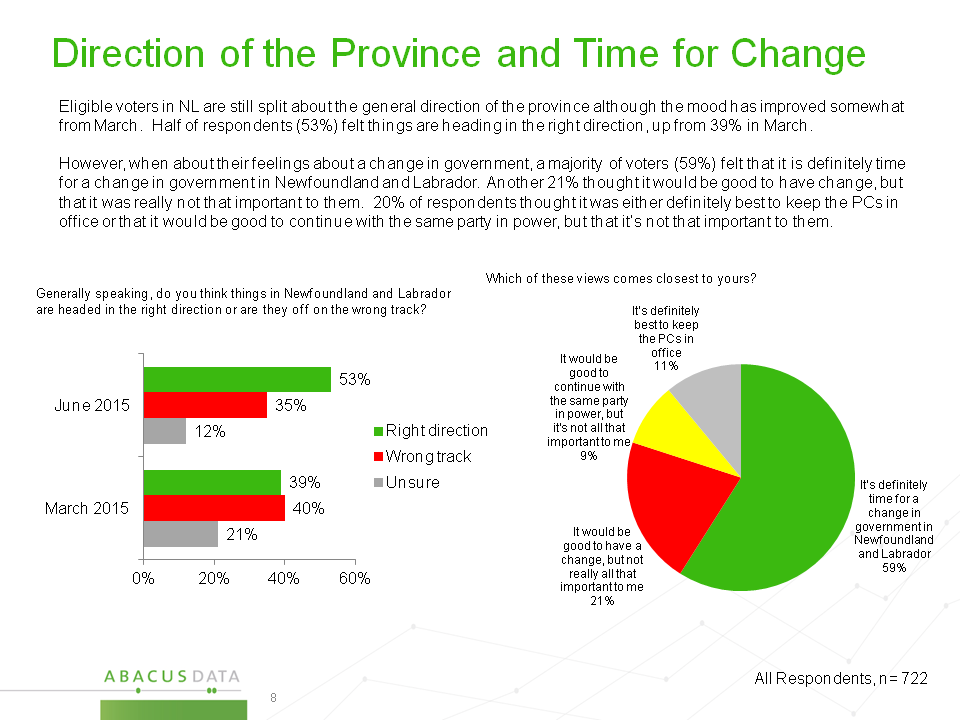
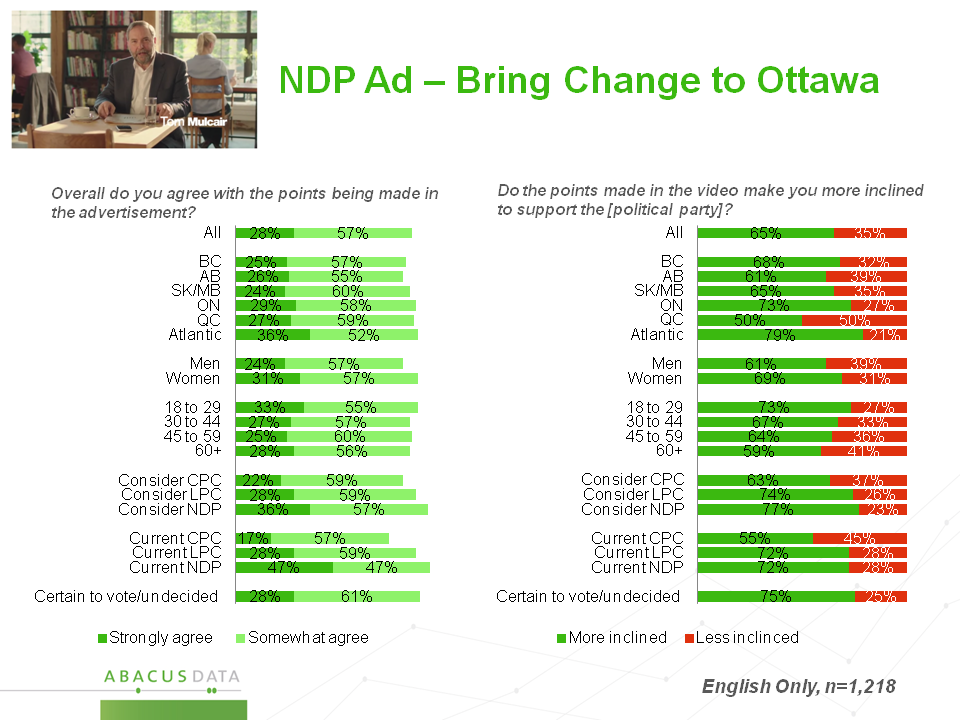
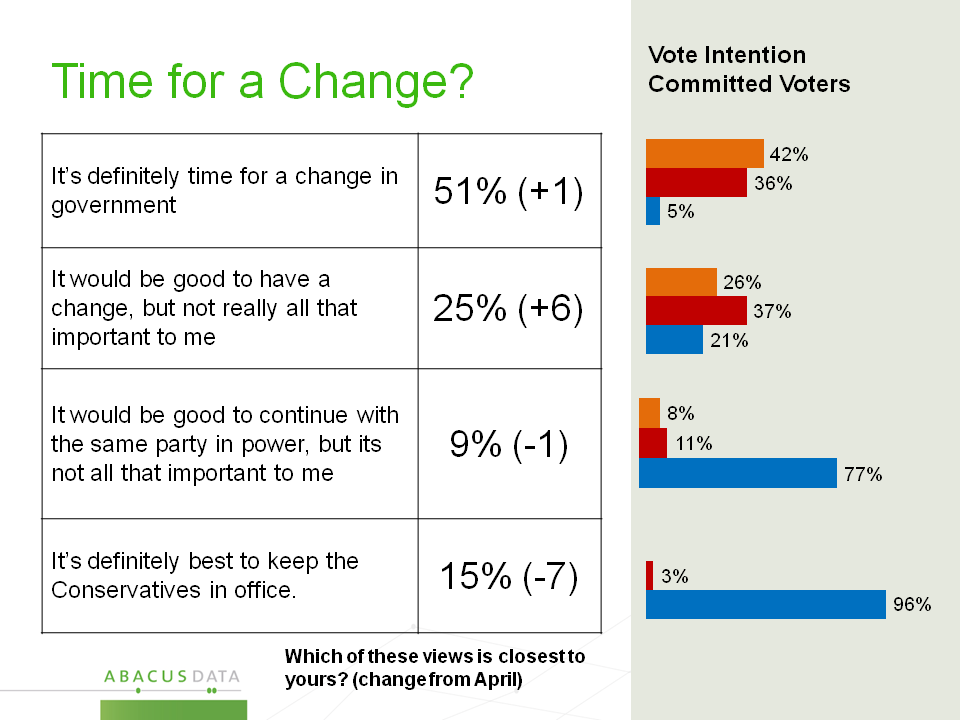
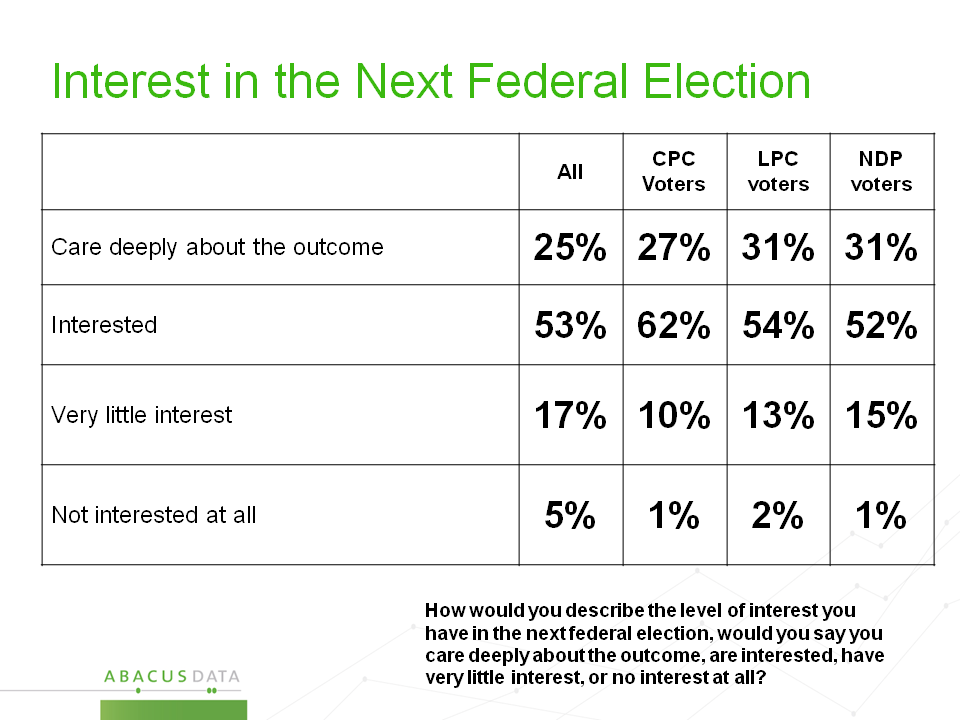
77% Prefer a Change in Government

In this wave, 77% say they would prefer to see a change, although not all of these people feel strongly about the need for change. Among those who most want to see change, 44% would vote NDP and 34% would vote Liberal.

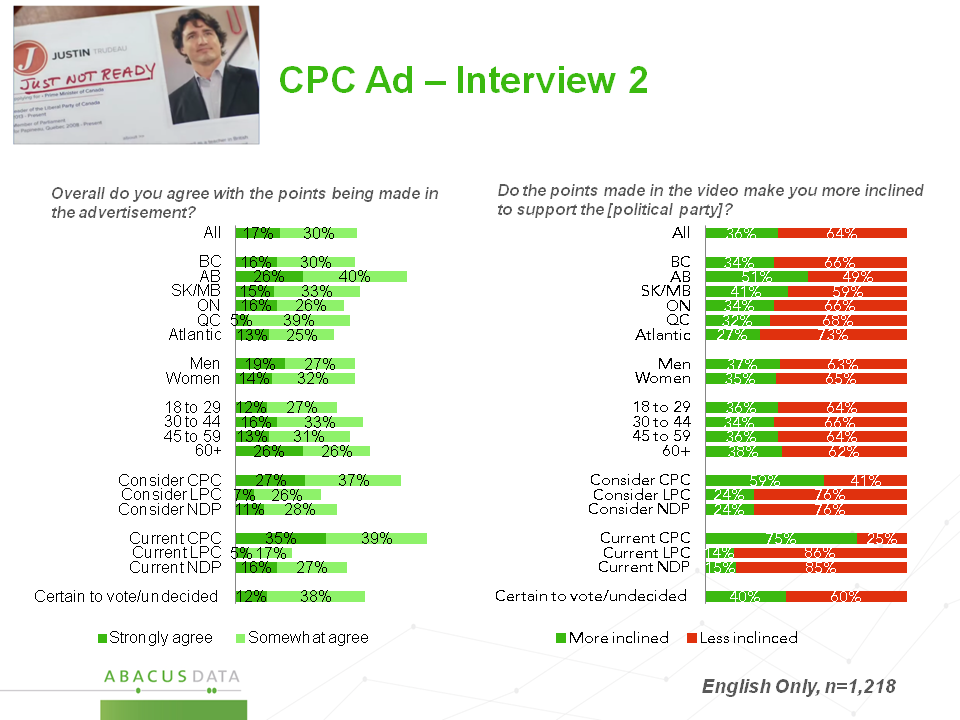
Only 14% are sure they want the Conservatives to win another term, and another 9% feel mildly this way. To win, therefore, the Conservatives need to win a bigger share of the 24% who mildly prefer change.

Slide13

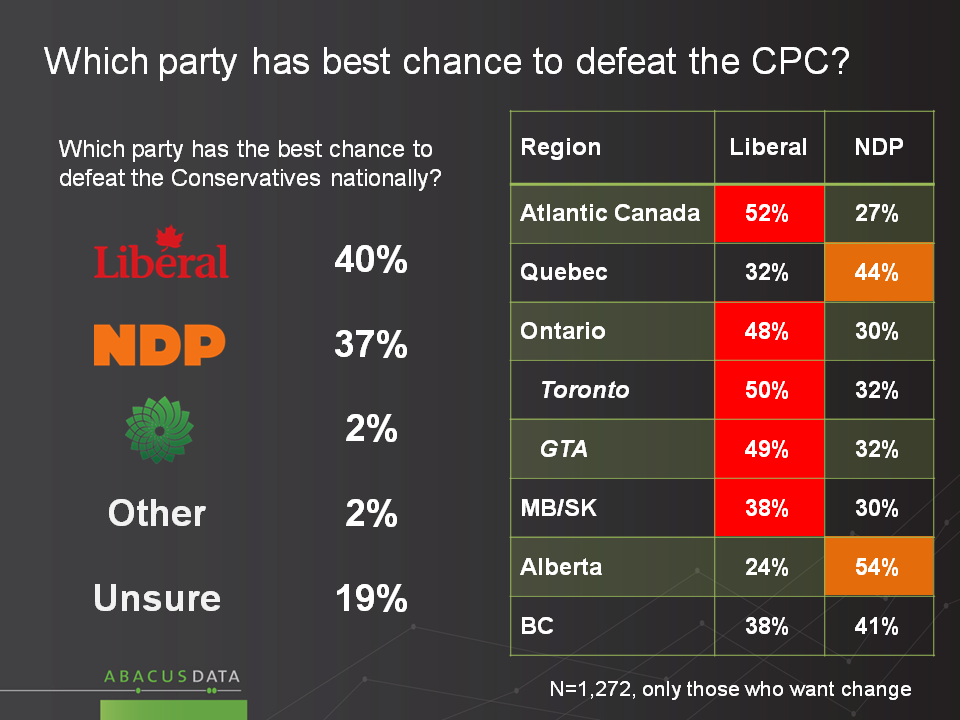
Who could beat the Conservatives? A split decision

Among those who want change, four in ten believe that the Liberals have “the best chance to defeat the Conservatives nationally”, while the NDP is a close second with 37%. Belief in Liberal chances is highest in Atlantic Canada (52%) and Ontario (48%), while Quebec (44%) respondents believe the NDP has a better chance to defeat the Tories. BC is split for Liberals (38%) and NDP (41%).

Slide14

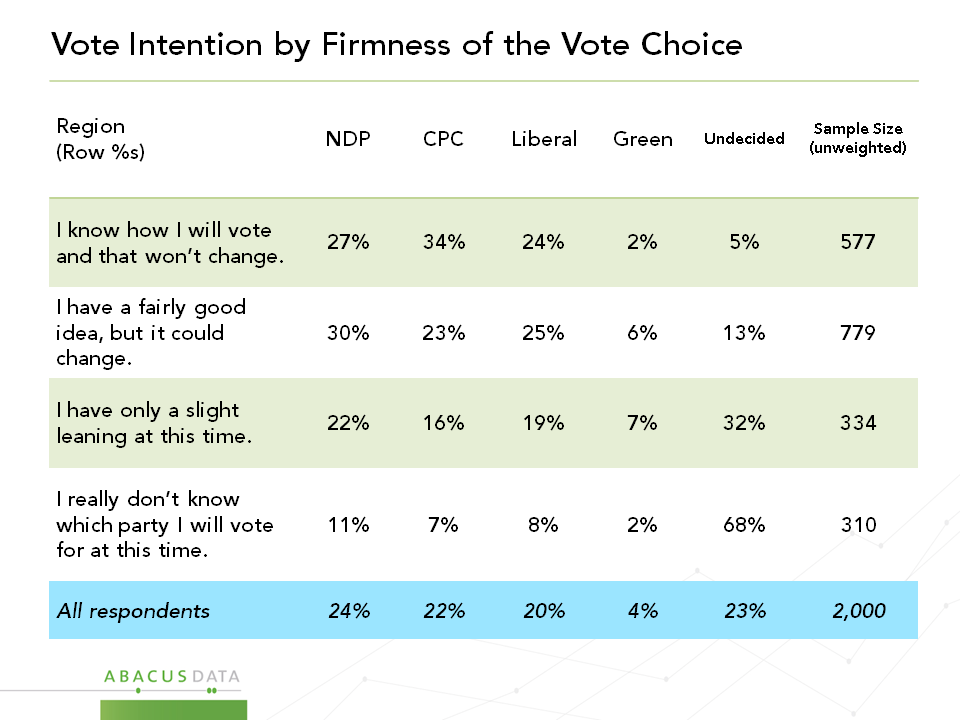
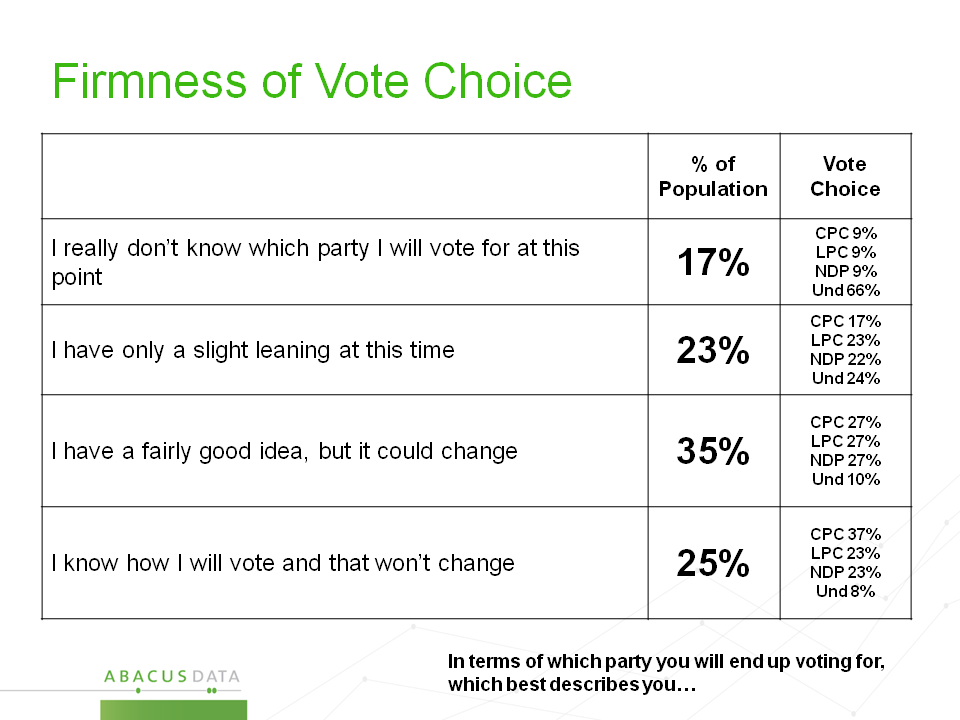
Only 28% know how they will vote.

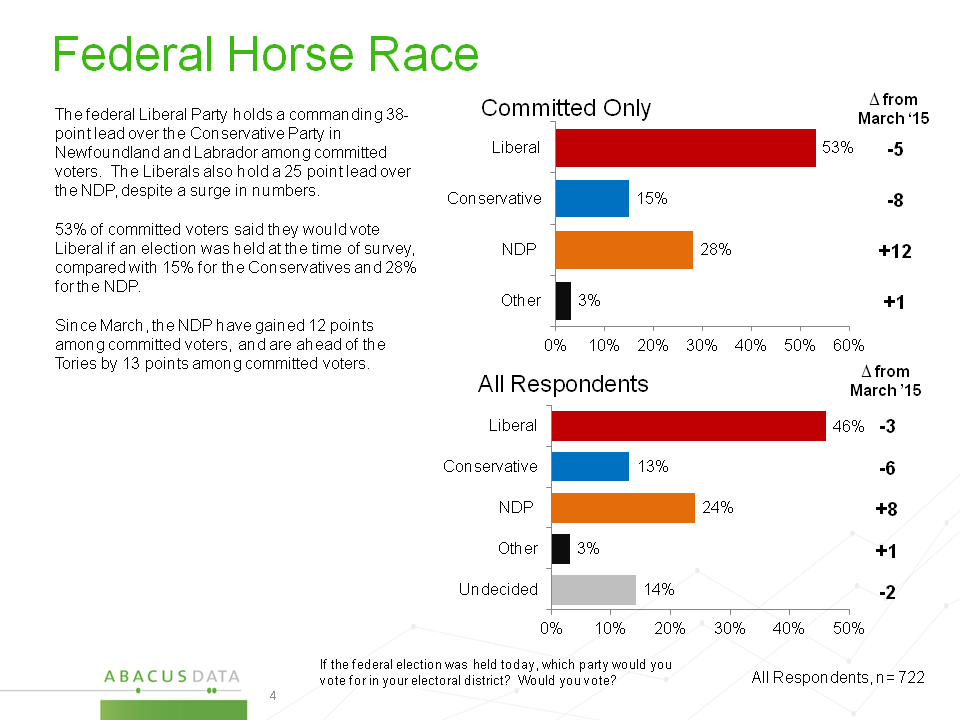
Just 28% say “I know how I will vote and that won’t change” up 3 points since our last survey, another 38% have “a fairly good idea, but that could change”, up 4 points. The Conservatives have the support of 34% of those who’ve made a have a firm decision, and 23% of the “fairly good idea” group.

Together, among committed voters, this would provide the incumbents with 31% in total among these two segments, compared to 32% for the NDP and 27% for the Liberals.

Slide10

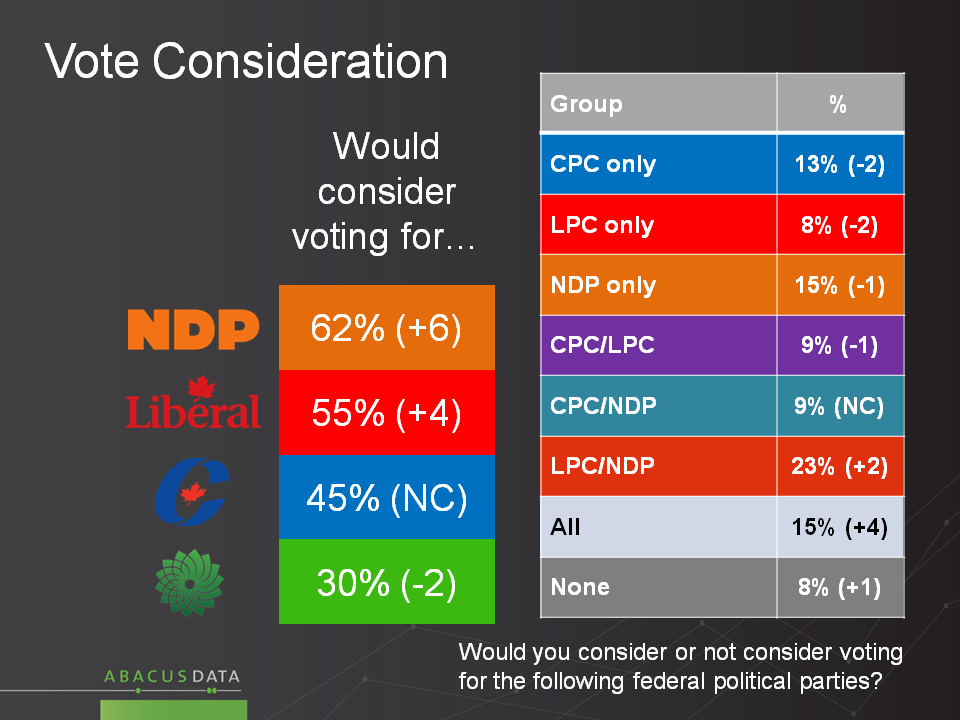
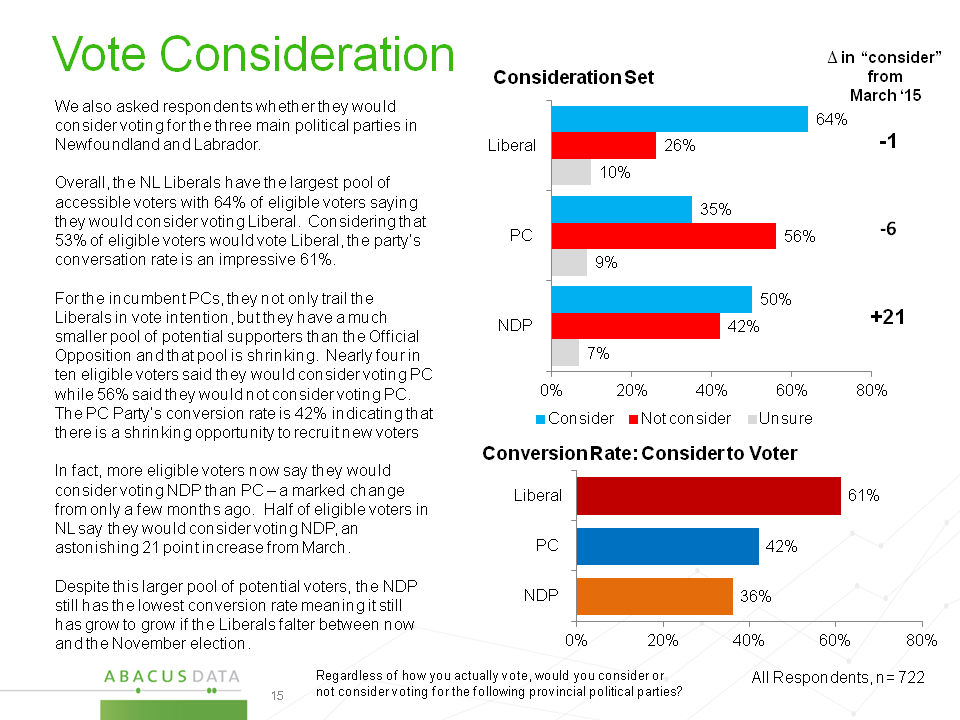
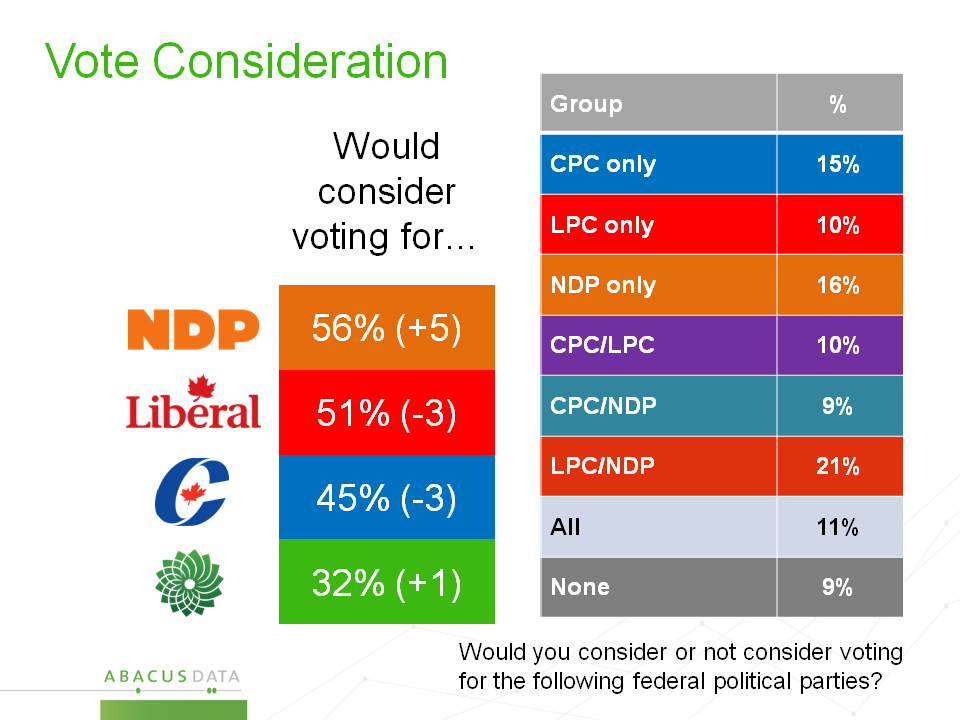
NDP & Liberal pools grow, CPC pool steady but smaller

In the last month, we see continued growth (+6) in those who would consider voting NDP, giving the party the largest potential voter pool at 62%, followed by the Liberals at 55% who are also up from last month (+4) and the Conservatives at 45%.

Slide12

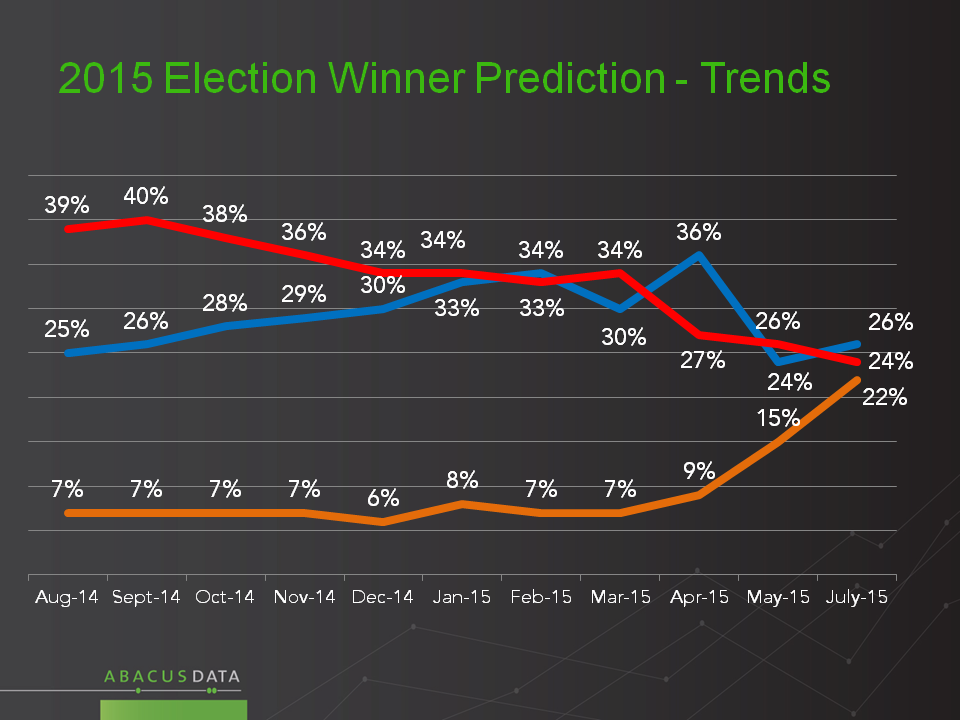
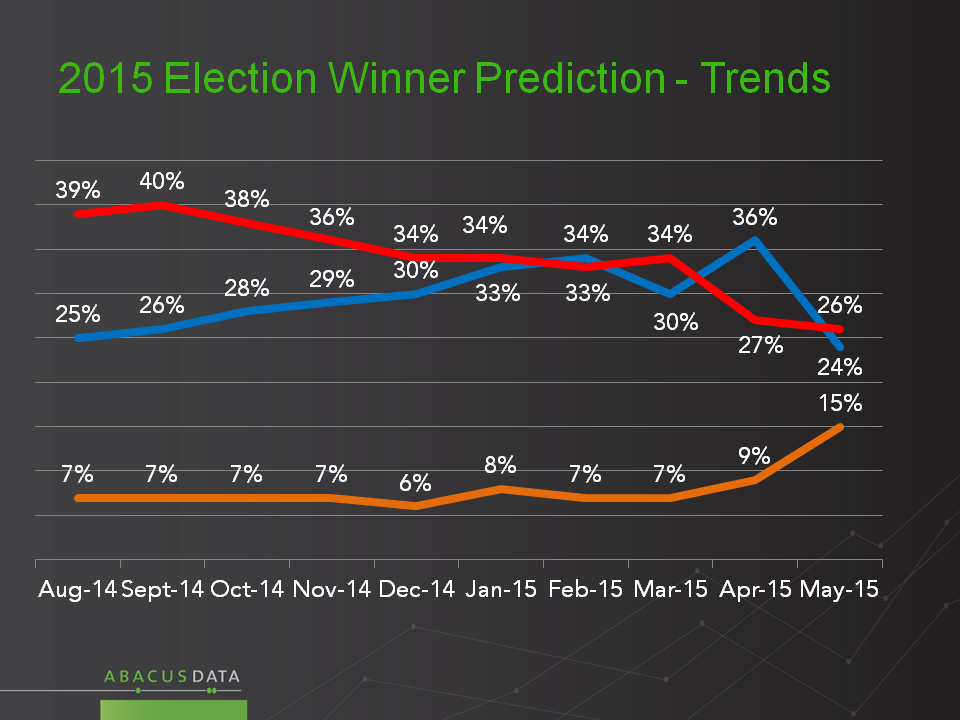
What outcome do Canadians predict?

The NDP’s rise in support is mirrored in expectations about who will win the next election. Today 26% think the Conservatives will win, 24% say the Liberals will win and 22% say the NDP (up 15 points over the last quarter).

Slide11

The Upshot?

The political competition we are seeing today is unprecedented. Five points separate the three main parties and the NDP is in the lead; last September the gap was 15 points, and the NDP was third.

While recent trends have been challenging for the Liberals, these numbers are just as sobering for Conservatives. A lot of voters are inclined to want change, and there is little evident fear of the prospect of the NDP forming a government.

To win a fourth straight election, the Conservatives will have to present their own, compelling version of what they would do next, or make change seem more risky, or both. But relying on historic hesitation about the NDP, or the ability to diminish leadership opponents, has shows little promise as a re-election strategy, and simply may not work in 2015.

Given these competitive dynamics, it is clear that all the parties will be revising their approaches, constantly, over the next 100 days. Predictions of the overall outcome, let alone seat projections, are in these circumstances little more than amusing guesswork.

Methodology

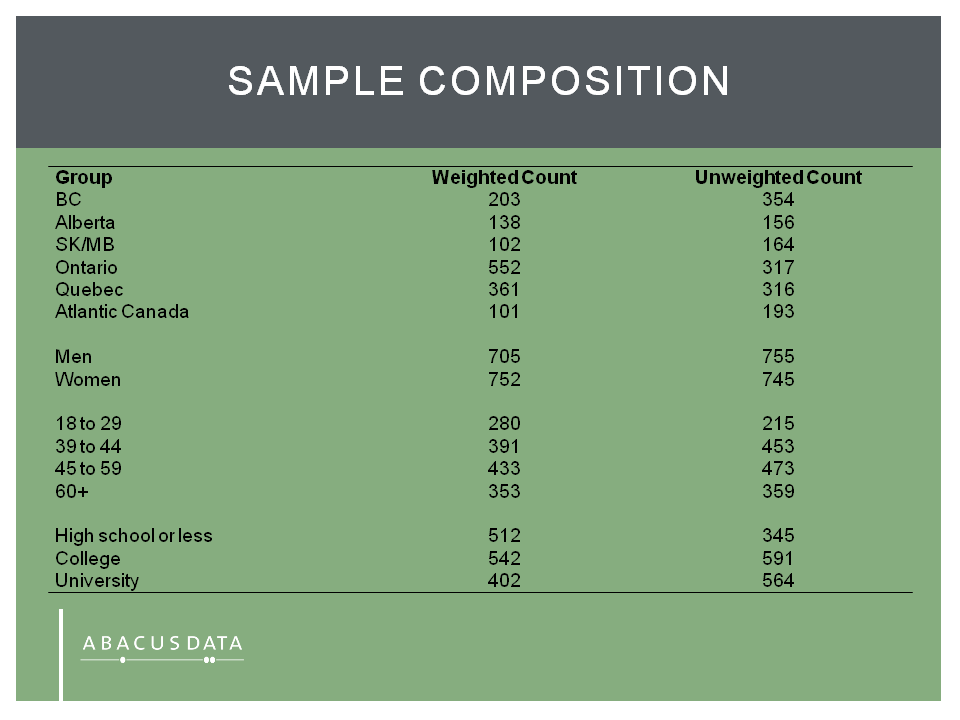
Our survey was conducted online with 2,000 Canadians aged 18 and over from July 3 to 6, 2015. A random sample of panelists was invited to complete the survey from a large representative panel of Canadians, recruited and managed by Research Now, one of the world’s leading provider of online research samples.

The Marketing Research and Intelligence Association policy limits statements about margins of sampling error for most online surveys. The margin of error for a comparable probability-based random sample of the same size is +/- 2.2%, 19 times out of 20. The data were weighted according to census data to ensure that the sample matched Canada’s population according to age, gender, educational attainment, and region. Totals may not add up to 100 due to rounding.

Abacus Data Inc.

We offer global research capacity with a strong focus on customer service, attention to detail and value added insight. Our team combines the experience of our Chairman Bruce Anderson, one of Canada’s leading research executives for two decades, with the energy, creativity and research expertise of CEO David Coletto, PhD. For more information, visit our website at http://www.abacusdata.ca/

We like where we live, especially if it’s Vancouver.

PdfExport

We asked 1,500 Canadians at the end of May to tell us about where they live. Here are the highlights:

16% think their community is the “best place in the world to live”. Comparing Canada’s three biggest cities, 30% in Vancouver think they live in the best place in the world, 21% in Montreal, while 12% of GTA respondents feel this way.

Slide12

21% think they live “one of the best places in Canada”, and 40% said they lived in a “better than average” place.  Just one in five think they live in an “average” place, and only 3% said “not a particularly good place.”

When asked what they like most about where they live, 87% said “quality of life” compared to 13% who said it was “economic conditions”.  When asked what they would most like to see improved, most said economic conditions (65%) – logical given the current high level of satisfaction with the quality of life.

When asked what they would most like to see improved, the majority said economic conditions (65%) – presumably because of their current high level of satisfaction with the quality of life where they live.

Slide15
Slide16
Slide17

We tested five possible local priorities and asked respondents to pick the most important one.  40% put a focus on the economy, 23% said improving roads and transit, 19% easing hardship, 9% safety/crime reduction and 9% improving the environment.

Slide18

There were important subgroup differences in priority setting.  In Atlantic Canada, there was a much greater importance attached to improving economic conditions.  Crime and safety issues were more important in western Canada.  Transit and roads were more crucial in urban areas. Easing hardship was a much higher priority among households with the lowest incomes. The environment is given a little more prominence in urban areas and in Quebec.  Conservative voters put more emphasis on the economy and crime and less on easing hardship.  Green party voters put less emphasis on roads and transit and more on the environment.

Slide19
toppriority

The Upshot?

Famously, US House of Representatives Speaker Tip O’Neill is quoted as saying “all politics is local”.  Here in Canada, quality of life in local communities is a crucial undercurrent in national politics – it is where people experience a healthy or weak economy, and where they consume public services like health and education.

Three out of four people feel they live in a pretty good place and almost half think they live in one of the best places in the country or in the world.  People see quality of life as the best thing about their community, and a healthy economy as a pre-requisite of a satisfying local quality of life.

Political parties and candidates will experience different voter priorities in different regions this fall.  The economy will be a fixation for many people, but not equally across the country.  In congested urban areas, improving infrastructure matters a lot.  Easing hardship finds a bigger market than fighting crime, in every place but the Prairies. The environment finds roughly 1 in 10 people who put it at the top of the priority list.

Abacus Chairman Bruce Anderson quote:

“The most successful politicians know well that Tip O’Neill had it right – that while parties must have key national themes, local candidates must be armed with solutions to local priorities: everything from job creation, to transit, poverty, crime and the environment.

People experience “the economy” where they live, and less as a function of macro economic news.  Equally, fiscal balances, tax levels, social spending and economic stimuli are policy ideas evaluated through the lens of what impact they might have, if any, on local conditions.

Voters are drawn to politicians who are dialed in on what makes life great or not so great, in their community. In this unusually competitive election, national leaders may find themselves wanting to spend more time than usual talking up local solutions and making sure their national agendas sound relevant locally. And there’s a remember in these numbers that for most people, a strong economy is more “means” than “end” – and that the outcome people care most about is a more broadly defined good quality of life.”

Methodology

Our survey was conducted online with 1,500 Canadians aged 18 and over from May 28 to May 31, 2015. A random sample of panelists was invited to complete the survey from a large representative panel of Canadians, recruited and managed by Research Now, one of the world’s leading provider of online research samples.

The Marketing Research and Intelligence Association policy limits statements about margins of sampling error for most online surveys. The margin of error for a comparable probability-based random sample of the same size is +/- 2.6%, 19 times out of 20. The data were weighted according to census data to ensure that the sample matched Canada’s population according to age, gender, educational attainment, and region. Totals may not add up to 100 due to rounding.

Sample Composition
sample composition
Abacus Data Inc.

We offer global research capacity with a strong focus on customer service, attention to detail and value added insight. Our team combines the experience of our Chairman Bruce Anderson, one of Canada’s leading research executives for two decades, with the energy, creativity and research expertise of CEO David Coletto, PhD. For more information, visit our website at http://www.abacusdata.ca/

Federal Liberals ahead by 25 in Newfoundland and Labrador; NDP vote up 12 since March

According to a new VOCM-Abacus Data random telephone survey of 722 eligible voters in Newfoundland and Labrador conducted from June 17 to 21, 2015, the federal Liberal Party led by Justin Trudeau continues to hold a big lead in Newfoundland and Labrador.

The Liberals have the support of 53% of committed voters (down 5 since March) compared with 28% for the NDP (up 12 since March) and 15% for the Conservative Party (down 8 since March).

Among all eligible voters, 14% are undecided, down 2 since March.

Slide4

Regionally, the Liberals lead by a wide margin in all parts of the province except for around St. John’s and the Avalon Peninsula where the Liberals and NDP are statistically tied (LPC 42% vs. NDP 37%).

In 2011, the total vote split in the three ridings in St. John’s/Avalon Peninsula was: NDP 46%, CPC 28%, LPC 25%.  Based on the margin of error, the vote range for each party in the region is:

Liberal: Low 37%, Mid 42%, High 49%
NDP: Low 30%, Mid 37%, High 43%
CPC: Low 12%, Mid 17%, High 22%

There’s also an 80% chance that the Liberals are leading the NDP in the Avalon/St. John’s region.

This analysis indicates that the Liberal vote is likely up significantly since 2011 in the region, the Tory and NDP vote is likely down.

Slide5

Leadership Impressions

Despite trailing the Liberals by 25-points province wide, NDP Tom Mulcair has the most positive impression among eligible voters.

Overall, 43% have a positive impression of Mr. Mulcair (up 15 points since March) compared with 14% who have a negative impression of him (+29 score).  Mr. Trudeau’s personal numbers have held fairly steady since March with 43% viewing him favourably and 21% have an unfavourably impression of the Liberal leader (+22 net score).

Most eligible voters in NL continue to have a negative impression of Prime Minister Harper (69%) and only 14% view him positively (-55 net score).

Slide6

Who will win the next election?

When asked who will win the next federal election, 46% of eligible voters picked the Liberal Party while 21% picked the Conservative Party.   Nearly tied with the Conservative Party, 18% selected the NDP to win, while 15% were unsure.

In March, only 2% of eligible voters believed the NDP would win the next federal election.  Today, 18% believe the NDP is likely to win.  Expectations of a Liberal win are down 5 points while expectations of a Conservative win are down 9 points.

Methodology

The random live-interview telephone survey commissioned by VOCM was conducted with 722 eligible voters living in Newfoundland and Labrador.  The survey was completed from June 17 to 21, 2015. The margin of error for a probability-based random sample of 500 respondents using a probability sample is +/- 3.7%, 19 times out of 20.

The data was statistically weighted according to census data to ensure that the sample matched population of Newfoundland and Labrador.  The tables within this report detail the weighted and unweighted counts for the sample.

Note the small sample sizes when reviewing results in subgroups.

For more information about the poll’s methodology or the results, please contact David Coletto, CEO at david@abacusdata.ca or at 613-232-2806.

ABOUT ABACUS DATA:

Abacus Data is an innovative, fast growing public opinion and marketing research consultancy. We use the latest technology, sound science, and deep experience to generate top-flight research based advice to our clients.  We offer global research capacity with a strong focus on customer service, attention to detail and exceptional value

Our team combines the experience of our Chairman Bruce Anderson, one of Canada’s leading research executives for two decades, with the energy, creativity and research expertise of CEO David Coletto, PhD. For more information, visit our website at http://www.abacusdata.ca/

VOCM-Abacus Data Newfoundland and Labrador Provincial Poll: Full Details

PdfExport

On Friday we released the vote intention of eligible voters in Newfoundland and Labrador from the random telephone survey we conducted with VOCM on provincial politics in the province.

Today, we release the full report on the provincial politics portion of the survey.  Tomorrow we will release our look at federal politics in the province.

Direction of the Province and Time for Change

Despite an 11-point drop in support for the incumbent Progressive Conservative Party, eligible voters in NL are more likely to say that things in Newfoundland and Labrador are headed in the right direction than off on the wrong track.  This is an improvement in the overall mood of the province since March.

However, when about their feelings about a change in government, a majority of voters (59%) felt that it is definitely time for a change in government in Newfoundland and Labrador.  Another 21% thought it would be good to have change, but that it was really not that important to them.  20% of respondents thought it was either definitely best to keep the PCs in office or that it would be good to continue with the same party in power, but that it’s not that important to them – a difficult climate for a government looking to earn a fourth straight mandate from voters.

Slide8

Top Issues

Respondents were asked what the most important issue facing Newfoundland and Labrador was unprompted.  There was no consensus choice but the economy and jobs, health care, and the budget deficit were the top three elected issues. Other issues identified by respondents included oil prices, the fishery, natural resources, and infrastructure.

Slide5

After asking respondents to identify their top issue,  we asked respondents which NL political party is best able to deal with the issue.  Overall, 35% of respondents believed the Liberals would best handle the issue they thought was most important while 19% selected the PC Party and 15% picked the NDP.  22% were unsure while 8% said none of the parties could handle the issue they thought was most important.

On the top three issues, the Liberals lead on which party is best able to deal with the economy, health care, and the deficit.

Slide6

The HST Increase

The survey also asked respondents whether they felt the proposed 2-point HST increase scheduled for January 2016 should be cancelled if the price of oil continues to increase.  Half of respondents (51%) stated that the increase should be cancelled no matter what happens to oil, while roughly a quarter (25%) felt it should be cancelled if the price of oil does in fact continue to increase.  Only 16% felt the HST should increase regardless to help manage the deficit.

Party Leader Impressions

Liberal Leader Dwight Ball is viewed much more positively than PC Leader and Premier Paul Davis and somewhat more positively than NDP Leader Earle McCurdy.  Over four in ten eligible voters in NL have a positive impression of the NL Liberal Leader while only 16% view him negatively.  His net +28 rating is significantly better than the net +2 rating for the Premier, Paul Davis and the net +17 for NDP Leader Earle McCurdy.

In his own right, Paul Davis’ personal numbers remain positive although they have softened since March.

The new NDP Leader Earle McCurdy is viewed positively by many voters.  Thirty-six percent have a positive impression of him compared with 19% who view him negatively.  Although 11% are unsure about him, that is relatively low considering the short time he has been NDP leader.

Since our last survey in March 2015, Mr. Ball’s personal numbers have only changed slightly with his positive rating down three points (from 47% to 43%) and his negatives only up three percentage points.  In contrast, Mr. Davis’ personal numbers are have worsened somewhat.  While his positive numbers are unchanged, his negative numbers are up four percentage points since March.

Slide9

Assessing the Opposition Parties

Although the provincial Liberals and NDP scored similarly across most of the tested statements regarding how they would handle themselves in office, there was a key difference in how they were perceived as leaders.

While 63% of respondents felt the Liberals were ready to be government, just 37% felt the same about the NDP.

Slide17

Methodology

The random live-interview telephone survey commissioned by VOCM was conducted with 722 eligible voters living in Newfoundland and Labrador.  The survey was completed from June 17 to 21, 2015. The margin of error for a probability-based random sample of 500 respondents using a probability sample is +/- 3.7%, 19 times out of 20.

The data was statistically weighted according to census data to ensure that the sample matched population of Newfoundland and Labrador.  The tables within this report detail the weighted and unweighted counts for the sample.

Note the small sample sizes when reviewing results in subgroups.

For more information about the poll’s methodology or the results, please contact David Coletto, CEO at david@abacusdata.ca or at 613-232-2806.

ABOUT ABACUS DATA:

Abacus Data is an innovative, fast growing public opinion and marketing research consultancy. We use the latest technology, sound science, and deep experience to generate top-flight research based advice to our clients.  We offer global research capacity with a strong focus on customer service, attention to detail and exceptional value

Our team combines the experience of our Chairman Bruce Anderson, one of Canada’s leading research executives for two decades, with the energy, creativity and research expertise of CEO David Coletto, PhD. For more information, visit our website at http://www.abacusdata.ca/

NL Liberals lead as NDP surges past Tories into second place

PdfExport

According to a new VOCM-Abacus Data random telephone survey of 722 eligible voters in Newfoundland and Labrador conducted from June 17 to 21, 2015, the NL Liberals continue to hold a large lead in voter support.  The survey also finds a surge in support for the NDP, which has jumped into second place ahead of the PCs, who now find themselves in third place, 32-points behind the Liberals.

The Liberals lead the NDP by 28-points with support at 53% among committed voters.  The NDP stands at 25% while 21% of committed respondents would vote for the Progressive Conservatives.  Support for the Liberals is down 4-points, up 16-points for the NDP, and down 11-points for the PCs since March 2015.

Among all respondents, 19% said they were undecided unchanged from March.

vocm
NL vote

Liberals ahead in all regions of Newfoundland and Labrador

The Liberal Party leads in all regions of the province although the race is much closer on the Avalon Peninsula and in the St. John’s region where the Liberals have a 9-point lead over the NDP. In the region, the Liberals have the support of 42% of committed voters compared to 33% for the NDP and 24% for the PCs.

In the rest of the province, the Liberals have very large leads over their rivals.  In Eastern Newfoundland, the Liberals led by 45-points over the Tories (L 68, PC 23, NDP 9).  In Central Newfoundland, the Liberal lead is 45-points over the Tories (L 64, PC 19, NDP 17), while in Western Newfoundland, the Liberals lead by 45-points over the NDP (L 65, NDP 20, PC 15).  In Labrador, the Liberal lead is 28-points over the NDP (L 45%, NDP 26%, PC 18%).

Slide12

Only four in ten past PC voters are currently supporting the PCs; 28% of former NDP voters now back the Liberals

When we compare current vote intention with how voters said they voted in the 2011 provincial election, the Liberal Party’s lead is built around three factors: it is holding most of its previous support (92% of former Liberal voters currently support the party), it has attracted 41% of former PC supporters while also gaining the support of 28% of those who voted NDP in the last provincial election.

The Progressive Conservative Party has the support of only 44% of its former supporters.  Twenty-seven percent (41%) of former PC supporters now say they would vote Liberal while 14% said they are now supporting the NDP.

The NDP has lost about three in ten of its past voters with 28% saying they would vote Liberal and 2% saying they would vote PC.

NL Liberals have the largest pool of accessible voters but the NDP is gaining

The survey also asked respondents if they would consider voting for each of the three main political parties.  The Liberals have the largest pool of accessible voters with two in three eligible voters (64%) in NL saying they would consider voting Liberal.  This compares with 50% for the NDP and 35% for the PCs.

For the NDP, its pool of accessible voters has surged by 21-points since March and the election of its new leader Earle McCurdy.  The Tories, on the other hand, have seen a further erosion of its potential support.  Only 35% of eligible voters in NL now say they would consider voting PC, down 6-points since March.

Slide15

Insights from Abacus Data

Since March, the political landscape in Newfoundland and Labrador has changed substantially.  While the Liberals continue to hold a large lead over their rivals, the NL NDP has surged ahead of the incumbent PCs into second place.  The election of the NDP in Alberta and the positive reception that NDP leader Earle McCurdy has received since becoming leader in March likely accounts in the surge of support for the NDP in not only vote intentions, but also in the number of eligible voters who would consider voting NDP.   The NDP is in a much stronger position today than they were only three months ago when the party was languishing in single digit support.

The same cannot be said for the incumbent Progressive Conservative Party.  Since March of this year, support for the incumbents has dropped 11-points to 21%.  To make matters worse, fewer eligible voters today would consider voting PC than at any point since we started tracking voter intentions in the province.  Only 35% of eligible voters would consider voting PC – almost half as many as would consider voting for the Liberal Party.

The desire for change in the province is strong and despite relatively good personal numbers, Premier Davis faces a daunting challenge rebuilding his party’s support before the November election.  Not only does he face a Liberal Party with broad and deep support across the province but an upstart NDP which is benefiting from a popular leader and renewed interest in the party.

Early next week we will release further results from the survey on top issues, the desire for change, leaders, and how voters perceive the two opposition leaders.  We will also have reaction to the HST hike announced in the recent provincial budget.  That will be followed by a look at federal politics in Newfoundland and Labrador.

Methodology

The random live-interview telephone survey commissioned by VOCM was conducted with 722 eligible voters living in Newfoundland and Labrador.  The survey was completed from June 17 to 21, 2015. The margin of error for a probability-based random sample of 500 respondents using a probability sample is +/- 3.7%, 19 times out of 20.

The data was statistically weighted according to census data to ensure that the sample matched population of Newfoundland and Labrador.  The tables within this report detail the weighted and unweighted counts for the sample.

Note the small sample sizes when reviewing results in subgroups.

For more information about the poll’s methodology or the results, please contact David Coletto, CEO at david@abacusdata.ca or at 613-232-2806.

ABOUT ABACUS DATA:

Abacus Data is an innovative, fast growing public opinion and marketing research consultancy. We use the latest technology, sound science, and deep experience to generate top-flight research based advice to our clients.  We offer global research capacity with a strong focus on customer service, attention to detail and exceptional value

Our team combines the experience of our Chairman Bruce Anderson, one of Canada’s leading research executives for two decades, with the energy, creativity and research expertise of CEO David Coletto, PhD. For more information, visit our website at http://www.abacusdata.ca/

On Political Debates and Advertising

19 million plan to watch leaders debate

PdfExport

Just over 19 million Canadian adults (69%) intend to watch at least one leaders’ debate this fall, including almost 6 million (21%) who say they will watch as many as possible, according to results in our survey. The audience will be spread across the country and will include slightly more men and older people than women and younger people. Equal proportions of the voters who will consider each of the three largest parties say they will watch.

Slide2

A total of 49% of those we surveyed this month said they were certain to vote but were not fully committed to any party yet. Among this group 69% say they will watch at least one debate, and 15% will watch as many as they can. These debates may well turn to be more decisive in the election outcome than usual.

When informed that Stephen Harper will attend several debates but not those hosted by CBC, CTV, and Global, the majority (62%) believes the networks should host debates anyway. This includes 40% of those who intend to vote Conservative, and 51% of those who are considering supporting the CPC. Women are particularly of the view (67%) that the debates should be held despite the PM’s absence.

Slide4

3 out of 4 Say PM Should Attend Network debates

A large majority (74%) believes the PM “should change his position and attend the debates hosted by the networks as they reach the largest audience”. Only one in four (26%) are persuaded by the argument that “as long as he is participating in some debates he is entitled to decide which debates he wants to be part of”.

This view is held by 63% of CPC voters and 65% of those who say they will consider voting CPC. Among those certain to vote but not yet committed to a party, 74% say the PM should reconsider.

Slide5
Political Ad Testing

We measured reactions to four different political advertisements (two CPC ads – here and here), one LPC and one NDP ad). In each case, we asked if the topic of the ad is important, if the audience agreed with the points being made, if the ad built support for the sponsor, and if the ad is fair or unfair.

Slide6

Topic Importance

Of the four ads, three of them scored very well for dealing with important topics (NDP Bring Change to Ottawa 81%, CPC Proven Leadership 68%, LPC Fairness Plan 65%). The CPC Interview Ad that focused on Justin Trudeau and finished with a comment about his hair was considered to be addressing an important topic by considerably fewer people, 51%.

Agree with Points Made

Large majorities agreed with the points made in the NDP ad (85%), the LPC ad (75%) the CPC Leadership ad (70%). Only 47% found themselves agreeing with the CPC Interview/Hair ad.

Impact on Support

The NDP (+30 net – more inclined minus less inclined) and the Liberal Party ad (+18) were the most likely to result in increased support.

The CPC Proven Leadership ad produced 50% more inclined and 50% less inclined for a net of 0.

The CPC Interview/Trudeau Hair ad had a negative 29 net score, with 36% saying it made them more inclined to support the Conservatives and 65% saying it had the opposite reaction.

Tone/Fairness

Three of the four ads were considered fair by large majorities (80% plus) of those surveyed. Less than half (41%) considered the CPC Interview Trudeau Hair ad fair, while 59% felt it “crossed the line and was unfair”.

Slide7
Slide8
Slide9
Slide10

The Upshot?

According to Abacus Chairman Bruce Anderson:

“Advertising and leader debates will likely be vitally important in this election campaign. A very large number of people say they will watch the leaders debate and several million voters say they will watch as many of the debates as they can.

Most prefer to see the network consortium proceed with debates even in the absence of the PM, and most voters don’t agree with the PM’s decision to skip the major network debates.

If the race continues to be as close as it is now, Mr. Harper and his advisors may regret the decision they’ve taken, and/or reconsider their position. It’s hard to see the upside in being absent, and easy to see the risk of appearing arrogant by not showing up.

When it comes to advertising, the NDP and Liberal messages as well as the Conservative leadership ad have landed well, and show that many people are receptive to the core messages that the three parties are working with.

However, the results offer a reminder to the Conservatives that while negative ads may have worked in the past, they carry risk at this point in the life of this government. Even if attack ads aimed at Mr. Trudeau have some impact on the views of the Liberal leader, they may not result in more support for the Conservatives – instead they could increase the desire for change.”

In case you missed it, yesterday we released results about federal vote intentions, potential party supporters, and who Canadians think will win the next election.

Methodology

Our survey was conducted online with 1,500 Canadians aged 18 and over from May 28 to May 31, 2015. A random sample of panelists was invited to complete the survey from a large representative panel of Canadians, recruited and managed by Research Now, one of the world’s leading provider of online research samples.

The Marketing Research and Intelligence Association policy limits statements about margins of sampling error for most online surveys. The margin of error for a comparable probability-based random sample of the same size is +/- 2.6%, 19 times out of 20. The data were weighted according to census data to ensure that the sample matched Canada’s population according to age, gender, educational attainment, and region. Totals may not add up to 100 due to rounding.

Abacus Data Inc.

We offer global research capacity with a strong focus on customer service, attention to detail and value added insight. Our team combines the experience of our Chairman Bruce Anderson, one of Canada’s leading research executives for two decades, with the energy, creativity and research expertise of CEO David Coletto, PhD. For more information, visit our website at http://www.abacusdata.ca/

Up For Grabs: Federal Election 2015 a Toss-Up

Conservatives shed 5 points, NDP up 4

PdfExport

Our latest horserace “who would you vote for tomorrow” question shows an extremely tight race, with the Conservatives at 31% and the NDP and the Liberals at 28%.  In the provinces with the most seats and the largest sample sizes, the Liberals have a slight lead over the Conservatives in Ontario and the NDP has a sizeable lead over the Liberals in Quebec.  We see a close 3-way race in BC.

A closer look at some of the demographic patterns suggests that some movement from the Conservatives towards the NDP is happening among voters 60 and older, traditionally a critical bastion of Conservative support.  NDP support has also grown in the last month among those with higher levels of education, homeowners, and union members.

Slide3
Slide4
demos

More Canadians in the Mood for Change

Our latest results show a 7-point jump in the number of people who think it would be good to have a change in government in Ottawa, and a corresponding drop in the number of people who thing “it’s definitely best to keep the Conservatives in office”.   In this wave, 76% say they would prefer to see a change, although not all of these people feel strongly about the need for change.

Slide8
Huge Proportion of Votes up for Grabs

Only 25% of those polled say, “I know how I will vote and that won’t change”.  Among this group, 37% intend to vote Conservative.  One way to interpret this is that the resolute CPC vote is 9% today, 3 points higher than that of the NDP or Liberals, but not exactly large.

Another 35% say they have “a fairly good idea, but that could change”.  Among this group, all three major parties have an equal share of voting intentions.

Just about a quarter (23%) say “I have only a slight leaning at this time” and 17% say they “don’t really know which party they will vote for at this time.

Slide9

Among those who voted Conservative in 2011, many are not fully committed to supporting the party again.  Just one in three of those who voted Conservative say they know how they will vote and that won’t change (92% are voting Conservative).  The other two thirds of their 2011 coalition say they are not necessarily with the Conservatives at this point.

NDP potential expands, no party enjoys a large, loyal base

In the last month, we see a 5-point increase in the percentage of people who say they would consider voting NDP, giving the party now the largest potential voter pool at 56%, followed by the Liberals at 51% and the Conservatives at 45%.  Just about a third would consider voting Green.

The percentage of those who would consider voting NDP is up the most in Quebec (+10) but is also up in Atlantic Canada (+12) with slight increases in BC (+4), Alberta (+4), and Ontario (+2).

Cross-tabulating these results, reveals that the base pool (would only consider this party) for the Conservatives is 15%, for the NDP is 16% and for the Liberals is 10%.

Slide2

Who cares about this election?

One in four Canadians “care deeply about the outcome of this election” and LPC and NDP voters are a little more likely to feel this way than Conservative voters.   This measure of motivation is something we will watch going forward as it often has a bearing on turnout.  Another 53% say they are interested in the election, which includes more Conservatives than Liberals or New Democrats.

Slide11

How do Canadians see this turning out?

Prognostication in these circumstances in getting a lot tougher, and when asked how they think the election will turn out, Canadians are reflecting this uncertainty. Today 26% think the Liberals will win, 24% say the Conservatives (down 12 points in a month) and 15% say the NDP (up 6 points in the month and 8 points over the last quarter).  Growth in the belief that the NDP could win is up in many parts of the country, not only in Quebec.

Slide6

The Upshot?

These results are the clearest evidence to date of a phenomenon that has been seen in several recent provincial elections –polls well in advance of an election can suggest stability in public opinion when in fact there is a remarkable softness to voting intentions.

According to Abacus Chairman Bruce Anderson:

“The true core vote for any of the three main parties, is actually less than 20% today, partly a function of long term disengagement of many people from the political process.  We can count on more shifting around of support than ever before, and less predictability.

Today’s numbers indicate that the desire for change in Ottawa is rising. There is a larger potential for the NDP brand to consolidate the “change vote” than we have seen in the past.  However, the Liberal brand is highly competitive, especially in the critical battleground of Ontario, and is seen as a more likely victor in October.

The results are sobering news for Conservative election planners.  While our data had shown an uptick in support based on the recent budget, this effect has dissipated.  With 20 weeks to Election Day the incumbents are struggling to build enthusiasm around their economic record or plans, and as our next release will reveal, the terror/security issue is losing momentum for the CPC as well.

All three parties have a chance to win the next election. But none can expect to win it without out-campaigning the others. And that means drawing voters beyond core loyalists.“

Methodology

Our survey was conducted online with 1,500 Canadians aged 18 and over from May 28 to May 31, 2015. A random sample of panelists was invited to complete the survey from a large representative panel of Canadians, recruited and managed by Research Now, one of the world’s leading provider of online research samples.

The Marketing Research and Intelligence Association policy limits statements about margins of sampling error for most online surveys. The margin of error for a comparable probability-based random sample of the same size is +/- 2.6%, 19 times out of 20. The data were weighted according to census data to ensure that the sample matched Canada’s population according to age, gender, educational attainment, and region. Totals may not add up to 100 due to rounding.

Abacus Data Inc.

We offer global research capacity with a strong focus on customer service, attention to detail and value added insight. Our team combines the experience of our Chairman Bruce Anderson, one of Canada’s leading research executives for two decades, with the energy, creativity and research expertise of CEO David Coletto, PhD. For more information, visit our website at http://www.abacusdata.ca/

What Albertans think about their new government and energy issues.

We’ve completed an in depth survey among 1,000 residents of Alberta. This release deals exclusively with matters related to energy, and more of the data will be available in the coming weeks. Our first two releases, from the last week, can be found by clicking here and here.

Energy Issues and the Popularity of the NDP Government

The vast majority of Albertans say that in evaluating the performance of the new government, they will pay attention to it’s impact on the oil and gas sector (88% say very or somewhat important) oil sands development (86%) and pipelines to move Alberta’s oil and gas (86%). A smaller majority (72%) says how the province deals with “climate change” will be important.

Slide2

Expectations about the impact of the government on each of these issues is mixed, suggesting that the Notley administration will experience public scrutiny, notwithstanding the fact that most voters have a neutral to positive feeling about the NDP win.

Here’s what the results show:

– More people think the new government will have a negative impact rather than a positive impact on the oil and gas sector ((48% negative-40% positive), oil sands development (52% negative – 34% positive) and pipelines (52% negative – 33% positive)

– A modest majority (62%) expects the new government will have a positive impact in terms of dealing with climate change.

Slide1

Carrying Through on Promises

When it comes to fulfilling the promises made by the NDP before the election, the results show that most people (58%) want the government to carry through with creating a “resource owners rights Commission to review the royalty system and recommend ways to increase processing in province and a good return for Albertans.” 17% would prefer the new government abandon that promise, and 24% have no strong feelings either way.

A larger majority (67%) would like to see the government carry through with the “development of renewable energy projects in the province”, while only 12% would like to see that promise abandoned and 22% have no strong views.

However, when it comes to “opposing the Northern Gateway pipeline” only 21% would like to see the NDP take this position in government, while 53% say they should shift their ground, and 26% are more indifferent. Even among NDP voters, only 31% say the government should oppose Northern Gateway.

Slide3

Energy Policy Choices for Alberta

We asked respondents whether they would like to see the Notley government do a number of things in regard to energy, and the results show a desire to see both support for the use of Alberta’s oil and gas as well as efforts to improve energy efficiency and use renewable sources of energy.

• 90% would like her to implement an ‘energy efficiency strategy’
• 89% would like her to implement a ‘renewable energy strategy’
• 85% would like Ms. Notley to support pipelines to the east
• 79% would like Ms. Notley to support a pipeline to the west
• 76% would like Ms. Notley to support the Keystone XL pipeline
• 71% would like Ms. Notley to “work with other provinces to establish a way to put a price on carbon to help combat climate change”.

Among NDP voters, 79% want Ms. Notley to support pipelines east, 69% want her to support a western pipeline, 65% want her to support Keystone XL. Among Wildrose supporters, 71% want her to implement a renewable energy strategy, 78% an energy efficiency strategy.

When it comes to establishing a price on carbon, 83% of NDP voters, 64% of PC voters, and even 44% of WRP voters would like to see the Premier work with other provinces in this direction.

Slide4
Slide5

The Upshot?

This probing on energy issues and expectations of the new government reveals still more evidence that the shift that elected the NDP was not about people looking for radical change.

Instead, mainstream voters, across the province, are looking for continued support for oil and gas development, including expanded market access, while at the same time hoping that Alberta can make more progress in terms of energy efficiency, renewable energy and playing a collaborative role with other provinces on the question of carbon pricing.

How Ms. Notley handles these high profile issues will likely have a lot to do with her ability to sustain public goodwill going forward, and needless to say, the economic pressures in the energy sector will figure significantly in the choices available to her.

Methodology

Our survey was conducted online with 1,000 Alberta residents aged 18 and over from May 6 to 11, 2015. A random sample of panelists was invited to complete the survey from a large representative panel of Albertans, recruited and managed by Research Now, one of the world’s leading provider of online research samples.

The Marketing Research and Intelligence Association policy limits statements about margins of sampling error for most online surveys. The margin of error for a comparable probability-based random sample of the same size is +/- 3.1%, 19 times out of 20. The data were weighted according to census data to ensure that the sample matched Alberta’s population according to age, gender, educational attainment, and region of the province. Totals may not add up to 100 due to rounding.

sample

Abacus Data Inc.

We offer global research capacity with a strong focus on customer service, attention to detail and value added insight. Our team combines the experience of our Chairman Bruce Anderson, one of Canada’s leading research executives for two decades, with the energy, creativity and research expertise of CEO David Coletto, PhD.

Alberta’s election was more about change, less about the NDP, say voters.

PdfExport

We’ve just completed a major, in depth survey among 1,000 residents of Alberta.  The second tranche of results is described here, and more of the data will be available in the coming weeks. Our first release, from earlier this week, can be found by clicking here.

WHAT HAPPENED?

We offered respondents a series of choices and asked them to pick which of the options best accounts for what happened in the election that resulted in an historic shift in the political landscape.

Here’s what the results show:

– The vast majority (91%) said the result had nothing to do with preferring a female Premier. Only 9% overall and only 10% among women, said it was about electing a woman.

– Overwhelmingly, those surveyed say the result was more about a desire for change (93%) rather than a preference for the NDP (7%). NDP voters were as likely as everyone else to say it was more about change. Interestingly, those aged 18 to 29 were more likely to say the election was about people liking the NDP, as opposed to people wanting change.

– Two thirds (67%) say the leaders’ debate mattered; only 34% felt it was not that important. To underscore just how critical it was, those who voted NDP voters were 9 points more likely to say the debate mattered.

– More felt the result was about “cooling on Jim Prentice” (63%), than “warming to Rachel Notley” (37%). NDP voters were 14 points more likely to say it was about warming to Rachel Notley, while Wildrose voters were 14 points more likely to say it was about cooling towards Jim Prentice.

– More say this election was about anger (62%) than about “hope” (38%). Wildrose voters were more likely than others to say it was about anger, while NDP voters were more likely to say it was about hope.

– Most say the election had more to do with leadership (58%) than the economy (42%). Given the economic pressures faced by Alberta in recent months, this is well worth noting. Of note, those under 45 years of age were more likely to say the election was about the economy while those over 45 were more likely to think the election was about leadership.

– The provincial budget was a prominent backdrop for the election call, and almost half (44%) said the result was about the budget. More (56%) said the election was about other things.

– The election was almost equally seen as an expression of “mood” (52%) as it was a choice made around “issues and policy” (48%). NDP supporters were far more inclined to see it as a issues based result, while PC and Wildrose voters said it was about mood.

– Finally, Albertans are equally divided on whether the result was about the province becoming united (51%) or being divided (49%). Perhaps, given the nature of the result, what is most remarkable is that so many people saw the result as having a unifying element or at least being about a shared feeling.

Slide1
Slide2
Slide3


There were also interesting opinion differences by age, such as:

– Young people were more likely to say it was a vote about issues, older people more likely to say it was about mood.

– Young people were more likely to say it was about the economy, while older people were more likely to say it was about leadership.

– Older people were more likely to say it was a vote about anger and a reaction to arrogance, while younger people were more likely to say it was about hope and change.

agealberta

The Upshot?

This election is one of the most fascinating ones to have happened in Canada in recent times.  These results indicate it was less about the economy than one might have expected, and while it resulted in the election of a female Premier, gender per se did not appear to play a big role in the outcome.

It was a “change from something” rather than a “change to something” election, and also more about the qualities people were looking for in a leader than specific policy ideas.  Those who voted NDP clearly warmed to Rachel Notley, while many others who left the PC’s for the Wildrose were expressing disappointment in Jim Prentice.

While there was a fair bit of anger, there was also a considerable measure of hope.  Inasmuch as 60% didn’t vote NDP but only 25% are unhappy with the outcome, this challenges any notion that Alberta is today a place where partisanship and ideology are deeply rooted: most seem quite open to trying a different approach.  Clearly, WRP and NDP voters had different priorities, but for most voters, if not for the most partisan of voters, these seem to be differences of degree more than fundamental direction.

Methodology

Our survey was conducted online with 1,000 Alberta residents aged 18 and over from May 6 to 11, 2015. A random sample of panelists was invited to complete the survey from a large representative panel of Albertans, recruited and managed by Research Now, one of the world’s leading provider of online research samples.

The Marketing Research and Intelligence Association policy limits statements about margins of sampling error for most online surveys. The margin of error for a comparable probability-based random sample of the same size is +/- 3.1%, 19 times out of 20. The data were weighted according to census data to ensure that the sample matched Alberta’s population according to age, gender, educational attainment, and region of the province. Totals may not add up to 100 due to rounding.

Sample Composition

sample

Abacus Data

We offer global research capacity with a strong focus on customer service, attention to detail and value added insight. Our team combines the experience of our Chairman Bruce Anderson, one of Canada’s leading research executives for two decades, with the energy, creativity and research expertise of CEO David Coletto, PhD.