Canadian Politics: 5 points separate 3 contenders, new poll finds.
July 8, 2015
NDP by a nose

Our latest horserace “who would you vote for tomorrow” question has the NDP, at 32% followed by the Conservatives at 29 and the Liberals at 27%. Since February, the NDP have picked up 11 points while the Liberals have lost 7 and the Conservatives have shed 6.

In the three biggest seat markets, the NDP is the story to watch. In Ontario, the NDP is neck and neck with the other major parties and have substantial leads in Quebec and BC.

The NDP is currently competitive among segments of the population where they have lagged in the past, including among men, older voters, and homeowners.

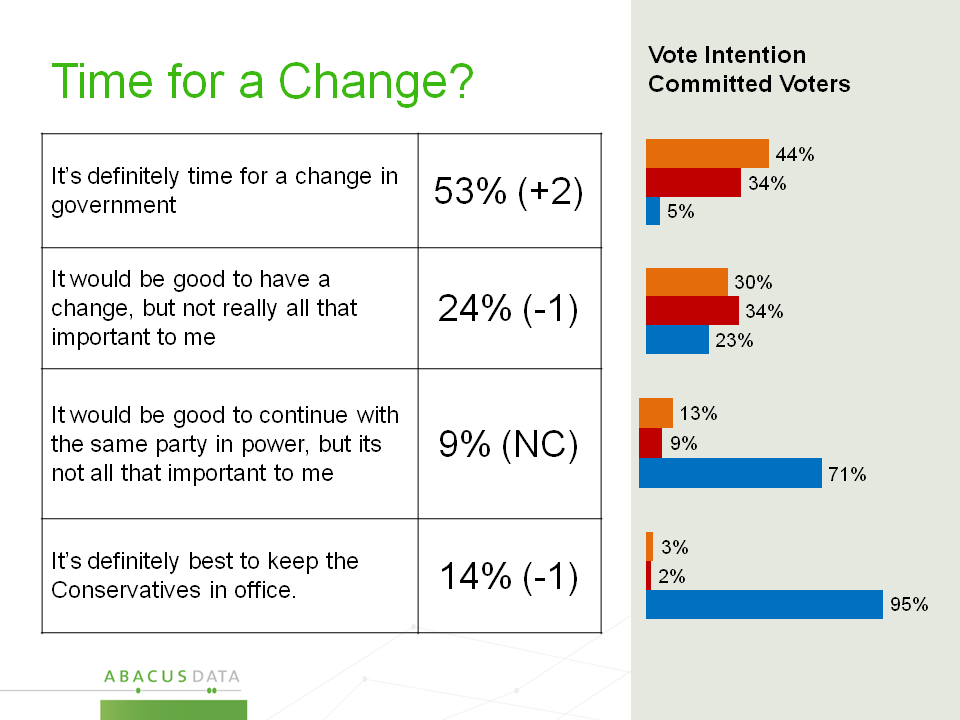
77% Prefer a Change in Government
In this wave, 77% say they would prefer to see a change, although not all of these people feel strongly about the need for change. Among those who most want to see change, 44% would vote NDP and 34% would vote Liberal.
Only 14% are sure they want the Conservatives to win another term, and another 9% feel mildly this way. To win, therefore, the Conservatives need to win a bigger share of the 24% who mildly prefer change.
Who could beat the Conservatives? A split decision
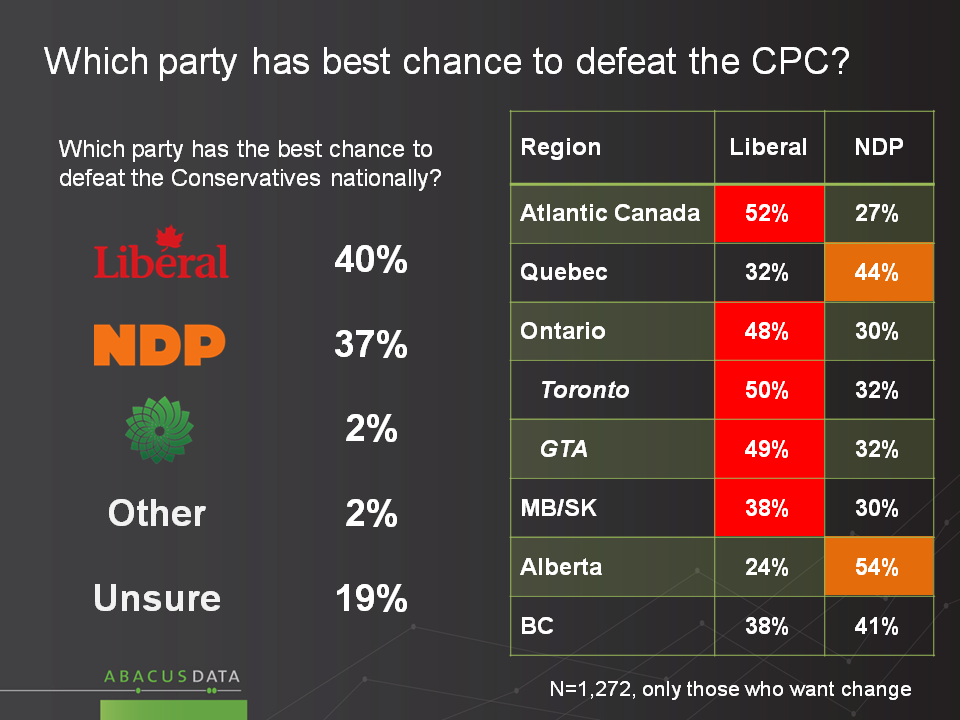
Among those who want change, four in ten believe that the Liberals have “the best chance to defeat the Conservatives nationally”, while the NDP is a close second with 37%. Belief in Liberal chances is highest in Atlantic Canada (52%) and Ontario (48%), while Quebec (44%) respondents believe the NDP has a better chance to defeat the Tories. BC is split for Liberals (38%) and NDP (41%).
Only 28% know how they will vote.
Just 28% say “I know how I will vote and that won’t change” up 3 points since our last survey, another 38% have “a fairly good idea, but that could change”, up 4 points. The Conservatives have the support of 34% of those who’ve made a have a firm decision, and 23% of the “fairly good idea” group.
Together, among committed voters, this would provide the incumbents with 31% in total among these two segments, compared to 32% for the NDP and 27% for the Liberals.

NDP & Liberal pools grow, CPC pool steady but smaller
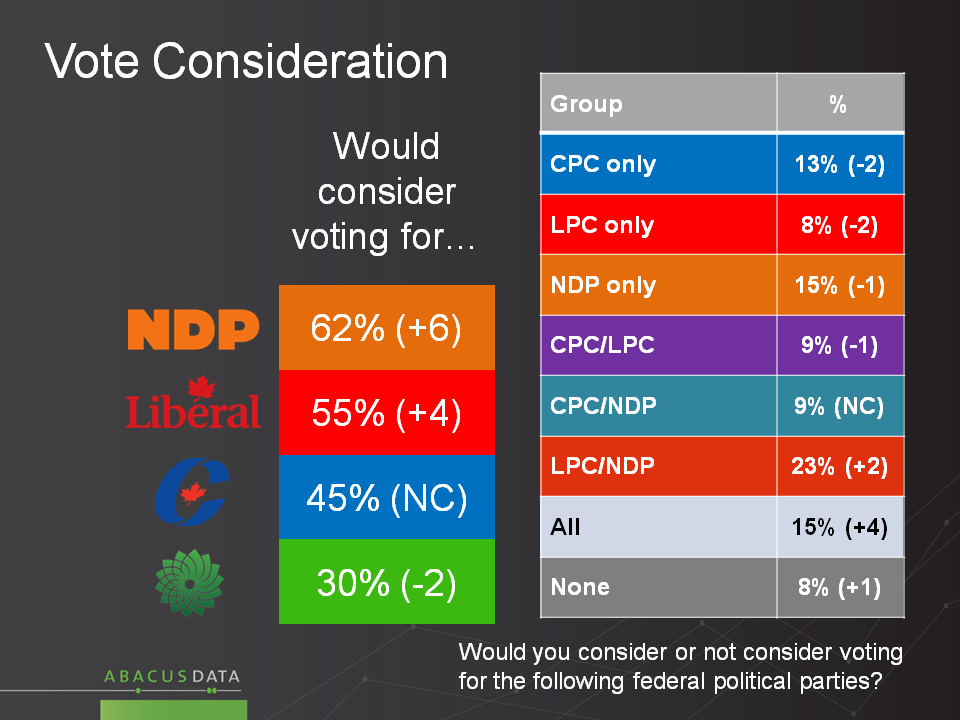
In the last month, we see continued growth (+6) in those who would consider voting NDP, giving the party the largest potential voter pool at 62%, followed by the Liberals at 55% who are also up from last month (+4) and the Conservatives at 45%.
What outcome do Canadians predict?
The NDP’s rise in support is mirrored in expectations about who will win the next election. Today 26% think the Conservatives will win, 24% say the Liberals will win and 22% say the NDP (up 15 points over the last quarter).

The Upshot?
The political competition we are seeing today is unprecedented. Five points separate the three main parties and the NDP is in the lead; last September the gap was 15 points, and the NDP was third.
While recent trends have been challenging for the Liberals, these numbers are just as sobering for Conservatives. A lot of voters are inclined to want change, and there is little evident fear of the prospect of the NDP forming a government.
To win a fourth straight election, the Conservatives will have to present their own, compelling version of what they would do next, or make change seem more risky, or both. But relying on historic hesitation about the NDP, or the ability to diminish leadership opponents, has shows little promise as a re-election strategy, and simply may not work in 2015.
Given these competitive dynamics, it is clear that all the parties will be revising their approaches, constantly, over the next 100 days. Predictions of the overall outcome, let alone seat projections, are in these circumstances little more than amusing guesswork.
Methodology
Our survey was conducted online with 2,000 Canadians aged 18 and over from July 3 to 6, 2015. A random sample of panelists was invited to complete the survey from a large representative panel of Canadians, recruited and managed by Research Now, one of the world’s leading provider of online research samples.
The Marketing Research and Intelligence Association policy limits statements about margins of sampling error for most online surveys. The margin of error for a comparable probability-based random sample of the same size is +/- 2.2%, 19 times out of 20. The data were weighted according to census data to ensure that the sample matched Canada’s population according to age, gender, educational attainment, and region. Totals may not add up to 100 due to rounding.
Abacus Data Inc.
We offer global research capacity with a strong focus on customer service, attention to detail and value added insight. Our team combines the experience of our Chairman Bruce Anderson, one of Canada’s leading research executives for two decades, with the energy, creativity and research expertise of CEO David Coletto, PhD. For more information, visit our website at http://www.abacusdata.ca/


