Canadian Support for Ukraine Assistance Growing in Light of Russian Invasion

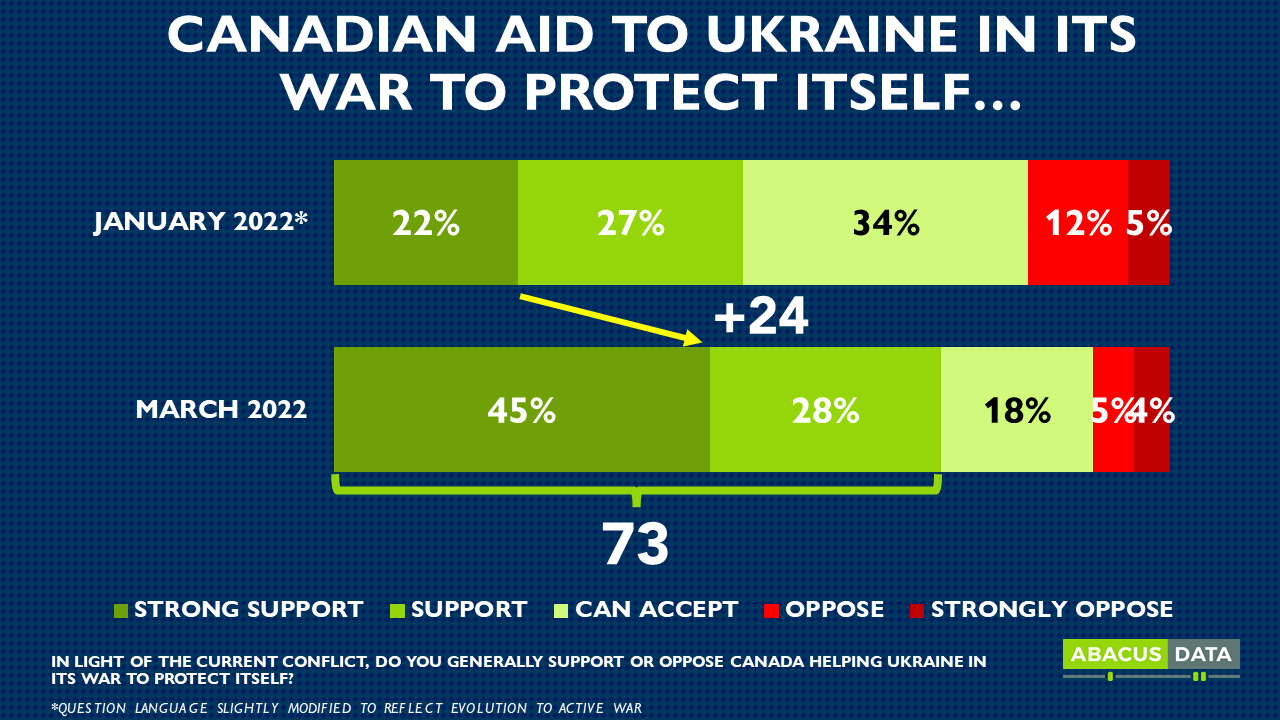
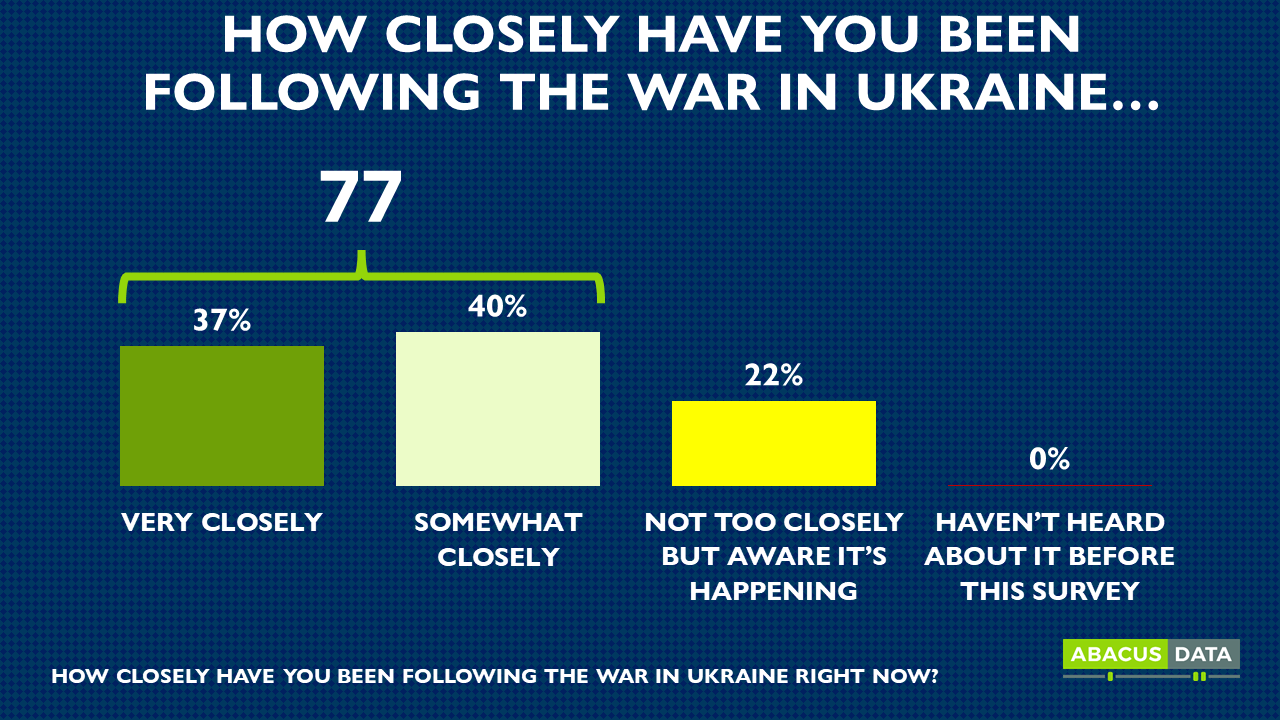
Canadians have been closely following Russia’s invasion of Ukraine, with 7 in 10 outright in support of Canadian assistance to Ukraine’s defense efforts today and only 1 in 10 opposed. This represents a significant shift from support recorded in January of this year.

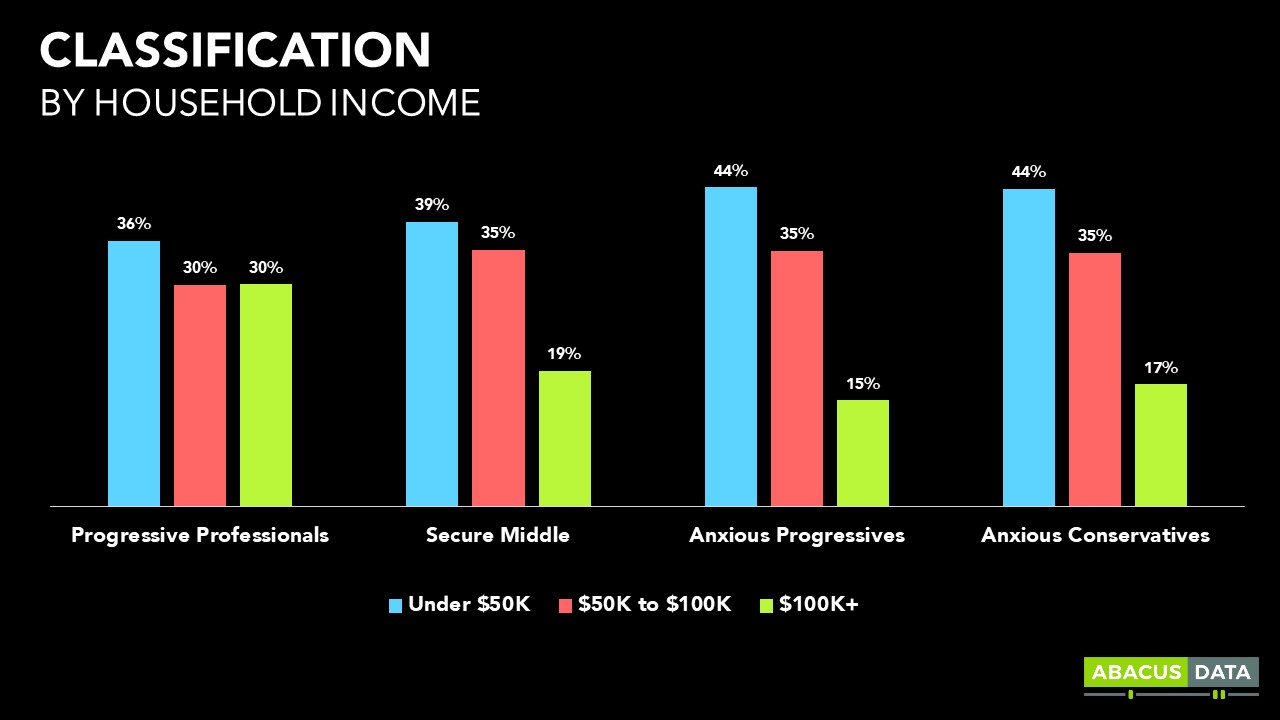
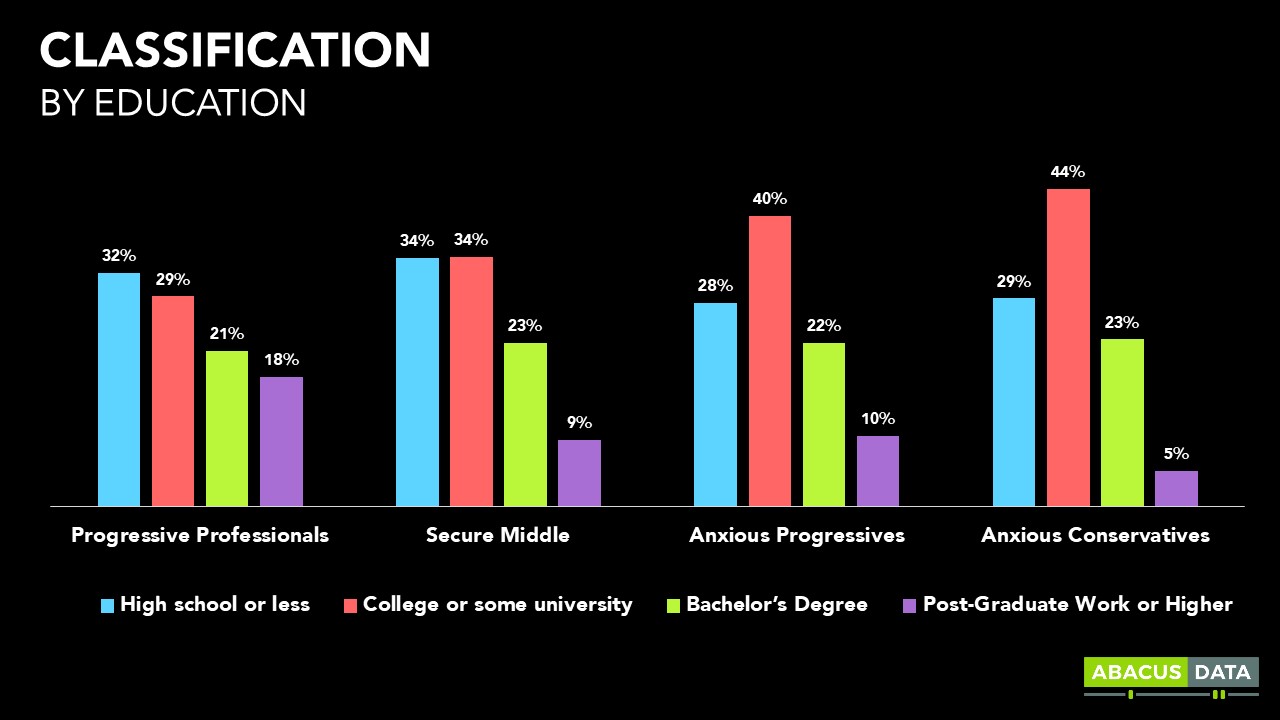
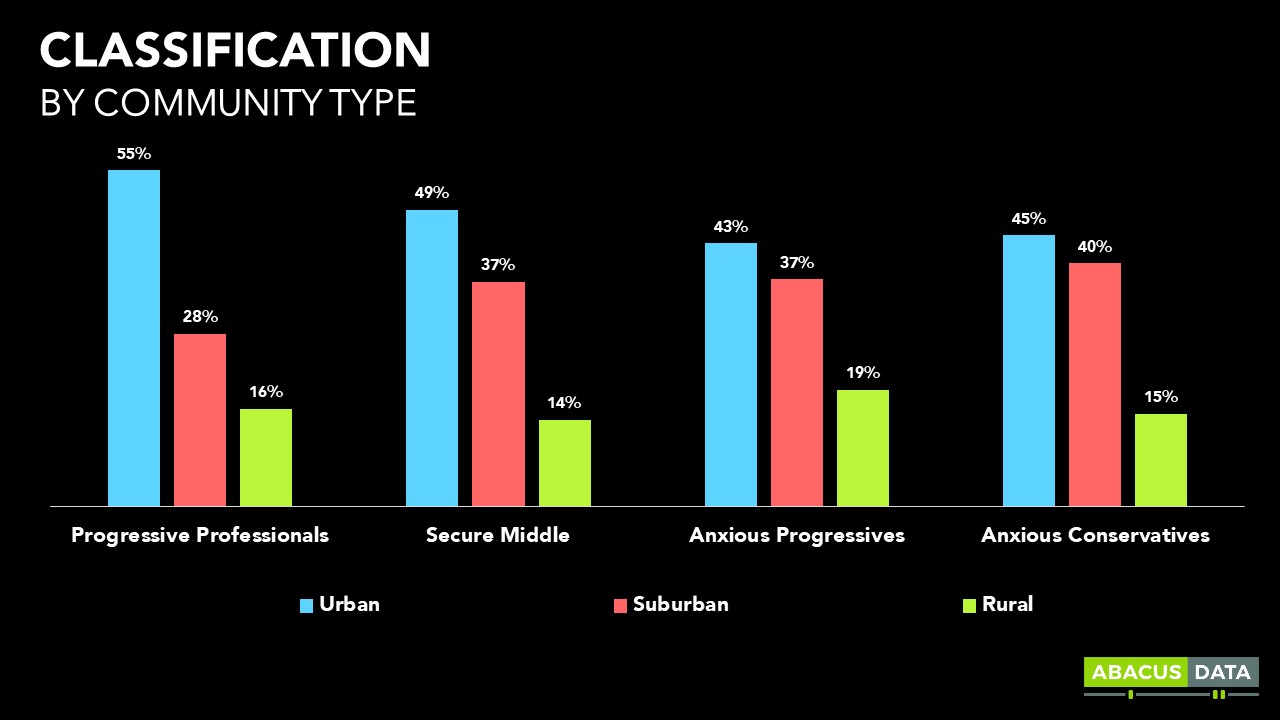
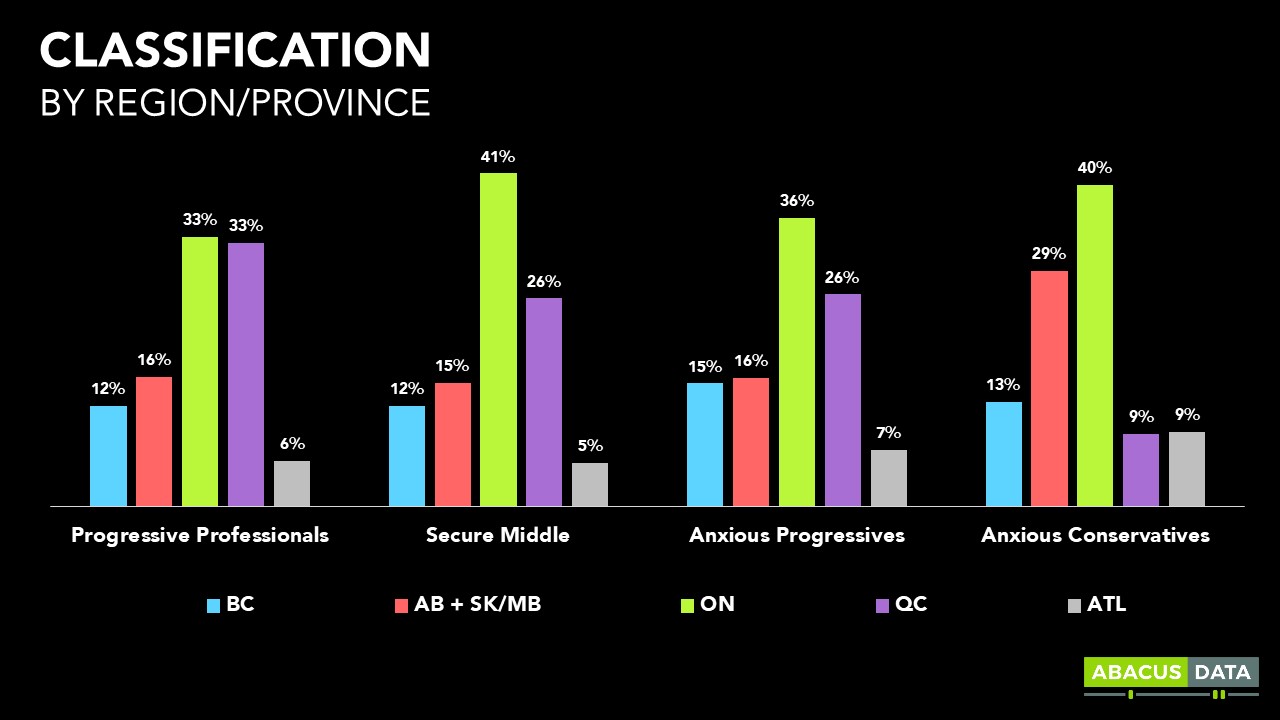
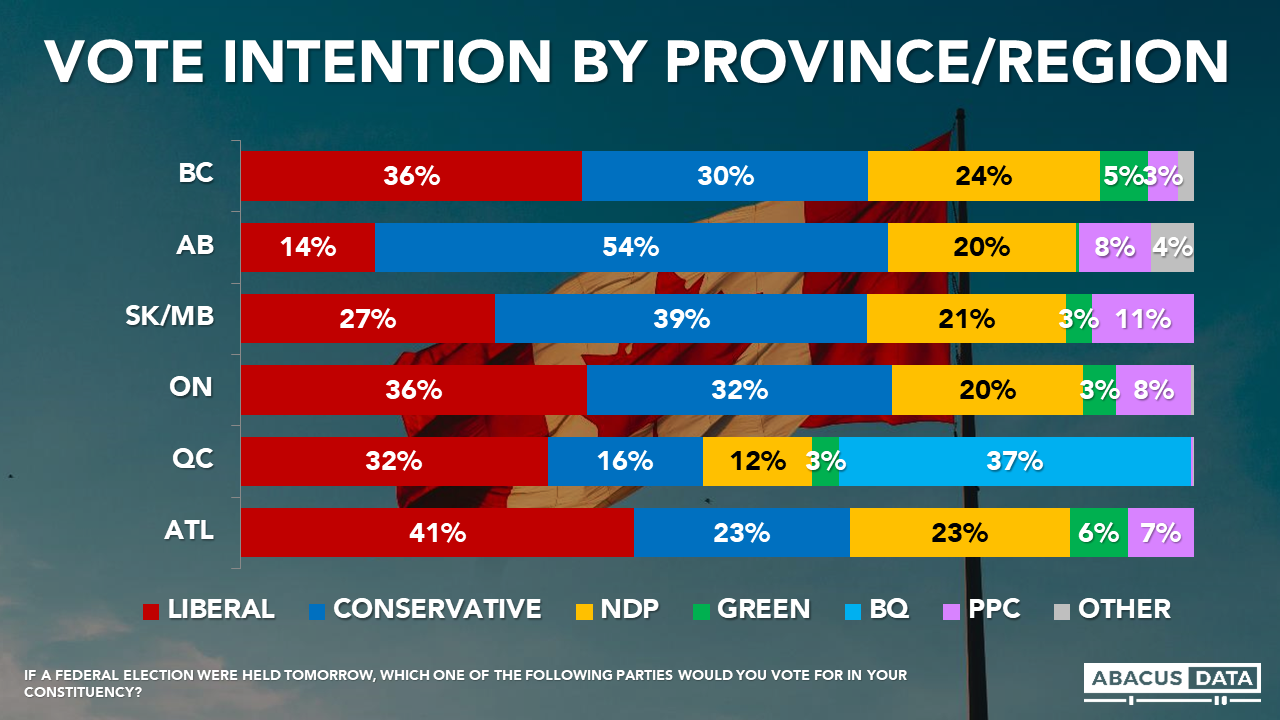
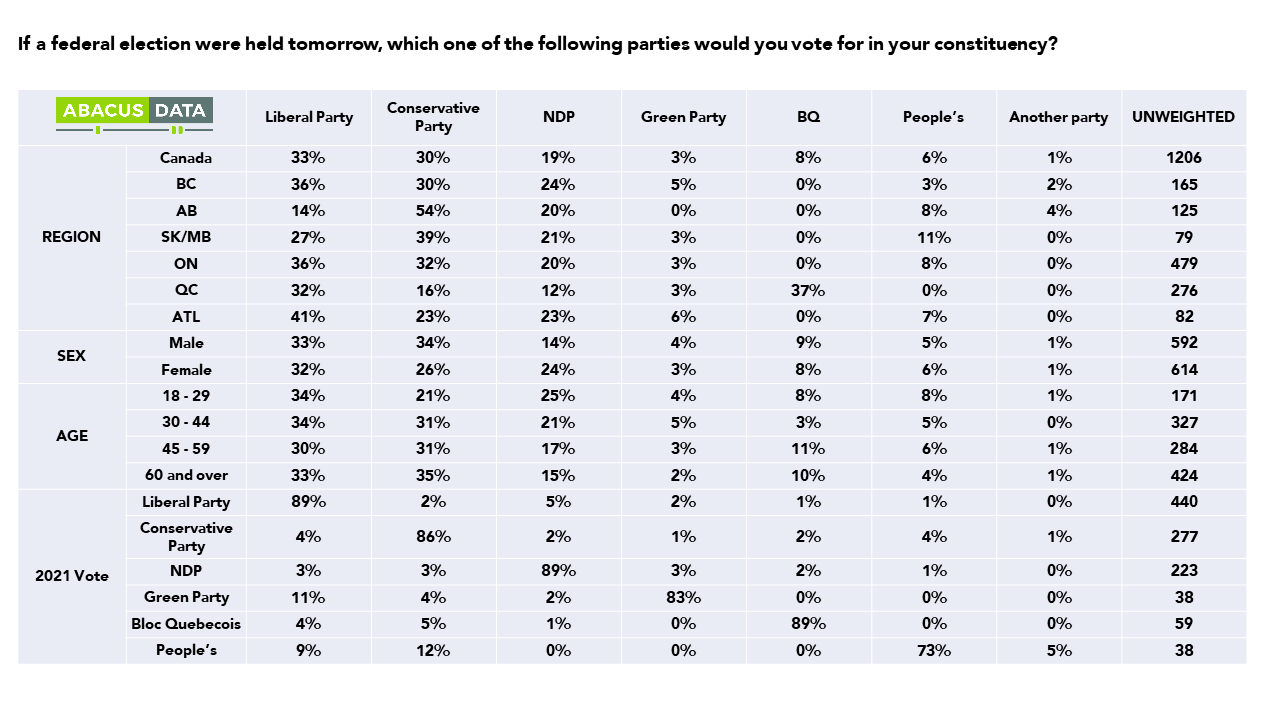
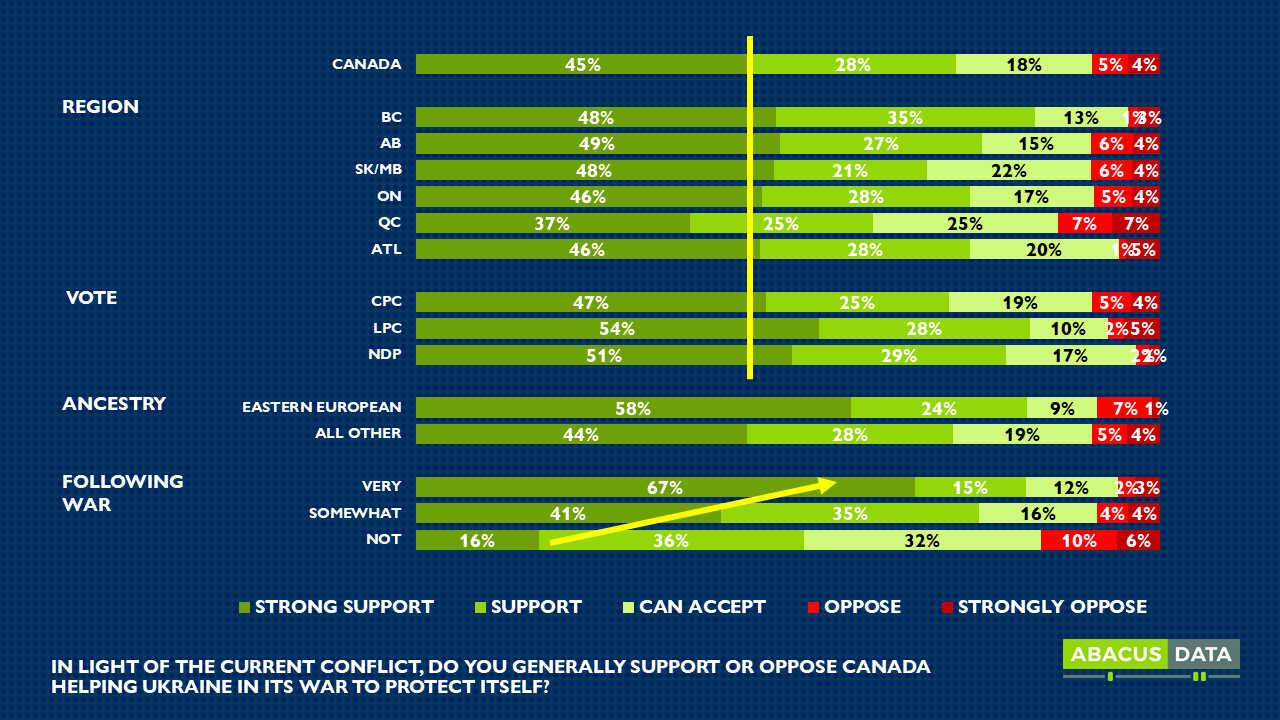
We also find a fairly clear consensus on Ukraine assistance. It is cross partisan and spans geography

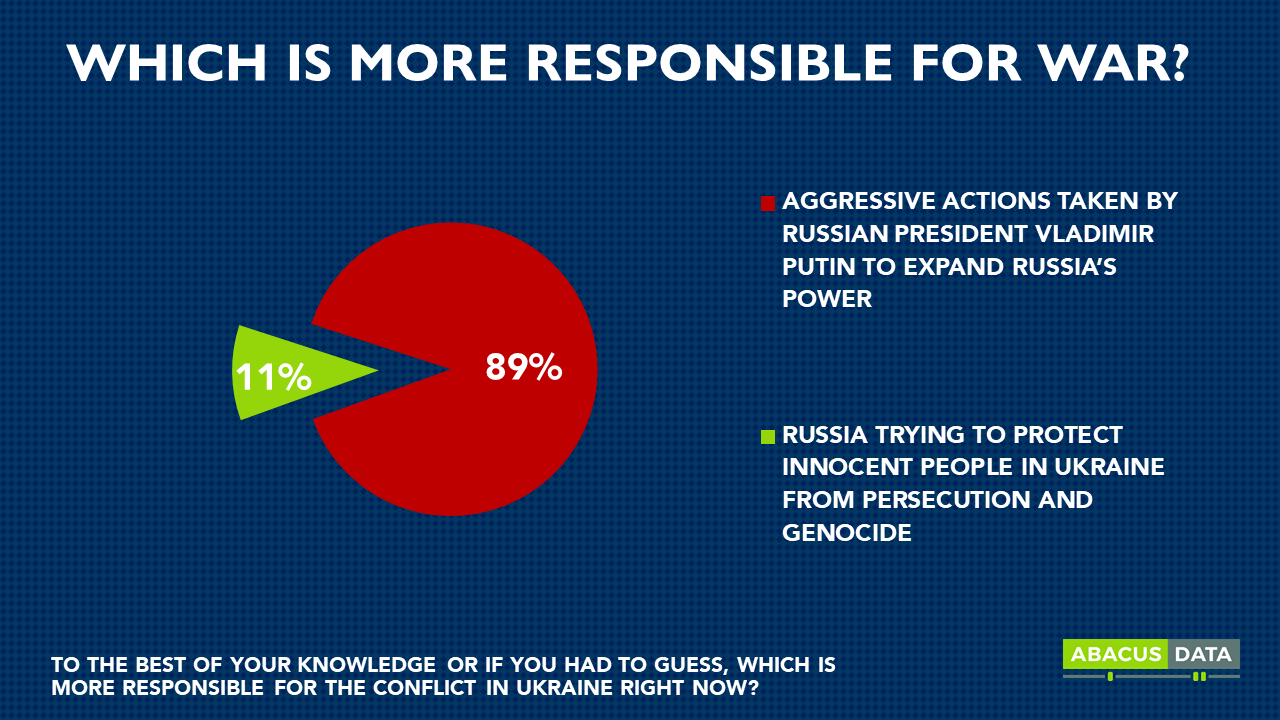
RUSSIAN INSTIGATION WELL UNDERSTOOD

Most Canadians’ understanding of the war is that Russian President Vladimir Putin invaded to expand Russia’s power. Few believe Russia’s stated goal of trying to protect innocent people in Ukraine from persecution or genocide is the cause of the invasion.

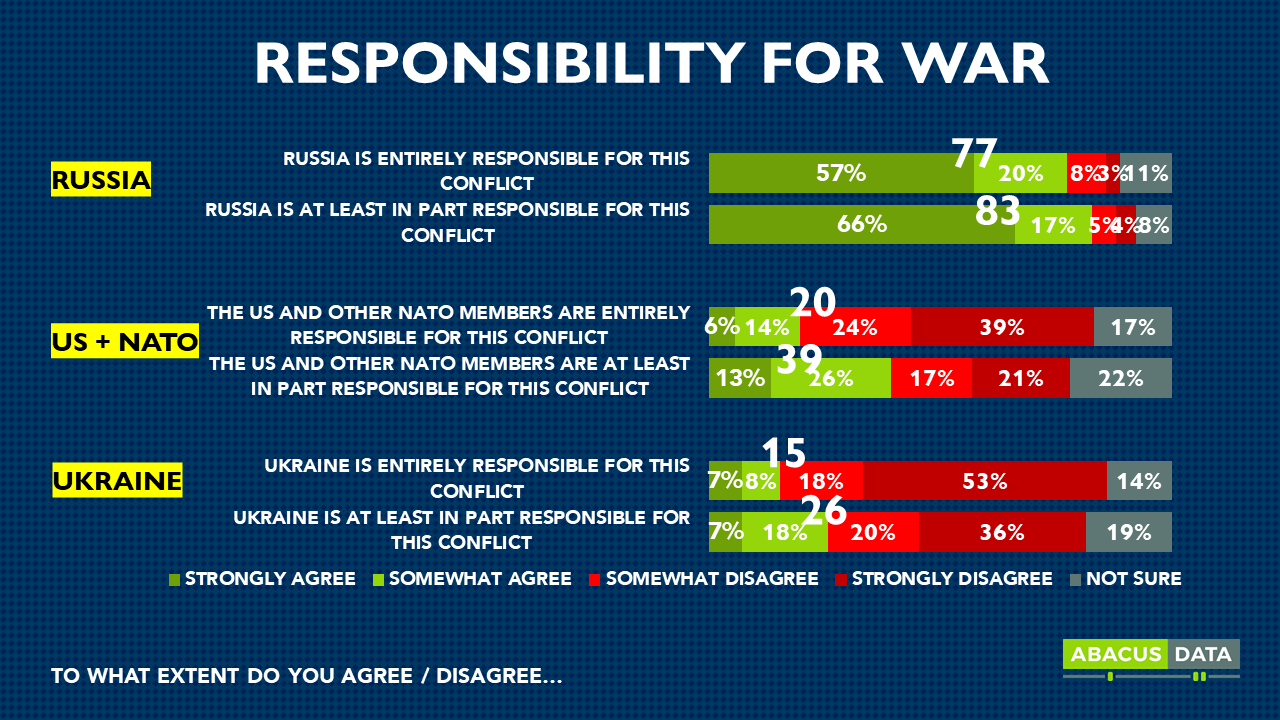
Canadians are aligned on Russia’s responsibility for the conflict, with only some marginal, soft agreement that the US or Ukraine hold some responsibility for the war.

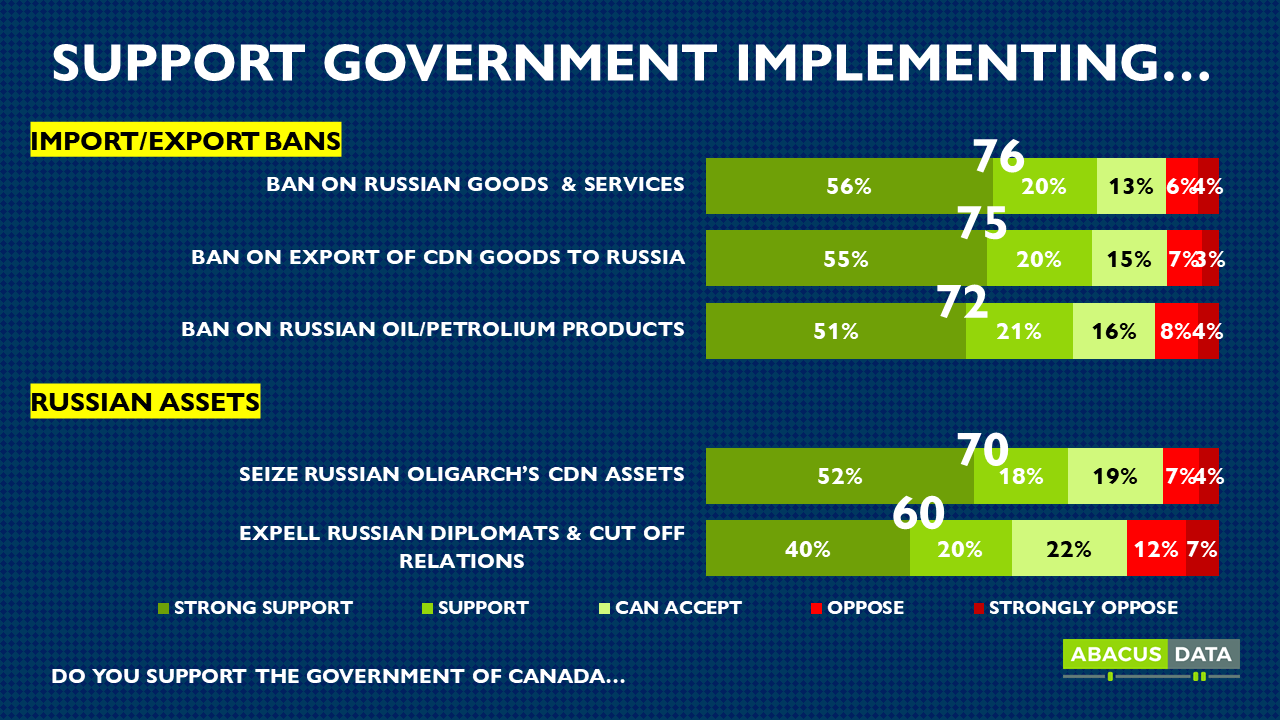
STRONG SUPPORT FOR ECONOMIC SANCTIONS, ASSET SEIZURE & LARGE-SCALE AID EFFORTS

In looking to understand public support dynamics, we tested several simple policy ideas, some of which have been pursued in one form or another since we began fielding our survey.

We find widespread public appetite for the Canadian government enforcing economic measures like banning the import and use of Russian goods and services, or the banning of Canadian exports to Russia.

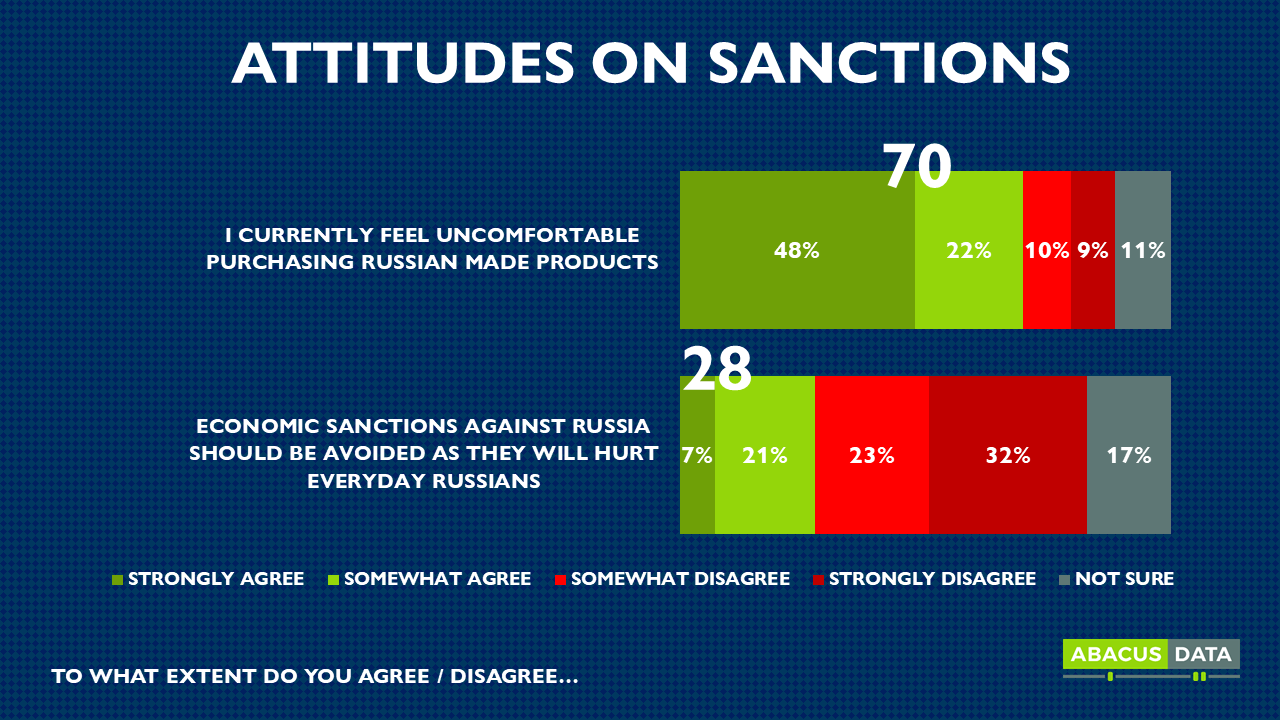
Most Canadians specifically support a Canadian import ban on the use of Russian oil and associated petroleum products. Few see a downside to trade-specific sanctions. Most Canadians also feel uncomfortable purchasing Russian products today, and few agree that sanctions should be avoided due to their detrimental impact on everyday Russians.

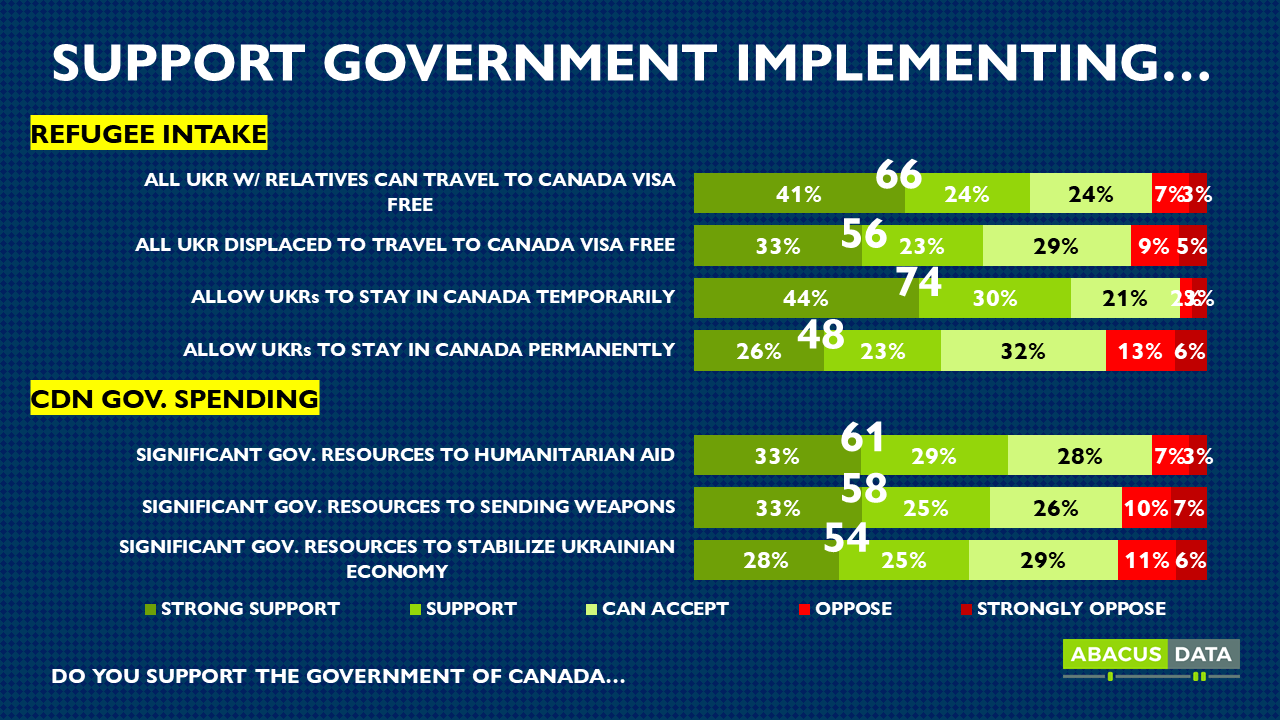
There is likewise clear popular support for seizing the assets of Russian oligarchs in Canada, and intaking displaced Ukrainian refugees into Canada on at least a temporary basis. Beyond those consensus points, a clear majority of Canadians either accept or outright support:

  • Spending significant government resources on humanitarian, economic, and military equipment aid to Ukraine.
  • Expelling Russian diplomats from Canada and cutting off diplomatic relations.
  • Allowing all Ukrainians displaced by the war to stay in Canada permanently.

CANADIANS SEE DEVASTATING IMPACT ON CIVILIANS; THINK WORST IS YET TO COME

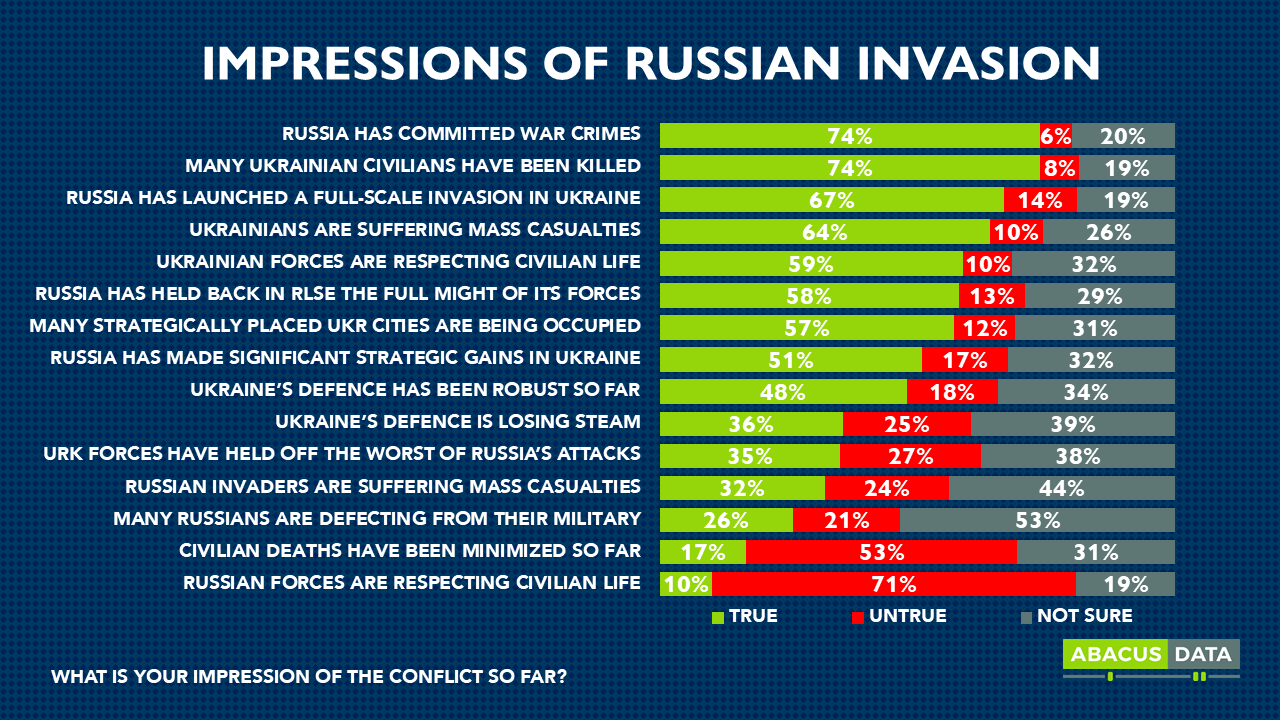
In asking the public to assess whether or not a series of statements about the war are true or false, we find that Canadians understand that this is not merely a war between armed groups relegated to disputed border areas, but that Russian forces are actively engaging in a full-scale invasion, committing war crimes and causing mass civilian casualties.

And despite these tragic outcomes, most believe that Russia is yet holding back releasing the full might of its forces.

There is less consensus on how strong or effective Ukraine’s defense has been and how long it will hold, with most assuming Russia has made important strategic gains in Ukraine.

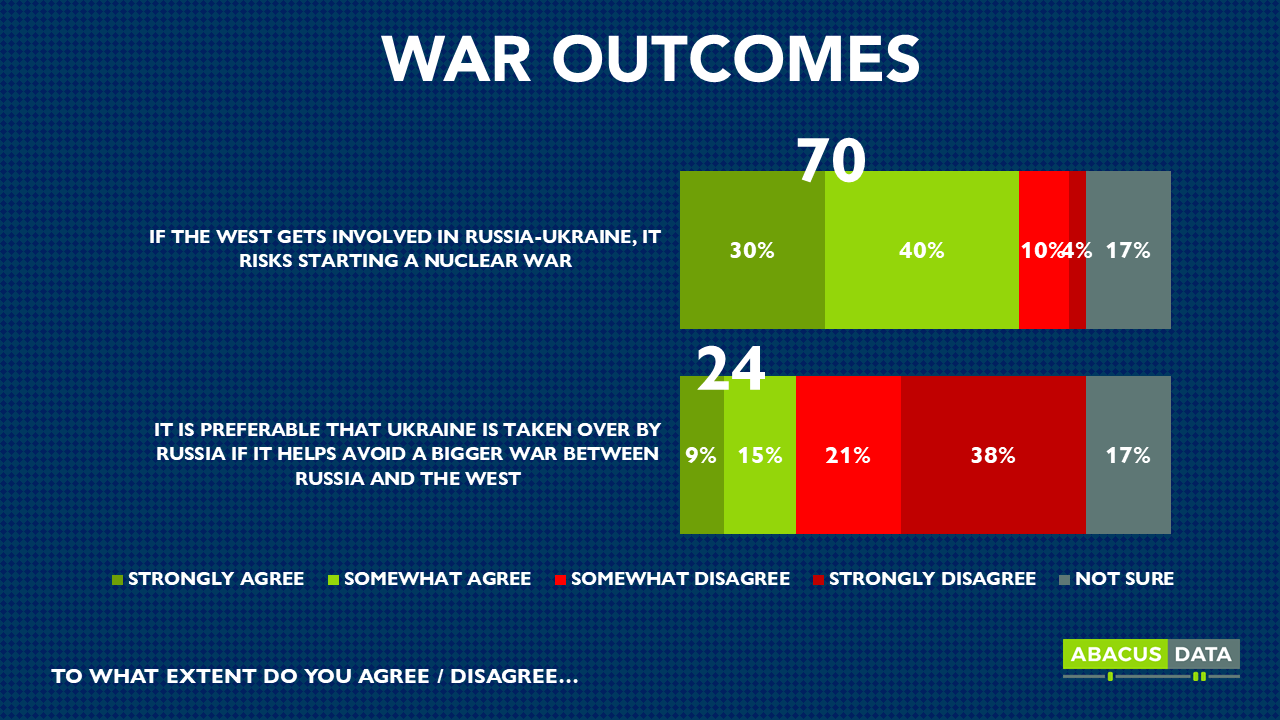
Few Canadians are comfortable with Ukraine folding for the sake of wider peace, with only 1 in 4 agreeing that Russia effectively conquering Ukraine is preferable if it avoids a bigger war between Russia and the west. At the same time, Canadians appreciate that western involvement in the Russian war on Ukraine risks starting a nuclear conflict.

PUBLIC PREFERENCE FOR A NO-FLY ZONE; MANY SEE SCENARIO FOR CDN BOOTS ON GROUND

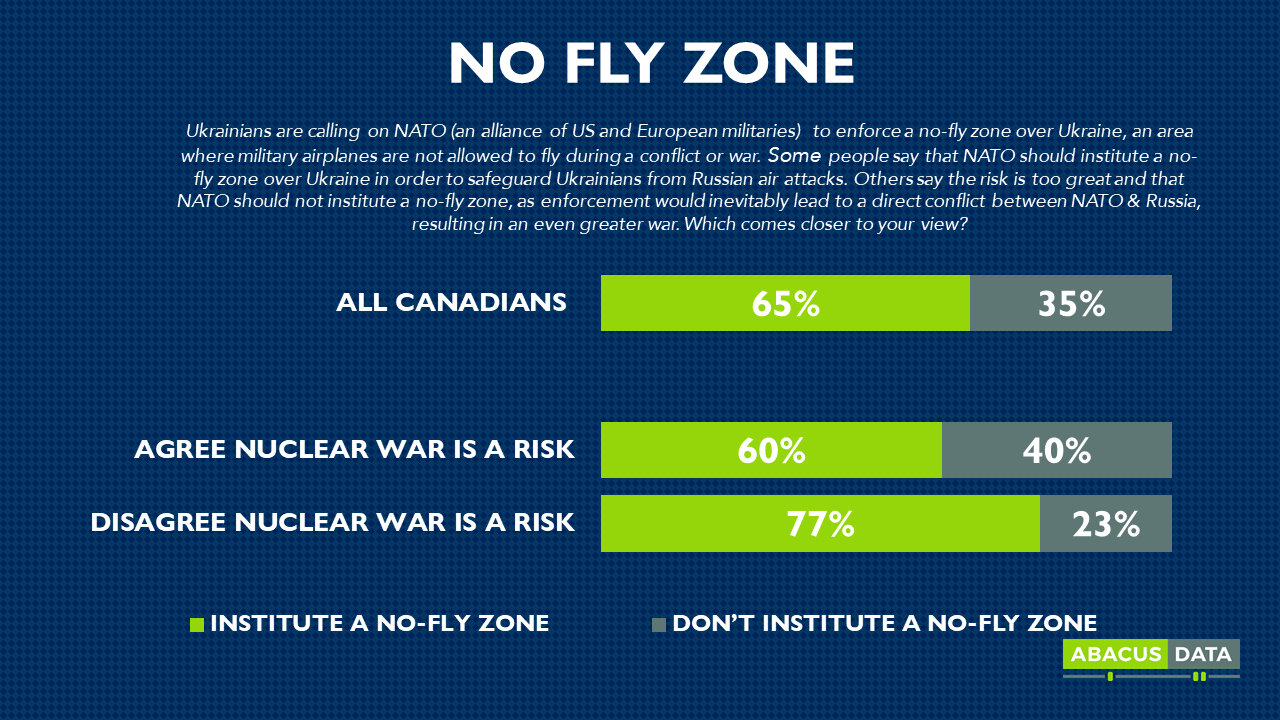
Despite this, most Canadians would opt for enforcing a no-fly zone. Mindful to stress the consequences of NATO enforcement, we framed a no-fly zone tradeoff as:

“Some people say that NATO should institute a no-fly zone over Ukraine in order to safeguard Ukrainians from Russian air attacks.

Others say the risk is too great and that NATO should not institute a no-fly zone, as enforcement would inevitably lead to a direct conflict between NATO & Russia, resulting in an even greater war.

Which is closer to your view?”

2 in 3 Canadians support NATO enforcing a no-fly zone over Ukraine even at the risk of provoking a greater conflict between NATO and Russia. Even Canadians who believe nuclear war is a risk in this conflict support the no-fly zone, suggesting the trade-offs of a no-fly zone are well appreciated by the Canadian public.

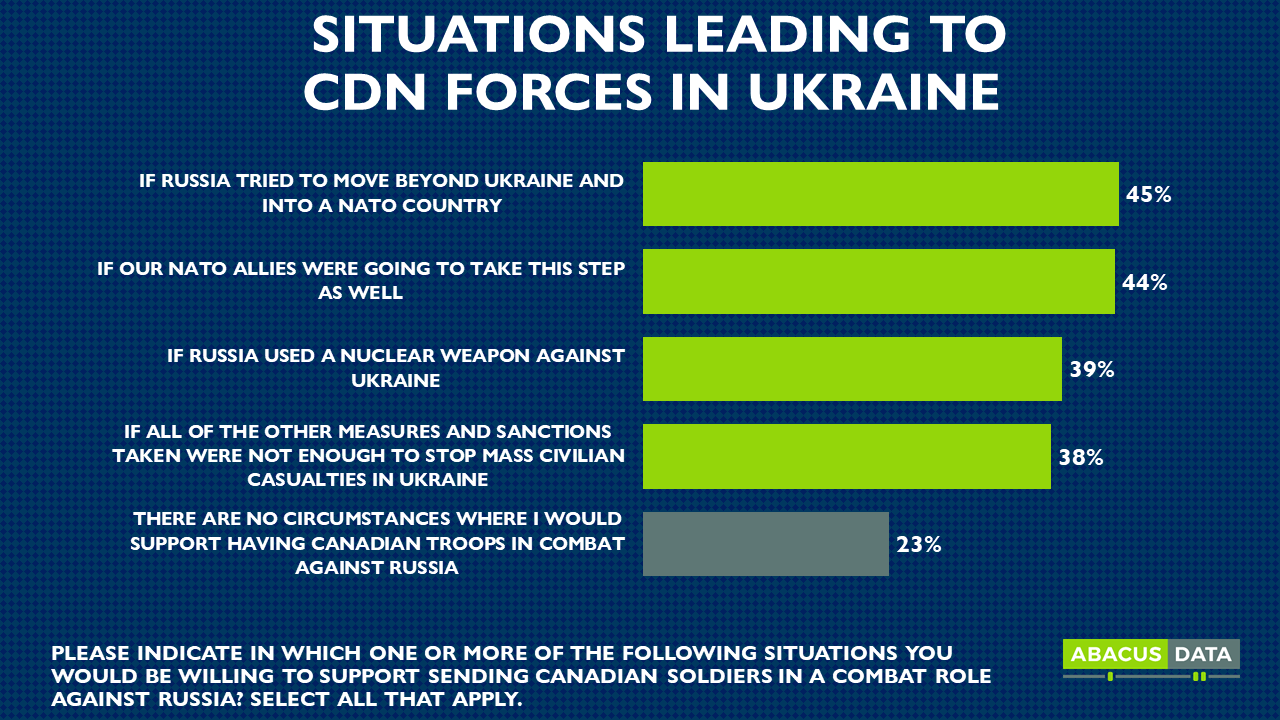
When might Canadians find sending Canadian soldiers into Ukraine in a combat role against Russia appropriate?

7 in 10 would be willing to support sending in the Canadian Forces in some circumstances, particularly if Russia moved beyond Ukraine and into a NATO country, or if our NATO allies were already planning to move in their own troops. Many would also support this direct intervention should nuclear weapons be used in Ukraine, or once all other measures taken prove to be insufficient in deterring Russia.

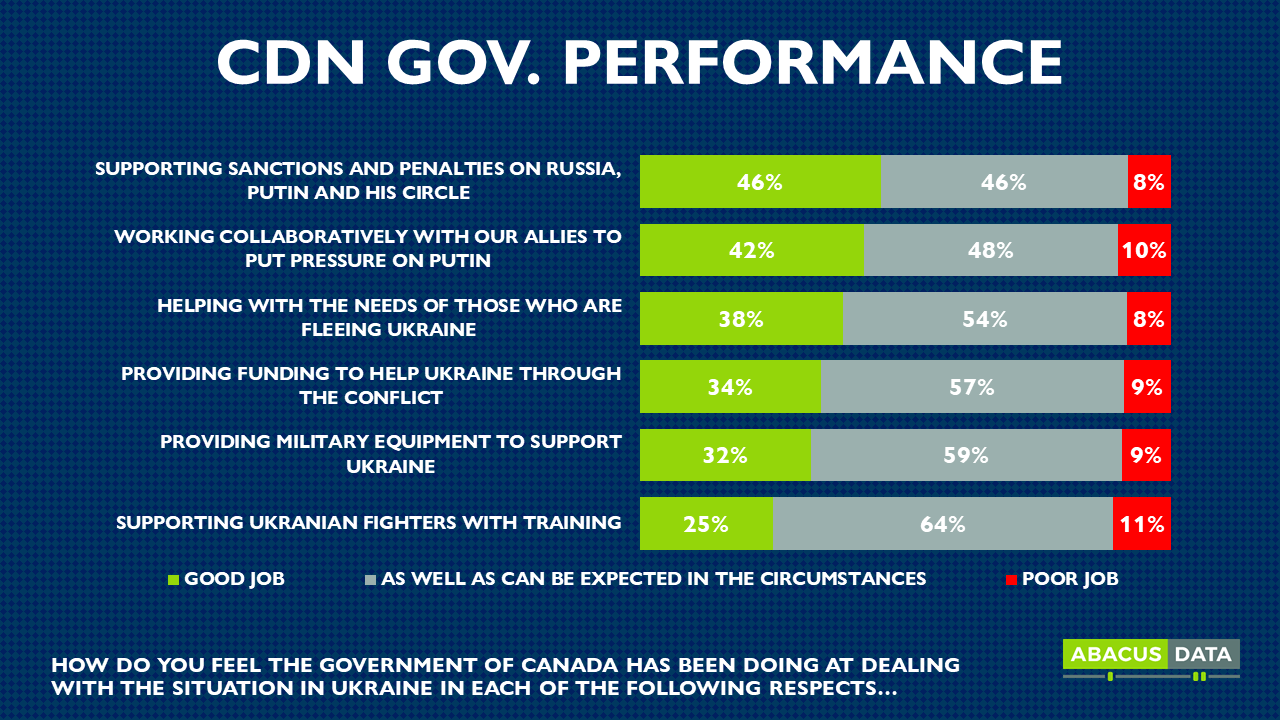
Despite a strong desire to do more, the vast majority of Canadians feel the Government of Canada has at least been doing as well as can be expected on measures to pressure Russia to stop its aggression. Canadians particularly assign high marks to their government’s work on sanctions, collaboration with allies, and humanitarian assistance.  Few think the federal government has done a poor job on any item we asked about.

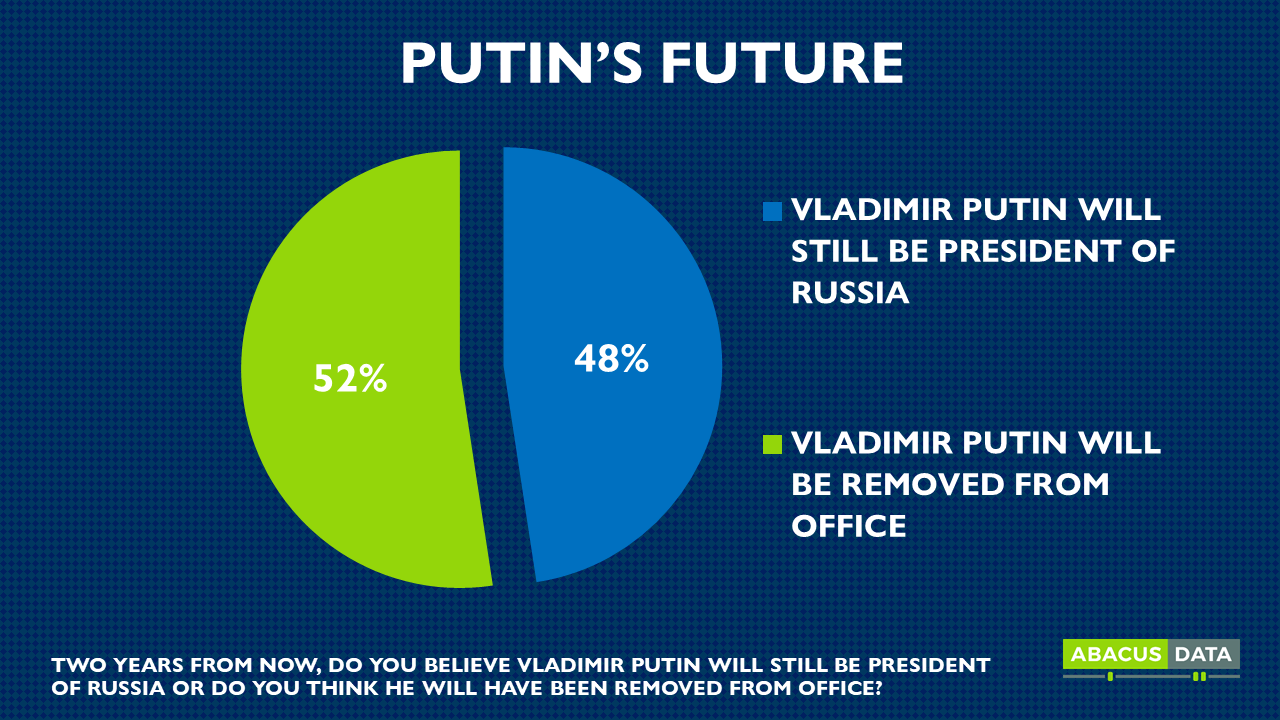
MOST STILL OPTIMISTIC ABOUT OUTCOME

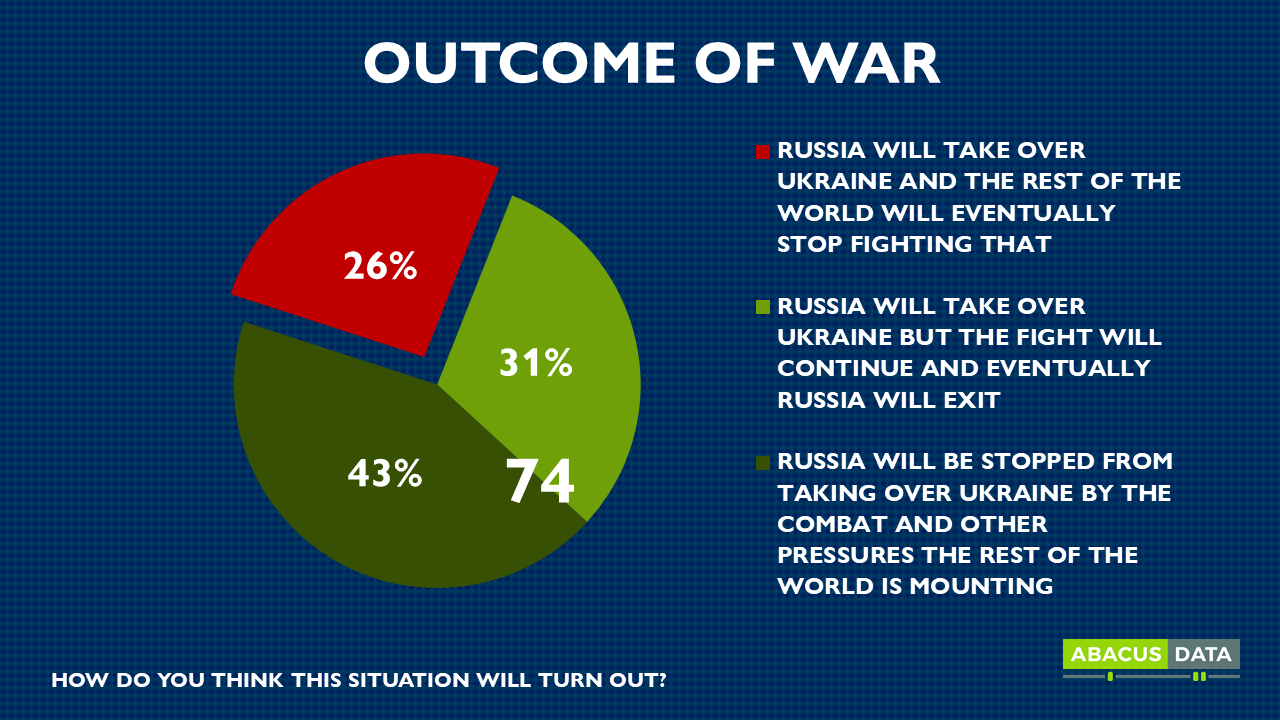
At this time, the Canadian public remains optimistic about the outcome of the war. They believe that either Russia will take Ukraine in the short term but will inevitably exit in the long term, or that Russia will be stopped from its conquest by the international response. There is less consensus on what happens to Vladimir Putin.  Half believe 2 years from now, Putin will continue to be President of Russia, while half believe Putin will be removed from office.

THE UPSHOT

The Government of Canada has clear, national and cross-partisan public support to pursue an aggressive pro-Ukraine foreign policy in the context of Russia’s invasion. Support was substantial before the Russian invasion and has only grown since.

Some response measures that seemed unthinkable two weeks ago now feel inevitable, as the conflict continues to rage with few signs of subsiding. Undaunted by the hypothetical risk of greater escalation or nuclear war, the vast majority of Canadians just want to help. They support NATO enforcing a no-fly zone, greater military and humanitarian aid, and have a deep and widespread willingness to welcome displaced Ukrainians to Canada. Most can even see scenarios in which they would support Canadian military on the ground in Ukraine.

This change in tune is a clear response to the atrocities we’ve seen Russia committing against civilians and the unjust nature of the Russian invasion. Canadians understand this war is the result of a cynical and malicious power grab and want both Canada and its allies to respond accordingly.

METHODOLOGY

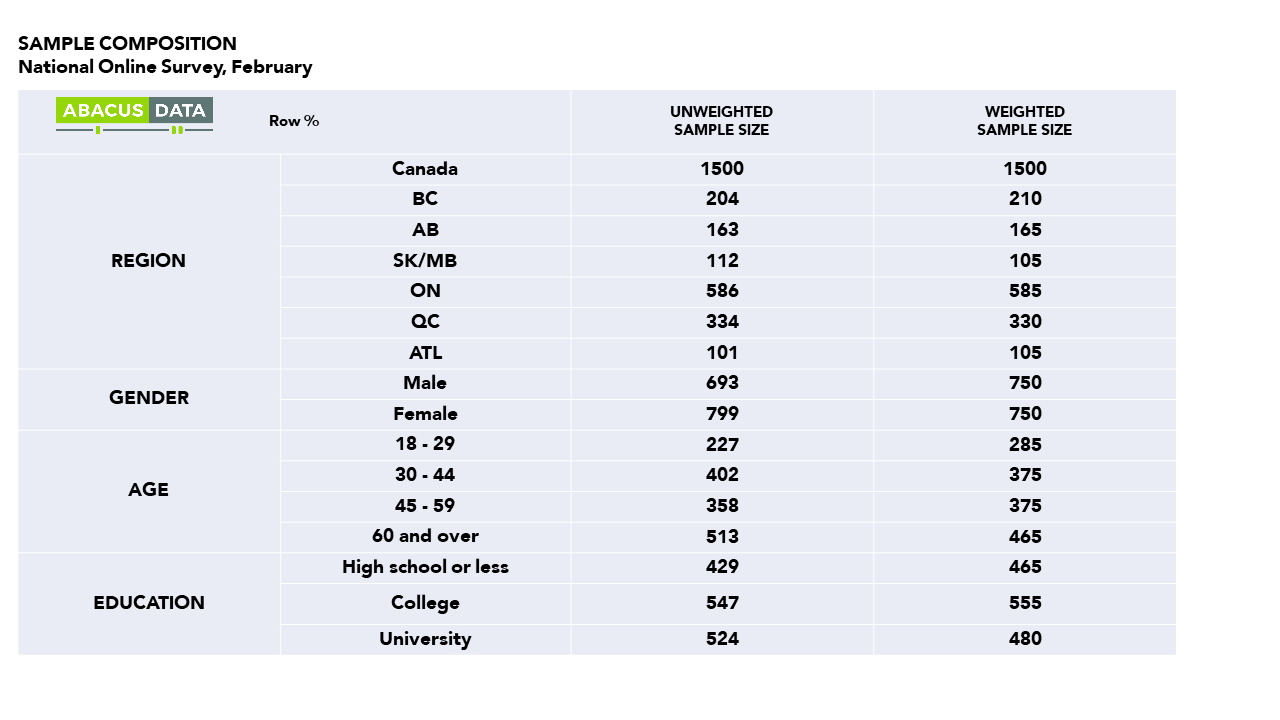
This survey was conducted with 1,464 Canadian adults from March 4 to 8, 2022. A random sample of panelists were invited to complete the survey from a set of partner panels based on the Lucid exchange platform. These partners are typically double opt-in survey panels, blended to manage out potential skews in the data from a single source.

The margin of error for a comparable probability-based random sample of the same size is +/- 2.6%, 19 times out of 20.

The data were weighted according to census data to ensure that the sample matched Canada’s population. Totals may not add up to 100 due to rounding.

ABOUT ABACUS DATA

We are the only research and strategy firm that helps organizations respond to the disruptive risks and opportunities in a world where demographics and technology are changing more quickly than ever.

We are an innovative, fast-growing public opinion and marketing research consultancy. We use the latest technology, sound science, and deep experience to generate top-flight research-based advice to our clients. We offer global research capacity with a strong focus on customer service, attention to detail and exceptional value.

We were one of the most accurate pollsters conducting research during the 2021 Canadian election following up on our outstanding record in 2019.

Contact us with any questions.

Find out more about how we can help your organization by downloading our corporate profile and service offering.

Conservative Leadership Campaign: Initial impressions of declared/potential candidates

We were in the field at the end of February (Feb 23-Mar 1) and asked Canadians their impression of four declared/possible Conservative Party leadership candidates.

Jean Charest would start the race with higher name recognition than Poilievre and about similar favourables nationally (gen pop). Patrick Brown is much less known, especially outside Ontario.

Among those who would vote Conservative today, Poilievre is viewed far more favourably than Charest. Poilievre has a +22 favourable score compared with -3 for Charest.

Charest’s Quebec numbers are much different than the rest of the country. Most know him but almost half have a negative impression.

Poilievre’s numbers are fairly consistent across the country although only 8% positive in Quebec. But his strength is his connection and positive impression with current and potential CPC voters.

Patrick Brown is much more well known in Ontario (not surprising) but his net score is 0 there. He has net positives with both potential and current CPC supporters.

Obviously, this is a snapshot from a week ago and after Charest’s launch on Thursday, these numbers could move.

But he faces two big challenges in my view:

1. Poilievre is more known and liked among the CPC voter base (which is not the same thing as the membership).

2. His high negatives in Quebec could be a challenge if he’s going to rely on the province to sign up members and challenge Poilievre.

UPSHOT

Given Poilievre’s popularity with CPC voters, I suspect his numbers are even stronger among CPC members giving him a big head start. Charest has a lot of work to do to win this.

METHODOLOGY

The survey was conducted with 2,000 Canadian adults from February 23 to March 1, 2022. A random sample of panelists were invited to complete the survey from a set of partner panels based on the Lucid exchange platform. These partners are typically double opt-in survey panels, blended to manage out potential skews in the data from a single source.

The margin of error for a comparable probability-based random sample of the same size is +/- 2.2%, 19 times out of 20.

The data were weighted according to census data to ensure that the sample matched Canada’s population according to age, gender, educational attainment, and region. Totals may not add up to 100 due to rounding.

Abacus Data follows the CRIC Public Opinion Research Standards and Disclosure Requirements that can be found here:  https://canadianresearchinsightscouncil.ca/standards/

This survey was paid for by Abacus Data Inc.

ABOUT ABACUS DATA

We are the only research and strategy firm that helps organizations respond to the disruptive risks and opportunities in a world where demographics and technology are changing more quickly than ever.

We are an innovative, fast-growing public opinion and marketing research consultancy. We use the latest technology, sound science, and deep experience to generate top-flight research-based advice to our clients. We offer global research capacity with a strong focus on customer service, attention to detail and exceptional value.

We were one of the most accurate pollsters conducting research during the 2021 Canadian election following up on our outstanding record in 2019.

Contact us with any questions.

Find out more about how we can help your organization by downloading our corporate profile and service offering.

Almost 80% Of Canadians Open to Owning an Electric Vehicle

In the latest round of survey work by Clean Energy Canada and Abacus Data, only 21% of Canadian adults think they “probably never will” own an electric vehicle.  At the other end of the spectrum, 19% (the equivalent of more than 5 million people) say they love the idea of owning one, and another 31% are interested in considering one.

Most Canadians (63%) would prefer to see electric cars become the majority of cars consumers drive. Fully 80% think it is likely that electric vehicles will reach that level of acceptance. Half of those surveyed think this will happen within the next 15 years.

Personal interest in purchasing an electric vehicle remains robust with 58% indicating that they are certain, inclined or likely to make their next car electric.  Majorities think electric vehicles are better for the environment and offer lower fueling costs, while combustion engines are cheaper to own or lease and more convenient for refueling. Opinion is divided on maintenance costs.

About 1 in 10 people say they have a car that runs on electricity today and of those half are elated with the experience and a total of 93% are happy with the choice.

Seventy two percent (72%) think Canada should take steps to attract manufacturers of electric vehicles here, which is up five points since November 2020. And three out of four people support the use of government subsidies to help encourage consumers to buy electric vehicles.

UPSHOT

According to Bruce Anderson, Chairman of Abacus Data: “Canadians want electric cars, they want the country to manufacture electric cars and they want to see government policy support both the affordability of those cars and help attract investment into electric vehicle manufacturing.  As more people are exposed to a wider range and ideally more affordable options, all signs are that this trend is going to gather momentum in the years to come.”

According to Joanna Kyriazis, Clean Energy Canada’s transportation program manager: “Electric vehicles can be seen everywhere these days—on roads, in Super Bowl ads. After all, one’s concern for climate change is hardly the only reason to upgrade. Electric vehicles are far cheaper to fuel, quicker to accelerate, and often technologically ahead of the curve. Gone are the days when driving a Nissan Leaf or a Tesla said something about you. In 2022, it’s just a good car.”

METHODOLOGY

The survey was conducted with 1,500 Canadian adults from January 20 to 25th, 2022. A random sample of panelists were invited to complete the survey from a set of partner panels based on the Lucid exchange platform. These partners are typically double opt-in survey panels, blended to manage out potential skews in the data from a single source.

The margin of error for a comparable probability-based random sample of the same size is +/- 2.53%, 19 times out of 20.

The data were weighted according to census data to ensure that the sample matched Canada’s population according to age, gender, educational attainment, and region. Totals may not add up to 100 due to rounding.

ABOUT ABACUS DATA

We are the only research and strategy firm that helps organizations respond to the disruptive risks and opportunities in a world where demographics and technology are changing more quickly than ever.

We are an innovative, fast-growing public opinion and marketing research consultancy. We use the latest technology, sound science, and deep experience to generate top-flight research-based advice to our clients. We offer global research capacity with a strong focus on customer service, attention to detail and exceptional value.

We were one of the most accurate pollsters conducting research during the 2021 Canadian election following up on our outstanding record in 2019.

Contact us with any questions.

Find out more about how we can help your organization by downloading our corporate profile and service offering.

Economic anxiety and public policy: A guide to understanding your audiences today for business, policy, and political leaders


I’ve been thinking a lot about the occupation/protests in Ottawa. Our team has done a lot of work examining public reactions to these protests and surrounding views on the pandemic and restrictions/protections. I have also been inspired by work and insights by colleagues and others to understand the dynamics of public opinion and its impact on political behaviour.

And I think decisions about business, investing, and public policy in the future will depend upon having a really good understanding of the opinion landscape.

This is especially true for those who lead organizations in business, labour, media, and government. As I’ll show you, you probably don’t see the world in the same way as everyone else. You are more likely to be a member of the “progressive professionals” described below. Checking that bias at the door and truly understanding what drives the other groups is essential to making good decisions and building concensus.

Here are the key takeaways (if you don’t want or can’t keep reading):

1. I think my analysis helps explain A LOT of our politics today and the increasing alienation between those who influence decisions – business, policy, and media – and those who consume those decisions.

2. It shows that we cannot assume a candidate like Pierre Poilievre or Donald Trump cannot find widespread support in Canada. There are a lot of people feeling anxious about their future – who don’t see themselves represented in the decision-making levels of our country.

3. Most folks who are anxious look at business executives, journalists, policymakers, and others and see people who don’t view the world through the same lens. They feel threatened and anxious while folks like you likely see mostly opportunities. They think the system is rigged against them and you don’t quite understand why they feel that way.

If you’re a member of that “progressive professional” group I describe before (I think I am BTW), then you have to ask yourself whether we are a big part of the problem.

4. And if we are, how can we reconnect with these other audiences?

How do we reflect their worlds? How do we serve them better in the products and services we market to them? How do we design public policies that improves their lives? And how do we communicate those policy decisions so they accept and not reject them?

5. In developing public affairs, communications, or business strategies, ask yourself what motivates these four groups that I’ve identified in this guide.

What keeps them up at night?
Who do they trust?
What do they aspire to achieve?

This is a big focus of my work as a social researcher and if you think me or my team at Abacus Data can help, reach out and let’s chat. But now, for the evidence that supports these takeways.

THE EVIDENCE

In preparing for a briefing for a client on tax fairness, affordability, and public policy in Canada, I went back to a survey we did for the Professional Institute of the Public Sector of Canada and the Broadbent Institute last July 2021.

A lot of the same concerns I see today in polling existed then. There are deep public concerns about the pandemic, the rising cost of living, wealth and income inequality, and the future of the economy.

In fact, 90% of Canadians ranked a pocketbook issue as a top issue that was going to impact their vote in the election we had only a few months later.

Using this data, I’ve been working on a segmentation or classification system that I think helps explain our politics today. Think of it as a guide to understand your Canadian audiences today for business, policy, and political leaders

[sc name=”signup”]

It identifies four key groups…defined by their level of economic anxiety and views on public policy

They are:

Secure middle (39% of population)
Anxious progressives (27%)
Anxious conservatives (21%)
Professional progressives (13%)

I’ll focus most on a group I call the “professional progressives“.

Why? Because most of my clients are in this group. I think I’m in this group. And most important, those in this group make up most of the business, media, & policy universe in Canada. They make decisions that the rest have to consumer or follow.

They have the most influence on policy, the economy, and media coverage. But have quite different views & perceptions

Let me share a few of the key findings from this analysis. Let’s start with their economic anxiety.

Here’s how they have been feeling about money over the past two years. Clearly, the anxious groups are MORE anxious. Note, 44% of progressive professionals have been LESS stressed about money over the pandemic.

Here’s how they feel about income differences between the 1% and themselves over the past 2 years. Again, quite different views between the anxious groups, the secure middle, and the progressive pros

What about perceptions about Canada’s tax system?

Anxious on both the left and right think the tax system is unfair (AKA rigged) but only 43% of progressive professionals think the same thing.

Beyond economic anxiety and perceptions, we also see big differences in how these groups perceive the effectiveness and role of government.
85% of progressive professionals think the government is good. Everyone else is less convinced.

We see the same kind of divides on the role of regulation. Most think regulation is good, but almost all progressives think it is. There’s a big difference with anxious conservatives on this.


This is an IMPORTANT one. 87% of progressive professionals see more opportunities than threats in the future economy.
Majorities in other groups see the opposite – they see threats.


Most groups agree on the role of immigrants. This is an area where anxious progressives and conservatives differ sharply.

So far I’ve shown the wide gaps between progressive professionals and most other groups in Canada.✔️They fundamentally see the world differently.

✔️They see opportunity when others see threats.

✔️They see government as good when others are skeptical.

How do these groups vote?

Well as you can see, not that similar.

Anxious conservatives would vote overwhelmingly for the Conservative Party.
Anxious progressives split between the Liberals and NDP.
Secure Middle split between Liberals and Conservatives.
Progressive professionals would vote overwhelmingly for the Liberal Party

More important, it’s not who they voted for, but WHY they voted for the party they did.

I suspect that the reasons why those in the secure middle or anxious progressive groups voted Liberal are different than those in the progressive professional group. Less about political correctness, identity, and cosmopolitanism and more about economic equity, affordability issues, and part rejection of the Conservative brand of politics.

So who are in these groups?

We find a fairly even distribution by age. Anxious folks are a bit older while progressive professionals tend to be younger.

Progressive professionals have the highest household incomes, but what matters more, in my view, is education. 18% have a post-graduate degree. Much higher than any other group.

Professional progressives are more likely to live in cities whereas everyone else is more distributed across urban, suburban, and rural communities.

Progressive professionals are more concentrated in Quebec and Ontario whereas everyone else is more evenly distributed.

Although there’s a high concentration of anxious conservatives in the Prairies.

Finally, how do they self-identify on the political spectrum?

Pretty close, but not perfectly to how their views/perceptions sort them.

Note, 18% of “progressive professionals” self-ID as on the right of the political spectrum. I suspect these are many of the folks hoping that Jean Charest runs for CPC leader.

So what does all this mean?

Well first, I think this helps explain A LOT of our politics today and the increasing alienation between those who influence decisions – business, policy, and media – and those who consume those decisions.

Second, I think it shows that we cannot assume a candidate like Pierre Poilievre can’t find widespread support in Canada. There are a lot of people feeling anxious about their future – who don’t see themselves represented in the elite levels of our country.

They look at business executives, journalists, policymakers, and others and see people who don’t view the world through the same lens. They feel threatened and anxious while others see opportunities.

They think the system is rigged against them.

If you’re a member of that “progressive professional” group I described (I think I am), then you have to ask yourself whether we are a big part of the problem.

And if we are, how can we reconnect with these other audiences?

How do we reflect their worlds? How do we serve them better in the products and services we market to them? How do we design public policies that improve their lives? And how do we communicate those policy decisions so they accept and not reject them?

In developing public affairs, communications, or business strategies, ask yourself what motivates these four groups that I’ve identified in this guide.

What keeps them up at night?
Who do they trust?
What do they aspire to achieve?

This is a big focus of my work as a social researcher and if you think me or my team at Abacus Data can help, reach out and let’s chat. Oh, and please sign up for our weekly newsletter below.

ABOUT ABACUS DATA

We are the only research and strategy firm that helps organizations respond to the disruptive risks and opportunities in a world where demographics and technology are changing more quickly than ever.

We are an innovative, fast-growing public opinion and marketing research consultancy. We use the latest technology, sound science, and deep experience to generate top-flight research-based advice to our clients. We offer global research capacity with a strong focus on customer service, attention to detail and exceptional value.

We were one of the most accurate pollsters conducting research during the 2021 Canadian election following up on our outstanding record in 2019.

Contact us with any questions.

Find out more about how we can help your organization by downloading our corporate profile and service offering.

Burnout Nation?

As 2021 came to an end, we were noticing that our colleagues, friends, clients, and family members were increasingly telling us they were feeling burned out.

We wondered whether this was simply anecdotal, or more widespread, so we asked a series of questions of working Canadians about how they were feeling overall and about work specifically. Turns out burnout is sweeping the country. Canada is a burned out nation.

One in Three Employed Canadians Say They are Burned Out

At present, 34% of those working right now are feeling burned out. Feelings of burnout are higher among young people. More than half of those 18 to 29 say they are feeling burned out. This is more than twice as likely than older working Canadians.

We know that the pandemic has had disproportionate impacts on younger Canadians. They have had to delay key milestones and have been more likely to have experienced unemployment or underemployment over the past two years.

Not all industries are experiencing burnout equally. Five sectors report much higher levels of burnout than others. Notably, these include technology, not-for-profits, health care and education as well as the hospitality sector and personal services. In contrast, those in manufacturing, logistics and construction are much less likely to be feeling burned out.

For some, burnout is a constant state, just over 1 in 10 workers report feeling burned out “all the time”. Another 33% feel burned out sometimes. Even among those who don’t feel burned out right at this moment, 30% felt burned out at least once over the past 12 months.

What does burnout look like when it comes to the workplace?

One element is clearly exhaustion. For example, consider the statement, “There are days when I feel tired before I arrive at work.” While 7 in 10 agree at least somewhat with this statement, 90% of those who are burned out feel this way.

Burned out people start their workday tired, drained, and exhausted, even before they tackle any of the items on their to-do list.

But it’s not just exhaustion, burnout is also about disengagement. Here we see that while most working Canadians agree that they always find new and interesting things in their work, those who are feeling burnout are less likely to feel this way. Among those who report being burned out, only about half say agree they always find new and interesting aspects in their work, 24-points less likely than those who report not being burned out. Note that the differences by age group disappear when it comes to finding new and interesting aspects of work.

But the differentiation by age group reappears when we talk about actual engagement at work. Six in ten say that they tend to think less at work and do their job almost mechanically. Those who are younger and those feeling burned out are more likely to agree with this statement.

Burnout and Happiness

Burnout at work seeps into the rest of our lives. Using our Happiness Monitor score, we can see that those who are burned out also report being much less happy than those who are not feeling burned out by more than 20 points. This is a huge difference in perceived happiness between the two groups.

Burnout and Social Cohesion

There is good reason to believe that burnout is not good for Canada’s social cohesion. When we are exhausted and disengaged, we are probably not at our best and that includes our relationships and communities more broadly.

Consider a question we often ask about trust in other people. Overall working Canadians slightly favour the view that you can’t be too careful when it comes to other people. But when we look at those who are feeling burned out, the results tip even further in the direction of wariness of other people.

UPSHOT

If you walk down a street, it’s likely that 3 out of every 10 people you see are feeling burned out right now and more than half have experienced burn out in the past year.

Burnout impacts the quality of our work, how engaged we are with our colleagues, and can impact our relationships outside of work. It makes us impatient, careless, and cranky. Beyond our personal and professional lives, it can also impact our political opinions and how we feel about brands we interact with.

What is most troubling is the high levels of burnout among younger workers. No wonder that so many of them are searching for something as more when half of them tell us they are feeling burned out.

The high level of burnout among those in certain sectors also will present a serious problem for the recovery from the pandemic. Reported burnout among those working in healthcare and education is not surprising given the stress they have been under throughout the pandemic, but what happens if they can’t recover? If these numbers persist, we can expect even more challenging labour shortages in these sectors.

Leaders, recruiters, HR professionals, marketers, communicators, and policy makers should consider this data when thinking about how to engage and communicate with audiences that contain about 1 in 3 who feel burned out, tired all the time, and disengaged.

Do you know if your teams are burned out? If not, we can help and compare your team with the national average in your sector. Send our Vice President of Sales and Marketing, Yvonne Langen, a quick email today and we can connect

METHODOLOGY

The survey was conducted online with 2,100 Canadian adults from January 18 to 21, 2022 including 1201 working Canadians. The margin of error for a comparable probability-based random sample of the same size is +/- 2.14%, 19 times out of 20.

The data were weighted according to census data to ensure that the sample matched Ottawa’s population according to age, gender, educational attainment, and region. Totals may not add up to 100 due to rounding.

Abacus Data follows the CRIC Public Opinion Research Standards and Disclosure Requirements that can be found here:  https://canadianresearchinsightscouncil.ca/standards/

The survey was paid for by Abacus Data Inc.

ABOUT ABACUS DATA

We are the only research and strategy firm that helps organizations respond to the disruptive risks and opportunities in a world where demographics and technology are changing more quickly than ever.

We are an innovative, fast-growing public opinion and marketing research consultancy. We use the latest technology, sound science, and deep experience to generate top-flight research-based advice to our clients. We offer global research capacity with a strong focus on customer service, attention to detail and exceptional value.

We were one of the most accurate pollsters conducting research during the 2021 Canadian election following up on our outstanding record in 2019.

Contact us with any questions.

Find out more about how we can help your organization by downloading our corporate profile and service offering.

Emergency measures: Government approval holds as Liberals and Conservatives deadlocked

We recently completed a national survey with a larger than normal sample size of 5,200 Canadian adults completed from February 17 to 22, 2022. Here is what we found:

PUBLIC MOOD & GOVERNMENT APPROVAL

The mood of the country is unchanged from our last reading, with 34% feeling the country is headed in the right direction and 52% thinking it’s on the wrong track.

Approval of the federal government has also held steady with 39% approving and 46% disapproving. Disapproval is almost exactly what it was two weeks ago but is still higher than it has been for all of 2020 and 2021. Net approval is 0 in BC, -22 in Alberta, -20 in Saskatchewan and Manitoba, -2 in Ontario, -11 in Quebec and -14 in Atlantic Canada.

Net approval among 2021 Liberal voters is +65, -67 among Conservative voters, and -15 among NDP voters. Among those who are fully vaccinated with a booster, the net approval rating for the federal government is +3, it is -8 among those with 2 shots and no booster, while among those who are not fully vaccinated, the government’s net approval is -53.

INVOKING THE EMERGENCIES ACT

We find significantly more support (57%) than opposition (30%) for the federal government’s decision to invoke the Emergencies Act. Support is a lot higher than opposition among Liberal voters (79%-13%) NDP voters (63%-23%), and BQ voters (59%-32%). Conservative voters are more split, with 40% supporting the move, and 50% opposing.

A majority in every region of the country supports invoking the Emergencies Act including 62% in BC, 53% in Alberta, 53% in Manitoba and Saskatchewan, 58% in Ontario, 53% in Quebec, and 52% in Atlantic Canada.

We saw no evidence that support for the Emergencies Act being invoked fluctuated over the six days of polling.

LEADER IMPRESSIONS

Justin Trudeau enjoys a positive impression among 35% and negative impressions among 46%, for a net score of – 11. This is largely unchanged from earlier this month. We are writing a more detailed essay on Mr. Trudeau’s image over his years in the public eye in Ottawa.

Today, 20% have a positive impression of interim Conservative leader Candice Bergen (+2 since Feb 8) while her negatives are at 32% (+4) for a net score of -12. Mr. O’Toole finished his time as leader with a net favourability of -25.

Jagmeet Singh enjoys a positive impression among 39% and finds negative impressions among 26% for a net score of +13, similar to our results earlier this month.

In Quebec, BQ Leader Mr. Blanchet is 36% positive and 31% negative for a net score of +5. Mr. Trudeau is -14 in Quebec, Ms. Bergen is -23.

ACCESSIBLE VOTER POOLS

Today, 50% would consider voting Liberal, 46% NDP, and 41% Conservative, largely unchanged from earlier this month although the NDP accessible voter pool is down 3.
27% would consider voting Green, 20% would consider voting for the People’s Party while 41% would consider voting BQ in Quebec.

VOTING INTENTION

If an election were held now, the Liberals and Conservatives would be deadlocked at 31% each with the NDP at 20%, the BQ at 8%, and the People’s Party at 6%. The Greens would earn 3% of the vote. Compared with the 2021 election, the Liberals are down 2, the Conservatives are down 3, and the NDP is up 2.

• BC: Liberals are at 33%, the Conservatives at 30% and the NDP at 28%. The Liberals lead by 8 over the Conservatives in Metro Vancouver but are third on Vancouver Island and in the Interior.

• Alberta: 49% would vote Conservative compared with 21% for the NDP, 21% for the Liberal Party, and 7% for the People’s Party. In Edmonton, the Conservatives are at 44% followed by the NDP at 26% and the Liberals at 23%. In Calgary, the Conservatives are at 50% with the Liberals at 22% and the NDP at 21%.

• Manitoba and Saskatchewan: The Conservatives lead with 39% followed by the NDP at 26%, the Liberals at 22%, and the People’s Party at 7%.

• Ontario: The Liberals lead by 3 over the Conservatives (35% to 32%) with the NDP in third at 22%. The People’s Party is polling at 7% in Ontario. The Liberals lead the Conservatives by 12 in Toronto, 8 in the GTHA, while the Conservatives are ahead in the Southwest region of the province 34% to 27%.

• Quebec: We see the BQ ahead of the Liberals (38% to 30%) with the Conservatives at 20%, the NDP at 8%.

• Atlantic: The Conservatives and Liberals are tied (32% to 31%) with the NDP at 24%.

UPSHOT

According to Bruce Anderson:“

The high-profile blockades and occupation of Ottawa, the continuation of the pandemic, and the invocation of the Emergencies Act are not conditions one would expect to see strengthening Liberal Party support – it’s probably more remarkable that Mr. Trudeau’s party has remained as competitive as it has.  Voters aren’t elated about the situation in Canada, but they continue to see worse conditions elsewhere, and their frustration level with the federal incumbents is holding pretty steady, for the moment.  The Emergencies Act was not an unpopular choice, and may have more of an effect in dividing Conservatives than drawing voters to their position.”

According to David Coletto: “

After two more weeks of occupations, blockades, and the invocation of the Emergencies Act, views of the federal government and the Prime Minister have remained fairly steady after a negative turn earlier this month. Negative views of the Prime Minister have hit a 24-month high. We haven’t seen almost half the country hold a negative impression since the middle of the SNC-Lavalin controversy.

At the same time, negative impressions of Conservative leader Candice Bergen have increased suggesting that no political leader or party has benefited from this tumultuous period in Canadian politics so far.

The Liberals and Conservatives are deadlocked nationally. None of the major parties have seen their accessible voter pools increase over this period and while the Prime Minister’s negatives have increased, a plurality doesn’t believe he should step down because of the blockades and protests that happened across Canada.

What we do see, however, is a strengthening of the relationship between vaccination status and political opinion. If only those who are fully vaccinated with a booster (58% of the population) voted, the Liberals would likely win a majority government (LPC 35%, CPC 29%, NDP 22%). If only those not vaccinated (1 or no shots) voted, the Conservatives easily win a majority (CPC 38%, PPC 21%, LPC 13%, NDP 13%).”

METHODOLOGY

The survey was conducted with 5,200 Canadian adults from February 17 to 22, 2022. A random sample of panelists were invited to complete the survey from a set of partner panels based on the Lucid exchange platform. These partners are typically double opt-in survey panels, blended to manage out potential skews in the data from a single source.

The margin of error for a comparable probability-based random sample of the same size is +/- 1.4%, 19 times out of 20.

The data were weighted according to census data to ensure that the sample matched Canada’s population according to age, gender, educational attainment, and region. Totals may not add up to 100 due to rounding.

Abacus Data follows the CRIC Public Opinion Research Standards and Disclosure Requirements that can be found here:  https://canadianresearchinsightscouncil.ca/standards/

ABOUT ABACUS DATA

We are the only research and strategy firm that helps organizations respond to the disruptive risks and opportunities in a world where demographics and technology are changing more quickly than ever.

We are an innovative, fast-growing public opinion and marketing research consultancy. We use the latest technology, sound science, and deep experience to generate top-flight research-based advice to our clients. We offer global research capacity with a strong focus on customer service, attention to detail and exceptional value.

We were one of the most accurate pollsters conducting research during the 2021 Canadian election following up on our outstanding record in 2019.

Contact us with any questions.

Find out more about how we can help your organization by downloading our corporate profile and service offering.

One Quarter of Canadians Experiencing Deteriorating Relationships Due to a Difference of Opinion Regarding COVID-19

As our data from last week showed, the so-called freedom convoy has been a polarizing issue for Canadians. As tensions continue to run high here in Ottawa and elsewhere across the country, we wanted to dig deeper to explore how the pandemic and subsequent public health mandates have changed how we relate to our friends, colleagues, and families.

Our latest survey finds half of us hold a different view on measures/actions taken relating to the COVID-19 pandemic than someone close to us. This is most common among younger Canadians (those aged 18-29), Alberta residents, and those who support the freedom convoy. But who are these disagreements between? And are some more likely to end in a failed relationship than others?

Well, our data indicates that differences in opinion are most often seen between family members or friends. Conflicting opinions are much less common among colleagues, spouses/partners/significant others, and even rarer between employee and employer.

About 1 in 4 Canadians have had a relationship deteriorate because of these differing opinions related to the safety measures, mandates, and restrictions brought on by the COVID-19 pandemic.

For those who’ve experienced differing opinions with a colleague or friend- over half say they’ve had a relationship deteriorate due to these differing views.

All in, the average Canadian whose relationship(s) have been impacted because of their differing views on the pandemic and pandemic related measures has seen three relationships deteriorate.

Still, some views appear to be more conflicting than others. Those who are skeptical about the measures taken to reduce the spread of COVID-19 (mask mandates, travel restrictions, vaccine mandates, etc.) have seen more relationships deteriorate than those who support these measures. However, this may be due to the fact that those who are pro-vaccine account for a large majority of the population, and are therefore likely to encounter far fewer individuals whose opinions regarding COVID-19 differ from their own.

UPSHOT:

According to Michael Monopoli: “As tensions regarding COVID-19 continue to run high across the nation, relationships are feeling an added strain. With last week’s data showing that the convoy in Ottawa is proving to be quite the polarizing topic among Canadians, many may be struggling to empathize with those around them.

It seems the widespread social, economic and health consequences of the pandemic have just created more topics to hold differing opinions on. And, while differing opinions may be nothing new for Canadians, it the pandemic has led many to re-evaluate the values they want to share with those around them.”

METHODOLOGY

The survey was conducted with 1500 Canadian adults from February 9 to 13, 2022. A random sample of panelists were invited to complete the survey from a set of partner panels based on the Lucid exchange platform. These partners are typically double opt-in survey panels, blended to manage out potential skews in the data from a single source.

The margin of error for a comparable probability-based random sample of the same size is +/- 2.53%, 19 times out of 20.

The data was weighted according to census data to ensure that the sample matched Canada’s population. Totals may not add up to 100 due to rounding.

Abacus Data follows the CRIC Public Opinion Research Standards and Disclosure Requirements that can be found here:  https://canadianresearchinsightscouncil.ca/standards/

ABOUT ABACUS DATA

We are the only research and strategy firm that helps organizations respond to the disruptive risks and opportunities in a world where demographics and technology are changing more quickly than ever.

We are an innovative, fast-growing public opinion and marketing research consultancy. We use the latest technology, sound science, and deep experience to generate top-flight research-based advice to our clients. We offer global research capacity with a strong focus on customer service, attention to detail and exceptional value.

We were one of the most accurate pollsters conducting research during the 2021 Canadian election following up on our outstanding record in 2019.

Contact us with any questions.

Find out more about how we can help your organization by downloading our corporate profile and service offering.

Voting intentions favour Liberals, but frustration is mounting across the country

We completed a national survey of 1,500 Canadian adults from February 4 to 8, 2022.

Here’s a snapshot of our findings.

PUBLIC MOOD & GOVERNMENT APPROVAL

The mood of the country has soured further since our last wave of research roughly a month ago. Today, 34% feel the country is headed in the right direction (down 8 over two months and the lowest since April 2021) while 50% think it’s on the wrong track, up 7.

Approval of the federal government has dropped from 44% a month ago to 38% this month and disapproval has risen from 40% to 45%. Net approval (approve – disapprove) regionally is -4 in BC, -40 in Alberta, -19 in Saskatchewan and Manitoba, +5 in Ontario, -12 in Quebec, and +1 in Atlantic Canada.

LEADER IMPRESSIONS

Justin Trudeau enjoys a positive impression among 36% and negative impressions among 46%, for a net score of – 10 compared to his net score of -2 a month ago. His negatives are the highest we have registered  Mr. Trudeau’s favourability is +24 among voters who self describe as left of centre, -14 among those on the centre, and -47 among those on the right.

Today 17% have a positive impression of Interim Conservative leader Candice Bergen while her negatives are at 28% for a net score of -11. Mr. O’Toole finished his time as leader with a net favourability of -25.

Jagmeet Singh enjoys a positive impression among 41% and finds negative impressions among 25% for a net score of +16, similar to our results last month.

In Quebec, BQ Leader Mr. Blanchet is 36% positive and 28% negative for a net score of +8. Mr. Trudeau is -14 in Quebec, Ms. Bergen is -27.

VOTING INTENTION

If an election were held now, the Liberals would win 33% of the vote (their 2021 election result), the Conservatives would win 30% (4-points lower than their share in the election and down two from earlier this month), and the NDP 19% (1-point higher than the 2021 result). The BQ is at 8% nationally while the People’s Party is at 6% and the Greens at 3%.

• BC: Liberals are at 36%, the Conservatives at 30% and the NDP at 24%.

• Alberta: 54% would vote Conservative compared with 20% for the NDP, 14% for the Liberal Party, and 8% for the People’s Party.

• Manitoba and Saskatchewan: The Conservatives lead with 39% followed by the Liberals at 27% and the NDP at 21% and the People’s Party at 11%.

• Ontario: The Liberals have a 4-point lead over the Conservatives (36% to 32%) with the NDP in third at 20%. The People’s Party is polling at 8% in Ontario.

• Quebec: We see the BQ ahead of the Liberals (37% to 32%) with the Conservatives at 16%, the NDP at 12%.

• Atlantic: The Liberals lead with 41% compared with 23% for the NDP, 23% for the Conservatives, and 7% for the People’s Party.

UPSHOT

According to Bruce Anderson:“These numbers will be sobering for the Liberals but well short of warming for the Conservatives. People are frustrated about the pandemic and the sense of unease and friction in the country is naturally going to create expectations of the government to ease tensions and disappointment in the government when that isn’t happening.

There are two separate issues neither of which are positive for the incumbents right now – people want a plan to return to life as normal and feel that the vaccination level is high enough and the Omicron threat low enough that it is time to move in that direction. The government sometimes can sound like it is arguing against that fervent desire, simply by virtue of having to defend the role of science rather than emotion in setting policy.

The second issue is the question of how our Capital could have been blockaded and occupied, and our border passages shut down by protests, without a rapid response to assert law and order and protect the rights of everyone affected by these events. These developments have been startling to many people and naturally make people wonder if all levels of government could have been and should have been better prepared to head off these problems more quickly. One saving grace politically for the Liberals is the fact that so far the Conservatives seem unable to take a consistent and firm position – and offer unsettled voters an alternative that they could gravitate towards.”

According to David Coletto: “As the Freedom Convoy continues to occupy Ottawa and disrupt trade and movement at several border crossings, Canadians are watching and reacting to the events. We see negative pressure on the Prime Minister’s personal numbers as his negative hit a 12-month high. The new Conservative Leader, Ms. Bergen, is largely unknown but starts with a net negative impression – a less than positive introduction to Canadians.

The protests along with rising inflation, a potential war in Europe, and an ongoing pandemic have Canadians on edge. Increasingly, none of the political options on offer are particularly appealing. I suspect the pressure will build on the Prime Minister to be more engaged on these problems. For the Conservatives, tensions within the party and a leadership race will divert its attention from the national crises.

As Canadians react, we are seeing their willingness to consider either party decline, creating an opportunity for the NDP, BQ, People’s Party and the Greens to offer a compelling alternative to the two mainstream parties.”

METHODOLOGY

The survey was conducted with 1,500 Canadian adults from February 4 to 8, 2022. A random sample of panelists were invited to complete the survey from a set of partner panels based on the Lucid exchange platform. These partners are typically double opt-in survey panels, blended to manage out potential skews in the data from a single source.

The margin of error for a comparable probability-based random sample of the same size is +/- 2.6%, 19 times out of 20.

The data were weighted according to census data to ensure that the sample matched Canada’s population according to age, gender, educational attainment, and region. Totals may not add up to 100 due to rounding.

Abacus Data follows the CRIC Public Opinion Research Standards and Disclosure Requirements that can be found here:  https://canadianresearchinsightscouncil.ca/standards/

ABOUT ABACUS DATA

We are the only research and strategy firm that helps organizations respond to the disruptive risks and opportunities in a world where demographics and technology are changing more quickly than ever.

We are an innovative, fast-growing public opinion and marketing research consultancy. We use the latest technology, sound science, and deep experience to generate top-flight research-based advice to our clients. We offer global research capacity with a strong focus on customer service, attention to detail and exceptional value.

We were one of the most accurate pollsters conducting research during the 2021 Canadian election following up on our outstanding record in 2019.

Contact us with any questions.

Find out more about how we can help your organization by downloading our corporate profile and service offering.

Canadians See Investment Growing in Clean Energy and Sustainable Products, and Want an Ambitious Strategy to Compete in These Markets

In the latest round of survey work by Clean Energy Canada and Abacus Data, Canadians expect the next 20 years will see rising investment around the world in renewable and lower carbon forms of energy, and they want Canada to be a vigorous competitor when it comes to winning that investment race.

Key findings include:

  • Two thirds expect investment in renewable energy sources like sun, wind, tidal and geothermal energy to increase around the world over the next 20 years.
  • Expectations around natural gas and nuclear energy are more mixed, with slightly more people feeling that investment will increase than foresee a decline.
  • The plurality expect investment in oil to decline over the next 20 years (48%), while 39% expect it to hold and 13% think it will increase.
  • Pluralities also forecast increased investment in sustainably produced forest products (48% increase, 7% decrease) and responsibly produced minerals and metals (42% increase, 7% decrease).
  • When it comes to vehicles, the majority see a decline in investment in gas and diesel vehicles (55% foresee a decrease) and increasing investment in electric vehicles (73% see an increase).
  • Majorities also see rising investment in the design and manufacture of zero or low emission buildings (62%) and rail and shipping technologies (57%).

Three out of four people believe “Canada must have an ambitious strategy to be strong competitors in a global economy that is striving to reduce carbon emissions,” while 25% believe “The rest of the world economy isn’t going to change very much and we should not change too much or else we will lose jobs and competitiveness.”

In support of a lower carbon competitiveness strategy, massive majorities support the following policy measures:

  • Job retraining for workers who need to learn new skills (95% support)
  • Subsidies to help companies purchase new equipment to help them reduce emissions (85%)
  • Making it easier for companies to access affordable and cleaner forms of energy (92%)

Canadians also have opinions about which sectors Canadian policy should put a priority on.  Three quarters or more feel a priority should be placed on renewable energy, bioenergy, forest products, minerals and metals, low carbon buildings, low carbon shipping, and electric vehicles. Two thirds would like to see a priority on on natural gas, and opinions are split on nuclear energy and oil. However, most don’t want to see a priority on gas and diesel manufacturing.

Canadians tend to think we have a good or excellent chance of being competitive in a variety of these sectors over the next 20 years, including renewable energy, sustainable forest products, responsible minerals and metals, low carbon buildings and shipping, electric vehicles, bioenergy, and natural gas. Confidence is lower when it comes to gas and diesel vehicles, oil, and nuclear energy.

UPSHOT

According to Bruce Anderson, Chairman of Abacus Data: “One of the better ways to understand the way Canadians feel about the decarbonization challenge is to explore how they feel the world will be changing and what that should imply in terms of Canadian economic strategy.  These numbers make it clear that Canadians have a view about where “the puck is going” and believe that the investments will flow to lower carbon innovations wherever possible. They both have confidence that we can succeed in this evolving global economy and want policy that helps Canada adapt and benefit from these trends, rather than avoid or ignore the trends.”

According to Trevor Melanson, Communications Director of Clean Energy Canada: “Building a sustainable economy isn’t just about producing clean energy. It’s also about the raw and manufactured materials required to build a better world—materials that go into renewable projects, electric vehicles, low-carbon buildings, and much more. The shift that’s happening globally is far bigger than any one sector, and three-quarters of Canadians now believe we must have an ambitious strategy in order to compete.”

METHODOLOGY

The survey was conducted with 1,500 Canadian adults from January 20 to 25th, 2022. A random sample of panelists were invited to complete the survey from a set of partner panels based on the Lucid exchange platform. These partners are typically double opt-in survey panels, blended to manage out potential skews in the data from a single source.

The margin of error for a comparable probability-based random sample of the same size is +/- 2.53%, 19 times out of 20.

The data were weighted according to census data to ensure that the sample matched Canada’s population according to age, gender, educational attainment, and region. Totals may not add up to 100 due to rounding.

The survey was paid for by Clean Energy Canada.

ABOUT ABACUS DATA

We are the only research and strategy firm that helps organizations respond to the disruptive risks and opportunities in a world where demographics and technology are changing more quickly than ever.

We are an innovative, fast-growing public opinion and marketing research consultancy. We use the latest technology, sound science, and deep experience to generate top-flight research-based advice to our clients. We offer global research capacity with a strong focus on customer service, attention to detail and exceptional value.

We were one of the most accurate pollsters conducting research during the 2021 Canadian election following up on our outstanding record in 2019.

Contact us with any questions.

Find out more about how we can help your organization by downloading our corporate profile and service offering.

Love (AKA: Emotional Compatibility) Is in the Air

The holiday of love is right around the corner, so what better time to reflect on who we love, why we love them, and (you knew this was coming) whether the pandemic has had an impact.

First, a state of play on where things stand on relationships.

Two-thirds (65%) of Canadians are currently in a relationship and one in five have experienced some sort of major change to their relationship status (married/engaged, divorce/breakup, or starting a new, serious relationship) since the start of the pandemic.

  • This number jumps to 38%(!) among 18- to 29-year-olds. Which includes 8% who got married or engaged and 21% who started a new serious relationship.
  • And a more mild but still high 27% among 30-to-44-year-olds, split evenly between separations/divorce, new relationships, and engagement/marriage.

For those of us (still) in relationships, the pandemic has had a net positive impact, or at the very least, no impact at all. 68% love the extra time spent with their partner, while 28% are indifferent, and only 4% hate it. A third of us also say the pandemic has solidified our relationships, but more often than not, we say their hasn’t really been an impact either way.

Unfortunately, those of us looking for love haven’t fared as well during the pandemic. An overwhelming majority (72%) of single Canadians say it is more difficult to date in a pandemic. And, with the playing field having changed, a third have also changed what they are looking for in a relationship/partner.

If you’re thinking, well, ‘online dating is virtual anyways, it can’t be that bad!’ I’m sorry to say that this isn’t the case.

Just over a quarter of Canadians have tried an online dating app or website (Tinder, Bumble, Hinge, Match, The League, eHarmony etc.). For each of these services, there are just as many unhappy users, as happy users (50% satisfied with their experience, 50% were not).

Nothing beats a mutual connection (likely much more difficult these days)- three in four who’ve been set up with a mutual connection are satisfied with the experience.

So, for those of us who’ve found it, and those of us yet to find it, what are we all looking for? What do we all value in relationships? Well, among the list of traits put forward, two clear lists can be made; what’s important, and what’s… not as important.

Emotional compatibility, personal interests compatibility, life priorities/pace compatibility, and physical attraction are in the first category, the most sought after traits for a relationship. They are, more often than not, placed in the top 4 most important traits for a relationship.

Family compatibility, religious/spirituality compatibility, sexual compatibility, and financial compatibility are on the second list and are considered ‘not as important’ things.

For the most part, whether we are in a relationship or not, we are all looking for the same things. That said, those of us in relationships place sexual compatibility a little bit higher, while single Canadians place a bit more importance on personal interest compatibility.

The big differences, however, are between men and women. If you were looking to find something the pandemic hasn’t changed- it seems like quintessential gender stereotypes are on that list. Women are much more likely to place importance on emotional compatibility (65% women vs 57% men) and life priorities/pace compatibility (59% women vs 44% men), whereas men are much more likely to place physical attraction (39% women vs 50% men), and sexual compatibility (22% women vs 36% men) in their top 3.

All that said, there are a few final preferences we wanted to know about, including some that are surprising.

After seeing a few articles on the rise of non-monogamous relationships, we wanted to gauge reactions to the idea. turns out, a quarter of Canadians are at least open to a non-monogamous relationship. This jumps to one in three among single Canadians.

But, what about prenups? These have been on the rise in North America, but how many Canadians would consider one? Well, Just over half of Canadians are open to a prenup or already have one. Again, more common among those of us who are single.

Finally, to end this piece on a high note, do we believe in true love? For the most part, yes! Half of Canadians say yes, they believe in finding ‘the one’, while 32% say maybe, and 13% say not at all. This time, it’s slightly higher among those already in a relationship.

THE UPSHOT

“All things considered, it seems love is still in the air. Nearly all of us might believe in finding the one, with the possibility of a few caveats (prenups and non-monogamy) along the way. And for the most part, we have some level of consensus that ‘the one’ means emotional compatibility (though if it’s men you are interested in, just know physical attraction and sexual compatibility are closer to the top of their list).

Those of us in relationships have fared better over the last couple years- enjoying the extra time spent with partners. While those of us who are still single have had a more difficult time dating during the pandemic, like most of these conclusions, there is hope that as we ease out of the pandemic, the dating scene will become easier.”

METHODOLOGY

This survey was conducted with n=2,100 from January 18th to 20th, 2022. The margin of error for a comparable probability-based random sample of the same size is +/- 2.14%, 19 times out of 20.

The survey was conducted using a random sample of panelists invited to complete the survey from a set of partner panels based on the Lucid exchange platform. These partners are double opt-in survey panels, blended to manage out potential skews in the data from a single source.

The data was weighted according to census data to ensure that the sample matched Canada’s population according to age, gender, educational attainment, and region.

ABOUT ABACUS DATA

We are the only research and strategy firm that helps organizations respond to the disruptive risks and opportunities in a world where demographics and technology are changing more quickly than ever.

We are an innovative, fast-growing public opinion and marketing research consultancy. We use the latest technology, sound science, and deep experience to generate top-flight research-based advice to our clients. We offer global research capacity with a strong focus on customer service, attention to detail and exceptional value.

We were one of the most accurate pollsters conducting research during the 2021 Canadian election following up on our outstanding record in 2019.

Contact us with any questions.

Find out more about how we can help your organization by downloading our corporate profile and service offering.