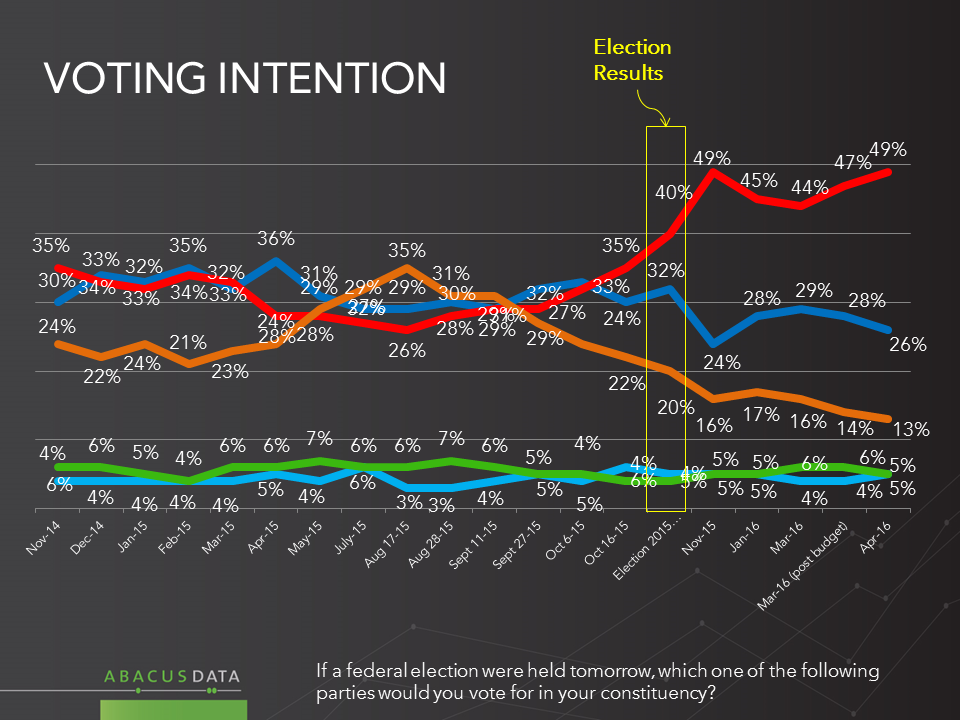
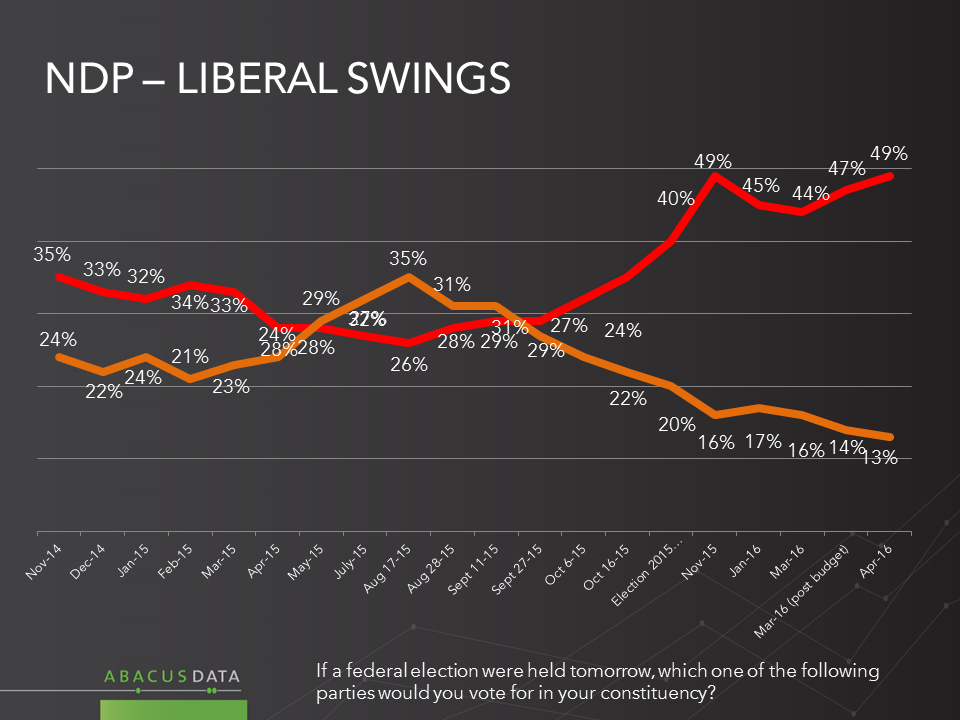
We conducted our latest national survey of voting intentions in the days immediately following the NDP national convention in Edmonton. The results show erosion of NDP support since our last survey. The shrinking NDP support appears largely to benefit to the Liberal Party.
Here are the highlights of our findings:
• Across the country, 49% say they would vote Liberal today, 26% Conservative and only 13% NDP.
• The Liberals lead in every region of the country, except the Prairies. Worth noting is that in our Alberta sample, the Liberals have 34% support, 10 points above their election result (Given the small sample size for the province, caution should be exercised in reporting this result).
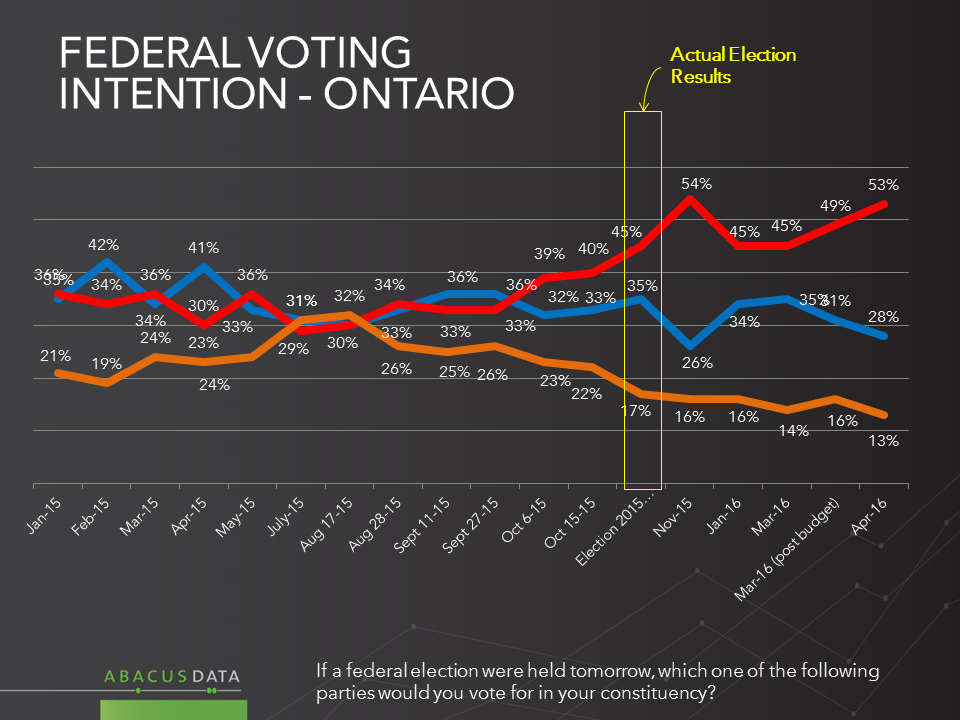
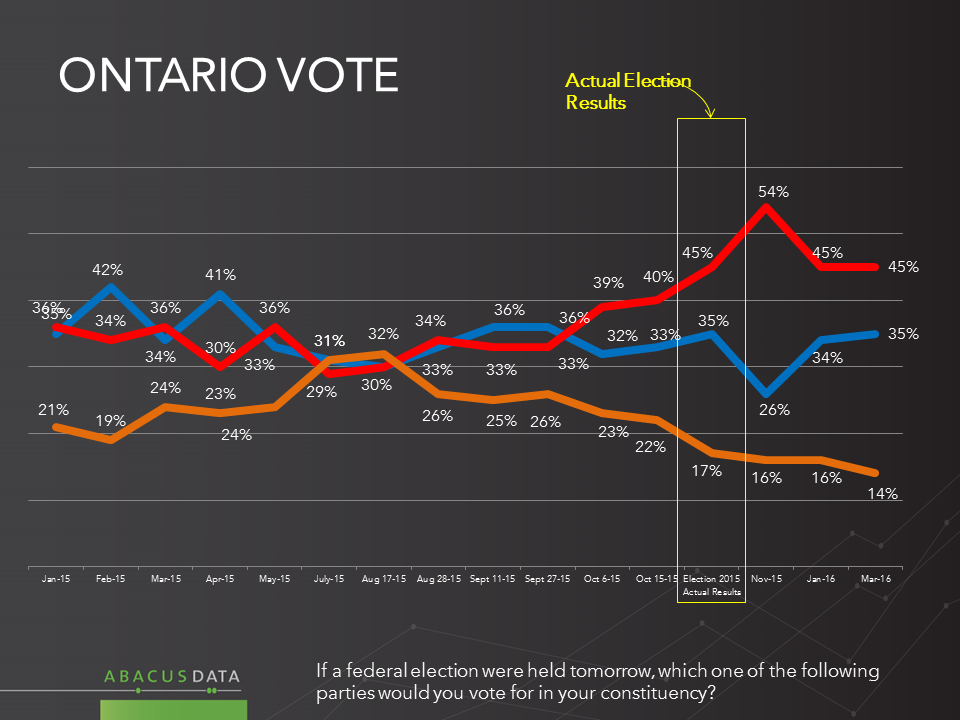
• In Ontario, the Liberals have 53% support, followed by the Conservatives at 28% and the NDP dropping to 13%. To put this in perspective, when the election was called late last summer, the NDP was marginally ahead of the Liberal Party in Ontario (32-30). The Liberal number in this survey is 8 points above the election result in the province.
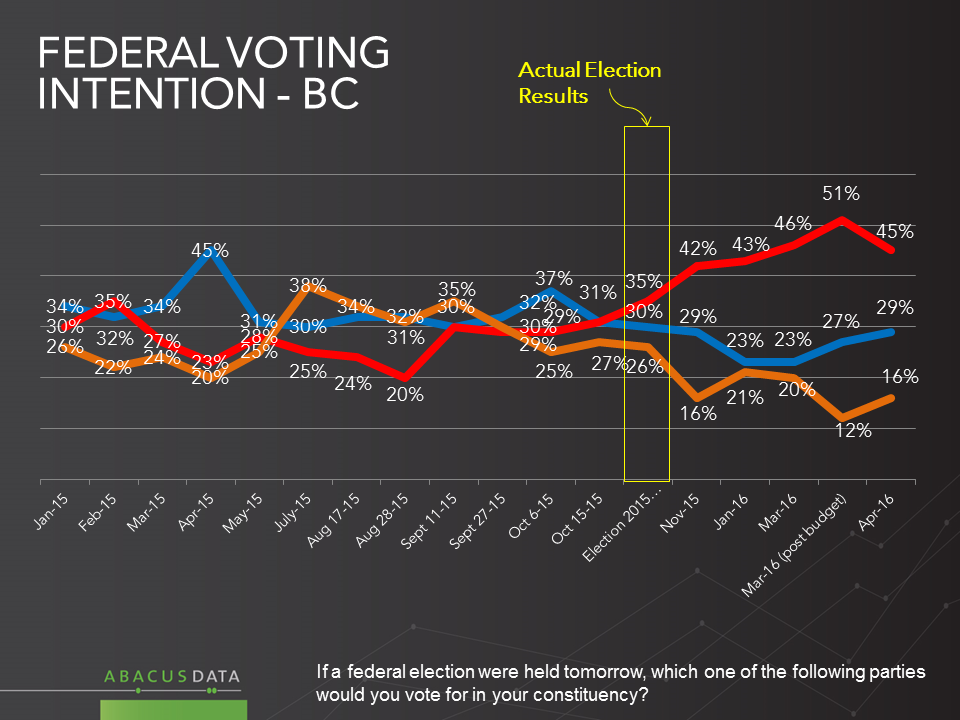
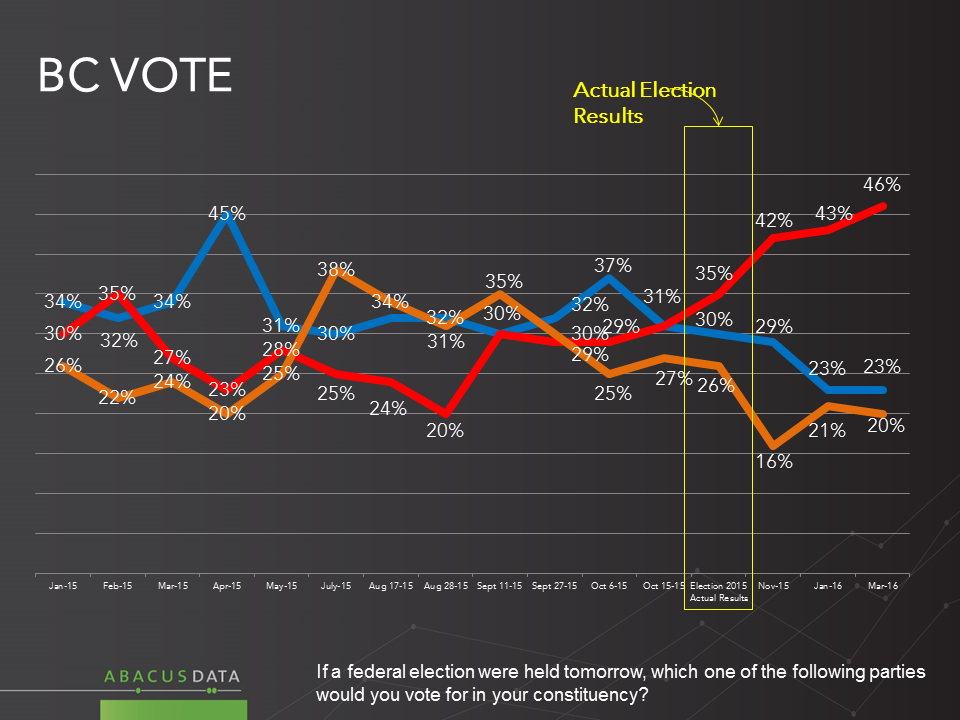
• In BC, the NDP has lost 10 points since the election, while the Liberals have picked up 10. What was a three-party race is now a 16 point lead for the Liberals over the Conservatives and a 29 point advantage over the NDP.
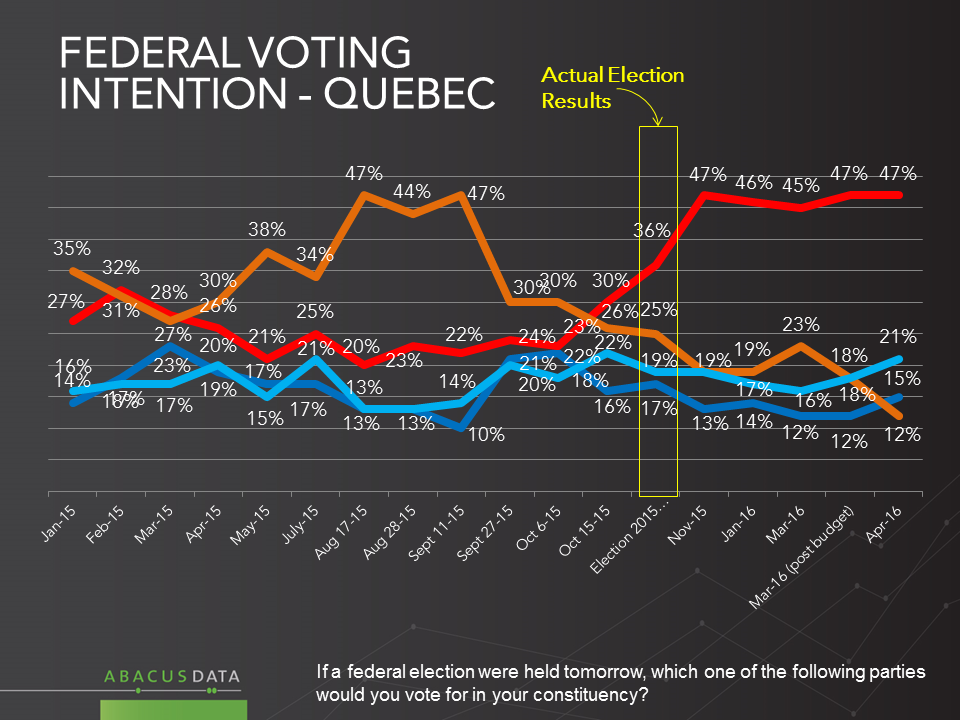
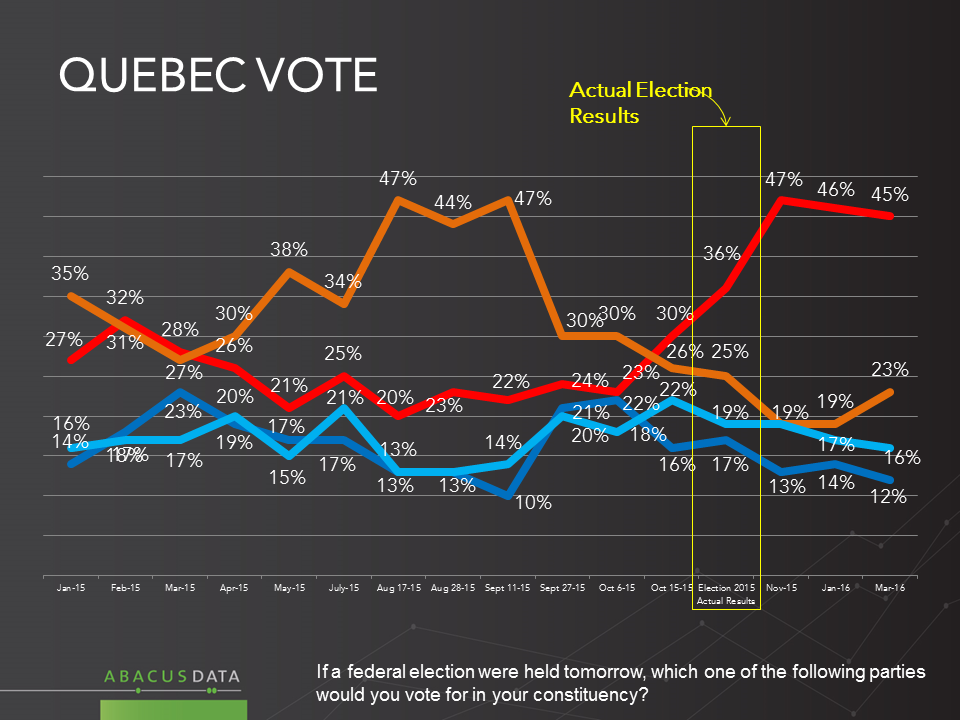
• The most challenging news for the NDP may be what has happened in Quebec. From a high of 47% and leading in the province last summer, NDP has plunged to 12%, leaving the party fourth behind the Liberals at 47%, the Bloc at 21%, and the Conservatives at 15%. NDP support has dropped by half since the election.
THE UPSHOT
National conventions are ideally a springboard for creating renewed interest in political parties. This event in Edmonton had no apparent salutary effects, and with almost a quarter of last fall’s NDP voters saying they would now vote Liberal, the challenges for the party are clear and somewhat intensified.
In one sense, voting intention numbers this far from an election mean very little, but at a minimum they provide a sense that the party has been struggling to establish a strong value proposition.
The debate about the Leap Manifesto may help the NDP establish some edge, or it may render it more of a fringe idea – that will depend on how it is handled and how prominent it becomes. For the moment, the evidence is that the battle for the centre-left was a see-saw one last year, but as of now the NDP has fallen well back of their progressive rival.
METHODOLOGY
Our survey was conducted online with 1,500 Canadians aged 18 and over from April 11 to 13, 2016. A random sample of panelists was invited to complete the survey from a large representative panel of over 500,000 Canadians.
The Marketing Research and Intelligence Association policy limits statements about margins of sampling error for most online surveys. The margin of error for a comparable probability-based random sample of the same size is +/- 2.6%, 19 times out of 20. The data were weighted according to census data to ensure that the sample matched Canada’s population according to age, gender, educational attainment, and region. Totals may not add up to 100 due to rounding.
ABACUS DATA
We offer global research capacity with a strong focus on customer service, attention to detail and value added insight. Our team combines the experience of our Chairman Bruce Anderson, one of Canada’s leading research executives for two decades, with the energy, creativity and research expertise of CEO David Coletto, PhD.
Most Canadians believe the climate is changing and are open to using carbon pricing to reduce emissions. When it comes to the uses of carbon revenues, preferences are for recycling in ways that will most directly shift emissions outcomes.
Abacus Data conducted a nationwide survey on behalf of Canada’s Ecofiscal Commission to measure public opinion on climate change, carbon pricing, and revenue recycling options. Our survey was conducted online with 2,200 adult Canadians from September 25 to 29, 2015. A random sample of panelists was invited to complete the survey from a large representative panel of over 500,000 Canadians.
VIEWS ON CLIMATE CHANGE AND GOVERNMENT ACTION
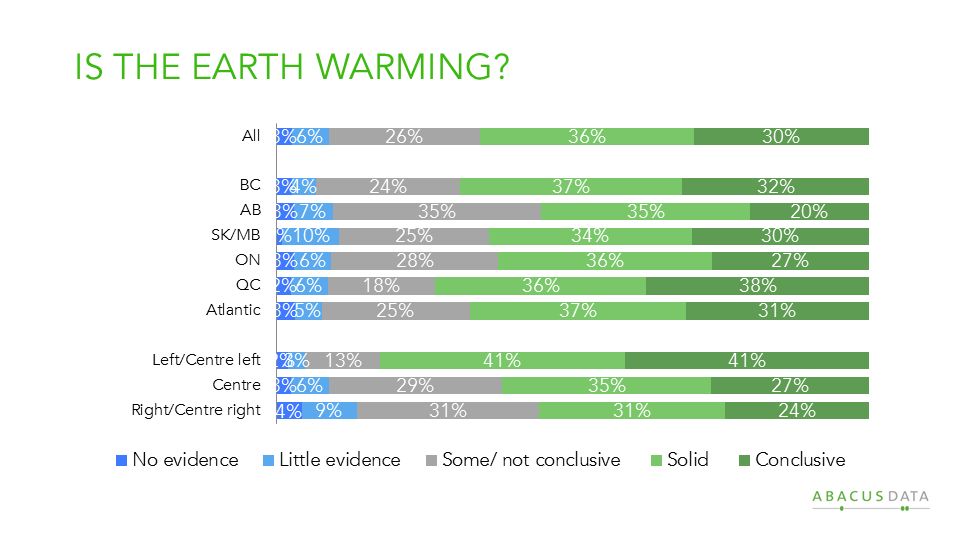
Most (66%) believe that there is solid or conclusive evidence that the average temperature on earth has been getting warmer over the past few decades. Few believe there is no or little evidence (9%). Another 26% believe there is some evidence of warming but it is not conclusive.
Views are fairly consistent across the country with Albertans less likely and Quebecers more likely to believe there is solid or conclusive evidence of rising temperatures. Those on the left are more sure than those on the right.
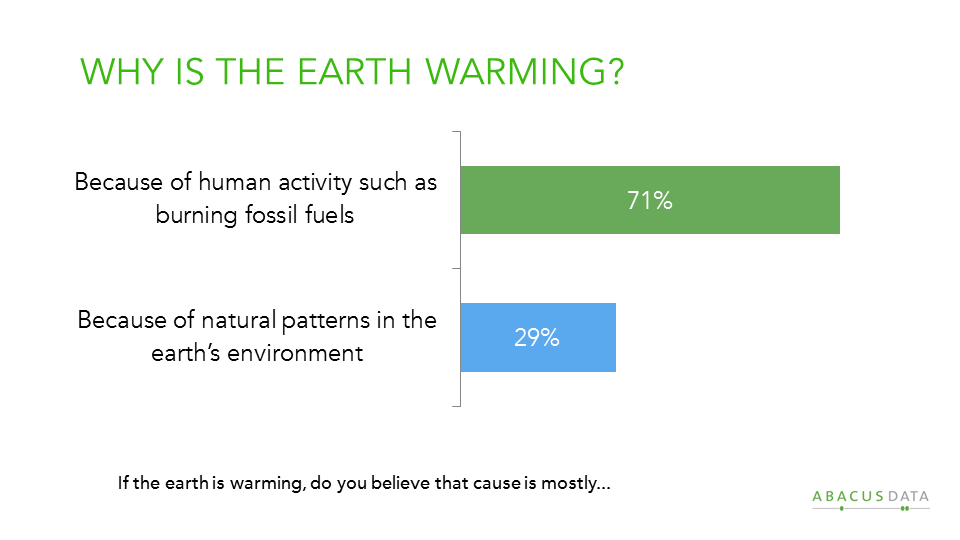
When asked if the earth is warming whether human activity or natural patterns were responsible, the majority 71% believe it is caused by human activity such as burning fossil fuels.
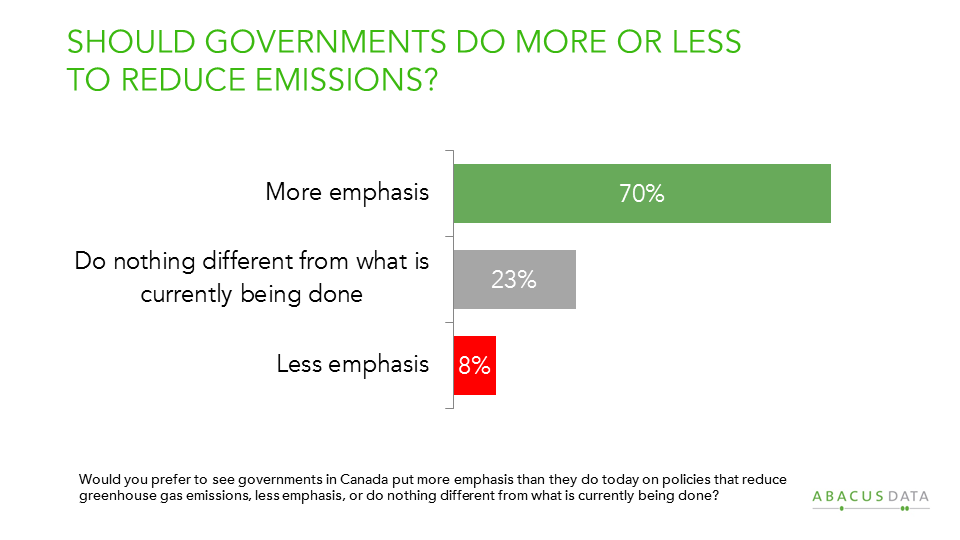
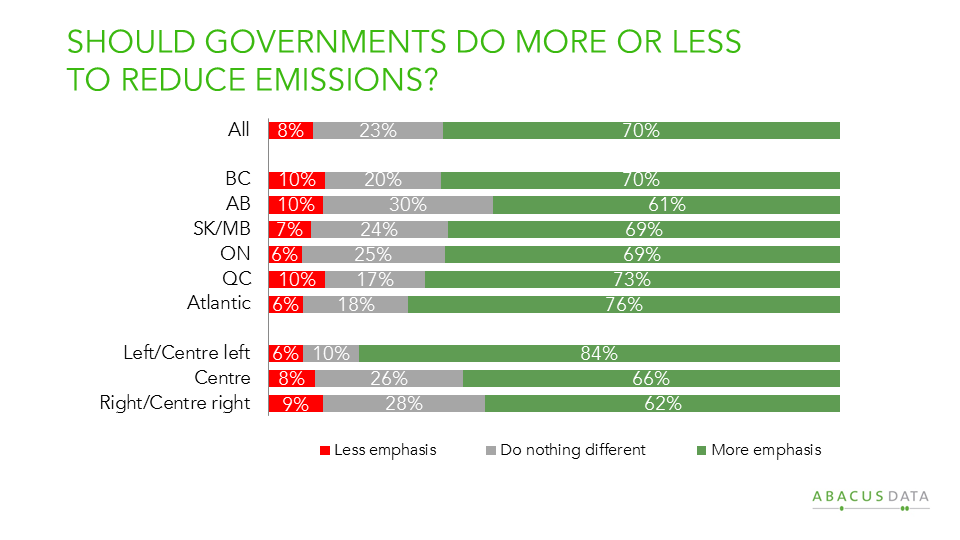
Canadians would like to see governments in Canada put more emphasis (at the time of the survey in September 2015) on policies that reduce greenhouse gas emissions.
Overall 70% would like to see more emphasis on reducing emissions while 8% believe there should be less emphasis. Another 23% are satisfied with the amount of effort currently being done now.
Opinion on government action on cutting greenhouse gases is fairly consistent across Canada with at least six in ten respondents in all regions of the country favouring more action (61% in Alberta). There is also a generational consensus with at least two thirds in all age groups favouring more emphasis on reducing emissions.
CARBON PRICING: FAMILIARITY AND REACTION
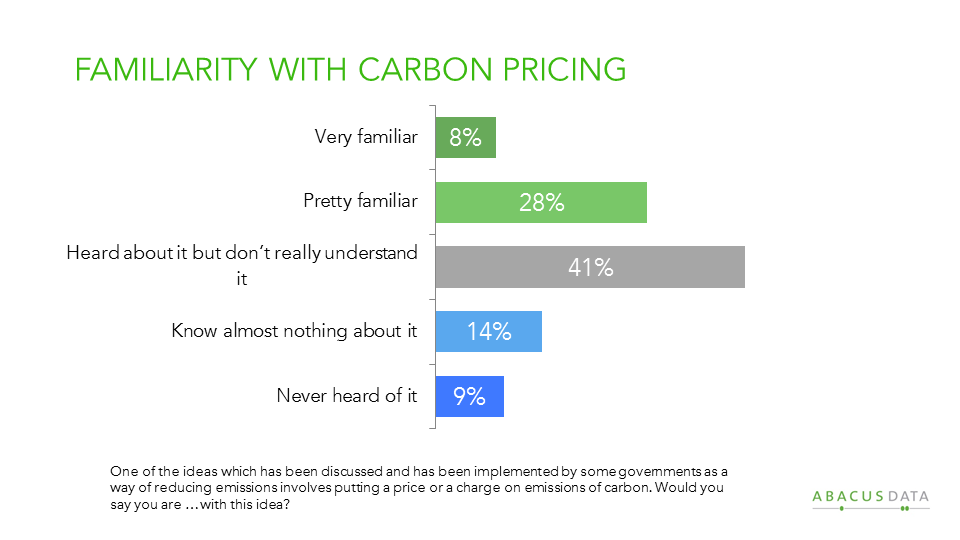
While the topic of carbon pricing has been a part of the policy discussion for a long time, it remains the case that many Canadians are not that familiar the idea.
Just over a third feel familiar with the idea but the plurality (41%) said they “have heard about it but don’t really understand it.
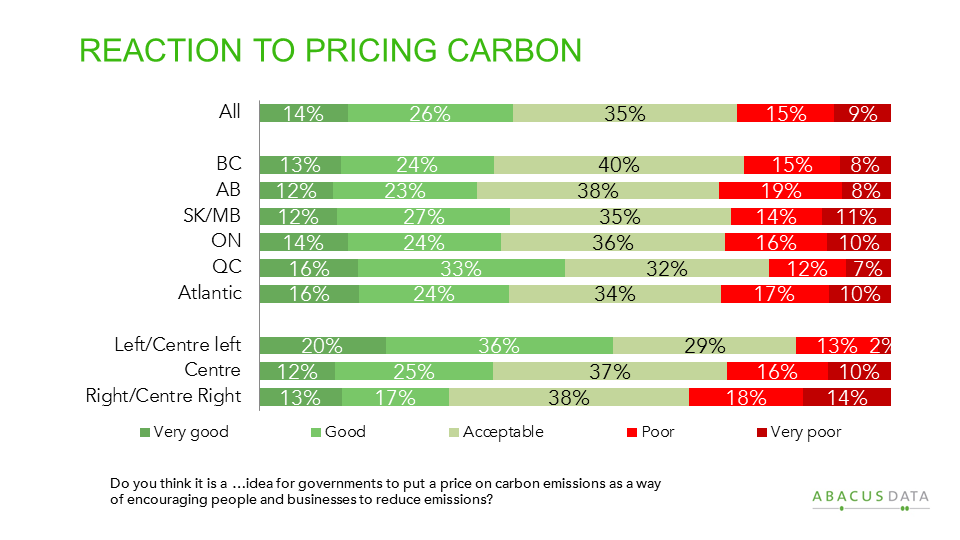
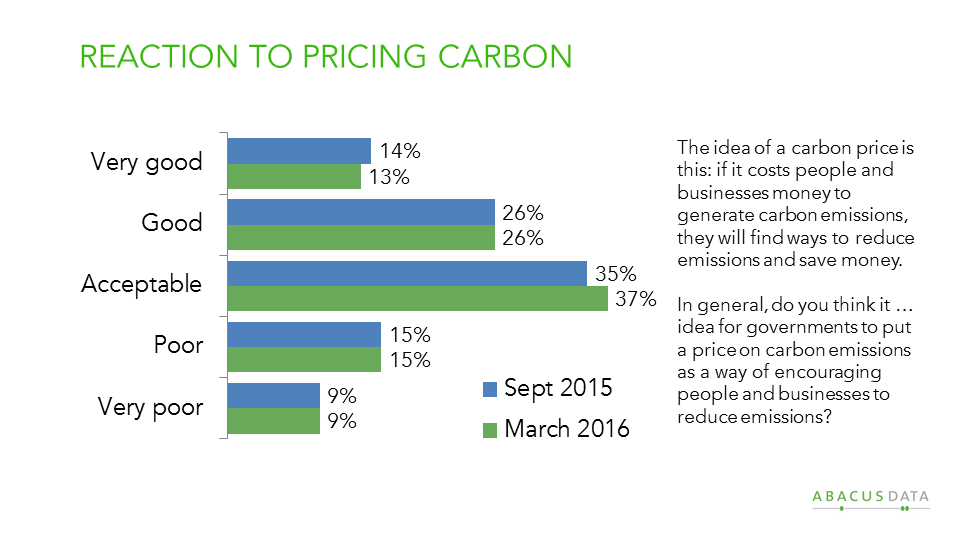
We provided respondents with a brief description of carbon pricing and the logic behind the policy, and then asked people for their reactions.
Three quarters of respondents (75%) believed it was at least an acceptable idea with 40% saying they thought it was a good idea. Only 24% said it was a poor or very poor idea.
Reactions varied slightly by regions with Quebecers being most enthusiastic. Notably, 63% of Albertans consider the idea acceptable or good. Those on the left of the spectrum were more likely to embrace the policy, but only 32% on the right reject it.
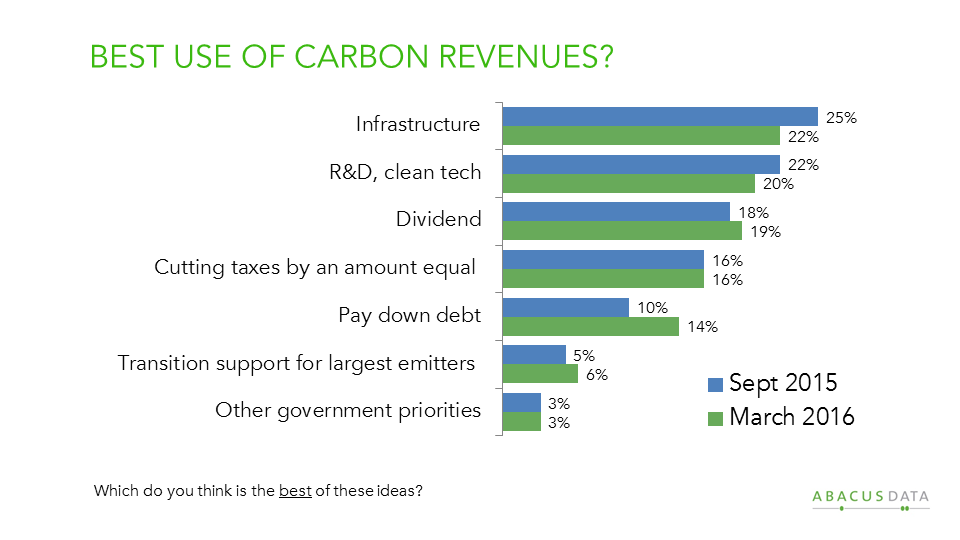
USES OF REVENUE FROM CARBON PRICING
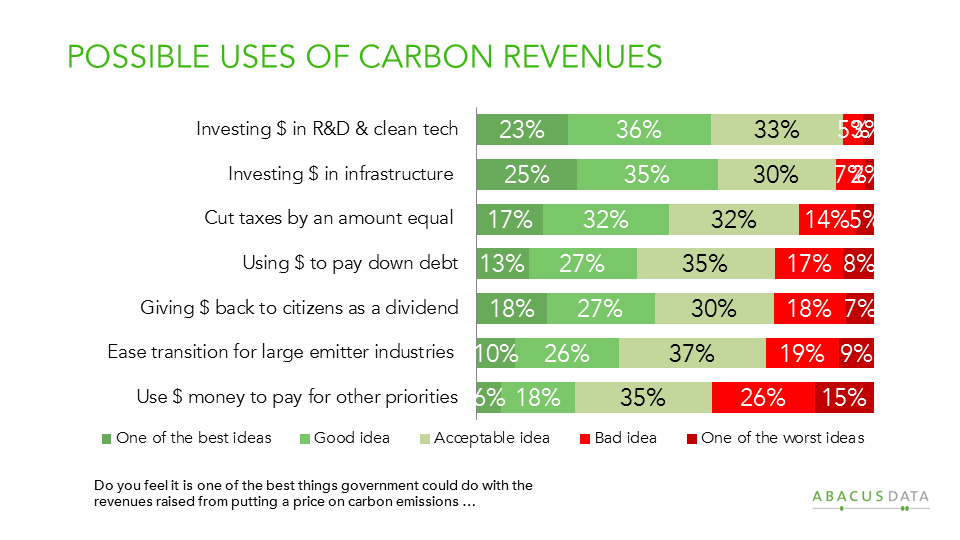
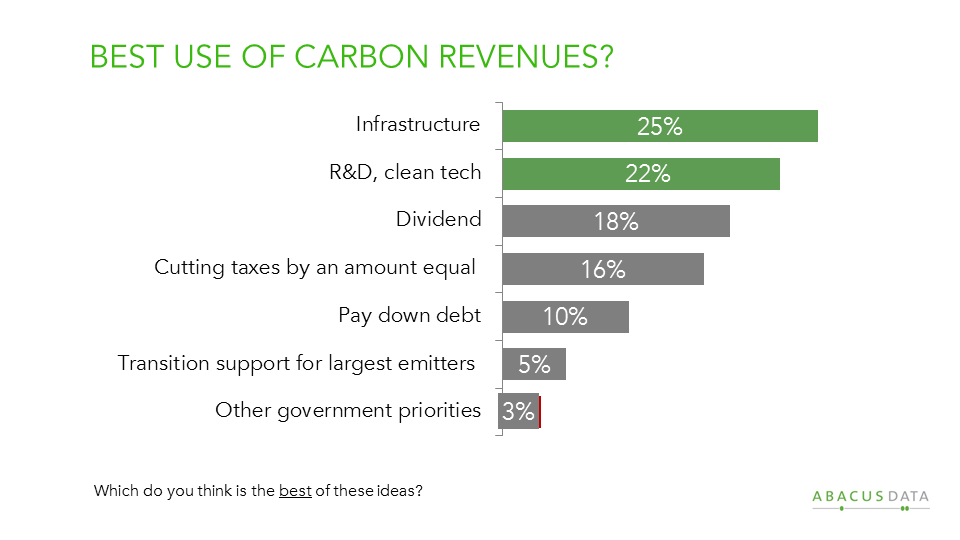
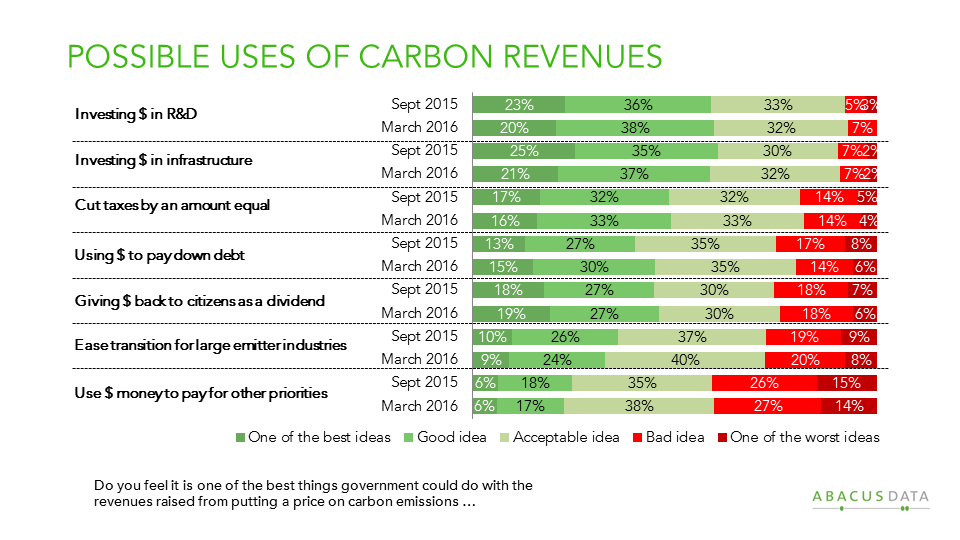
The primary objective of this study was to explore public attitudes towards the different ways revenue raised from pricing carbon could be used. Respondents were to react to 7 approaches:
• Investing in research and development and clean technologies. • Investing in infrastructure like public transit, rail networks, the electricity grid, roads and bridges. • Providing financial support to ease the transition for industries that are the largest emitters of greenhouse gases. • Cutting taxes by an amount equal to the amount raised • Giving the money back to citizens in the form of a dividend. • Using the money to pay down government debt. • Using the money to pay for other government priorities.
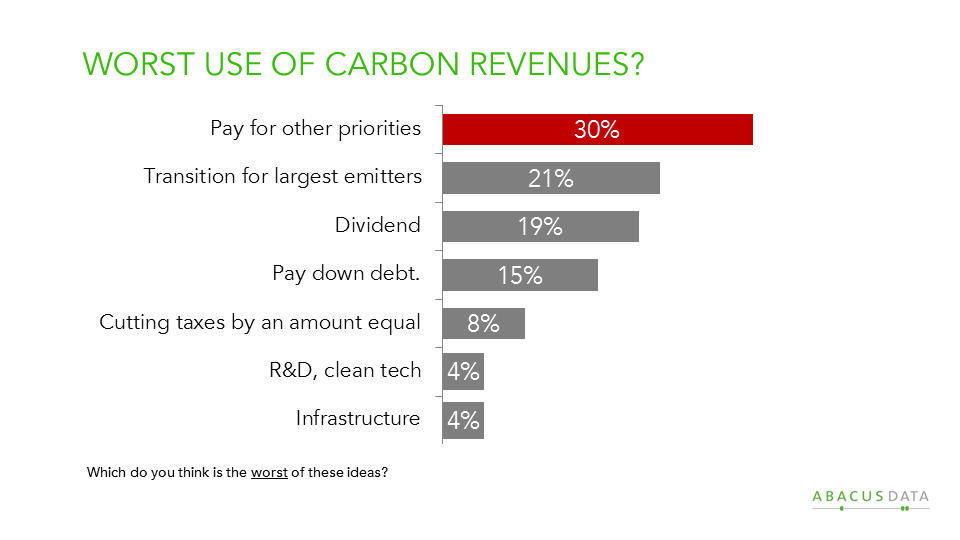
A majority of respondents said that all of these were at least acceptable ideas. However, some ideas generated more enthusiasm than others.
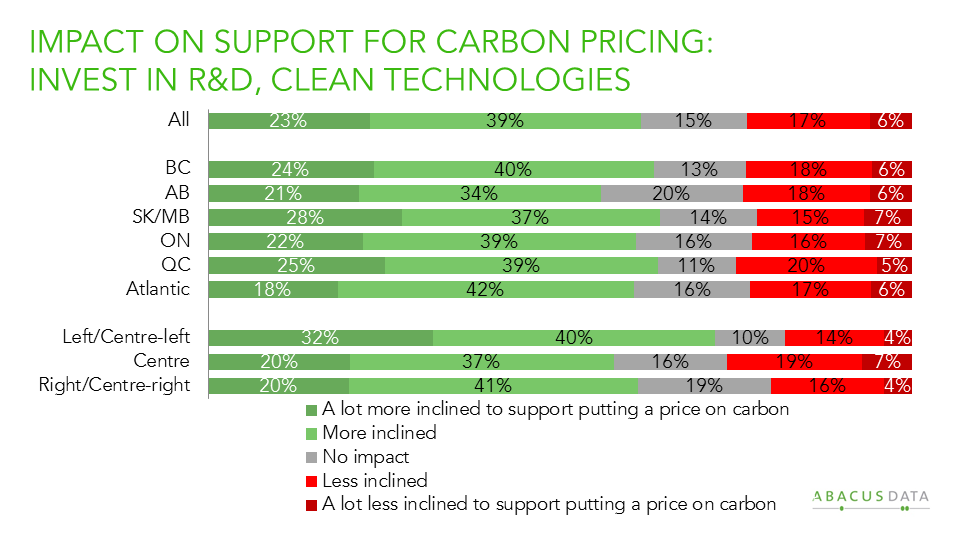
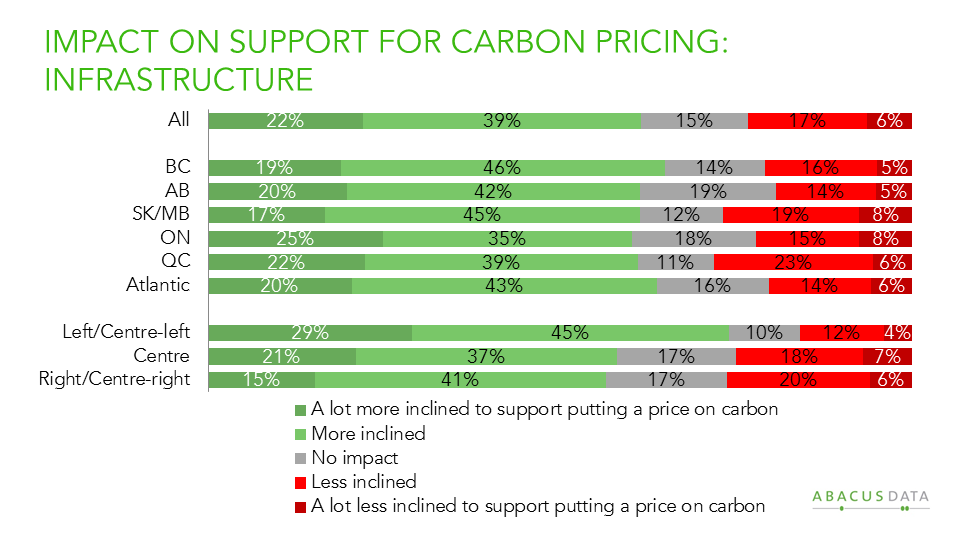
Investing in research and development in clean technology and in infrastructure like transit, rail, power grids, roads and bridges, were met with the strongest support, (roughly 90% acceptable or better) and very little resistance.
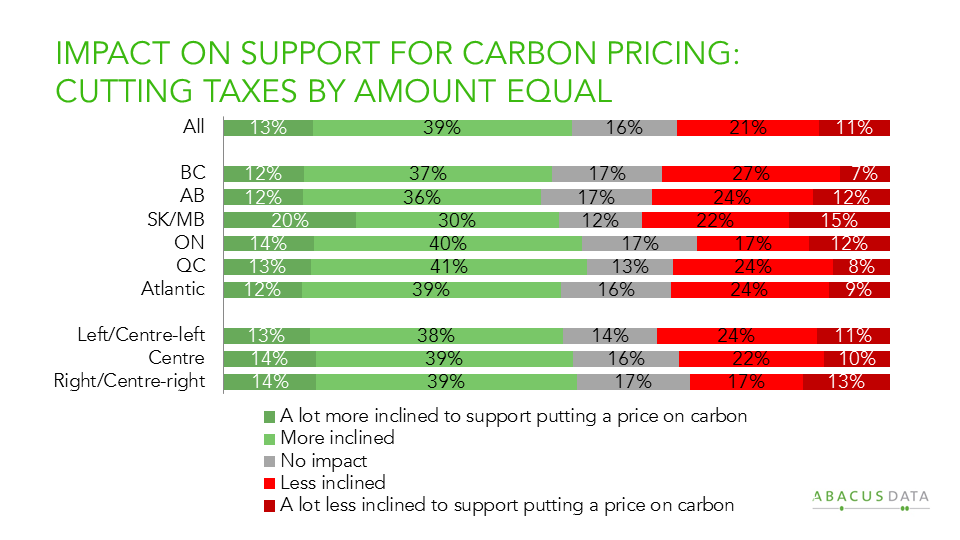
A large majority (81%) react positively to the idea of cutting taxes by an amount equal to amount raised
Fewer, but still substantial majorities consider acceptable the idea of using the money to pay down public debt, giving the money back to citizens in the form of a dividend or providing funding to help ease transition for large emitting industries. There was little resistance to each of these ideas.
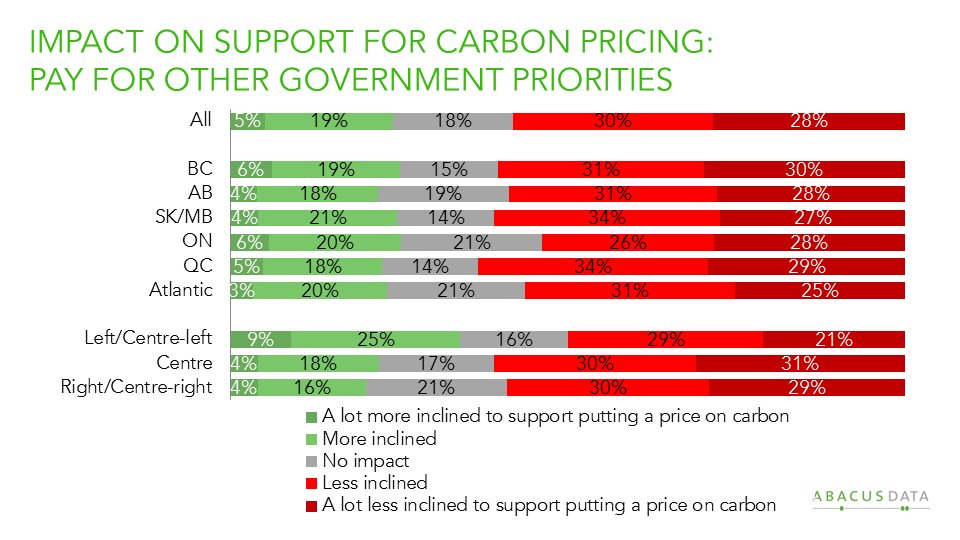
More hesitation was found for the idea that the revenue from carbon pricing be used to pay for other government priorities. Fully 41% believe it was a bad idea or one of the worst ideas.
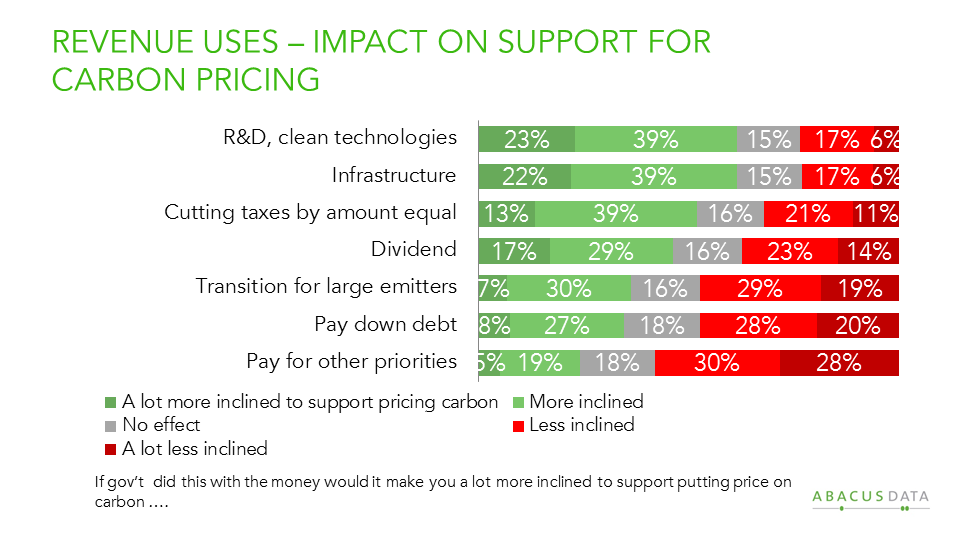
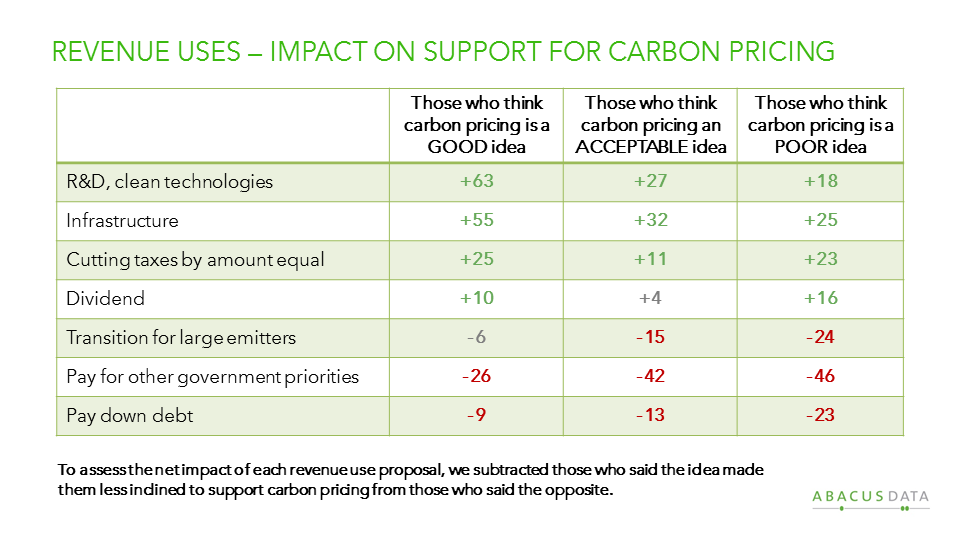
We also asked whether each alternative would make people more inclined or less inclined to support pricing carbon. Six in ten would be more inclined to support carbon pricing if the revenue was used to invest in research and development in clean technologies (62%) or in infrastructure (61%).
Cutting taxes by an amount equal to that raised by the carbon price also grows support with 52% saying they would be more inclined to support carbon pricing in that scenario.
The other options had more limited or mixed impacts on views about carbon pricing.
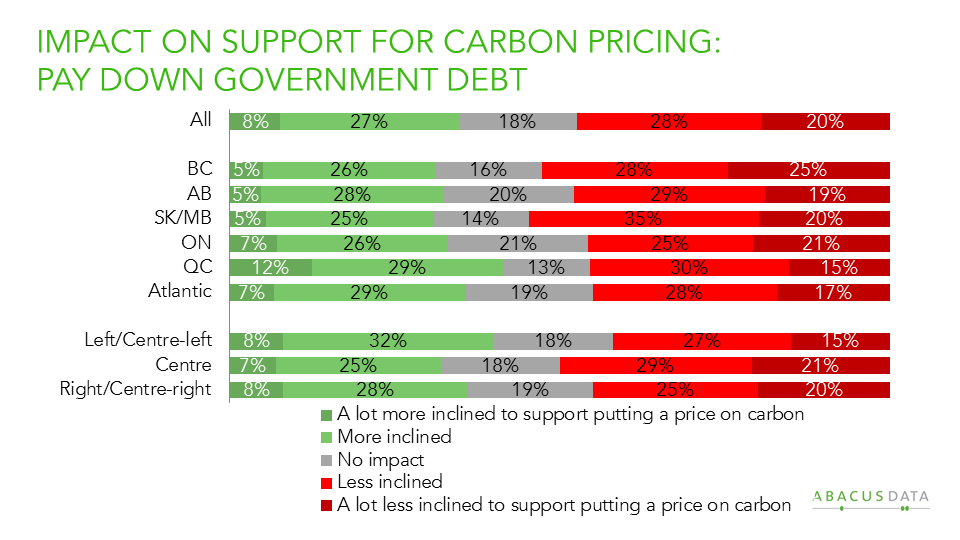
There was not a lot of variation across regional or ideological groups. However, a few are worth noting:
• Cutting taxes by an equivalent amount found similar levels of support in all regions and across the political spectrum. • Albertans were more hesitant about using carbon revenue to offer a dividend to residents, or to ease transition for heavy emitting sectors. • Infrastructure was a particularly strong draw for those on the left.
We examined the impact of each of these ideas for use of the revenue by those who initially said they liked, found acceptable, or disliked the idea of carbon pricing.
The results reveal that 3 of the 7 approaches tested have particularly good potential to strengthen support for the policy idea. The three are: investing in R&D, clean technologies, infrastructure and ensuring that the carbon tax revenue is returned in the form of equivalent tax cuts.
CONCLUSIONS
Many Canadians want to see governments take more steps to reduce carbon emissions and the tendency is to think that carbon pricing can be a useful part of the policy mix.
At the same time, it is clear that many people are only lightly familiar with the way carbon pricing would affect them and the economy and their views on this policy option should be understood as soft and somewhat qualified.
People express some clear inclinations when it comes to the treatment of carbon revenues: they are more enthusiastic about investments in new infrastructure and clean technologies and less comfortable with the idea that monies raised would simply flow to general government revenues without any prescribed uses, or linkage to the emissions reduction intent.
Ideas like tax neutrality and revenue recycling helps build support for carbon pricing, an effect which is evident in all parts of the country and across the left, centre and right of the political spectrum.
METHODOLOGY
The survey was conducted online with 2,200 adult Canadians from September 25 to 29, 2015. A random sample of panelists was invited to complete the survey from a large representative panel of over 500,000 Canadians.
The Marketing Research and Intelligence Association policy limits statements about margins of sampling error for most online surveys. The margin of error for a comparable probability-based random sample of the same size is +/- 2.1%, 19 times out of 20. The data were weighted according to census data to ensure that the sample matched Canada’s population according to age, gender, educational attainment, and region. Totals may not add up to 100 due to rounding.
ABACUS DATA
We offer global research capacity with a strong focus on customer service, attention to detail and value added insight. Our team combines the experience of our Chairman Bruce Anderson, one of Canada’s leading research executives for two decades, with the energy, creativity and research expertise of CEO David Coletto, PhD.
APPENDIX
To assess the impact of the passage of time and events that occurred from September 2015 to today, we asked a number of the same questions on the March 2016 edition of our national omnibus survey.
The survey interviewed a nationally representative sample of 1,500 Canadian adults from March 16 to 18, 2016 from a large representative panel of over 500,000 Canadians.
Overall, the responses to the questions we re-asked in March 2016 were very similar and mostly within the expected margin of error of the two surveys.
The charts below compare results from the two periods:
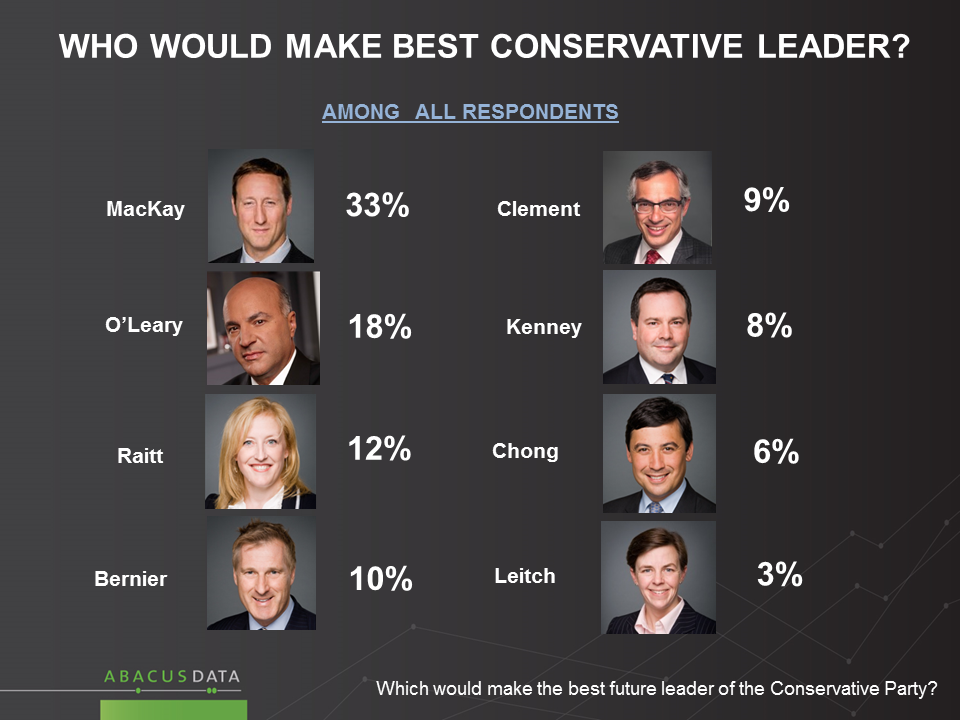
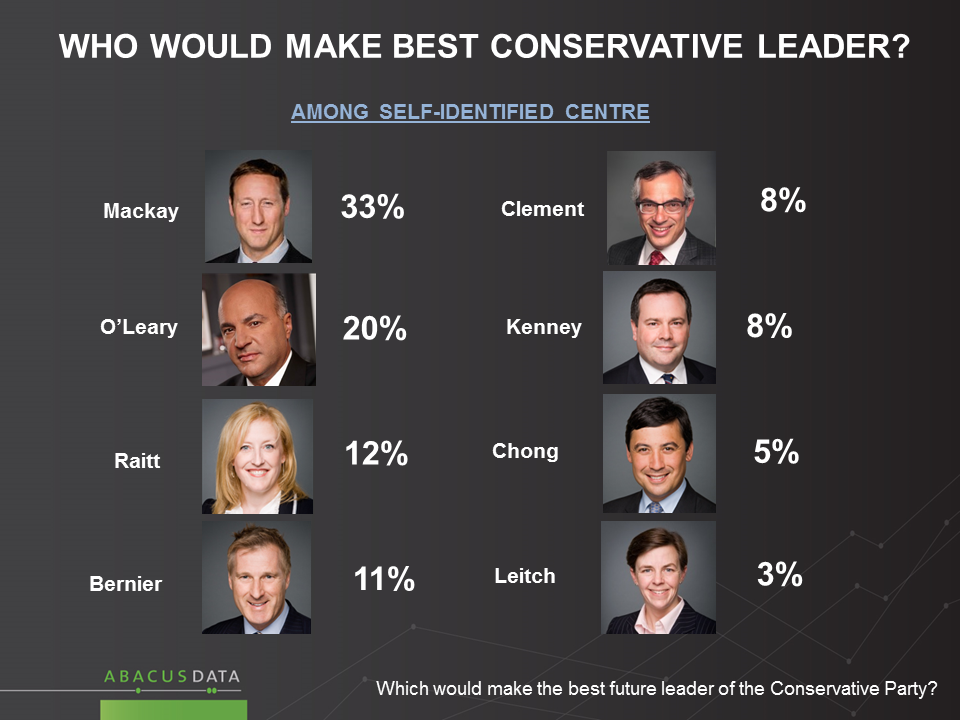
In our latest poll we asked people which of 8 possible candidates for the leadership of the Conservative Party of Canada they think would make the best choice.
Here are the highlights of our findings:
• Peter MacKay leads this field by 15 points, at 33% followed by Kevin O’Leary at 18%, Lisa Raitt at 12%, and Maxime Bernier at 10%. Tony Clement (9%), Jason Kenney (8%), Michael Chong (6%), and Kellie Leitch (3%) round out the field with less than 10% support.
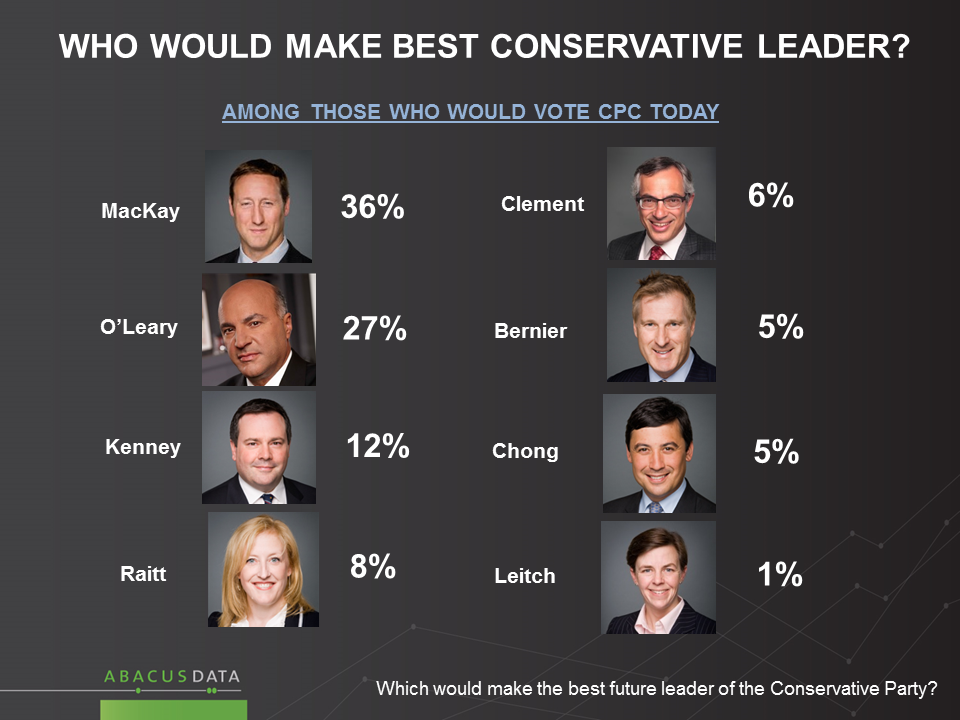
• Among those who say they would vote Conservative today, Mr. MacKay’s lead over Mr. O’Leary shrinks to 9-points and Jason Kenney jumps to third place at 12%. All the other candidates are in single digits.
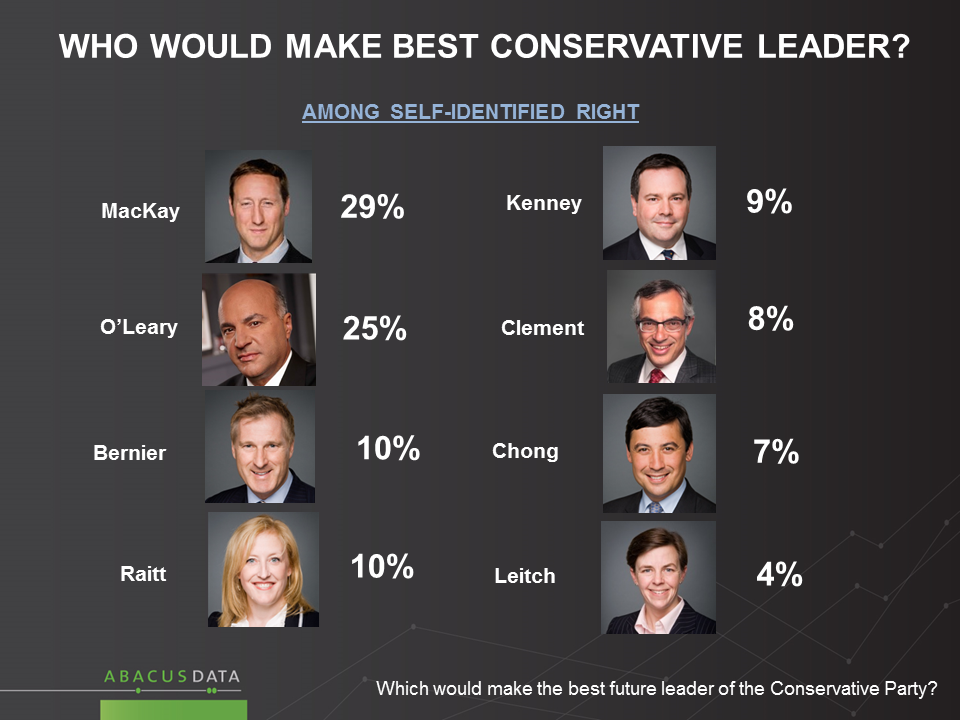
• Among voters who self describe as “right” on the political spectrum, MacKay (29%) and O’Leary (25%) are neck and neck with Bernier (10%) and Raitt (10%) cracking double digits.
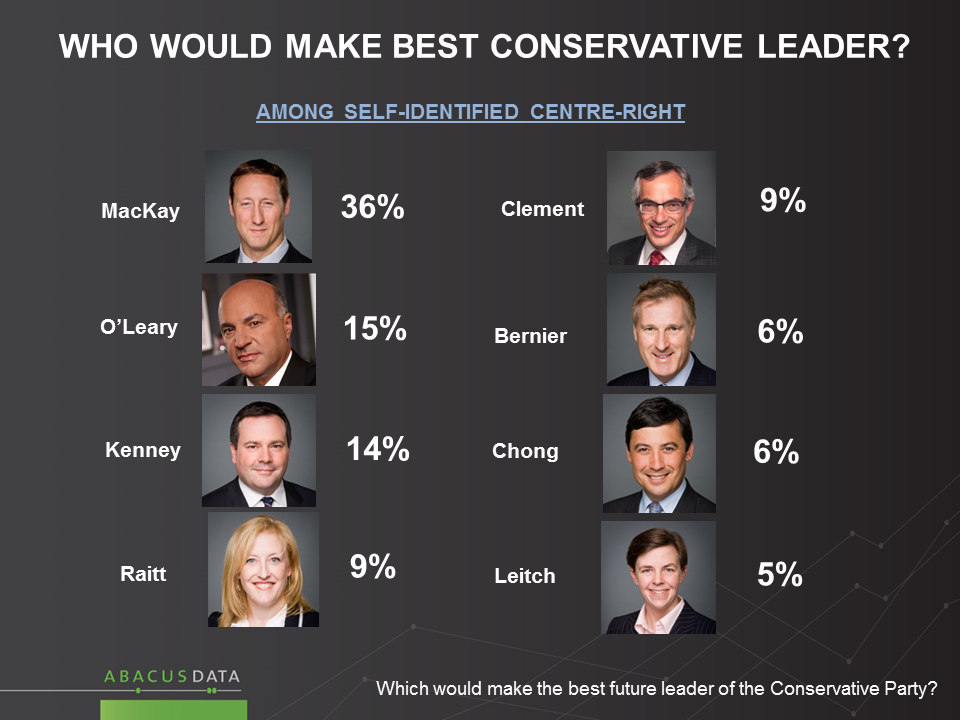
• Among those who self-identify as “centre-right”, the results are MacKay 36%, O’Leary drops back to 15%, followed by Kenney 14% and Raitt and Clement at 9%.
• Among those who self-identify as “centre”, the results are MacKay 33%, O’Leary 20%, followed by Raitt at 12%, Bernier at 11% and Clement and Kenney at 8%.
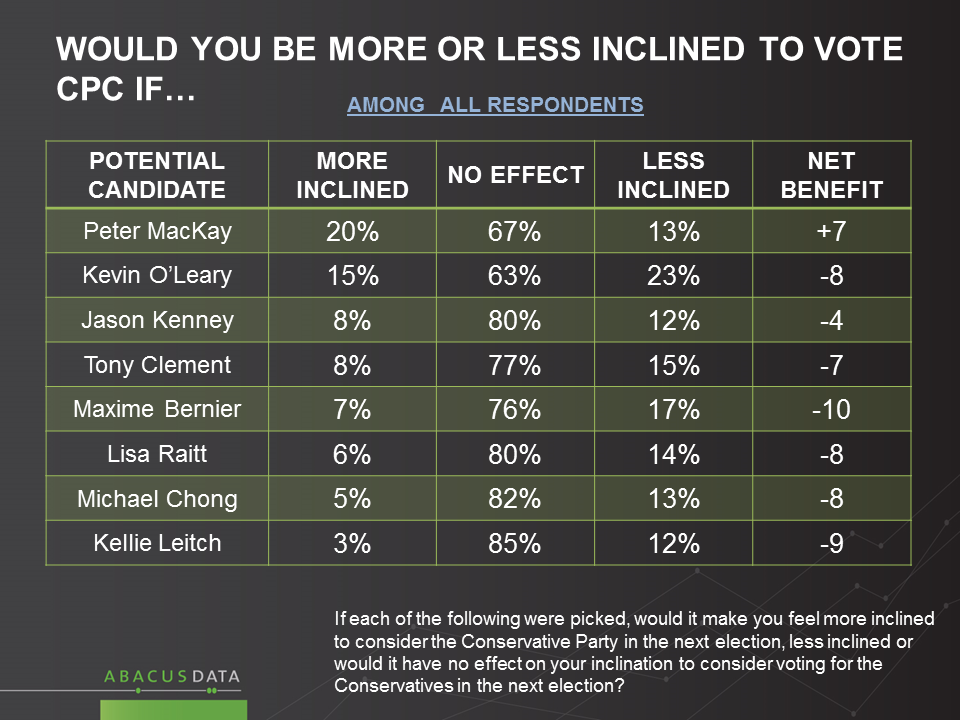
We also asked whether the choice of any of these candidates would make people more or less likely to vote Conservative.
Here’s what we found:
• Among all respondents, only Peter MacKay had a net positive effect on Conservative support – that is more people said they would be more inclined to vote Conservative (20%) than those saying less inclined (13%). Kevin O’Leary had the second largest percentage of Canadians saying they would be more inclined to vote Conservative if he was leader (15%) but also the highest number saying they would be less inclined (23%).
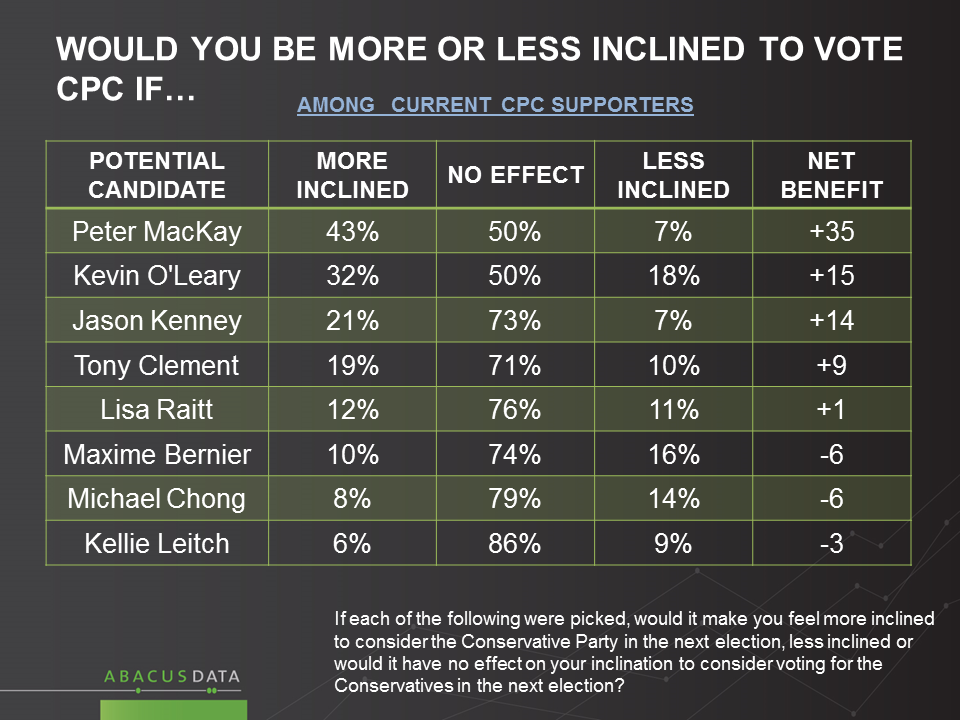
• Among current Conservative supporters, all candidates except for Maxime Bernier, Michael Chong, and Kellie Leitch would have a net positive impact on support for the party. O’Leary is the most polarizing potential candidate – pulling 32% but pushing 18%.
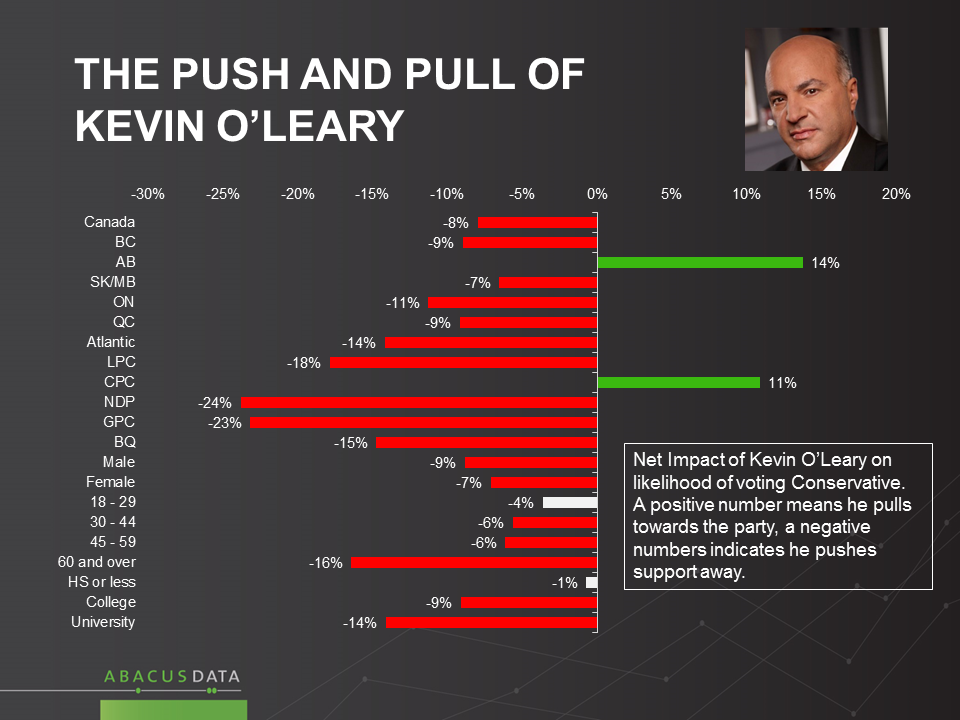
The Push and Pull of Kevin O’Leary
We looked specifically at the potential impact Kevin O’Leary would have on likelihood to vote Conservative.
Overall, he has a net negative impact (that is more people say they would be less likely to vote Conservative than more likely to) with every demographic, political, and regional group except for past Conservative voters and Albertans.
The Upshot
Peter MacKay has strong name recognition and a considerable level of public support, although a number of other candidates would likely start with a critical mass of support, making for a competitive race.
The patterns show that within the Conservative Party there will be some drawn towards the candidate who has the most pronounced small c conservative views, while others will be attracted to a more moderate style of conservatism. These tensions will likely only start to play out once some candidates begin to declare an intention to run, and stake their claim to a place as “tent expanders” or “base rallyers”
If Kevin O’Leary decides to enter the fray, these results suggest he has the potential to be a somewhat polarizing force. Choosing Mr. O’Leary as leader would appeal to some of the most conservative party members, but would mean making the process of broadening the party’s appeal more difficult, not easier, at least initially.
Methodology
Our survey was conducted online with 1,500 Canadians aged 18 and over from March 16 to 18, 2016. A random sample of panelists was invited to complete the survey from a large representative panel of over 500,000 Canadians.
The Marketing Research and Intelligence Association policy limits statements about margins of sampling error for most online surveys. The margin of error for a comparable probability-based random sample of the same size is +/- 2.6%, 19 times out of 20. The data were weighted according to census data to ensure that the sample matched Canada’s population according to age, gender, educational attainment, and region. Totals may not add up to 100 due to rounding.
Abacus Data Inc.
We offer global research capacity with a strong focus on customer service, attention to detail and value added insight. Our team combines the experience of our Chairman Bruce Anderson, one of Canada’s leading research executives for two decades, with the energy, creativity and research expertise of CEO David Coletto, PhD.
The following are findings from a national survey of 1,500 Canadian adults conducted by Abacus Data and commissioned by EY.
In the federal election last fall, voters wanted change in Ottawa, and judging from the reactions to the first federal budget delivered by Finance Minister Bill Morneau, many believe that’s what they got.
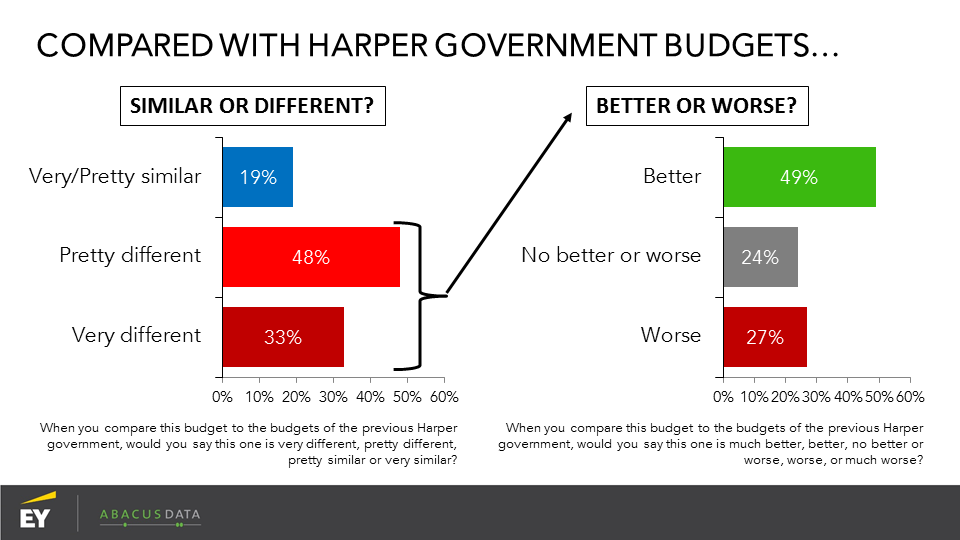
74% had some familiarity with the budget, and of them, 81% said it was different from those delivered by Stephen Harper’s government.
Among those who saw a difference, 49% said it was an improvement, compared to only 27% who said it was a change for the worse.
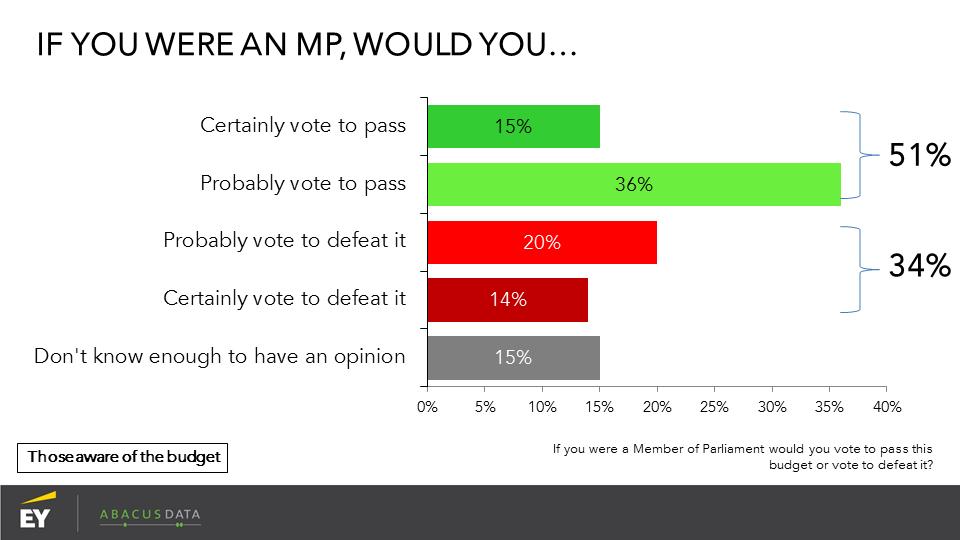
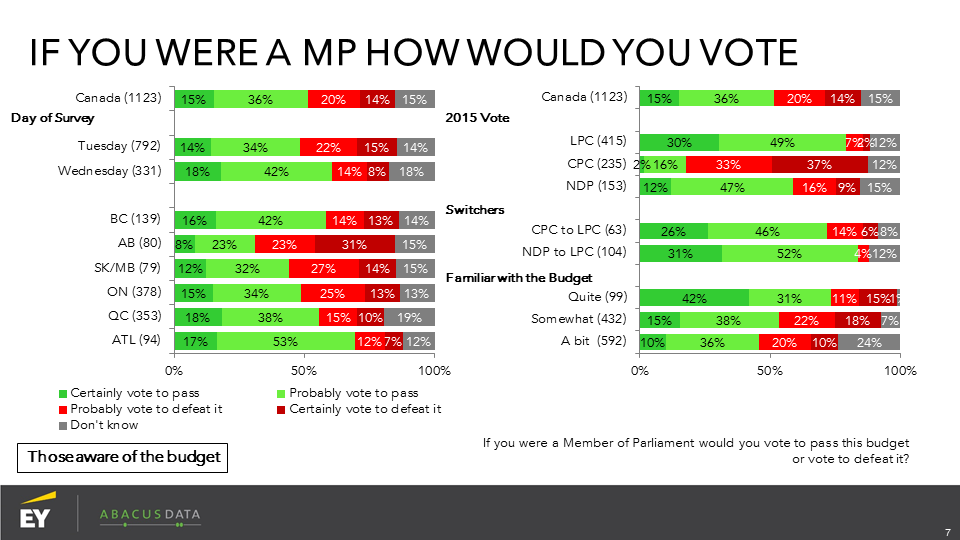
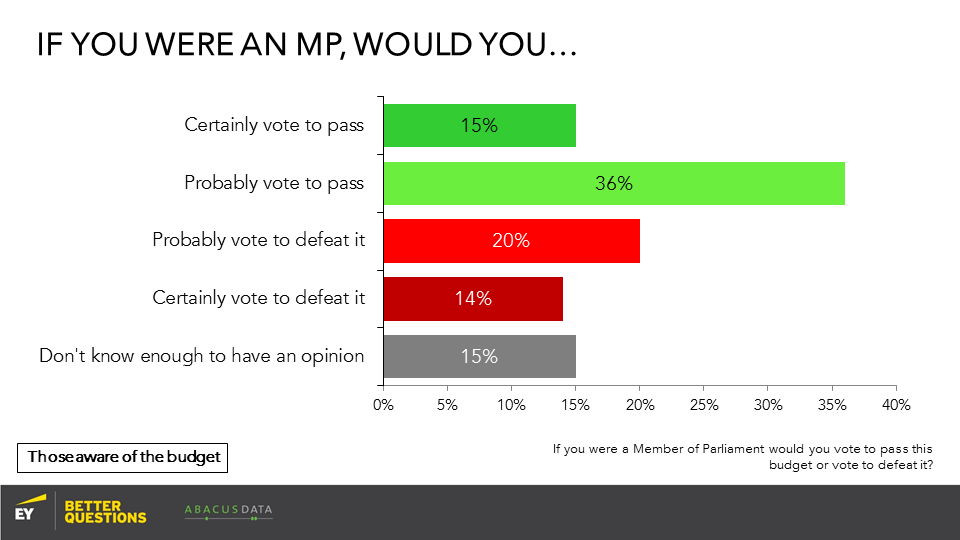
Asked how they would vote on this budget if they were a Member of Parliament, 51% would support the budget, compared to 34% who would oppose. Our survey was conducted over two days, and the proportion who say they would vote “yes” increased from 48% on Tuesday evening to 60% among the Wednesday morning sample. The majority of Liberal and NDP voters would pass the budget while 70% of Conservative voters would vote no.
The generally positive response to the budget was based on a mixture of feelings. While 54% said it would have a negative impact on the country’s indebtedness, there were positive feelings about how the budget would impact infrastructure, the middle class, and opportunities for young Canadians. 30% said it would be good for short term job growth, compared to 18% who said it would be bad. 19% said it would be good for their tax levels, while 29% said it would be bad.
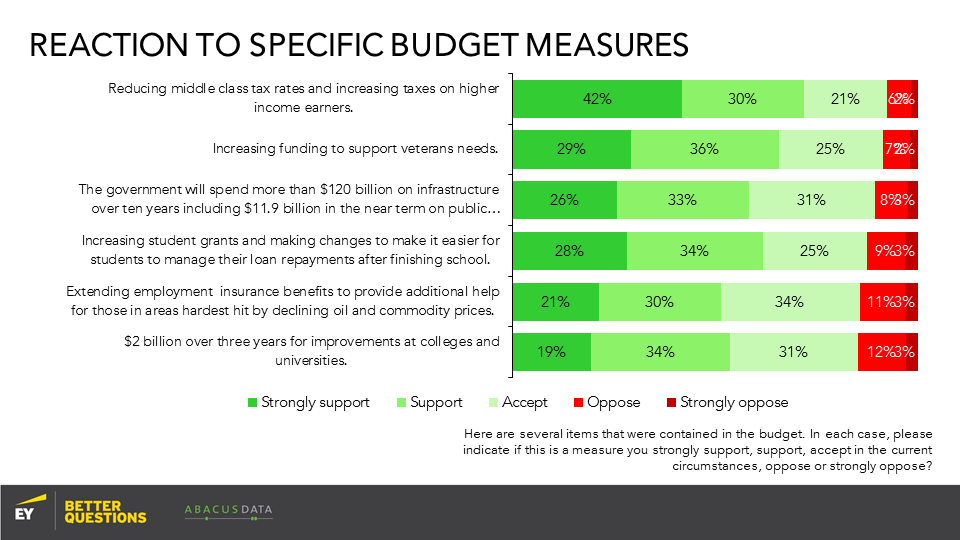
REACTION TO BUDGET MEASURES
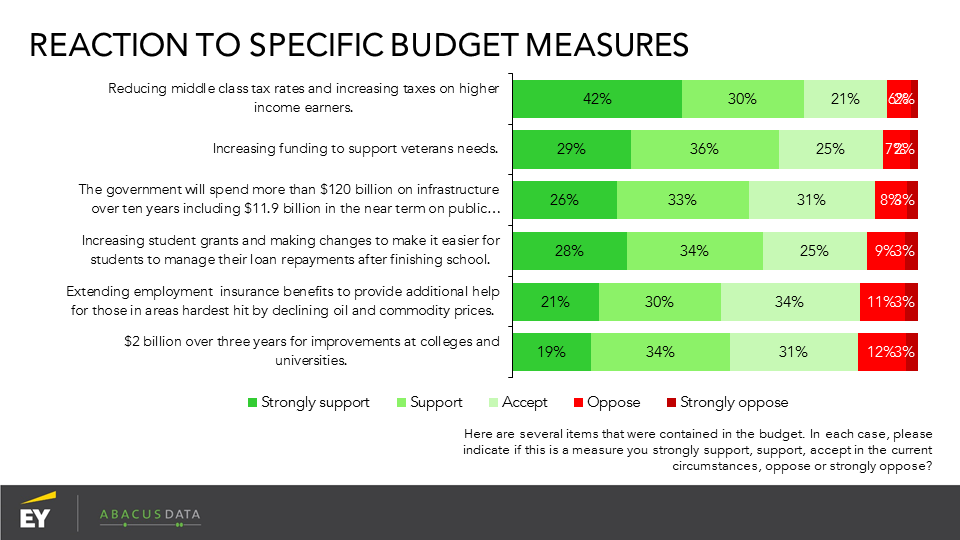
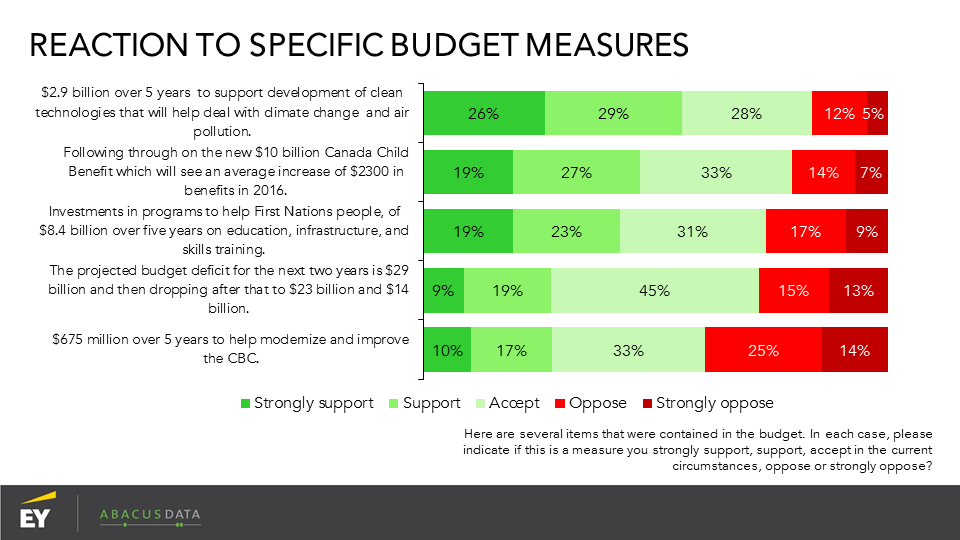
We described 11 of the measures in the budget and asked people for their reactions. On all 11, majorities said they found the choices the government made acceptable or better. Most popular were steps to reduce taxes for the middle class while hiking them on higher earners, increasing funding for veterans, putting money into infrastructure and greater support for students.
The least popular item was the provision of $675 Million to the CBC over 5 years.
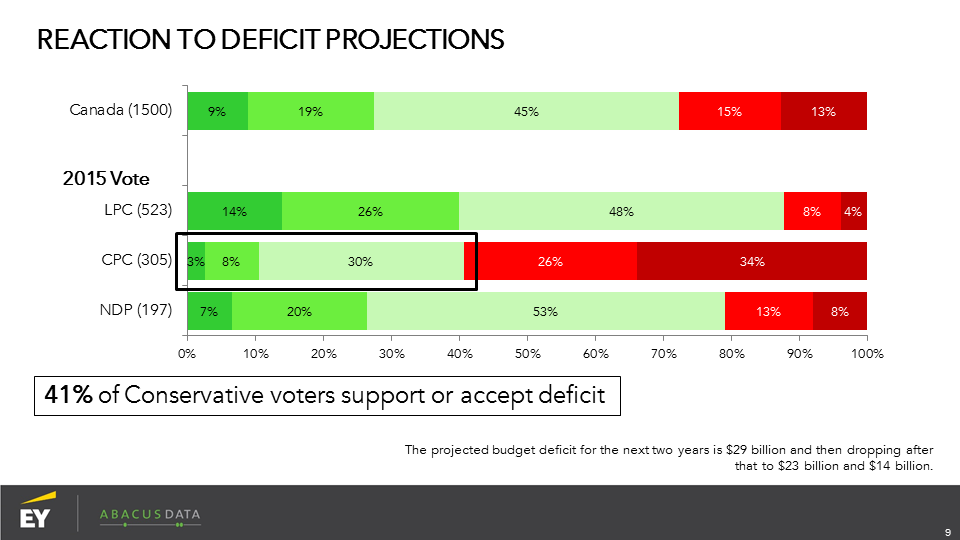
We noted that the government announced the deficit would be $29 billion for each of the next two years, dropping to $23 billion, and then $14 billion. 28% said they supported this decision by the government to expand the deficit, 45% said they could accept it under the circumstances, while 28% were opposed.
Only 12% of Liberal and 21% of NDP supporters opposed the fiscal choice that the government made. Perhaps more notable is the fact that Conservative voters were somewhat split, with 41% saying that they accepted or supported the government’s fiscal plan, and 60% opposing.
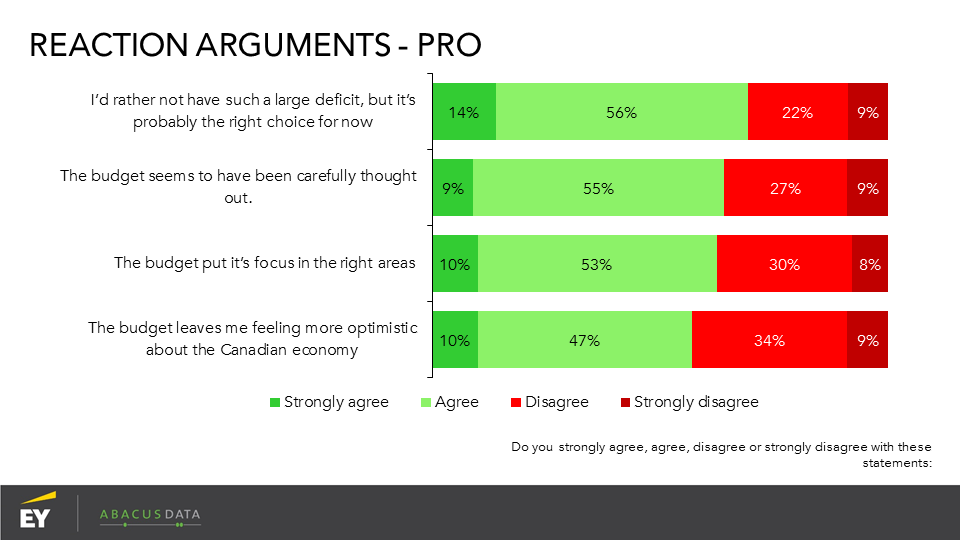
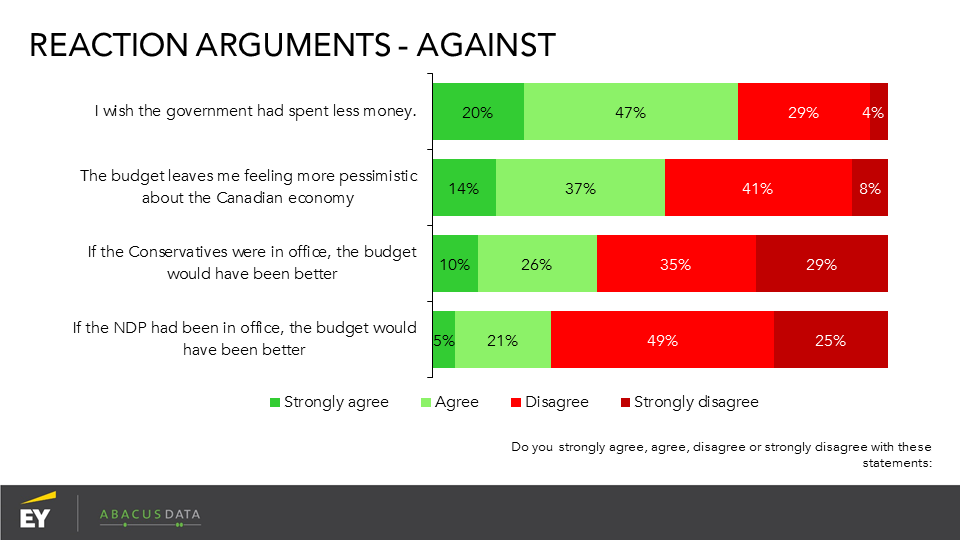
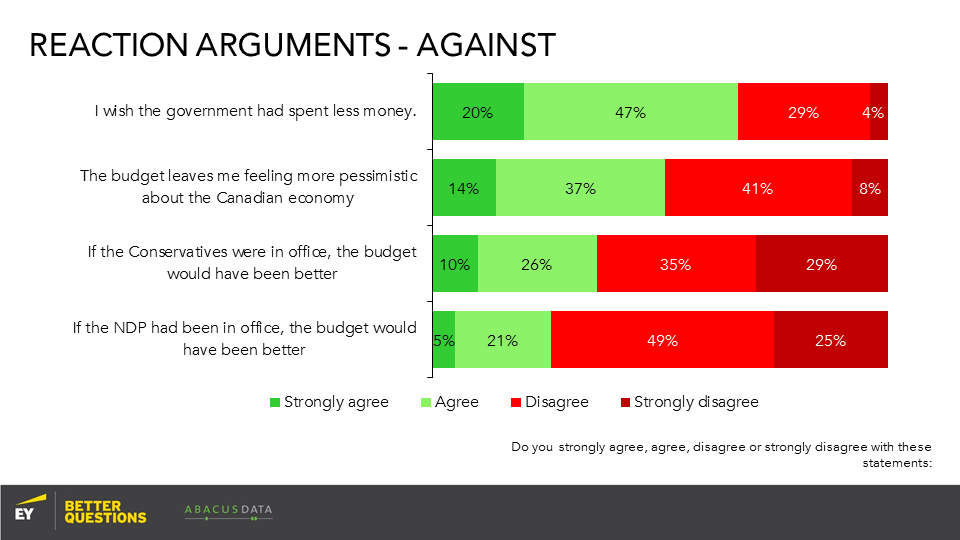
The consensus of Canadians seemed to be that while many wished the government had spent less money (67% agree), even more people felt that while they “would rather not have such a large deficit, it’s probably the right choice for now”. (70% agree).
Overall, 64% said they felt that the budget seemed well thought out, 63% agreed it focuses on the right priorities, and 57% said it left them feeling more optimistic about the economy.
IMPACT ON VOTE INTENTION?
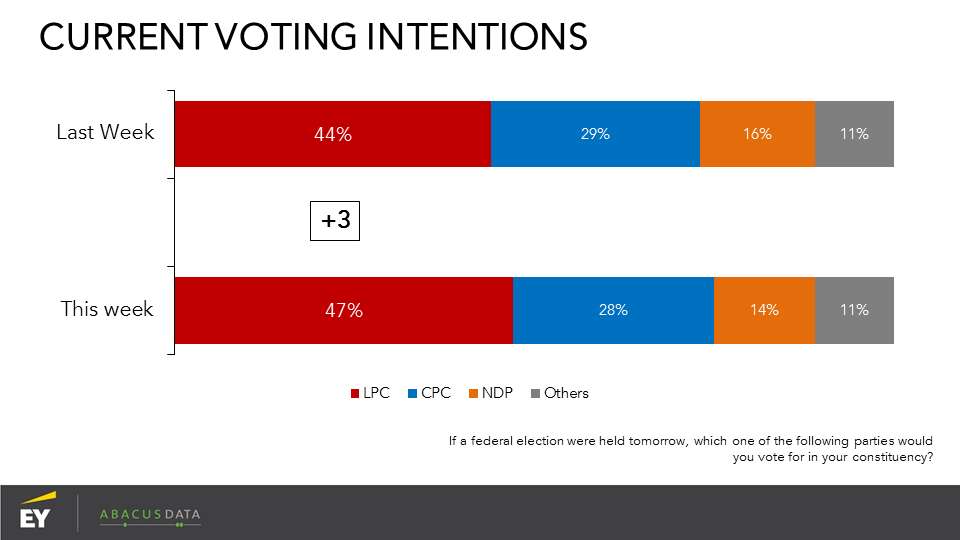
We asked people their voting intention last week, pre-budget, and again in this post budget survey. The numbers show little change, possibly a modest improvement for the Liberals.
THE UPSHOT
According to Abacus Chairman Bruce Anderson, “Most people seem to feel they got the budget they expected from this government. They saw a shift in priorities including a focus on the middle class, infrastructure, young people and education. The deficit is larger than was promised but most have concluded that this was acceptable given the circumstances.
Obviously, time and outcomes will determine if Canadians continue to feel the government is making headway on the right priorities and maintaining sufficient financial discipline, but for the time being, this first Budget, a big test for any new government, was a successful start for Mr. Trudeau and his Cabinet.”
NOTE FROM GARY ZED AT EY
“Canada faces big challenges and has great opportunities. The policy choices our governments make carry large consequences,” said Gary Zed, Managing Partner of EY’s Ottawa office.
“EY is pleased to launch this first in a series of conversations about some of the bigger topics our elected and public service officials will be dealing with in the months and years ahead — and the impacts those issues have on Canadian businesses. By asking better questions and having meaningful dialogue, we get better results, and foster a better working world.”
METHODOLOGY
Our survey was conducted online with 1,500 adult Canadians from 6:30pm ET March 22 to 12:00pm ET March 23, 2016. A random sample of panelists was invited to complete the survey from a large representative panel of over 500,000 Canadians.
The Marketing Research and Intelligence Association policy limits statements about margins of sampling error for most online surveys. The margin of error for a comparable probability-based random sample of the same size is +/- 2.6%, 19 times out of 20.
The data were weighted according to census data to ensure that the sample matched Canada’s population according to age, gender, educational attainment, and region. Totals may not add up to 100 due to rounding.
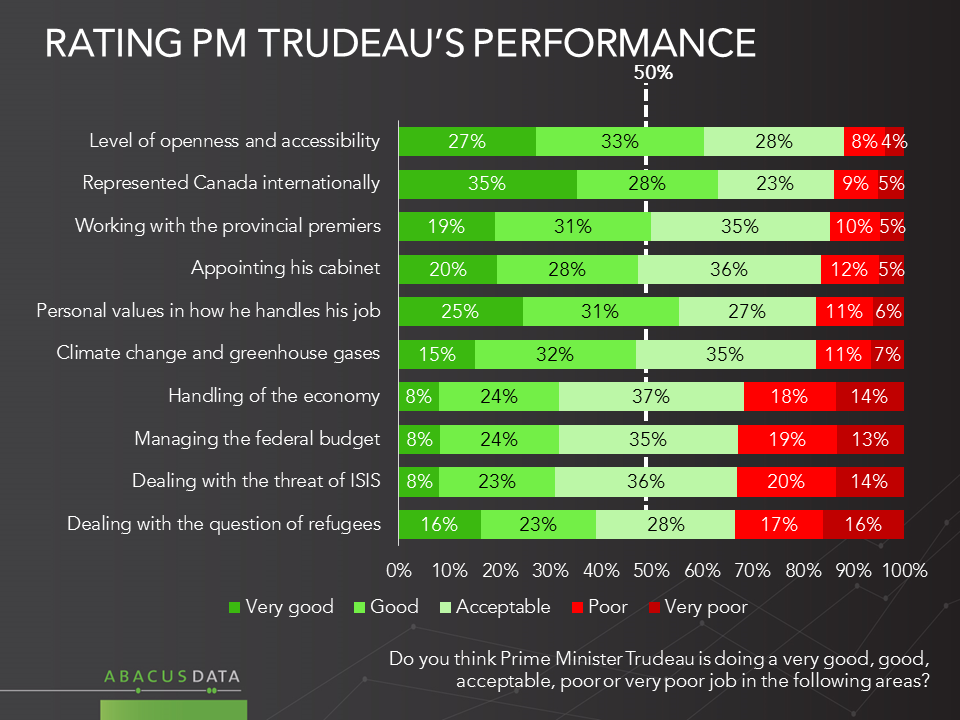
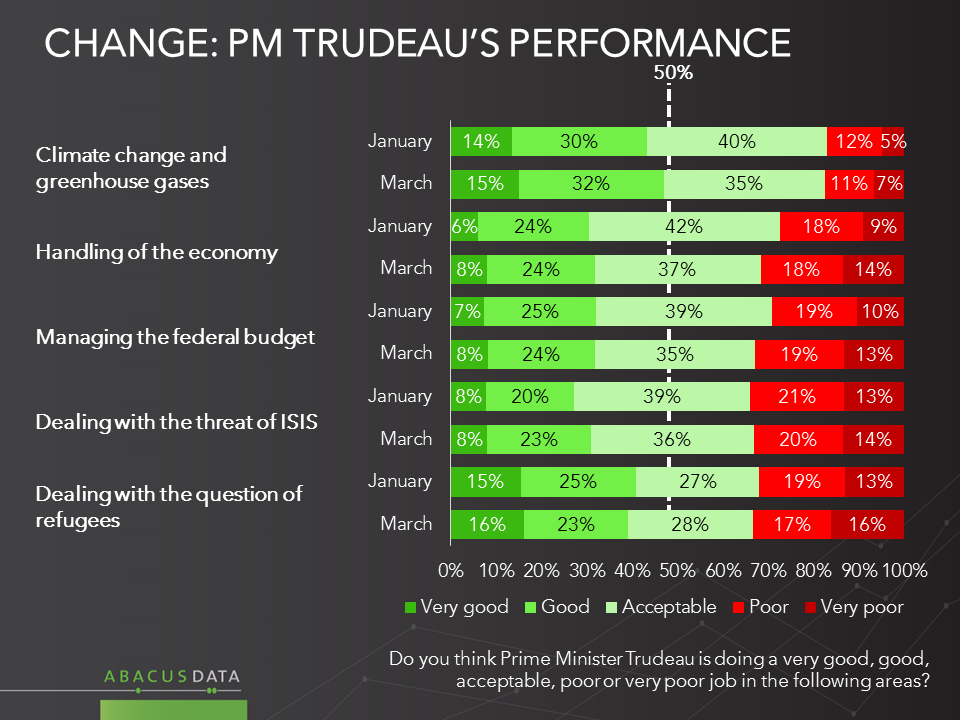
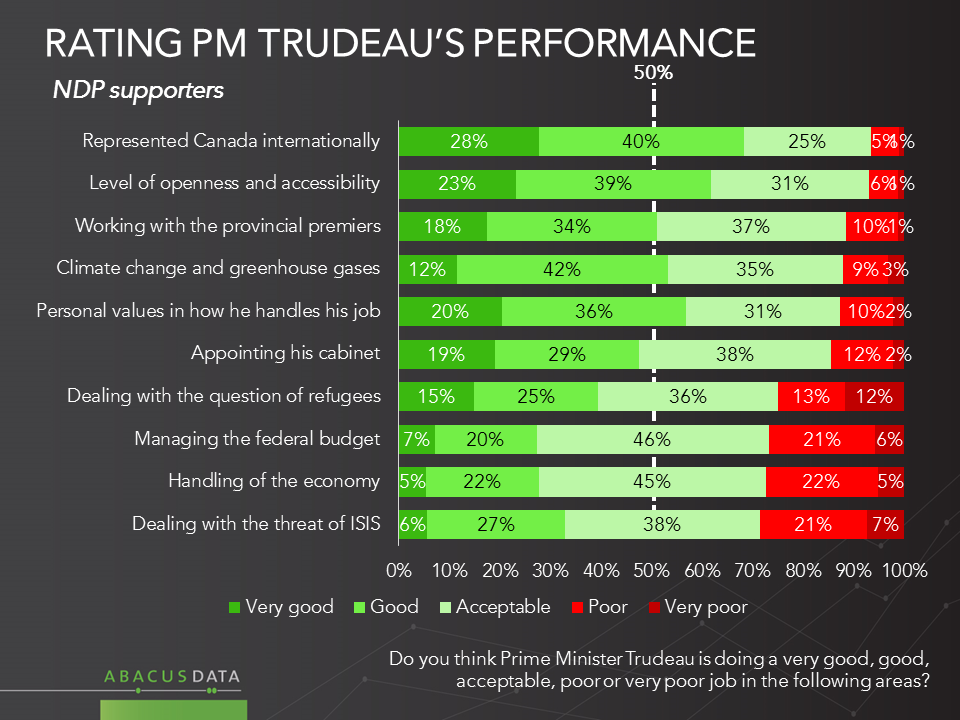
A majority of Canadians give Prime Minister Justin Trudeau an acceptable or better performance on 10 out of 10 items measured in our detailed report card. Only a third of those surveyed offer poor assessments on any items, and on 6 of the 10 items the level of “poor job” numbers doesn’t exceed 18%.
The results, in detail, reveal:
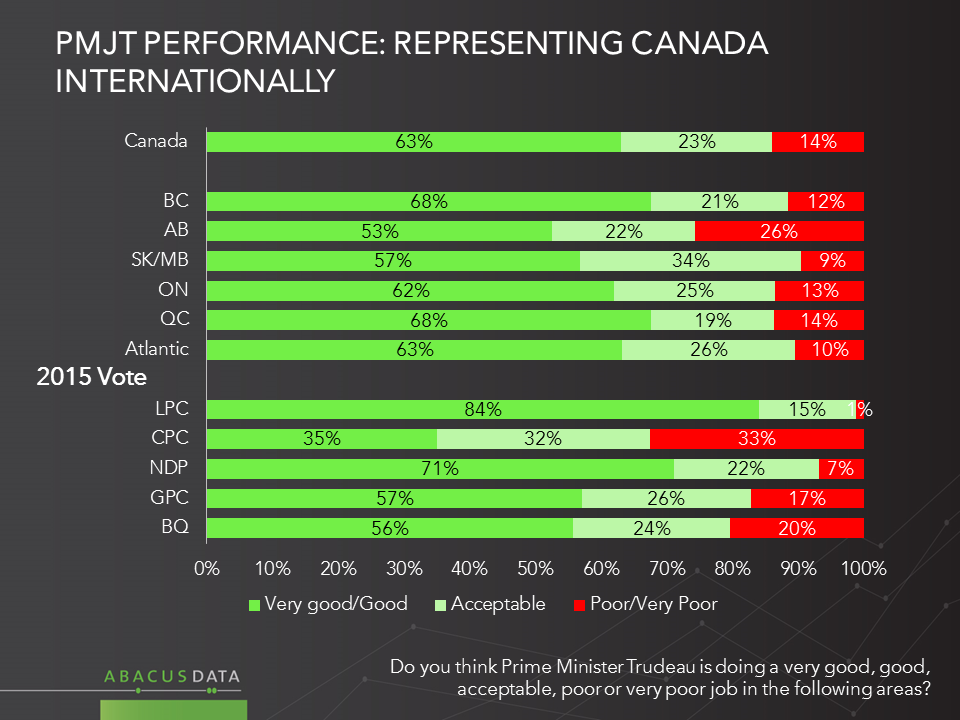
• The best results for the PM are for how he represents Canada internationally (86% acceptable or better), his “level of openness and accountability” (88%), and his personal values in how he approaches the job (83%)
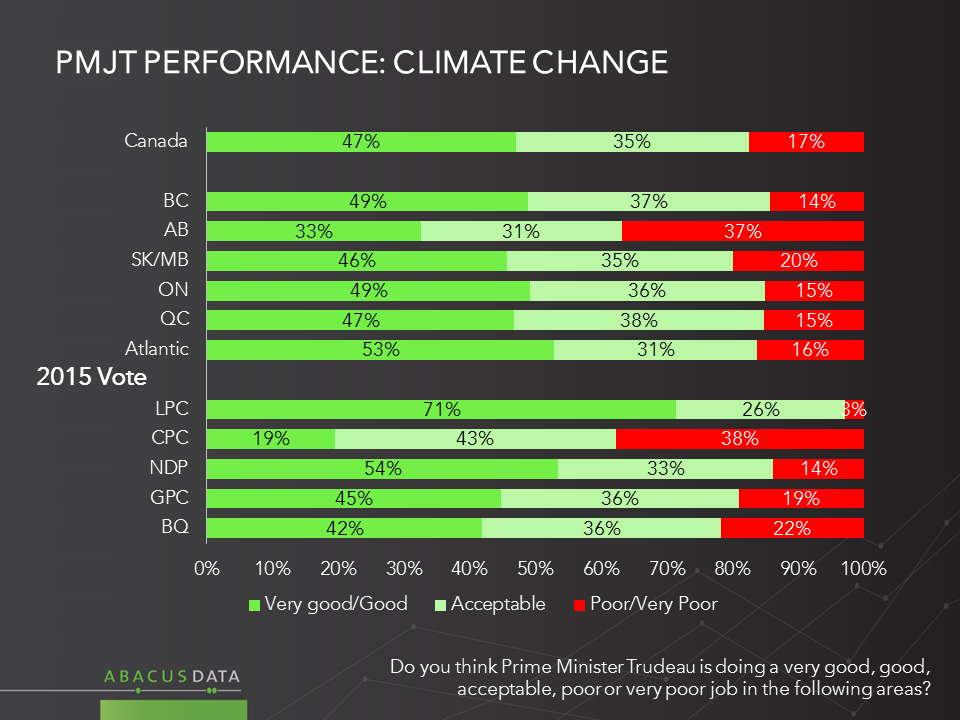
• Very large majorities also provide acceptable or better ratings for his approach to working with the provincial premiers, his Cabinet selections, and his approach to climate change and greenhouse gases.
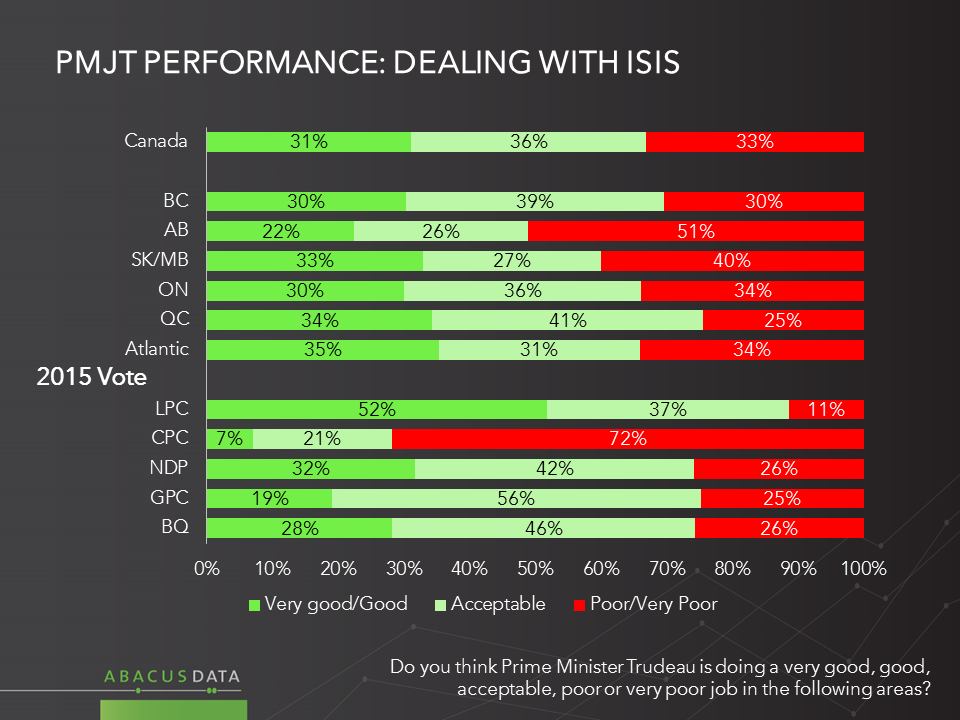
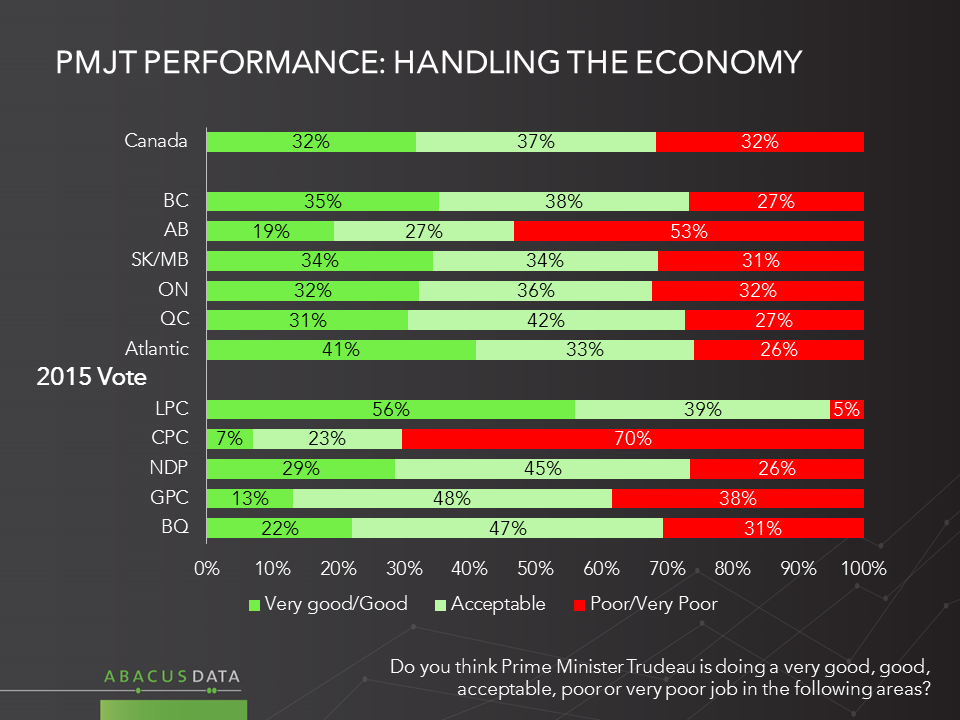
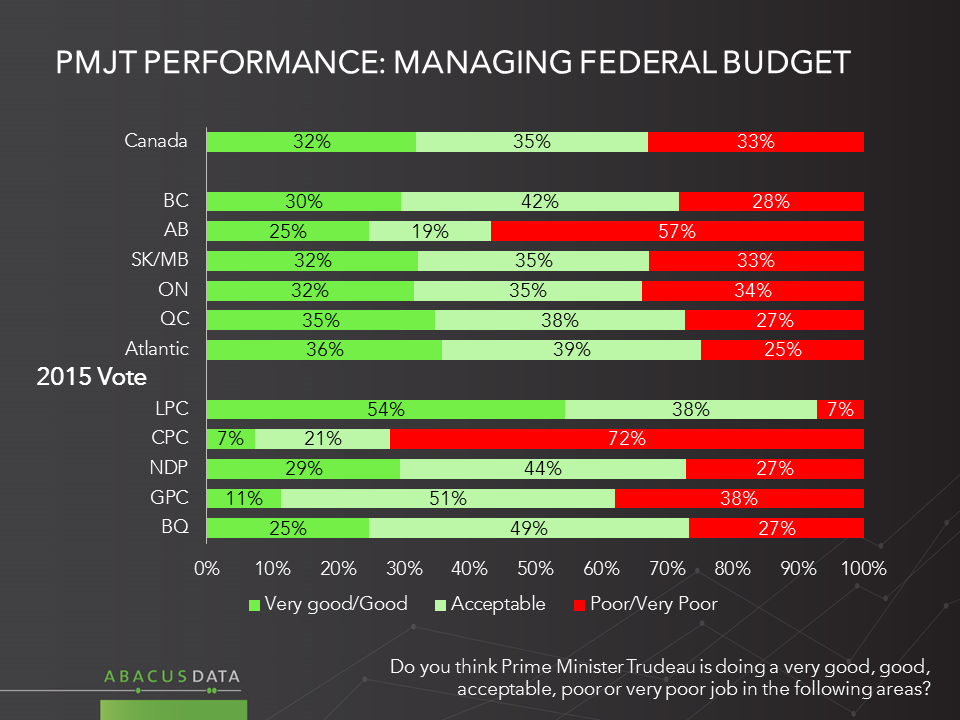
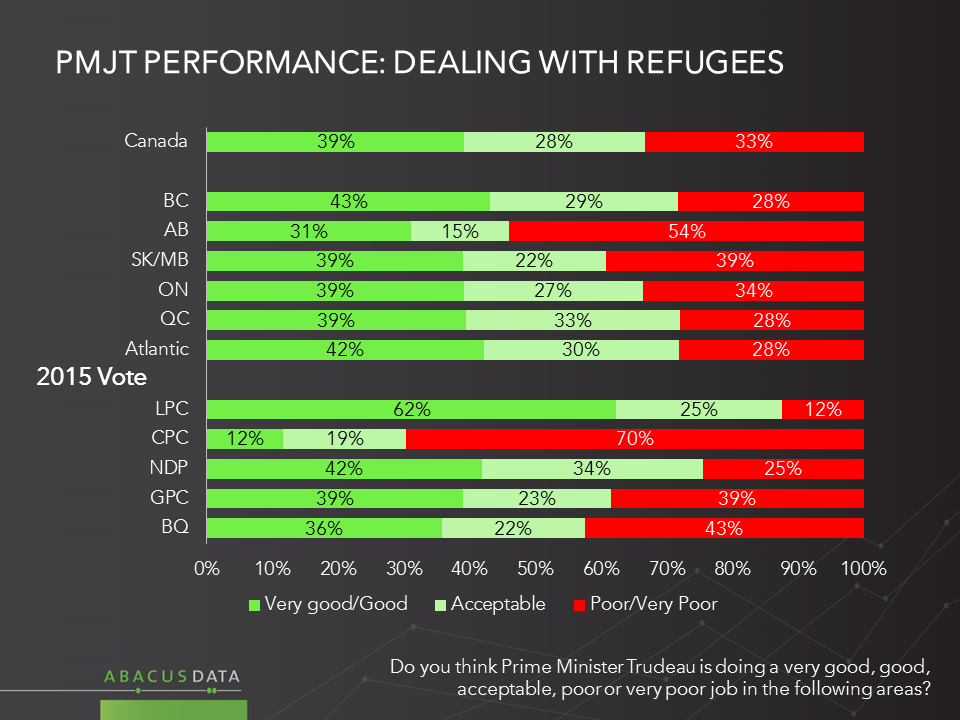
• Weaker ratings, but still 2/3 offering acceptable or better ratings in every case, are for dealing with refugees, ISIS, the economy and the federal budget.
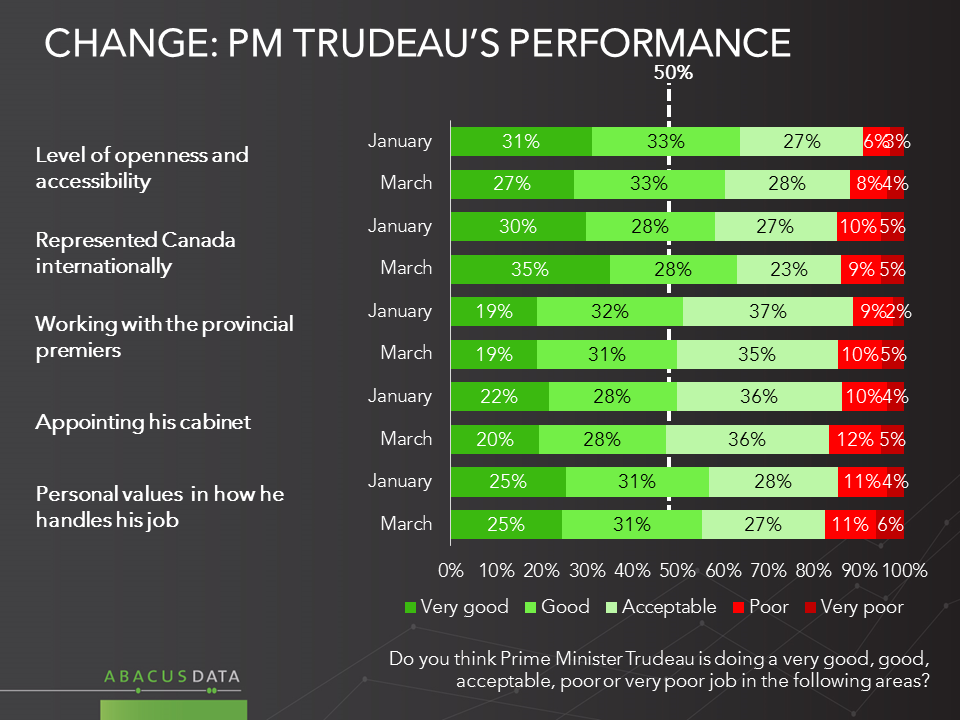
• Since January, there has been only minor changes in the performance ratings of the Prime Minister. The percentage of respondents giving PM Trudeau less than an acceptable rating dropped by more than three 3 points on only three items: working with provincial premiers (89% to 85%), handling the economy (72% to 68%), and managing the federal budget (71% to 67%).
Looking at the breakdowns of responses by region and past vote reveal a number of interesting things.
• When it comes to the PERSONAL VALUES HE BRINGS TO THE JOB, majorities in every region, including Alberta (66%) give the PM acceptable or better marks. In fact in Alberta, more give the PM good ratings (41%) than poor (35%) ratings. Large majorities of NDP, Green and BQ voters give the PM acceptable or better ratings as do 59% of those who voted Conservative in the fall.
• On his approach to REPRESENTING CANADA INTERNATIONALLY, more than 3 out of 4 people in every region give acceptable or better ratings. In Alberta 2 voters give the PM good ratings for every 1 who offers a poor rating. Only 1 in 3 Conservative voters rate the PM poorly on this item.
• On CLIMATE CHANGE, majorities in every region give the PM passing marks or better, including 64% of Albertans, and 62% of Conservative voters.
• On DEALING WITH ISIS, majorities in every region but Alberta give the PM passing grades or better. In Alberta, opinion is split with 48% saying Mr. Trudeau is doing a good or acceptable job and 51% saying poor or very poor. Conservative voters are decidedly less satisfied with the PM on this point, with 72% offering negative assessments.
• On HANDLING THE ECONOMY, majorities in every region give acceptable or better grades to the PM, except in Alberta, where opinion is split, and 53% offer a negative assessment. Partisans of four out of five parties are satisfied, while 70% of Conservative voters are not.
• Similar results are seen on MANAGING THE FEDERAL BUDGET. A majority of Alberta voters 57%) and of Conservative voters (72%) give poor assessments, while majorities in the rest of the country and of other parties’ supporters are satisfied.
• When it comes to his approach to DEALING WITH REFUGEES, a majority of Conservative voters and Albertans give Mr. Trudeau poor ratings while a majority in other regions of the country and voters for other parties give him positive ratings.
To further summarize the trends along partisan lines, here is what we see.
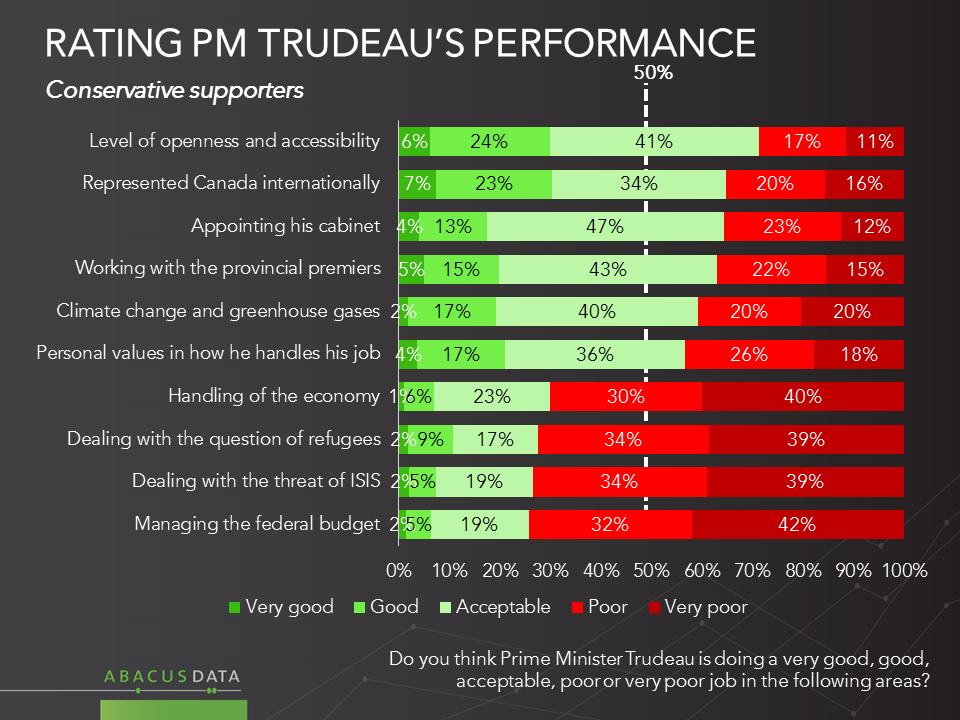
Majorities of CONSERVATIVE voters consider Prime Minister Trudeau to be doing an acceptable job in terms of representing Canada internationally, working with the Premiers, dealing with climate change, being open and accessible and choosing a good cabinet. Conservative voters are mostly unhappy with handing of the economy, ISIS, refugees, and federal budget issues.
Large majorities of NDP voters give the PM acceptable or better marks on all 10 items tested. Weakest results are for ISIS, federal budget, and handling of the economy.
THE UPSHOT
According to Bruce Anderson: “Voters show little evidence of dismay or disappointment with the choices that the new government has made in its first few months in office.
No doubt this level of positive sentiment will be tested in the days ahead with the first budget, and with other challenging decisions. But up this point, it’s fair to say that the Liberal government has met or exceeded the hopes of NDP voters – putting extra pressure on Thomas Mulcair as he faces leadership review within his party.
Among Conservatives, the results portray a lower level of polarization that existed in the run up to the election.
While large majorities of Conservative voters are unhappy with the government on fiscal, ISIS and refugee issues, substantial numbers find it hard to take issue with the approach the Prime Minister has been taking on several other issues, including, remarkably, his handling of the economy and international affairs. These are two issues that had been seen, by Conservatives, as important Conservative brand advantages under Stephen Harper.
Finally, on the issue of climate change, only 4 in 10 Conservative voters say they are unhappy with Mr. Trudeau’s approach to date. That of course may change, based on the hard choices that will come in the months ahead, but so far the PM has managed to approach this issue in a way that has alienated few on the left or on the right, despite some of the often heated rhetoric coming from both ends of the spectrum.”
METHODOLOGY
Our survey was conducted online with 1,500 Canadians aged 18 and over from March 16 to 18, 2016. A random sample of panelists was invited to complete the survey from a large representative panel of over 500,000 Canadians.
The Marketing Research and Intelligence Association policy limits statements about margins of sampling error for most online surveys. The margin of error for a comparable probability-based random sample of the same size is +/- 2.6%, 19 times out of 20. The data were weighted according to census data to ensure that the sample matched Canada’s population according to age, gender, educational attainment, and region. Totals may not add up to 100 due to rounding.
ABACUS DATA
We offer global research capacity with a strong focus on customer service, attention to detail and value added insight. Our team combines the experience of our Chairman Bruce Anderson, one of Canada’s leading research executives for two decades, with the energy, creativity and research expertise of CEO David Coletto, PhD. For more information, visit our website at http://www.abacusdata.ca/
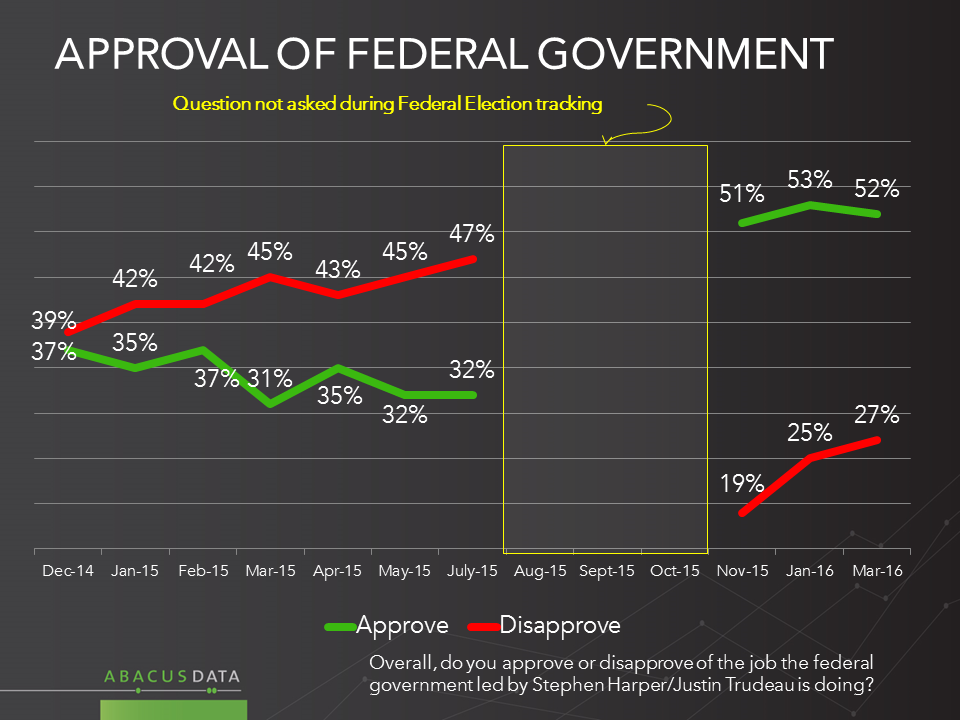
Days before the Trudeau government releases its first budget, our latest poll finds that support for the federal government remains strong across the country. A majority approve of the federal government’s performance, the Liberals hold a 15-point lead over the Conservatives in ballot support, and a large majority of Canadians consider Mr. Trudeau’s trip to Washington to have been a success.
The results, in a nutshell, reveal:
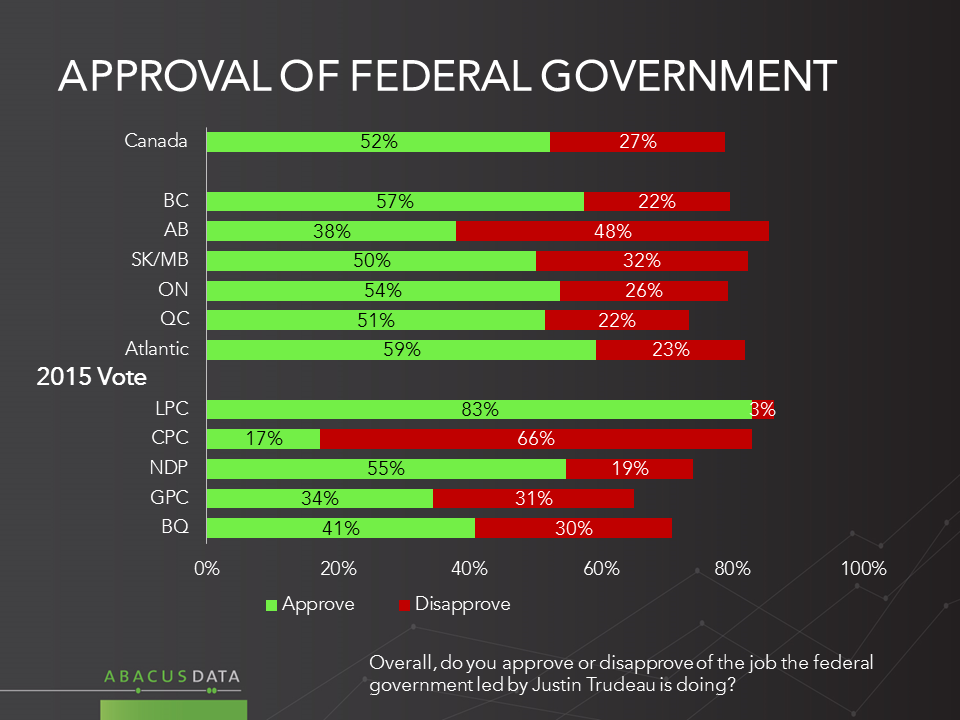
• A steady 52% approve of the federal government performance, unchanged since November. The number of people dissatisfied has risen from 19% immediately after the election to 25% in January, and 27% this month.
• A majority in every region but Alberta approve of the government’s performance. In Alberta 38% approve and 48% disapprove.
• The Liberal government has made a positive impression with NDP voters, 55% of whom approve of the government’s performance. Among those who voted Conservative, 17% approve and 66% disapprove.
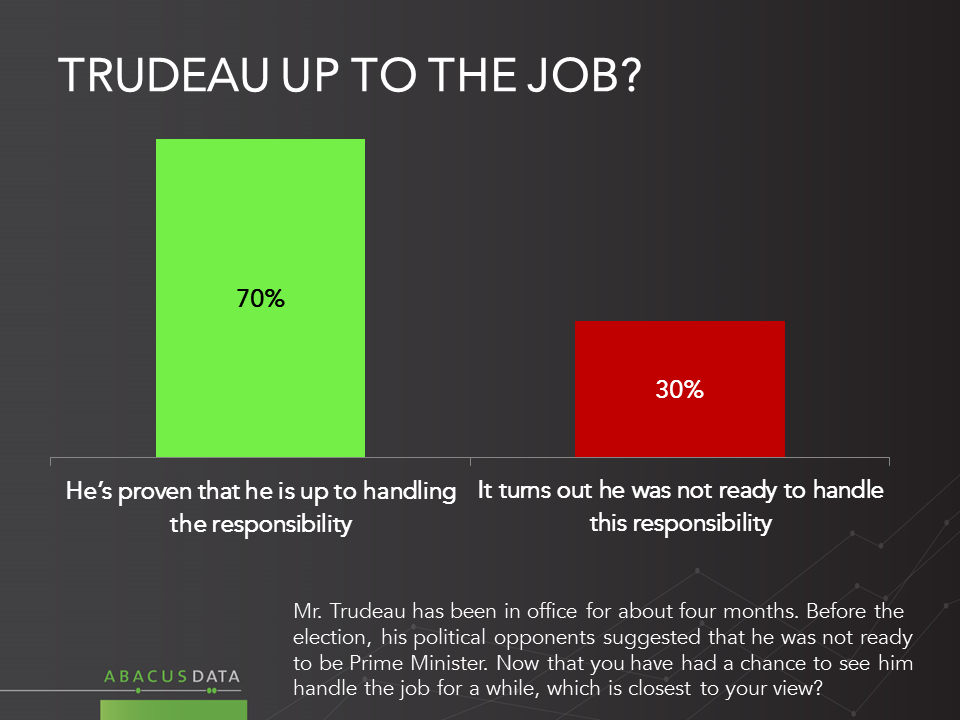
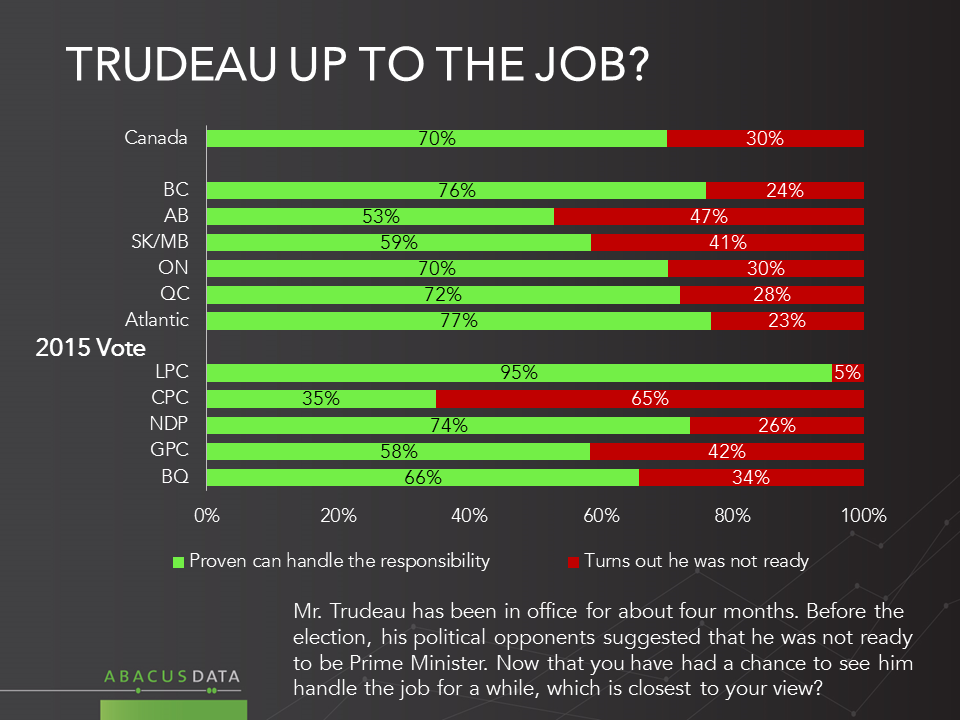
• During the election campaign Mr. Trudeau’s opponents argued that he was “not ready” for the job. We asked if after several months on the job Mr. Trudeau critics have been proven right (“that he was not ready to handle this responsibility” or if he has proven that he “is up to handling the responsibility”). By a wide margin 70% Mr. Trudeau has shown that he is up to handling the job. A majority in every region, including Alberta (53%) feel this way. Three out of four NDP voters and 35% of CPC voters say Mr. Trudeau has shown that he was ready.
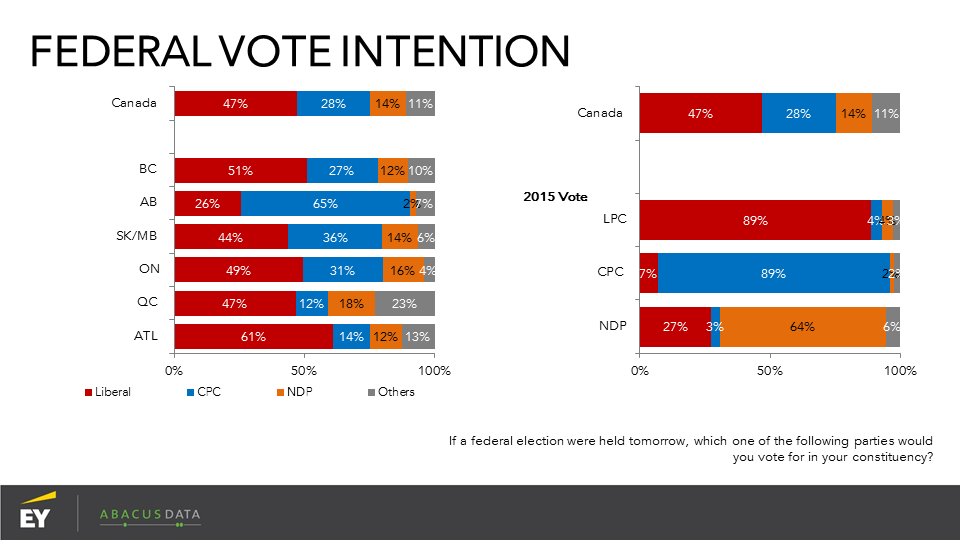
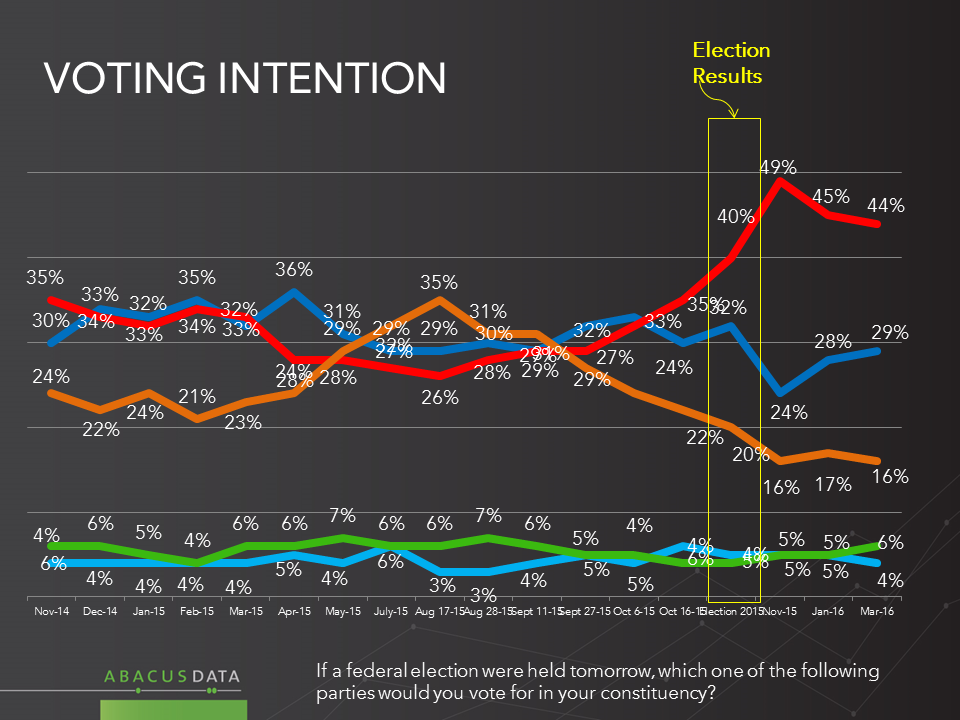
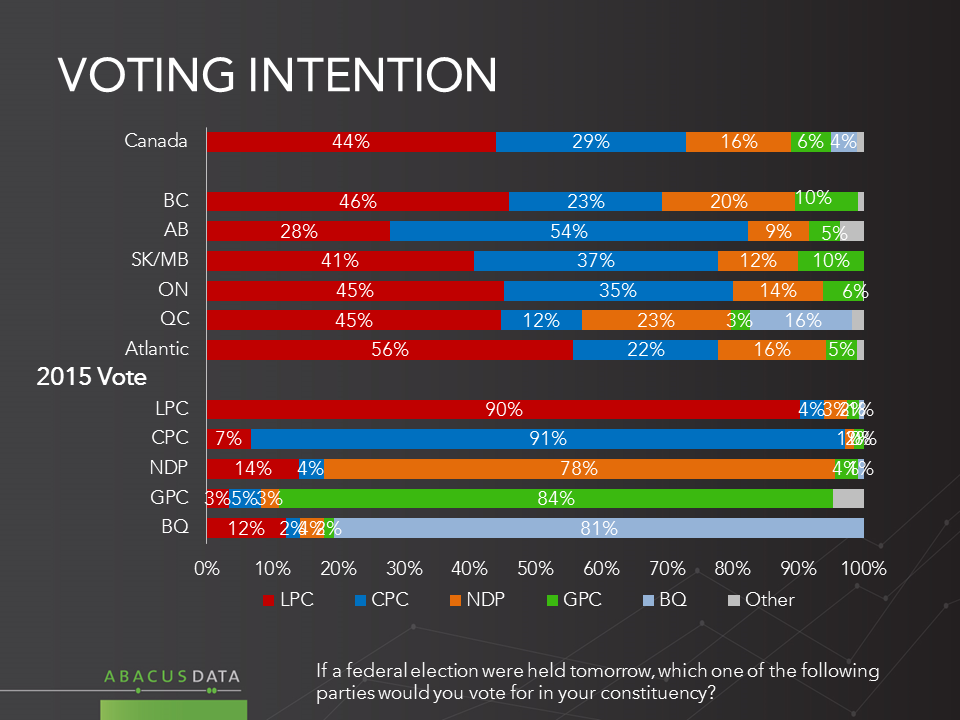
• If there were an election tomorrow, the Liberal Party would win 44% of the votes, followed by the Conservative Party at 29% and the NDP 16%. These results are unchanged from our last survey and represent a gain of 4-points for the Liberals since the October election, essentially at the expense of the NDP.
• Regionally, we see gains for the Liberals in BC and in Quebec since the election. 7% of those who voted Conservative say they would vote Liberal today, while 4% of Liberal voters would go to the Liberals. 14% of those who voted NDP would shift to Liberals today, and 3% of Liberal supporters would go to the NDP.
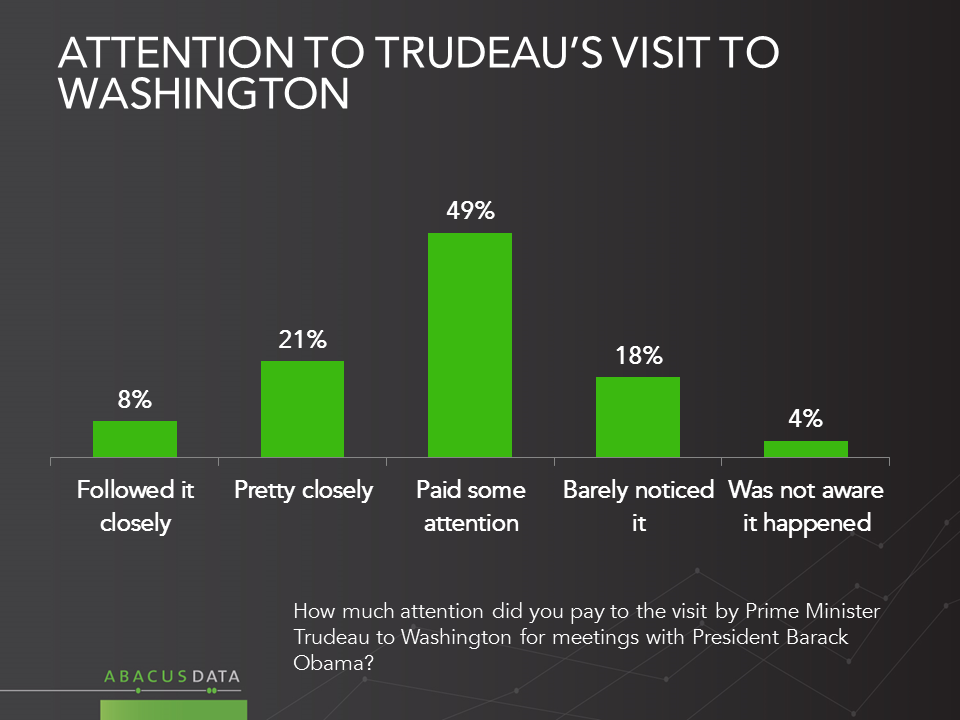
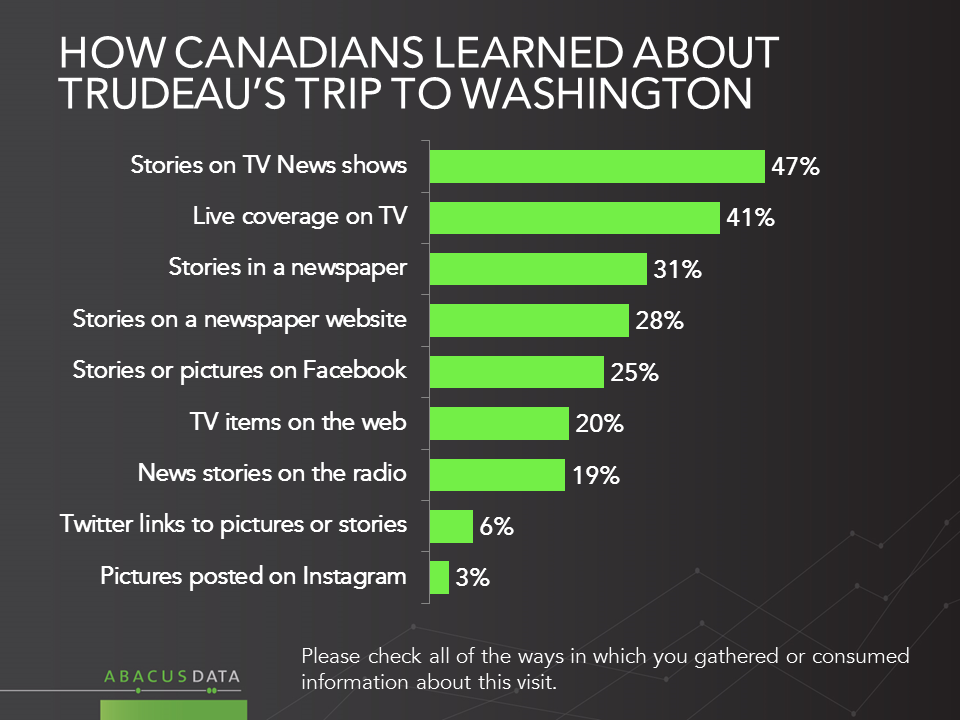
• Mr. Trudeau’s visit to Washington DC captured some attention among 78% of Canadians, including 29% who followed it pretty closely or closely. TV news program stories were an important source for Canadians, but 41% said they followed some of the coverage live. Also worth noting is that newspaper websites were almost as important as actual newspapers. Facebook posts were a source of information for 25%. Twitter reached 6% and Instagram 3%.
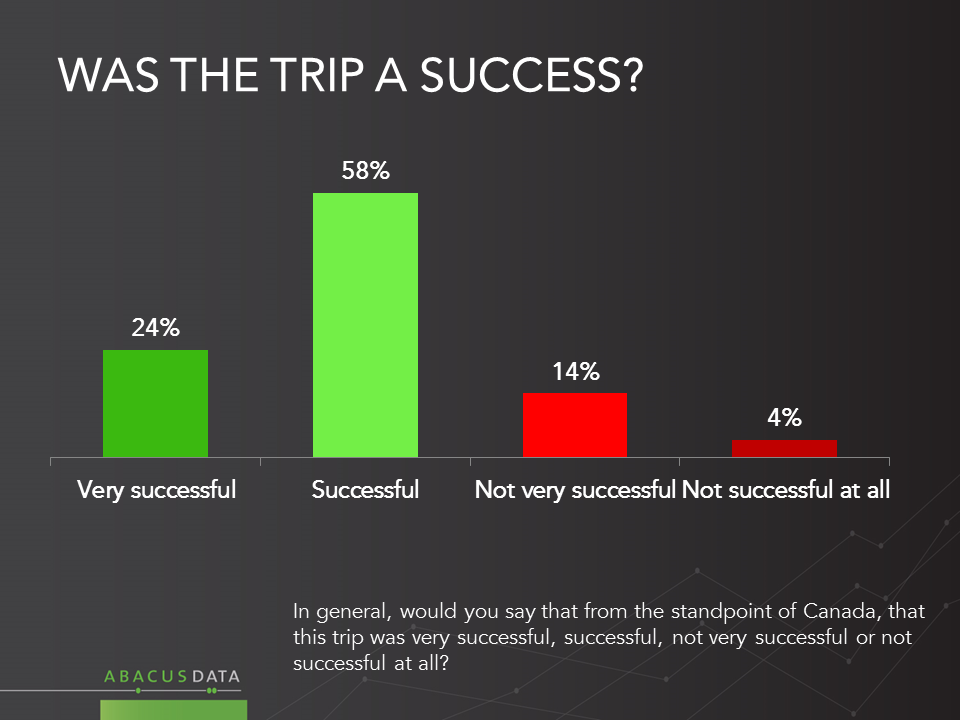
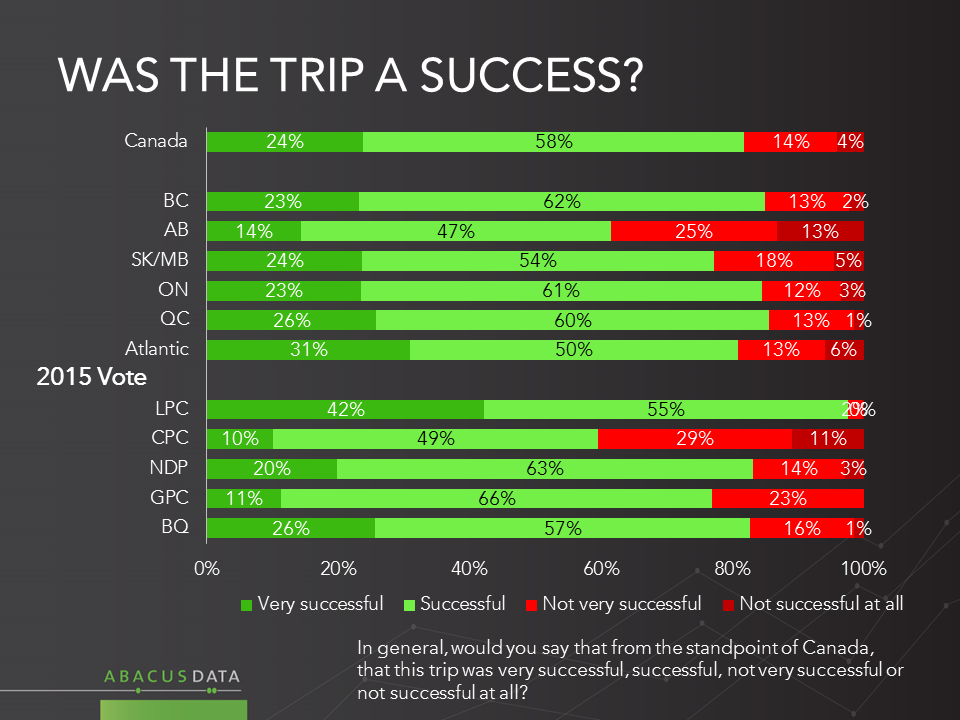
• 82% considered the trip a success “from the standpoint of Canada”, while 18% said it was not very or not at all successful. The consensus that it was a success was broad in every region of the country, including 61% of Albertans, and 59% of those who voted Conservative in the last election.
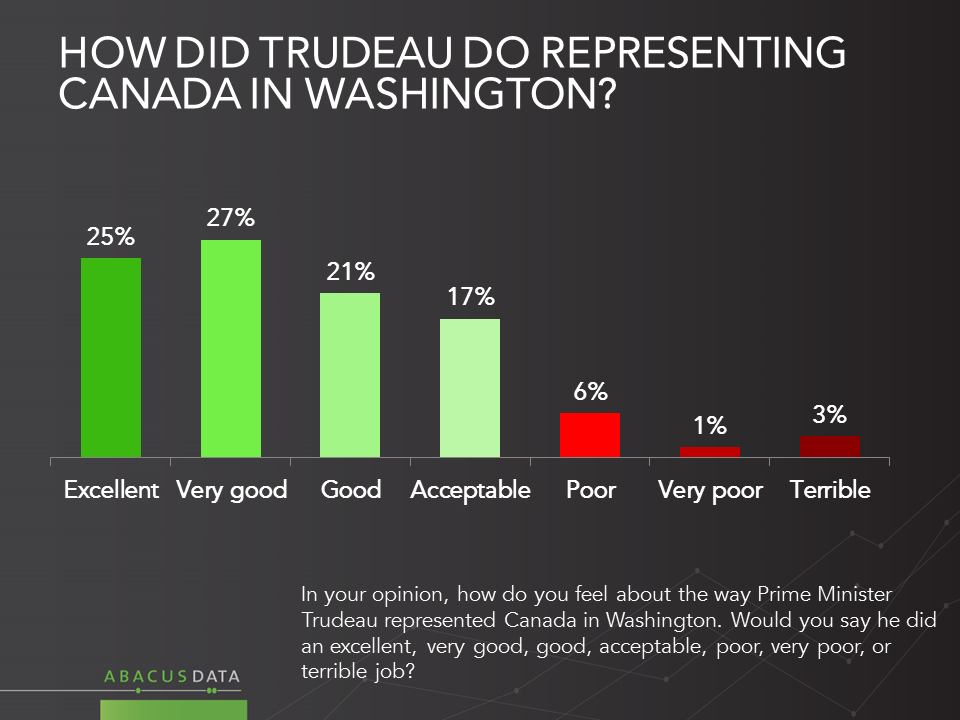
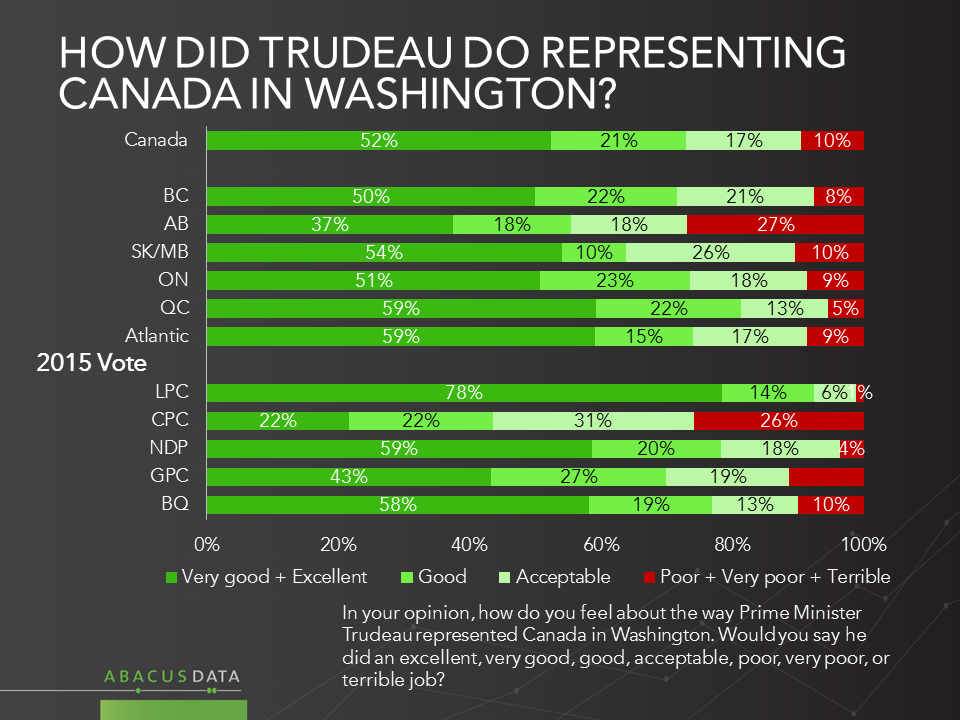
• When asked specifically how they felt about the way Prime Minister Trudeau represented Canada in Washington, 73% said he did a good, very good or excellent job. Another 17% characterized it as “acceptable”. Only 10% said he did poor, very poor, or terrible in representing the country. Only 27% of Albertans, and only 26% of Conservative voters panned the PM’s efforts. A noteworthy 44% of Conservative voters and 55% of Albertans said the PM did a good job or better.
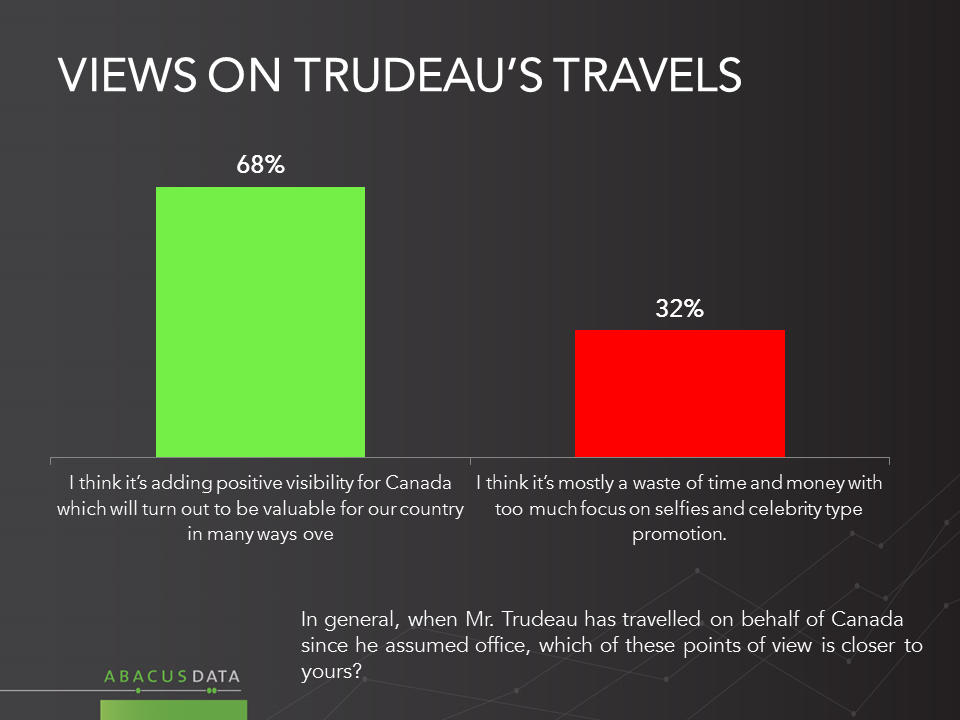
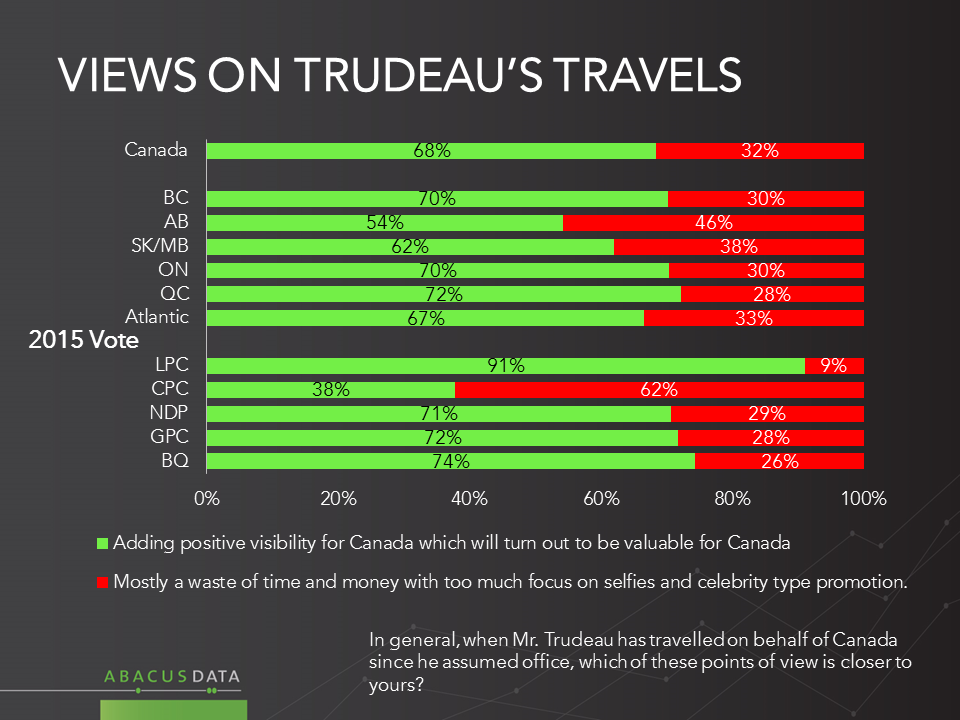
• Finally, we asked whether people felt that Mr. Trudeau’s travels since he assumed office have been “mostly a waste of time and money with too much focus on selfies and celebrity style promotion” or “adding positive visibility for Canada which will turn out to be valuable for our country in many ways. By a margin of 68% to 32% most felt that the visibility was of value for the country. This includes 54% in Alberta and larger majorities everywhere else. More than one in three Conservatives (38%) see more value than waste.
THE UPSHOT
According to Bruce Anderson: “As they approach a key inflection point with their first budget, the government of Justin Trudeau continues to find fairly broad support. Clearly the Liberals’ agenda has drawn support away from the NDP, whose voters are quite well disposed towards Mr. Trudeau.
While Alberta was the weakest region for the Liberals, and this remains the case, it would be incorrect to assume that Alberta voters are broadly unhappy or resentful of the new government or of Mr. Trudeau. The results paint a much more nuanced picture than that.
While critics of the PM such as Preston Manning derided Mr. Trudeau’s visit to the US, Canadians generally saw things quite differently. The positive reactions to the DC visit are unusually strong and broad in an era where cynicism about politics can seem impossible to overcome.
So far anyway, Mr. Trudeau’s trips, selfies and all, are far from a source of dismay for most people: instead they seem to sense value in Canada’s profile being raised in a positive way.”
METHODOLOGY
Our survey was conducted online with 1,500 Canadians aged 18 and over from March 16 to 18, 2016. A random sample of panelists was invited to complete the survey from a large representative panel of over 500,000 Canadians.
The Marketing Research and Intelligence Association policy limits statements about margins of sampling error for most online surveys. The margin of error for a comparable probability-based random sample of the same size is +/- 2.6%, 19 times out of 20. The data were weighted according to census data to ensure that the sample matched Canada’s population according to age, gender, educational attainment, and region. Totals may not add up to 100 due to rounding.
ABACUS DATA INC.
We offer global research capacity with a strong focus on customer service, attention to detail and value added insight. Our team combines the experience of our Chairman Bruce Anderson, one of Canada’s leading research executives for two decades, with the energy, creativity and research expertise of CEO David Coletto, PhD.
Location: Ottawa, ON Description: Full-time, 4-month contract (May 2016 thru August 2016) Compensation: $3,100 per month
Applications accepted until 11:59pm ET on March 25, 2016
Role:
Abacus Data is looking for an energetic, self-starting college or university student who is looking for a summer placement or internship based in Ottawa to support the senior research team. As a member of our growing and evolving team, you will report directly to the CEO and work closely on a range of client projects and marketing efforts.
Based in Ottawa, you will be responsible for contributing to all aspects of qualitative and quantitative research projects as well as managing content development on the AbacusData.ca and CanadianMillennials.ca websites. We are looking for someone with an entrepreneurial spirit who enjoys to write, communicate, and learn about new topics. A passion for research, politics, and public affairs is definitely an asset.
During the 4-month placement, you will be asked to support our team on a range of projects and work with the team to develop content for public consumption.
Responsibilities:
Support senior research team in all aspects of the research process including:
Questionnaire and discussion guide development
Survey programming and project management
Data analysis
Reporting – PowerPoint or written reports.
Coordinate marketing and content publishing with team.
Develop content for the CanadianMillennials.ca website.
Requirements:
Internet savvy and fluent in MS-Office suite of products.
Strong interpersonal, writing, organizational, problem solving, and communication skills.
Ability to create content quickly.
Ability to work with minimal supervision.
Currently enrolled in a full-time university or college program
Being able to create stunning PowerPoint presentations, infographics etc is a definite asset.
Previous research experience and fluency in French is an asset.
Desired Skills and Experience:
Driven to succeed – self-starter, with a successful record of sales growth and business development Innovative – you think of interesting and alternative ways to get new business Collaborative – you can work closely with the Abacus Data team to leverage expertise to develop content for the Abacus Insider and Canadian Millennials websites Persistent – doing whatever it takes to get things done with integrity and without excuses Independent – you work well without constant supervision and cherish your freedom to achieve business and personal objectives.
About Abacus Data Inc.
Abacus Data is a leading public opinion and marketing research firm, bringing together the latest technology and industry expertise to help organizations effectively understand and connect with those they serve.
Having conducted research for some of North America’s leading corporations and advocacy groups, we deliver global research capacities with the attention to detail and focus of a boutique firm.
We are at the forefront of the research sector and deliver revolutionary insights and strategy to our clients. Our team brings together a rare combination of experience and energy in a team of professional researchers. We all value integrity, hard work, and creativity believing good research insights come from an intense focus on our clients, rigorous methods, and occasionally challenging convention. The bottom line is we get things right.
Note: Applicants will also be asked to complete a small assignment if they make the short list of candidates.
Timeline
Initial applications are due March 25, 2016
Shortlisted candidates will be contacted on March 29 along with the assignment to complete
Assignments are due on April 5
Interviews will be conducted after April 5
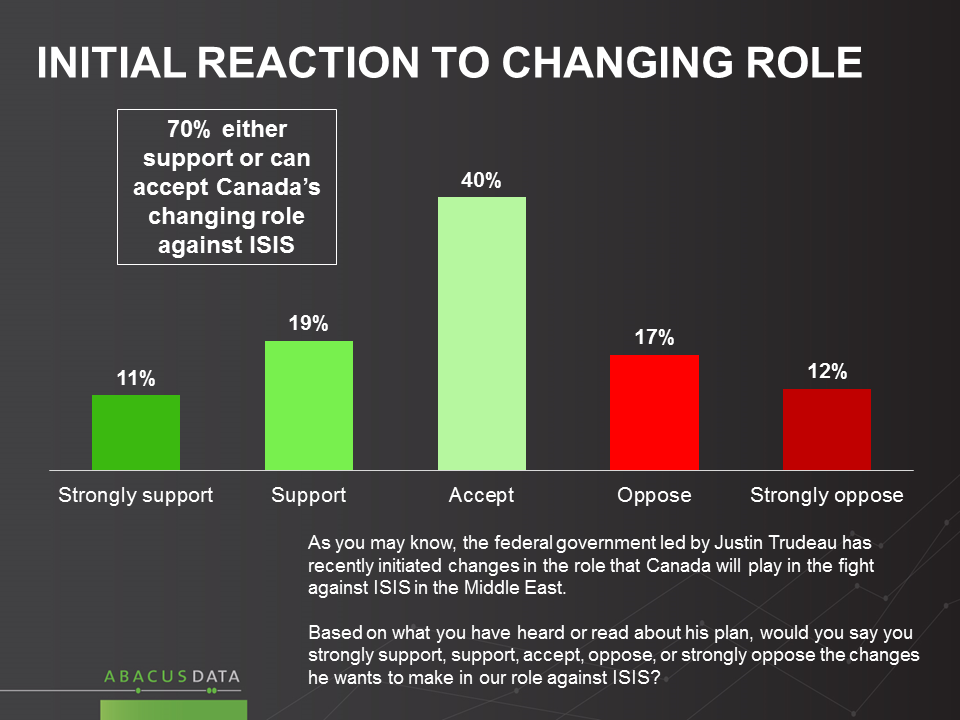
MOST ACCEPT CANADA’S SHIFT IN ROLE IN THE FIGHT AGAINST ISIS
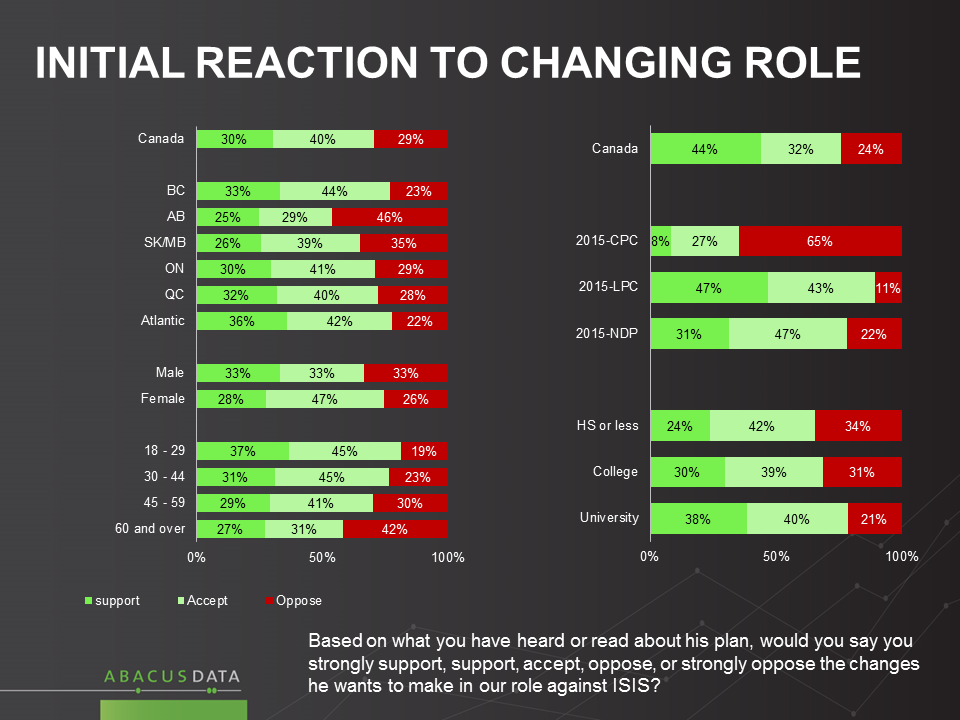
Our latest poll reveals broad acceptance of the move by Ottawa to adjust Canada’s role in the fight against ISIS: 30% support the new approach, 40% say they accept it, while 29% oppose.
Reactions diverge along partisan lines. Large majorities of NDP (78%) and Liberal (90%) voters accept or support the shift. Perhaps most interesting, given the political debate of the last year, is that one in three Conservatives (35%) also show no opposition to the change in role.
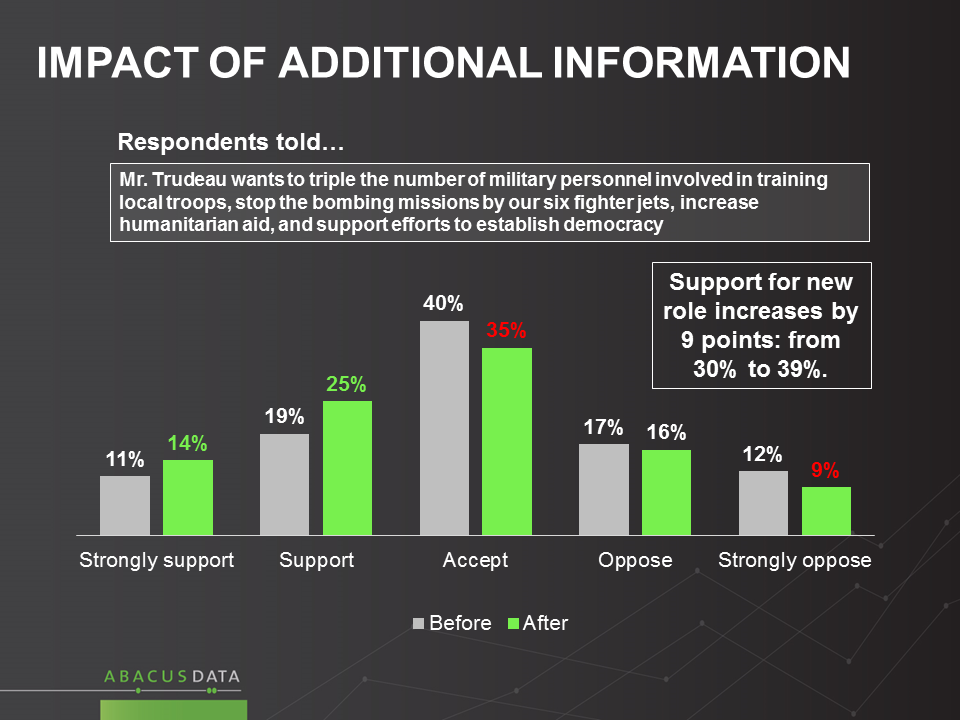
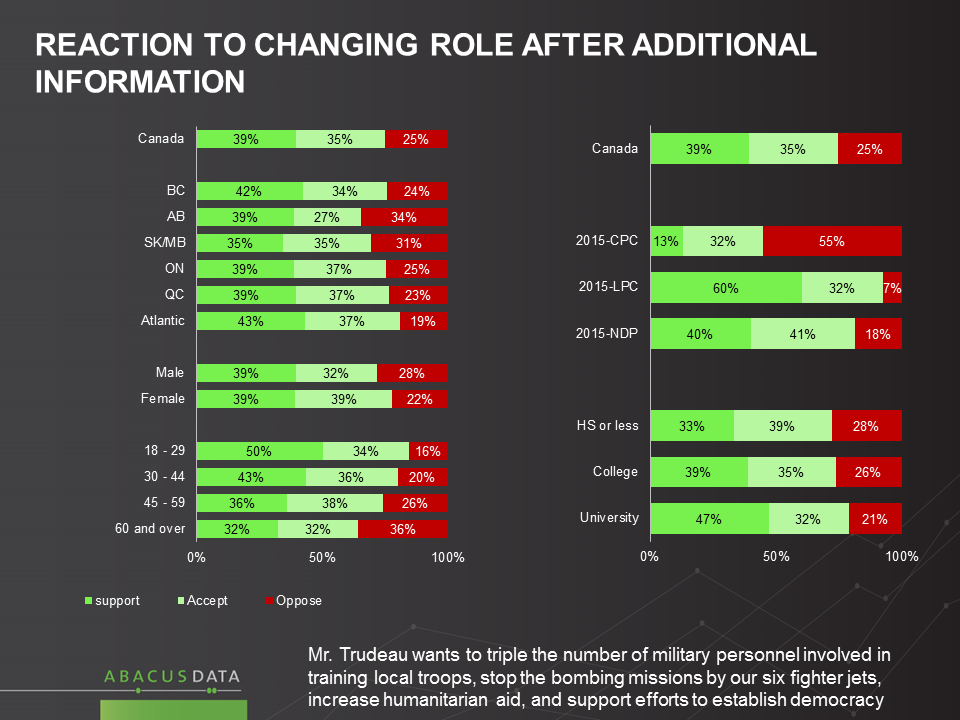
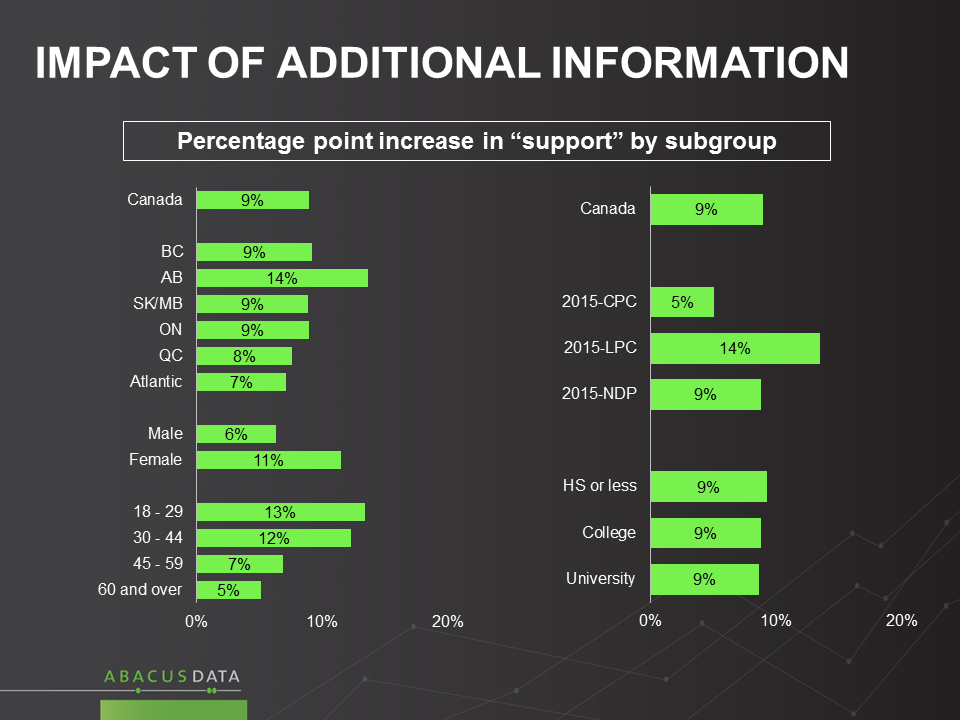
To explore reactions further, we added a second question describing the main elements of the shift in posture (trebling training personnel, withdrawing jets, more humanitarian aid, support for democracy). This aided question found a 9-point higher level of support, and a 4-point drop in opposition (39% support, 35% accept, 25% oppose).
Support jumped among women (+11), those under 45 (13%) and Liberal voters (+14). Mostly this was about a shift from “acceptance” towards a more enthusiastic “support”.
Among Albertans, support jumped 14 points to 39% and opposition dropped 11 points to 36%. Among Conservatives, support rose 5 points to 13%, and opposition dropped 10 points to 55%.
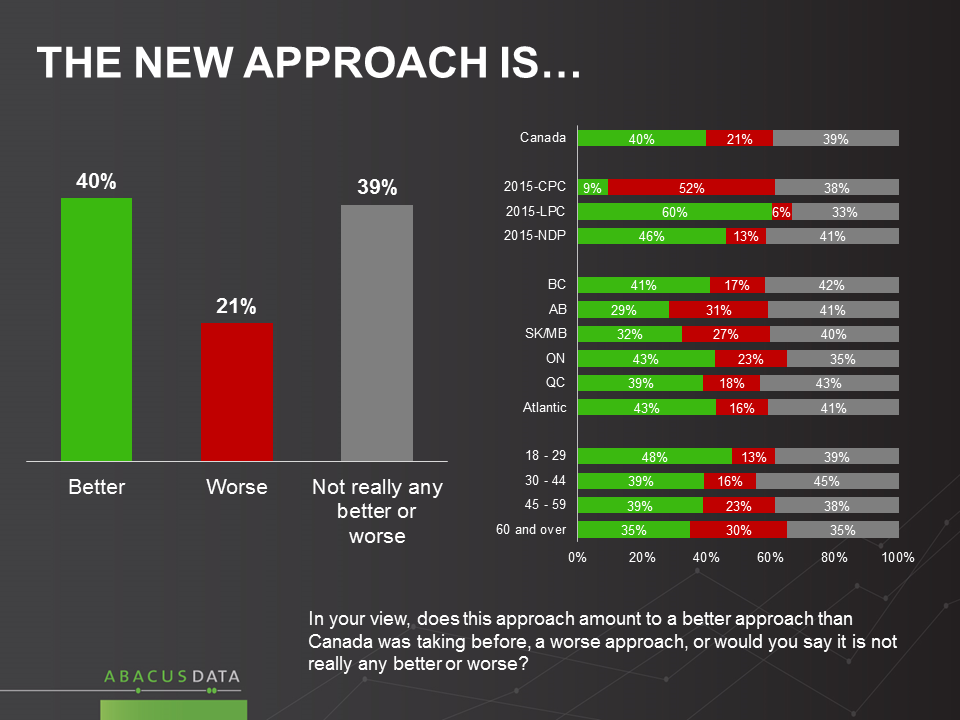
Overall 40% say new role for Canada is better, compared to 21% who say it is worse than that favoured by the Harper government. 39% say it is not really any better or worse. In Alberta, 29% say the new approach is better, 31% say worse.
Among Conservatives, 52% say it is worse, and the rest say it is either better (9%) or no better or worse (38%). Among NDP voters, 46% say the new approach is an improvement, while only 13% say it is worse.
THE UPSHOT
The question of how best to handle the challenge of ISIS was one of the most highly charged political debates in the last year. For a time, it was evident that a fair number of Canadians had doubts about whether the Liberals and Mr. Trudeau were advocating the right approach.
However, now that the government has made its intentions clear, and has been in office for a period of time, these results suggest a growing measure of confidence that the new Prime Minister has developed an approach that seems thought out and credible.
While all three parties took different positions on this issue, most NDP voters are comfortable with Mr. Trudeau’s approach and only half of Conservative voters seem truly upset at this policy shift. Some of the more pointed criticisms of the Liberal position (e.g. “cowardly”) do not appear to have landed credibly, even among many Conservative voters.
METHODOLOGY
Our survey was conducted online with 3,824 Canadian respondents from February 19 to 25, 2016. A random sample of panelists was invited to complete the survey from a large representative panel of Canadians, recruited and managed by Research Now, one of the world’s leading provider of online research samples.
The Marketing Research and Intelligence Association policy limits statements about margins of sampling error for most online surveys. The margin of error for a comparable probability-based random sample of the same size is +/- 1.6%, 19 times out of 20 for each province’s sample. The data were weighted according to census data to ensure that the sample matched Canada’s population according to age, gender, educational attainment, and region. Totals may not add up to 100 due to rounding.
Sample Specifications:
Residents of Nova Scotia, New Brunswick, Newfoundland and Labrador, Quebec, Ontario, Manitoba, and Saskatchewan were oversampled in this survey. Responses were weighted to match the distribution of the population based on census data.
Abacus recently completed an in-depth nationwide LIFE IN CANADA’S COMMUNITIES study for the Federation of Canadian Municipalities. This release is the third in a series based on this study.
REACTION TO FEDERAL GOVERNMENT PRIORITIES
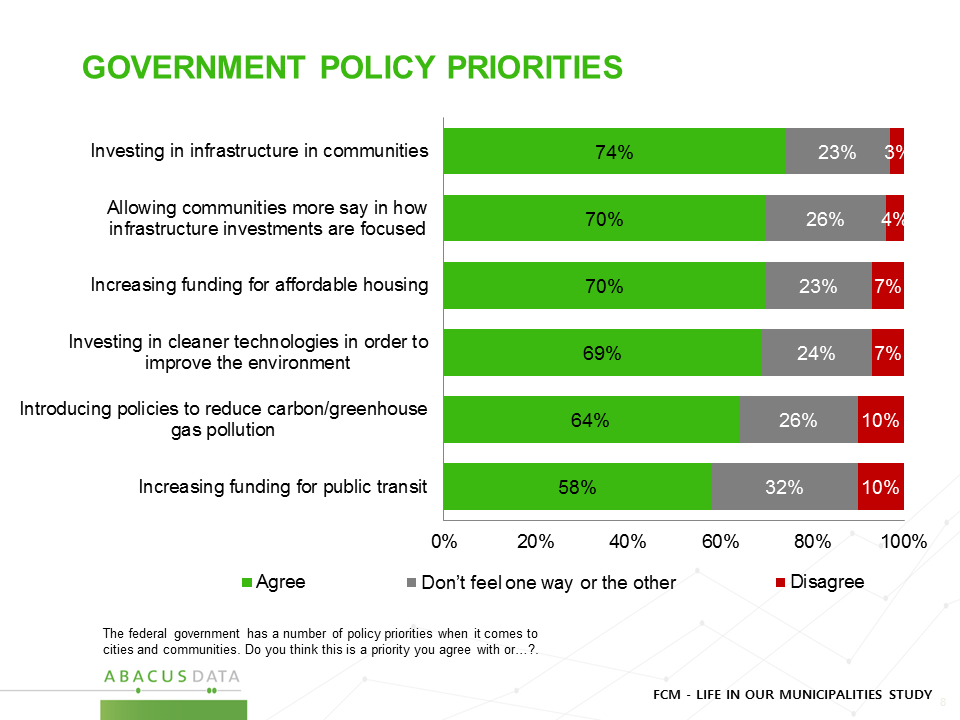
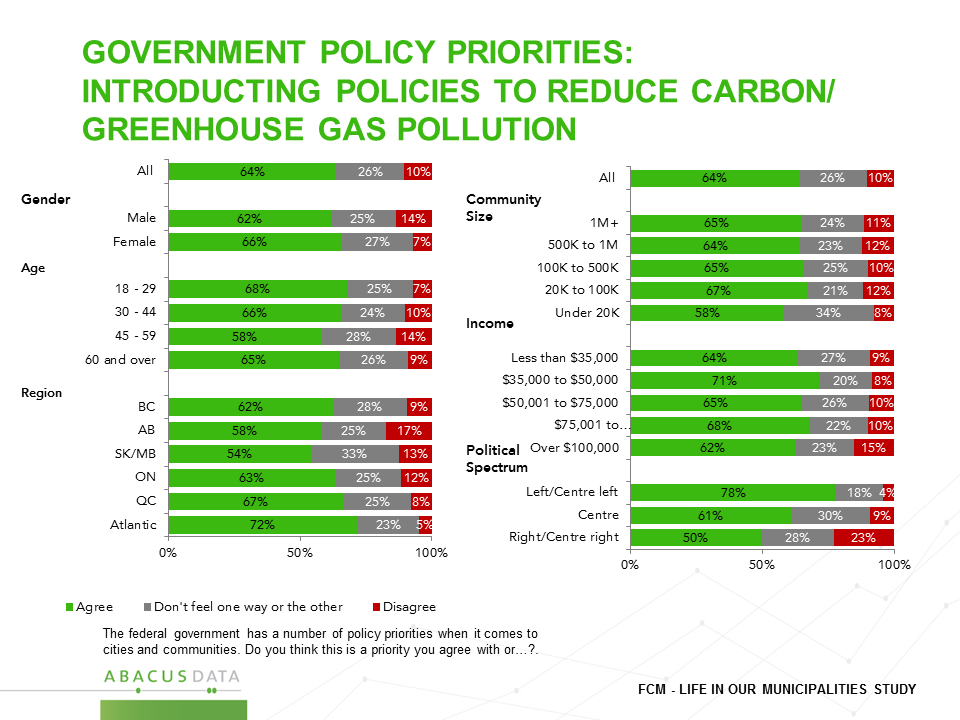
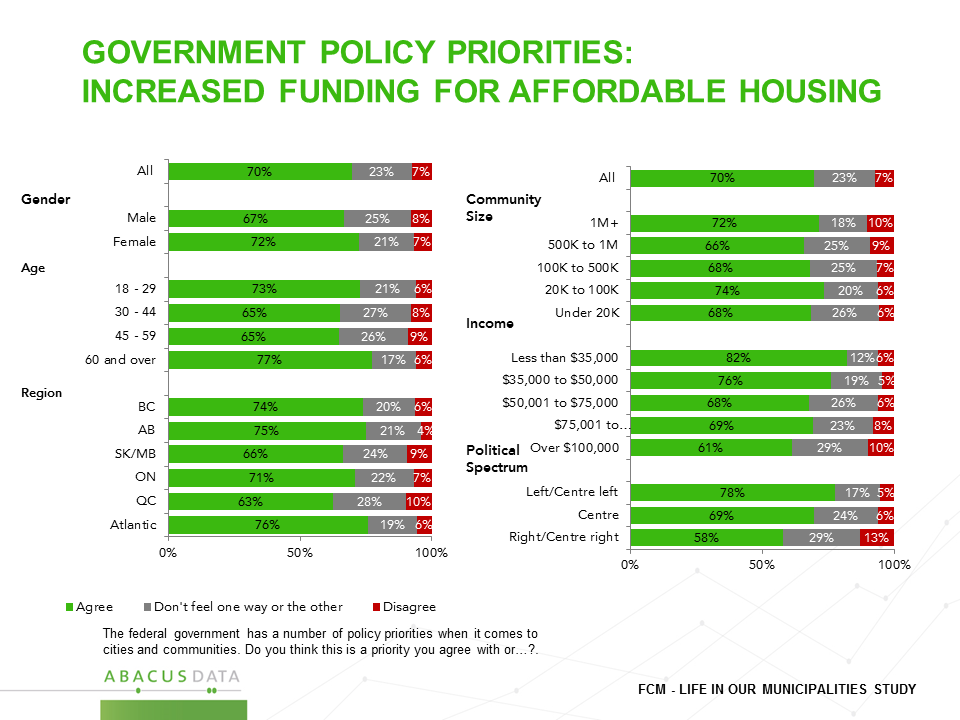
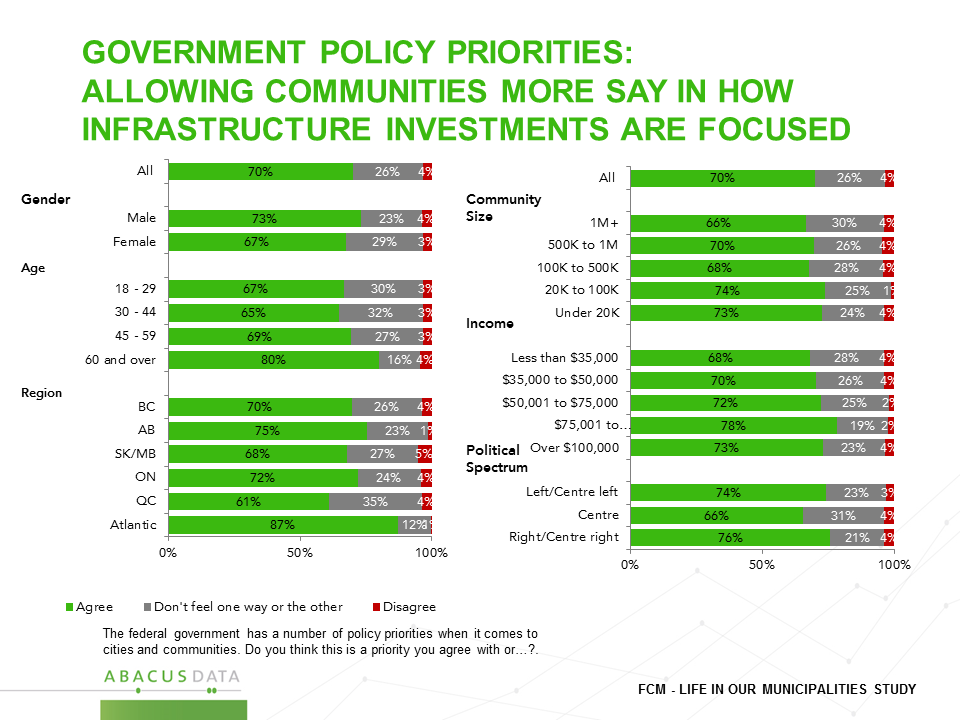
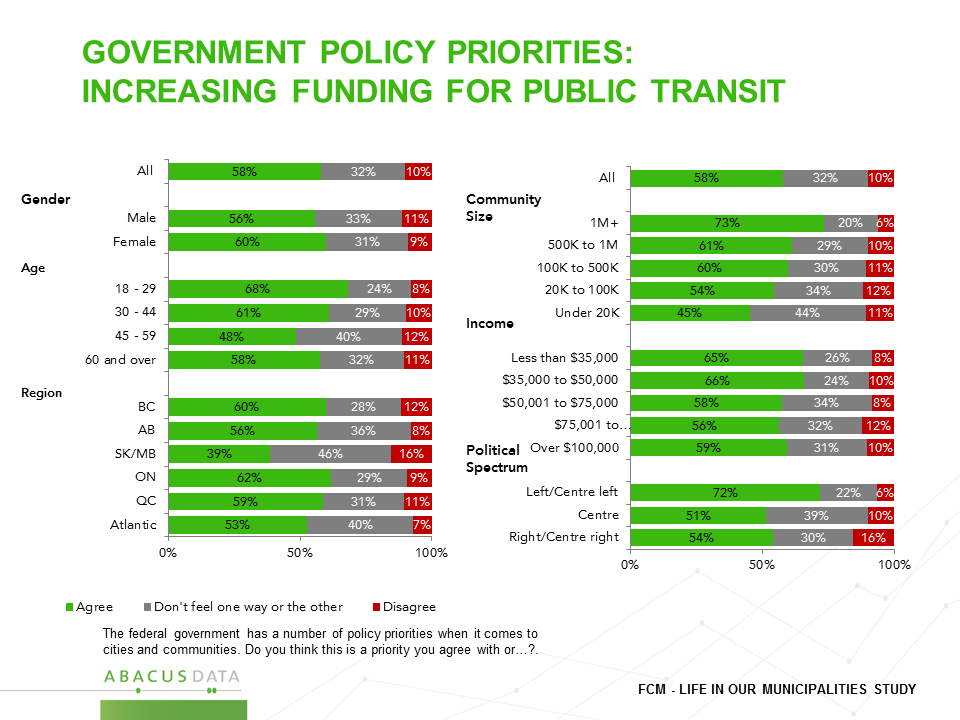
We asked people to react to recently announced federal priorities that relate to cities and communities. All six items we tested found majority support (ranging from 58% to 74%) and very little opposition (no more than 10% on any item).
There is broad support for the federal government investing in infrastructure, clean technology, public transit, and affordable housing. There is broad agreement with the idea that municipalities should have more say in the choices of what infrastructure to prioritize. And, 64% agree while only 10% disagree with the idea of putting a priority on reducing greenhouse gas emissions.
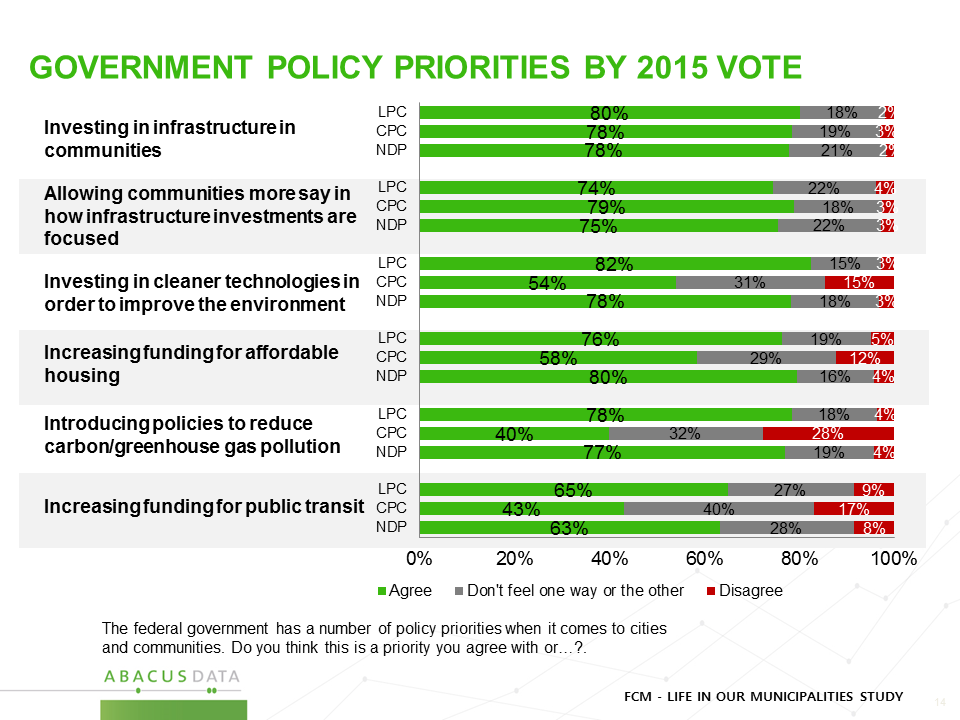
In an era when some issues show sharp partisan divisions it is worth noting that the tendency across all major parties is to support rather than oppose these priorities.
Conservative voters are less enthusiastic about investments in clean tech, affordable housing and public transit, but are still more supportive than opposed.
When it comes to reducing carbon, more Conservatives agree (40%) than disagree (28%) with putting a priority on this. Worth noting, in Alberta, 58% agree, and 17% disagree.
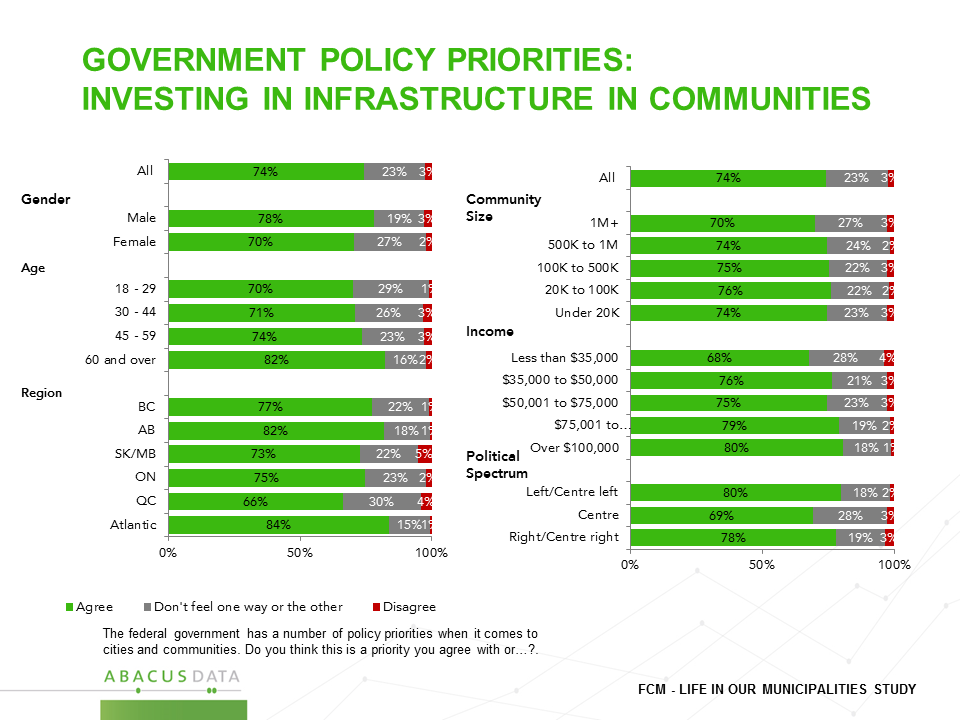
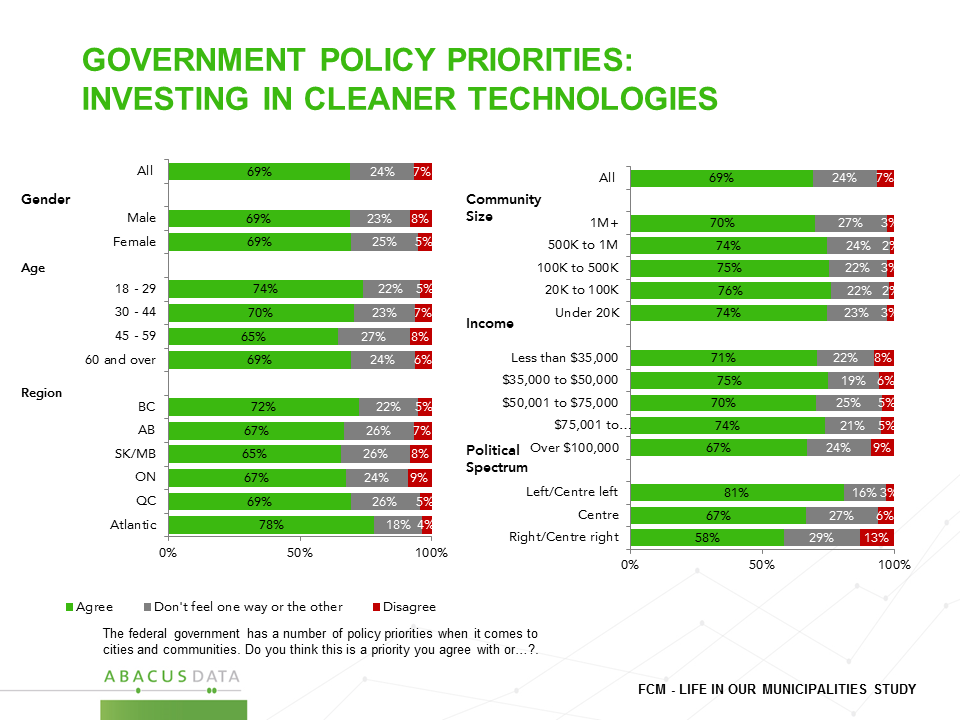
In fact, support for these priorities are fairly consistent across a broad range of groups in Canada. On a handful of items there is more support among those on the left and centre of the spectrum than on the right, but these are more differences of degree than of direction.
THE UPSHOT
Most Canadians agree with the priorities outlined by the federal government when it comes to how it deals with municipalities.
There is very little resistance, in any part of the country, or on any part of the political spectrum to investing in infrastructure, affordable housing, clean technologies, or public transit. These priorities do not divide people along gender, generational or rural and urban lines either.
Conservative Party supporters tend to be somewhat less enthusiastic about investments in transit and affordable housing but still agree more than disagree with these priorities.
Perhaps the most striking aspect of these findings has to do with the question of carbon reduction initiatives. While some may make the case that Albertans and Conservatives are broadly opposed to putting a priority on carbon reduction, these data, as has been the case in many other studies we’ve completed, argue otherwise. Finding agreement on exactly what to do, at what pace, with what economic considerations taken into account may be challenging, but voters everywhere prefer progress, to a stalemate on carbon reduction.
Overall, these numbers suggest there is little risk for the federal government in pursuing its community-focused infrastructure and climate agenda.
METHODOLOGY
Our survey was conducted online with 1,500 Canadian respondents from January 24 to January 26, 2016. A random sample of panelists was invited to complete the survey from a large representative panel of Canadians, recruited and managed by Research Now, one of the world’s leading provider of online research samples.
The Marketing Research and Intelligence Association policy limits statements about margins of sampling error for most online surveys. The margin of error for a comparable probability-based random sample of the same size is +/- 2.6%, 19 times out of 20 for each province’s sample. The data were weighted according to census data to ensure that the sample matched Canada’s population according to age, gender, educational attainment, and region. Totals may not add up to 100 due to rounding.
ABACUS DATA
We offer global research capacity with a strong focus on customer service, attention to detail and value added insight. Our team combines the experience of our Chairman Bruce Anderson, one of Canada’s leading research executives for two decades, with the energy, creativity and research expertise of CEO David Coletto, PhD.
We like where we live, but we see more signs of pressure than improvement
Abacus recently completed an in-depth nationwide LIFE IN CANADA’S COMMUNITIES study for the Federation of Canadian Municipalities. This release is the second in a series of story lines based on this study.
COMMUNITIES FEELING SOME PRESSURES
Feeling good about the communities we live in is the norm across Canada: the large majority in our survey say they live in good place, one of the best, or the best in Canada.
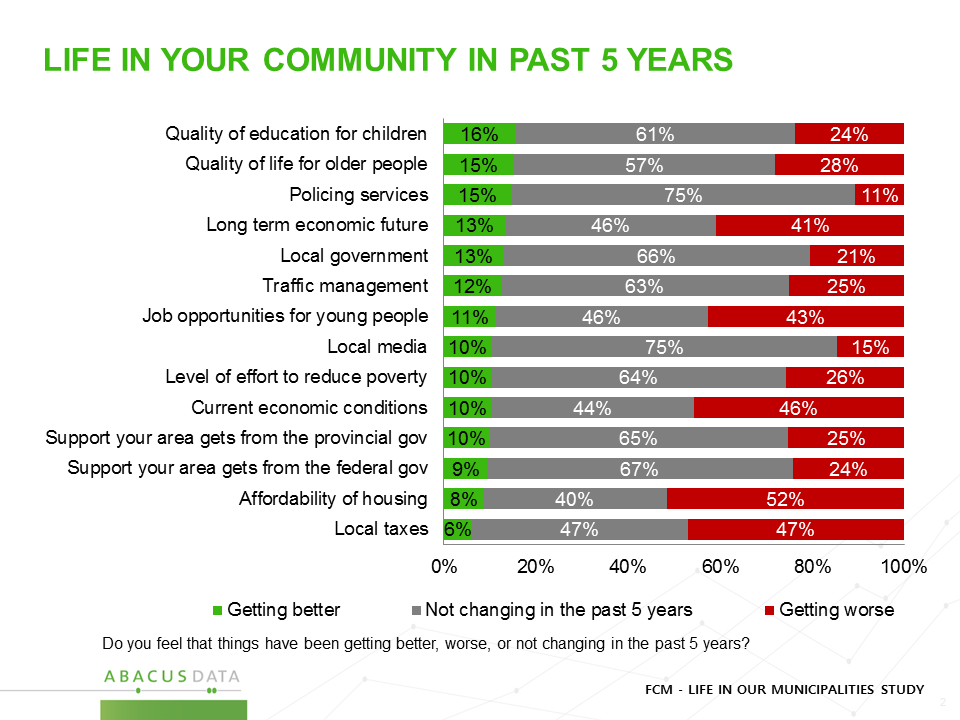
However when we asked people what was getting worse or getting better across 29 different aspects of community life, we found that:
• On only 5 of the 29 items did more than 20% say that things were getting better. On 20 items more than 20% said things were getting worse.
• 32% said their quality of life was improving, double the number that said it was deteriorating.
• 20% said their economic opportunities were improving, while 24% said the opposite.
• The items where more than a fifth said things were getting better included: recreational areas and services, garbage and waste management, and public transit.
• There were 5 items where more than 40% said things were getting worse: affordability of housing, local taxes, current economic conditions and future outlook, and job opportunities for young people.
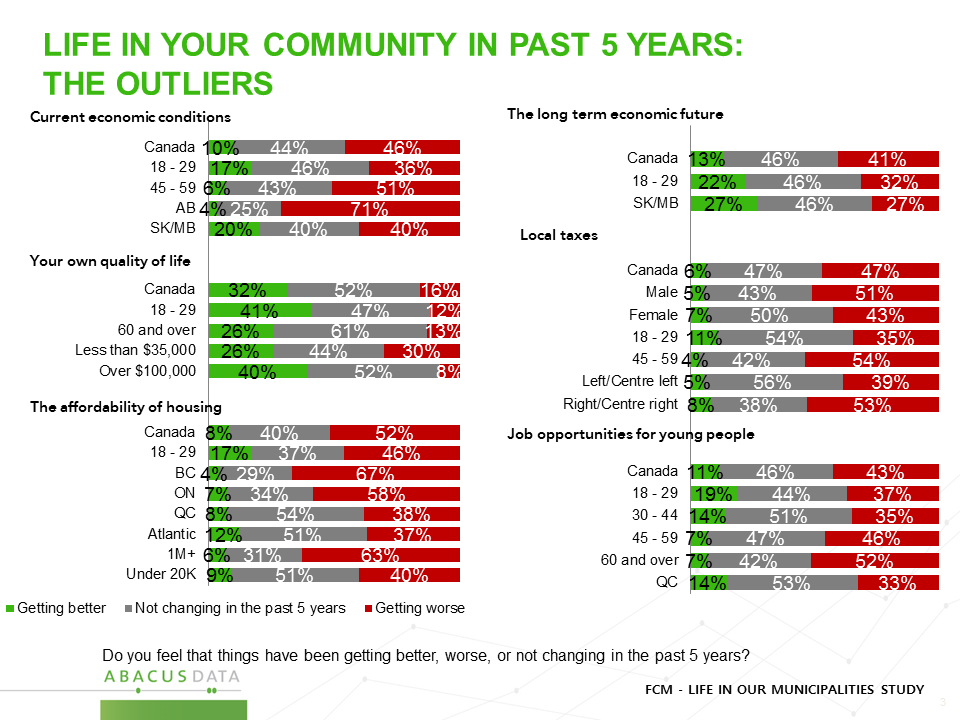
For the most part perceptions about whether things are getting better or worse in the past 5 years are fairly consistent across age groups. But there are a number of outliers.
• Albertans are far more likely to say that current economic conditions have gotten worse, at 71% compared to 46% nationally. • Residents of the largest cities, and those in BC and Ontario are more likely to cite deteriorating housing affordability. • When it comes to job opportunities for young people, older generations show more worry than the young.
PRIORITIES FOR GOVERNMENTS
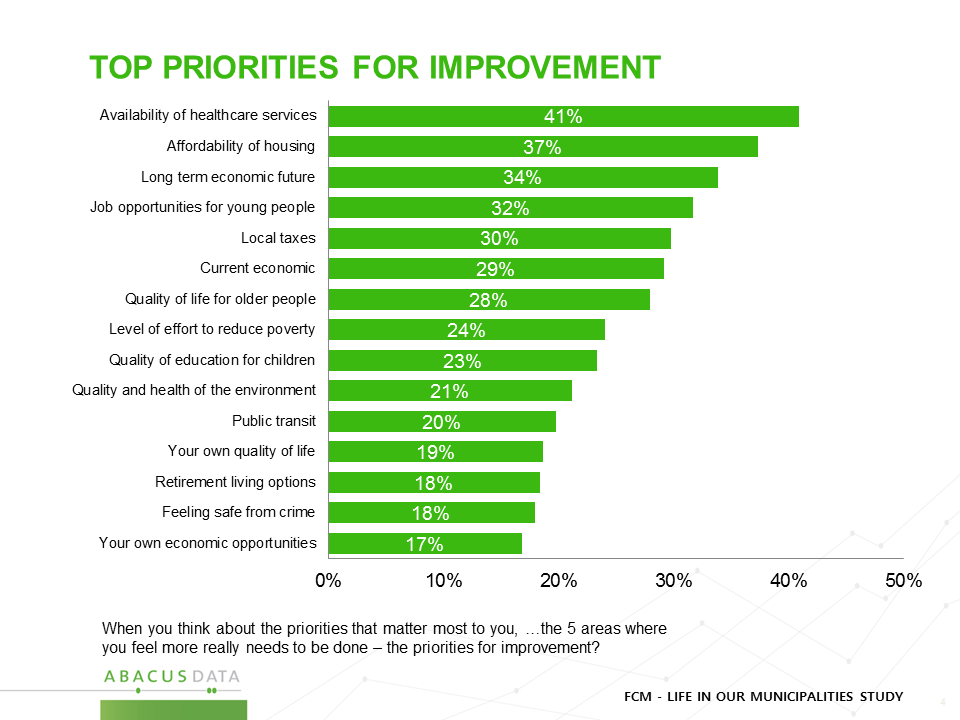
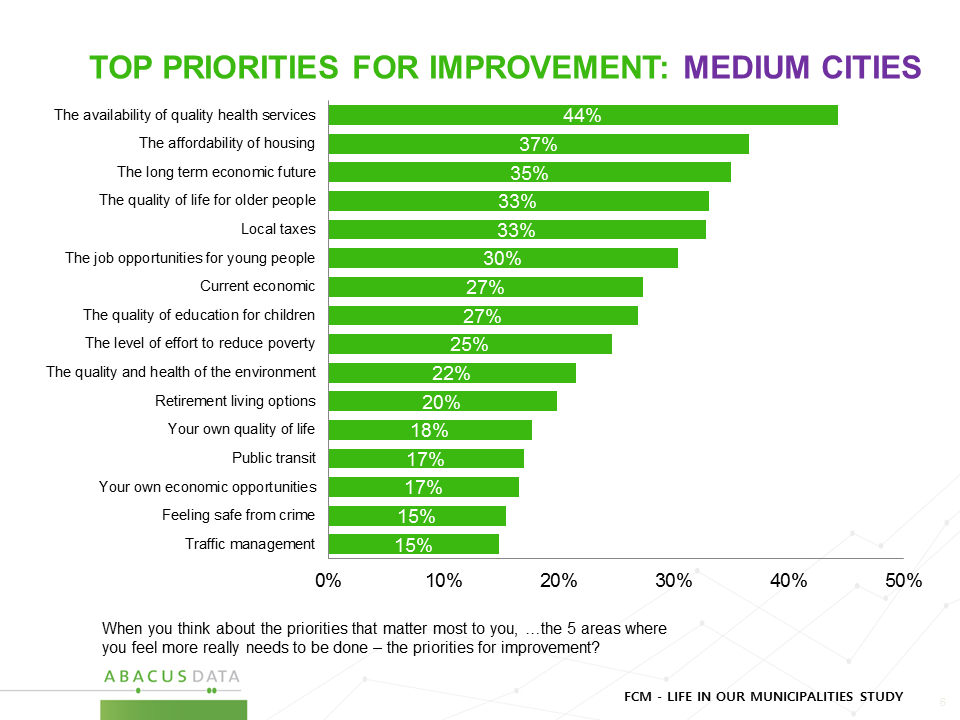
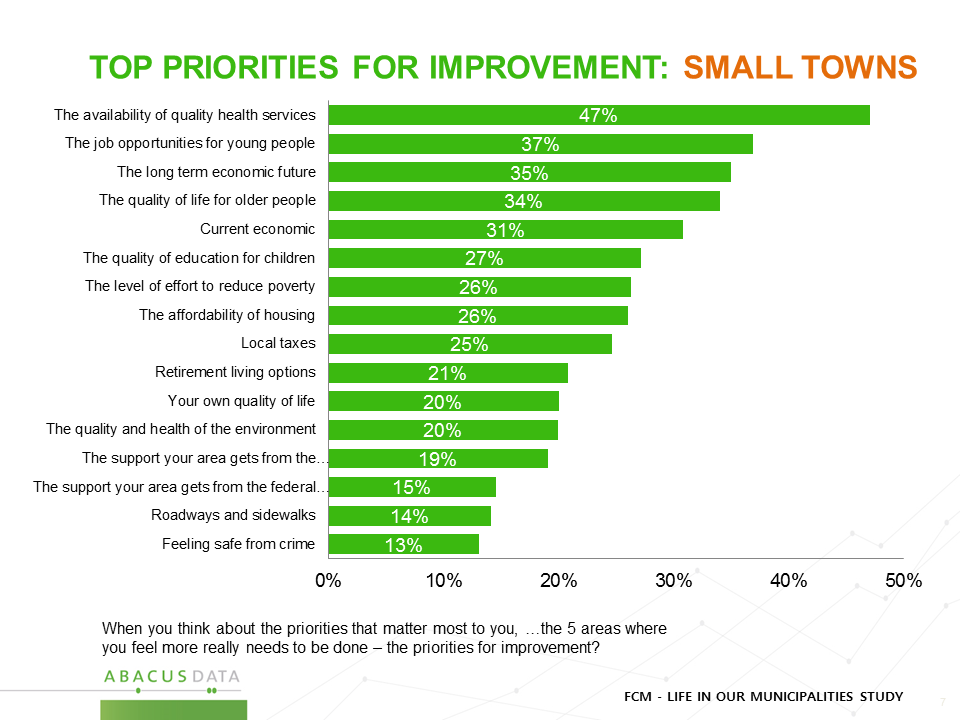
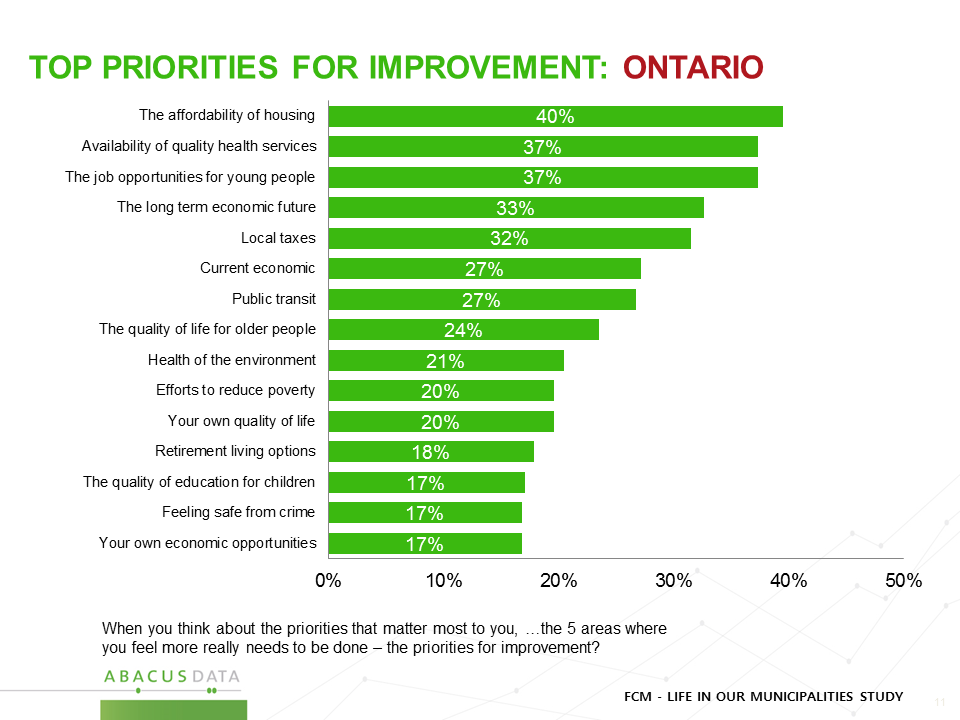
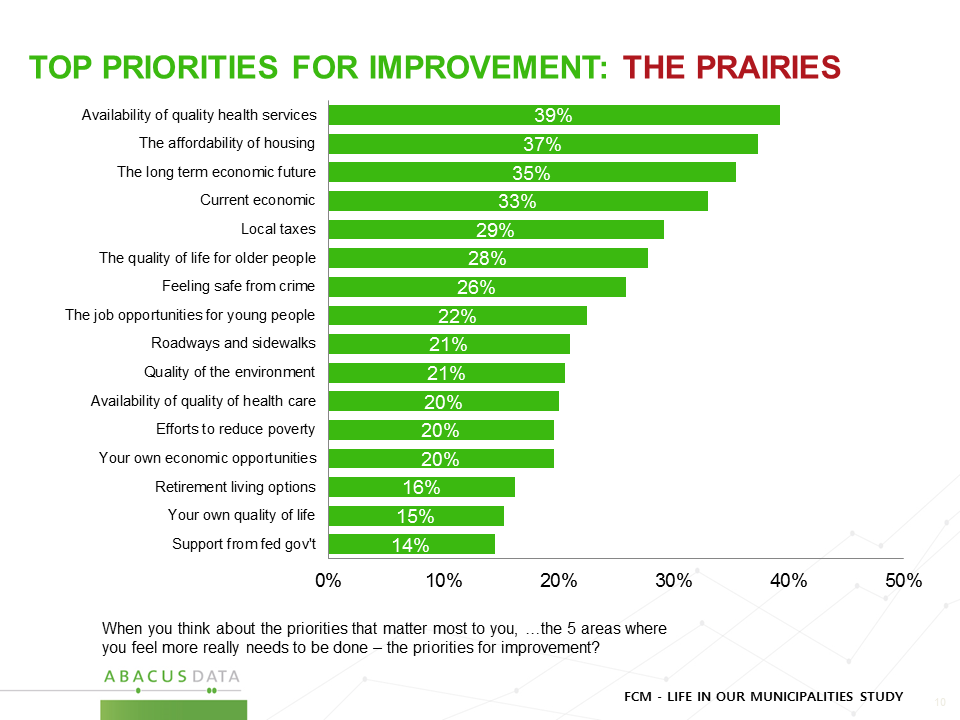
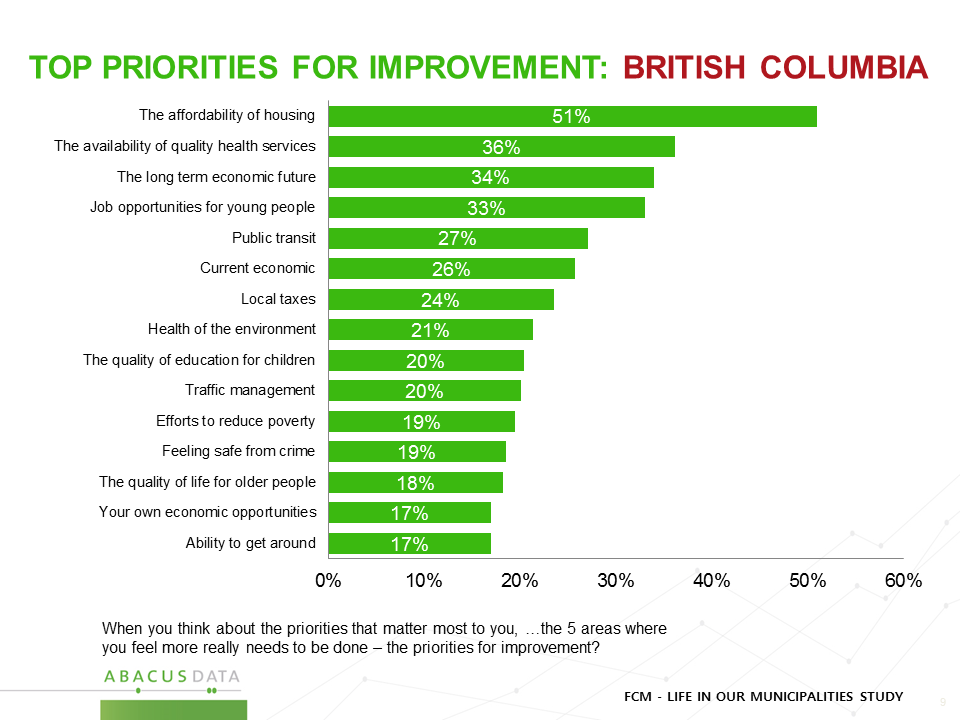
Of the 29 items we asked respondents to identify which were the most important priorities for improvement, the 5 areas where they feel more really needs to be done. The items that rose to the top of the list were: availability of healthcare services, affordability of housing, long term economic opportunities, opportunities for young people, and local taxes. But not all Canadians would have the same priority list:
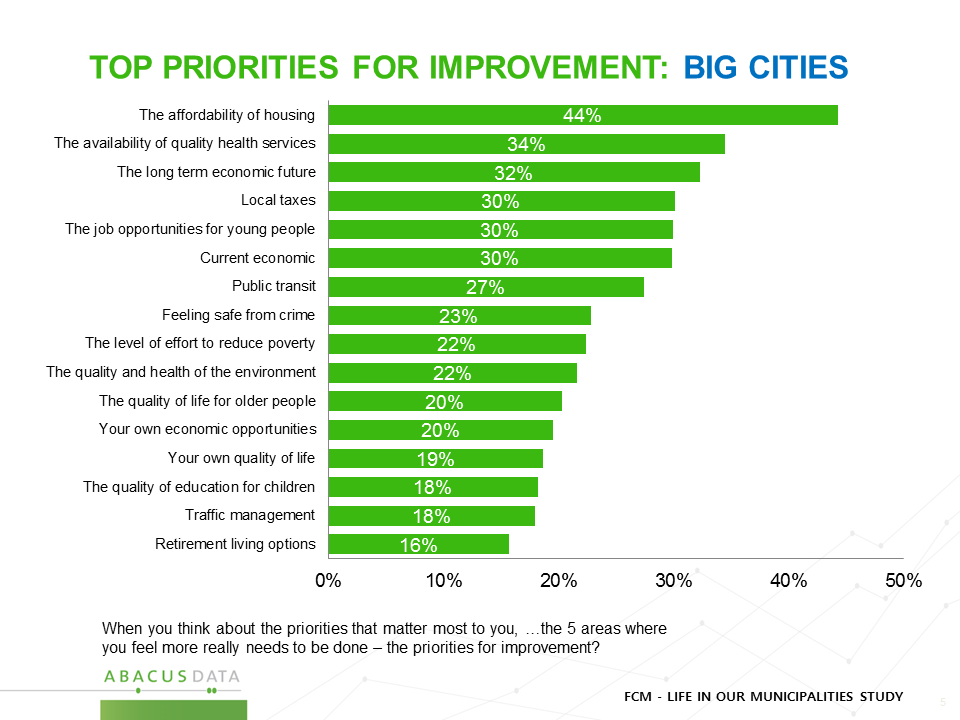
• Those living in Canada’s largest communities are more likely to rate affordability of housing, health services, long-term economic growth and local taxes as top priorities. They are also more likely to cite public transit as a priority.
• For those in medium sized communities, health is the top priority, followed by housing affordability, long-term economic growth, and the quality of life for older people.
• In smaller towns, health services are the top priority for more people but job opportunities for young people rise to the second most chosen priority, followed by long-term economic opportunities and the quality of life for older people.
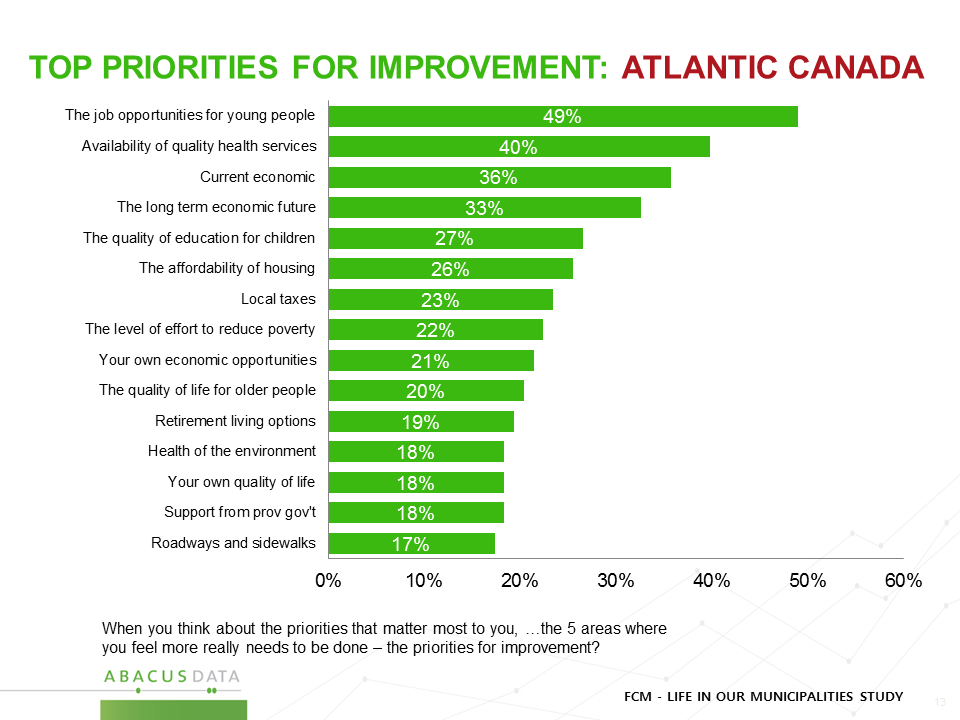
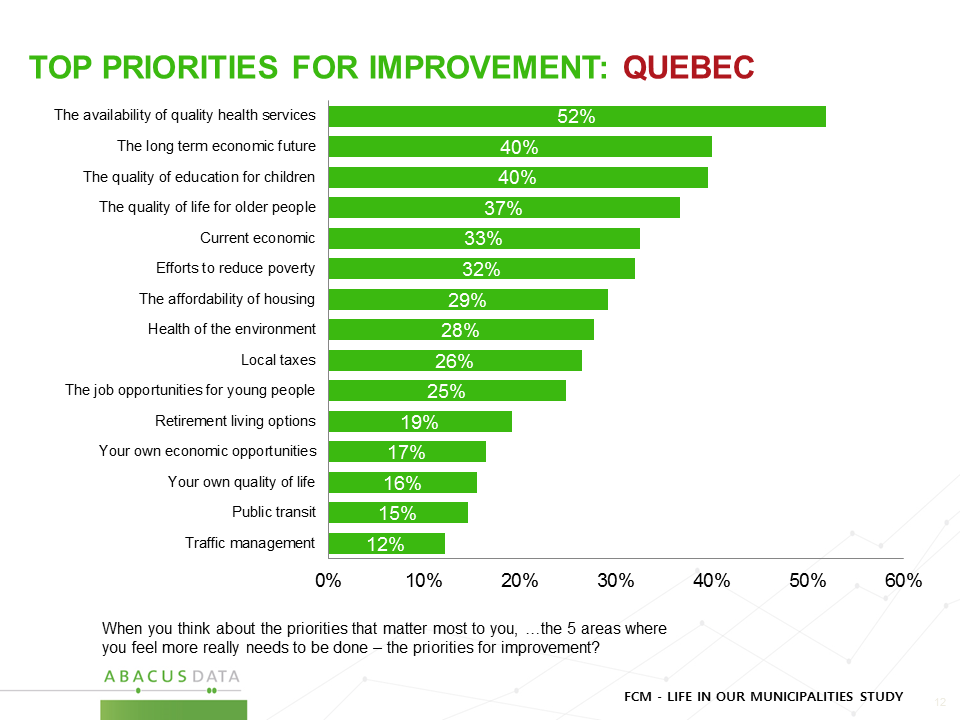
The ordering of priorities also differs depending on the region of the country one lives.
• In Atlantic Canada, 49% said job opportunities for young people was one of their top 5 priorities, higher than in any other region of the country.
• In Quebec, health services, long-term economic future and quality of education were the top priorities.
• Ontarians showed more preoccupation with affordability of housing, health care, and job opportunities for young people. Public transit was also a priority to more people than in other regions of the country.
• In the Prairies, health care, housing affordability and economic conditions were the top concerns.
• In BC, half of respondents rated housing affordability as a top priority (highest in Canada) followed by health services and the long-term economic future and jobs for young people.
THE UPSHOT
While most people are on the whole happy with the place that they live, there are clearly areas where they feel pressures have been mounting. As one might expect in a country as large and diverse as Canada, these pressure points and priorities are not identical in every part of the country or among all social groups.
That said there is more in common than not. People are nervous about rising housing costs, affordability of local taxes, current and long term economic conditions, and job prospects for young people. In some areas, housing affordability is more acute, in other areas, access to health services, public transit, or affordable education is a more pressing concern.
METHODOLOGY
Our survey was conducted online with 1,500 Canadian respondents from January 24 to January 26, 2016. A random sample of panelists was invited to complete the survey from a large representative panel of Canadians, recruited and managed by Research Now, one of the world’s leading provider of online research samples.
The Marketing Research and Intelligence Association policy limits statements about margins of sampling error for most online surveys. The margin of error for a comparable probability-based random sample of the same size is +/- 2.6%, 19 times out of 20 for each province’s sample. The data were weighted according to census data to ensure that the sample matched Canada’s population according to age, gender, educational attainment, and region. Totals may not add up to 100 due to rounding.
ABACUS DATA
We offer global research capacity with a strong focus on customer service, attention to detail and value added insight. Our team combines the experience of our Chairman Bruce Anderson, one of Canada’s leading research executives for two decades, with the energy, creativity and research expertise of CEO David Coletto, PhD.


