CLIMATE, CARBON, AND PIPELINES: A PATH TO CONSENSUS?

PdfExport

In our latest survey, in the wake of the federal announcement of a floor price on carbon, we explored questions around the federal government’s approach to energy and climate change. Here’s what we found:

• Roughly two out of three (63%) believe Mr. Trudeau is on the right track when it comes to his overall approach to reducing emissions and combat climate change, including two-thirds support in BC, Ontario, Quebec and Atlantic Canada. In Alberta, 35% say the government is on the right track, as do 28% in Saskatchewan . (caution re small sample size)

• The government direction is supported by 81% of Liberal Party voters, 64% of NDP and 32% of Conservative voters.

NATIONAL CARBON TAX

Respondents were given a brief description of the federal approach to carbon taxation, and here is what we learned:

• 35% said they thought the federal approach was a good one, and another 34% said it was acceptable. Roughly one in three (31%) said it was a poor approach.

• Acceptance (good plus acceptable) of the carbon tax is the majority view in every part of Canada but the Prairies, including 72% in BC, 73% in Ontario, 80% in Quebec and 72% in Atlantic Canada. In Alberta, 63% think the federal approach is a bad idea, and in Saskatchewan, 68% have a negative reaction.

• Across partisan lines, 85% of Liberals, 75% of NDP supporters, and 36% of Conservative supporters say the federal tax approach is good or acceptable. Support is highest among younger people but is the majority view across all age groups.

BROADER ENERGY TRANSITION PLAN

We then asked how people would feel about a plan to “shift Canada’s energy use over the coming decades, including incentives to promote cleaner transportation and buildings, and pricing carbon to encourage a shift towards greater use of cleaner energy.”

• 86% support or can accept a plan along these lines, including majorities in every region of the country, including substantial majorities in the Prairies and across party lines.

BROADER ENERGY TRANSITION PLAN PLUS A PIPELINE

We then asked, “let’s imagine that while putting in place these measures to encourage a shift to renewable energy, the federal government also approved a new pipeline to get Canada’s oil and gas to new markets, would you strongly support, support, accept, oppose, or strongly oppose such a decision?”:

• Three out of four (76%) would support (41%) or accept (35%) this decision.

• Majorities in every region support or could accept this approach, including a striking 92% in Alberta and 83% in Saskatchewan, and the very large majority of Conservative voters (87%). A majority (62%) of NDP voters would go along with this decision.

A closer look at the interaction of different policy measures shows that:

• Among those who think the federal government is on the right track on energy and climate, 23% would shift oppose a policy mix that includes a pipeline.

• Among those who say the federal government is on the wrong track, 48% say they would become supportive of a policy mix that includes a pipeline.

• Among those think the national carbon price is a good idea, 23% say they would shift to oppose a policy mix that included a pipeline.

• Among those who think the national carbon price is a bad idea, 52% say they would shift to support a policy mix that includes a pipeline.

THE UPSHOT

According to Bruce Anderson:

“Few things are more politically charged in Canada these days than the mixture of policies the federal government may embrace to combat climate change and to support economic activity in the oil and gas sector.

So far, Ottawa is holding a relatively broad measure of support for its policy approach, including the introduction of a floor price for carbon emissions. However, voters in Alberta and Saskatchewan are clearly outside this consensus.

Going forward, the numbers suggest there is a path to creating more comprehensive national support, with a blend of carbon pricing, incentives to promote a shift in energy use, and adding pipeline capacity to get Canada’s oil to markets while a shift towards more renewable energy is underway.

While different elements of such a policy mix would likely attract criticism from different quarters, if the question is whether it is possible to carry a majority of support in every region of the country, taking into account competing interests and visions, the evidence is that this is in fact possible, in theory at any rate.”

METHODOLOGY

Our survey was conducted online with 1,500 Canadians aged 18 and over from October 7 to 12, 2016. A random sample of panelists was invited to complete the survey from a large representative panel of over 500,000 Canadians.

The Marketing Research and Intelligence Association policy limits statements about margins of sampling error for most online surveys. The margin of error for a comparable probability-based random sample of 2,010 is +/- 2.6%, 19 times out of 20.

The data were weighted according to census data to ensure that the sample matched Canada’s population according to age, gender, educational attainment, and region. Totals may not add up to 100 due to rounding.

ABACUS DATA INC.

We offer global research capacity with a strong focus on customer service, attention to detail and value-added insight. Our team combines the experience of our Chairman Bruce Anderson, one of Canada’s leading research executives for two decades, with the energy, creativity and research expertise of CEO David Coletto, Ph.D.
WHAT IS THE ROLE OF PARAMEDICS IN CANADA’S HEALTHCARE SYSTEM?

PdfExportBackground

On behalf of the Paramedic Association of Canada, Abacus conducted an extensive online nationwide study of Canadians’ views of healthcare and the role of paramedics. The sample size was 2,181 adult Canadians and the survey was conducted from September 9 to 12, 2016.

What issues in the healthcare system most concern Canadians?

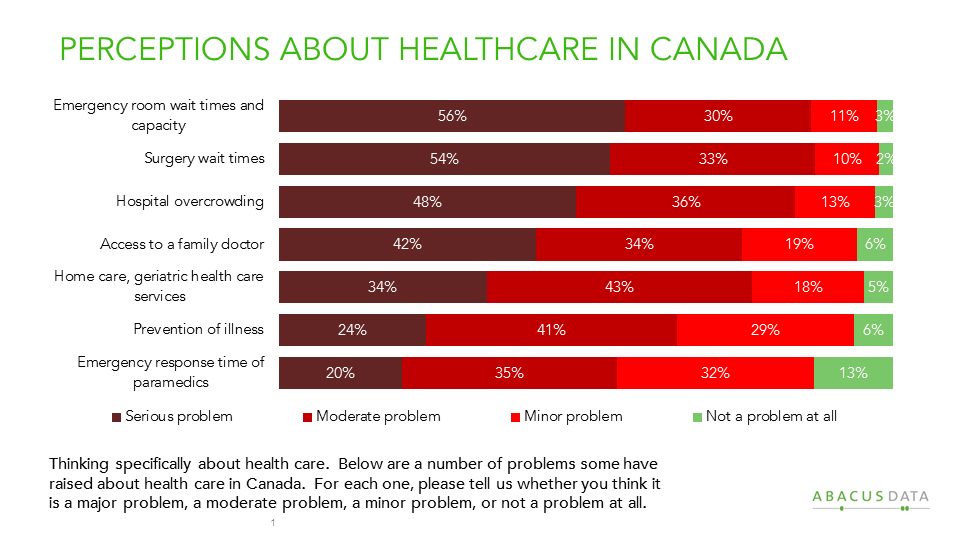
Emergency room wait times and capacity, surgery wait times, and hospital overcrowding are issues in which a majority or close to a majority of Canadians consider a serious problem in the healthcare system. Access to a family doctor is also considered a serious problem by four in ten Canadians.

Comparatively, home care, geriatric health care services, prevention of illness and the emergency response time of paramedics are less likely to be considered serious problems in the system.

slide1

There was little regional variation in perceptions about the problems except for:
• Quebecers were more likely to consider emergency room wait times (71%), hospital overcrowding (65%), and access to a family doctor (68%) a serious problem.
• British Columbians were more likely to be concerned about hospital overcrowding (51% serious problem) and access to a family doctor (47% serious problem).
• Atlantic Canadians were more likely to believe that surgery wait times (61%) and emergency room wait times and capacity (62%) were serious problems.

The survey also found that older Canadians are more likely to think the health care issues identified were serious problems in Canada. In particular, 66% of those aged 60 and over believed that surgery wait times were a major problem, 25 points higher than those aged 18 to 29.

2 in 3 Canadians believe that paramedics play a central role in the healthcare system.

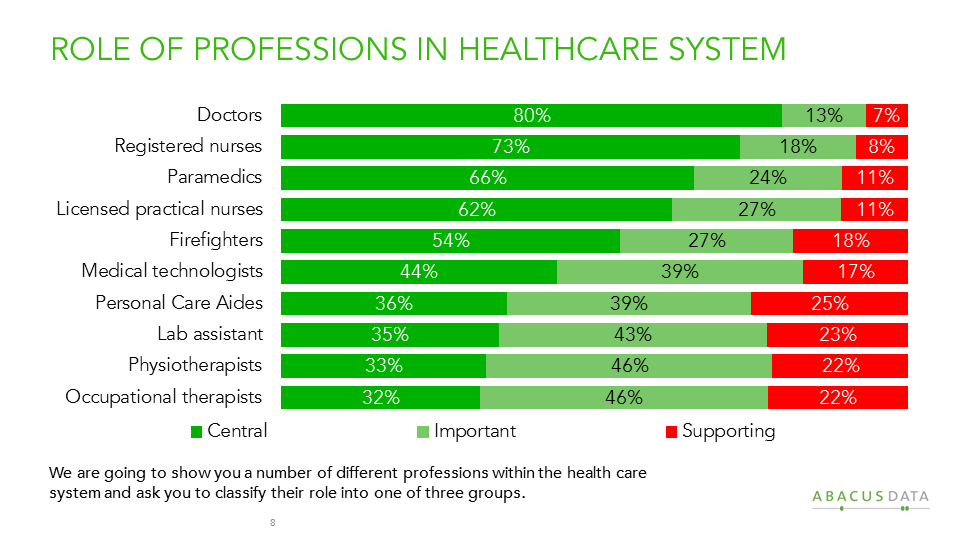
Respondents were asked to classify whether a number of professions played a central role, an important role, or a supporting role in the healthcare system.

Overall, 80% of Canadians believed that doctors play a central role followed by registered nurses (73%) and paramedics (66%). In total 90% of Canadians believed that paramedics play either a central role in Canada’s healthcare system or an important role.

The views about paramedics are consistent across the country although older Canadians and those who have been treated by a paramedic were more likely to consider paramedics central to the healthcare system.

slide8

Paramedics are as trusted as doctors or nurses to make on-the-spot medical decisions.

When asked to what extent they trust doctors, nurses, and paramedics to make on-the-spot medical decisions about their personal health, six in ten (61%) Canadians said they had high trust in paramedics compared with 64% for nurses and 70% for doctors.

Once again, these views were strongly related to one’s age. Older Canadians were more likely to trust paramedics to make on-the-spot medical decisions than younger Canadians. There was no variation across region or gender.

slide9

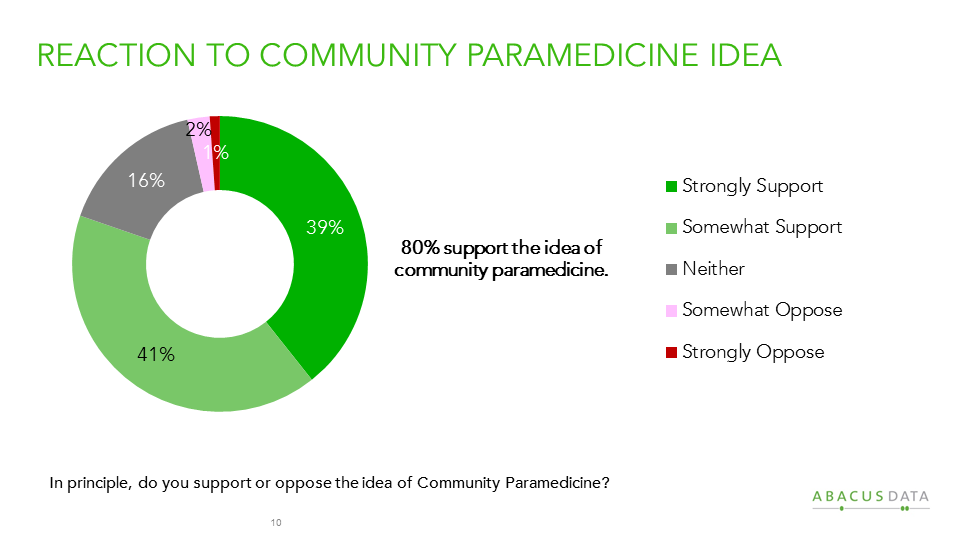
80% of Canadians support the idea of Community Paramedicine.

Respondents were shown the following description of community paramedicine and asked whether they support or oppose the idea of community paramedicine:

Traditionally, paramedics are trained to respond to emergency 911 calls, treat patients who are ill and/or injured, and transport patients to emergency departments. However, not all patients require transportation to an emergency department. Many simply need a basic health assessment, minor treatment, and referral to an appropriate community, or other health care service.

Community Paramedicine is about engaging paramedics in non-traditional roles to assist in delivering health care to urgent and non-urgent, but not life threatening situations. By expanding the role of paramedics, and working collaboratively with other health care professionals and community agencies, paramedics can manage patients who do not require immediate treatment and transportation to an emergency department.

Under a Community Paramedicine model, paramedics will continue to respond to medical emergencies and provide non-urgent medical care within the community and at patients’ homes.

Overall, 80% of Canadians we surveyed either strongly support (39%) or somewhat support (41%) the idea of community paramedicine as presented in the survey. Only 3% are opposed to it and the remaining 16% said they neither support nor oppose it.

Support for the idea is consistent across the country and is particularly popular among women – 46% of whom strongly support the idea of community paramedicine.

slide10

9 in 10 Canadians think paramedics should be invited to participate in negotiations over a new national Health Accord.

Finally, respondents were asked whether a number of health professionals should be invited to participate in negotiations around a new health accord between the federal and provincial governments. Overall, a large majority of Canadians believe that doctors (92%), nurses (91%), and paramedics (90%) should be around the table.

slide11

The Upshot

Health care remains a top concern for many Canadians, especially at it relates to capacity and access issues in emergency rooms, hospitals, and access to a family doctor. Given these concerns, Canadians recognize and value the role that paramedics can play in improving access and outcomes for Canadian patients.

Paramedics in Canada are well regarded, trusted, and seen as central to the health care system. There is almost no resistance to the concept of community paramedicine and large numbers of Canadians enthusiastic support it, especially women who value the peace of mind knowing that their loved ones will be cared for if a medical emergency or situation arises.

Given the reputation of the process and the role Canadians see paramedics playing, it should be no surprise that the public thinks they should be part of the national discussion about the future of healthcare and be invited to be part of the negotiations around a new national health accord.

Methodology

The survey, commissioned by the Paramedic Association of Canada, was conducted online with 2,181 Canadians aged 18 and over from September 9 to 12, 2016. A random sample of panelists was invited to complete the survey from a large representative panel of over 500,000 Canadians, recruited and managed by Research Now, one of the world’s leading provider of online research samples.

The Marketing Research and Intelligence Association policy limits statements about margins of sampling error for most online surveys. The margin of error for a comparable probability-based random sample of the same size is +/- 2.1%, 19 times out of 20. The data were weighted according to census data to ensure that the sample matched Canada’s population according to age, gender, educational attainment, and region. Totals may not add up to 100 due to rounding.

Paramedic Association of Canada

The Paramedic Association of Canada is a voluntary professional organization of paramedicine practitioners in Canada. Its missions is to provide quality care for the public through leadership in the advancement of the profession of paramedicine. For more information, contact Pierre Poirier at pierre.poirier@paramedic.ca, or visit their website at http://www.paramedic.ca/

Abacus Data Inc.

We offer global research capacity with a strong focus on customer service, attention to detail and value-added insight. Our team combines the experience of our Chairman Bruce Anderson, one of Canada’s leading research executives for two decades, with the energy, creativity and research expertise of CEO David Coletto, Ph.D. For more information, visit our website at http://www.abacusdata.ca/

WHO’S AFRAID OF A CARBON TAX? NOT SO MANY.

PdfExport

In our latest survey of national opinion, we explored questions around using a price or tax on carbon to help combat the challenge of climate change. Here’s what we found:

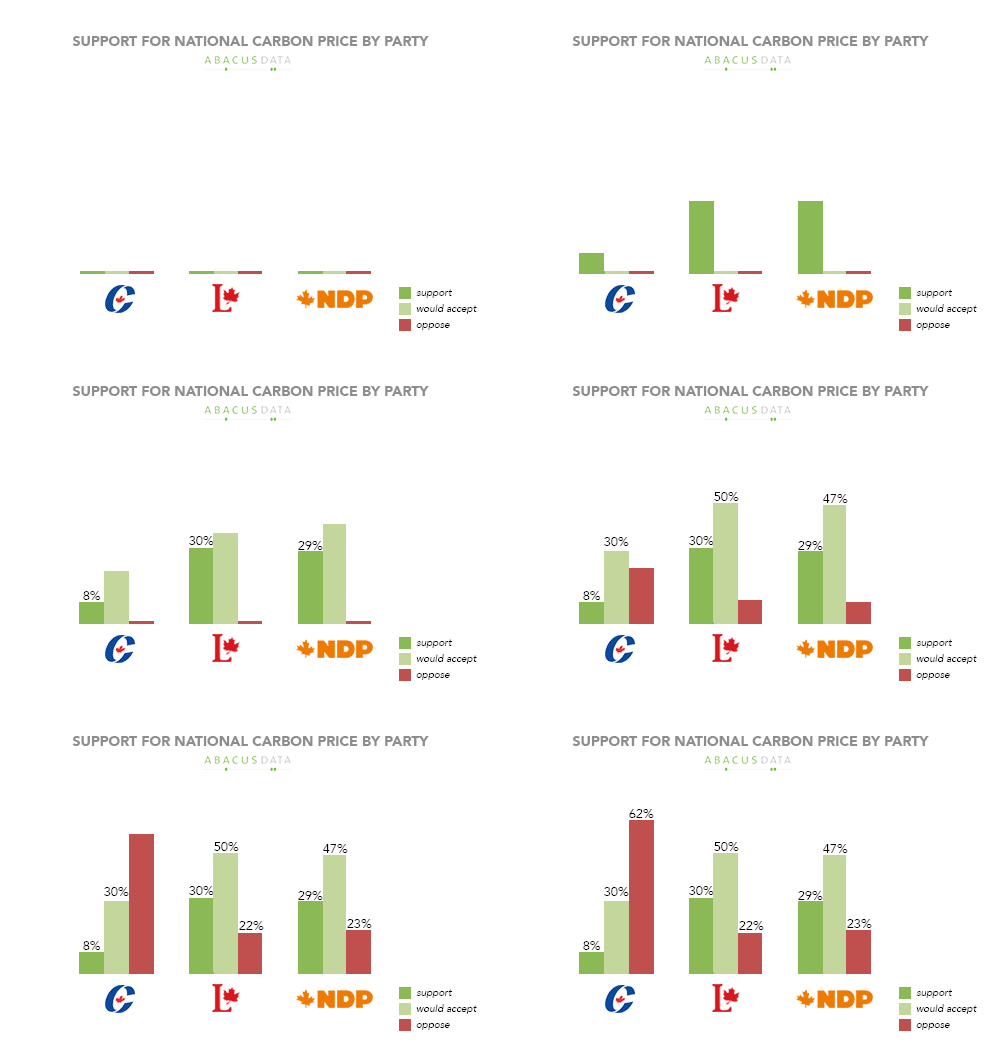
• Few people generally ask for taxes of any sort, and so it was perhaps not surprising that only 25% across the country “favour” a carbon price or tax. What was more interesting to us is the fact that not very many oppose the idea (31%). The plurality say can accept the taxation of carbon emissions.

• Liberal and NDP supporters see this more or less the same way (77% to 79% support or accept), while 62% of Conservative voters are opposed to the idea. Younger people are more supportive, but the majority of those over 45 also say they support or can accept it.

abacus-chart-national-carbon-price-1

• Majorities in every region of the country support or accept the idea, although Alberta is essentially equally divided when a margin of error is considered.

• A major reason why opposition to a carbon tax is modest lies in the fact that most people don’t think it will be harmful to the national economy or the economy of their province. The exception again is Alberta, where 54% anticipate carbon taxes will weaken the national economy and 60% say that will happen to their provincial economy.

• Across the country, 20% say carbon taxation will end up strengthening the economy, 26% weakening, and 49% it would have no real impact.

THE UPSHOT

Bruce Anderson: “For several years, the idea of a carbon tax has been a political football. Advocates say it is essential while critics have labelled it a job-killing tax on everything.

As the country prepares to move ahead with a national carbon pricing policy, it’s useful to look at the net effect of this political debate so far. Because people rarely avoid the opportunity to oppose a new tax, it’s hard not to notice that only 31% oppose this particular idea.

Some believe that taxation will be an important behavioural nudge on an issue that is important to them. But more of the acquiescence that it evident in this poll has to do with a lack of fear of the consequences: most simply don’t buy that a carbon price need wreak havoc on the economy.

There is a different calculation in Alberta, and among Conservative voters. However even within those two subgroups of the population, sizeable minorities are willing to accept or support the idea of using carbon pricing to encourage a shift in behaviour.

There will be challenging parts of this debate ahead for the government – including the price point, the relationship with the provinces, and any adjustments for energy-intense, trade-exposed industries – but our polling in overall terms suggests latitude for the federal government to move in this direction.”

METHODOLOGY

Our survey was conducted online with 2,010 Canadians aged 18 and over from August 22 to 25, 2016. A random sample of panelists was invited to complete the survey from a large representative panel of over 500,000 Canadians.

The Marketing Research and Intelligence Association policy limits statements about margins of sampling error for most online surveys. The margin of error for a comparable probability-based random sample of 2,010 is +/- 2.2%, 19 times out of 20.

The data were weighted according to census data to ensure that the sample matched Canada’s population according to age, gender, educational attainment, and region. Totals may not add up to 100 due to rounding.

ABACUS DATA INC.

We offer global research capacity with a strong focus on customer service, attention to detail and value-added insight. Our team combines the experience of our Chairman Bruce Anderson, one of Canada’s leading research executives for two decades, with the energy, creativity and research expertise of CEO David Coletto, Ph.D.
WHAT DO WE LOOK FOR IN A POLITICAL LEADER? PART 2

As the Conservative and New Democratic parties are in the process of choosing new leaders, we asked Canadians about the qualities they would want to see in a political leader.

We gave people a list of 34 potential qualities and asked them to decide which ones were “must haves”, “nice to haves” or less important than that. What did we find?

The 8 most broadly considered “must haves” (45% or more said it was a must have):

• Understand different parts of the world
• Think a lot about the future of the world
• Think about what’s right for the next generation
• Be open minded about different lifestyles
• Care about the poor
• Ask for help when you need it
• Seek advice from smart people everywhere
• Apologize when you make a mistake

Among the other interesting things in the results:

• 41% say speaking both official languages is a must have. That masks a large gap between Francophones (68%) and Anglophones (32%).

• Always being polite and thoughtful with others is more highly sought than someone who never backs down and always looks strong.

• Few people care greatly if a leader comes from either an accomplished or less affluent family, loves the outdoors or music, books, and the arts.

When we combine the things people say are “must haves” with “really like to have” here are some other points that stand out.

• Thinking about what’s right for the next generation and understanding different parts of the world are at the very top of the list. As a point of context, almost 80% say these are must or really like to have qualities, while only 44% say that about knowledge “about how to make a buck” or make a payroll.

• Almost as highly rated are seeking advice from smart people (76%), asking for help when you need it (75%), and apologizing for a mistake (74%). This suggests that people value humility and open-mindedness more than the idea of the perfectly formed, strong leader who never blinks or reconsiders an action or idea.

• The notion that leaders are expected to come from perfect, close-knit families is not of great importance to most Canadians. It ranked 30th of the list of 34 items.

Over the next few days, we’ll dig into this data to show how our criteria for leaders varies depending on gender, generation, political inclination.

THE UPSHOT

Bruce Anderson: “Political commentary for years has included a lot of conventional wisdom about what people like in leaders. Much of it has suggested that we prefer people from accomplished backgrounds, people who are self-possessed. Leaders with a plan, and great determination in the face of resistance. How many times has strong leadership been equated with never apologizing?

These results suggest a different and more nuanced reality. They reveal that we like people with open, curious minds. We want leaders who think about the bigger picture and the longer term. Leaders who seek out and want to hear good ideas from other people. We value politeness over manifestations of power – and we believe that saying you’re sorry when you should is no weakness, rather a virtue.”

METHODOLOGY

Our survey was conducted online with 2,010 Canadians aged 18 and over from August 22 to 25, 2016. A random sample of panelists was invited to complete the survey from a large representative panel of over 500,000 Canadians.

The Marketing Research and Intelligence Association policy limits statements about margins of sampling error for most online surveys. The margin of error for a comparable probability-based random sample of 2,010 is +/- 2.2%, 19 times out of 20.

The data were weighted according to census data to ensure that the sample matched Canada’s population according to age, gender, educational attainment, and region. Totals may not add up to 100 due to rounding.

Abacus Data Inc.

We offer global research capacity with a strong focus on customer service, attention to detail and value-added insight. Our team combines the experience of our Chairman Bruce Anderson, one of Canada’s leading research executives for two decades, with the energy, creativity and research expertise of CEO David Coletto, Ph.D.

WHAT DO WE LOOK FOR IN A POLITICAL LEADER?

As the Conservative and New Democratic parties are going to choose new leaders, we asked Canadians about the qualities they would want to see in a political leader. This more detailed work will be released in the next few days.

But first, we wanted to highlight the results of two questions, dealing with the age and gender of a political leader. Here’s what we asked:

1. If the choice of a new leader for a political party came down to a man or a woman, and both were equally qualified, would you pick the man or the woman?

2. If the choice of a new leader for a political party came down to a person under 50 or a person over 50, would you pick the younger or older person?

Here’s what we found:

• In the gender-based contest, the woman would win (54%).

• While 31% of women would vote for the man even more (38%) of men would vote for the woman.

• Younger men and younger women tilted things about 4-5 points in favour of the female candidate, indicating that generational change is helping propel this shift in thinking.

• Conservative voters would choose the man (63%). Notably, 52% of female Conservative voters would vote for the man, 21 points higher than average. In contrast, 77% of female NDP voters and 69% of female Liberal voters would pick the woman.

• In the age-based contest, the younger candidate would win handily. By a 30-point margin (65%-35%), Canadians would prefer someone under 50.

• It is perhaps expected that younger people preferred the younger candidate, but even 50% of those 60 and older did as well.

• There was no significant gender difference on this match up.

• Again, political affiliation was a key driver in behaviour. Conservative voters were more likely to prefer the older candidate than Liberal or NDP voters. Fully half (50%) of Conservatives under 45 would pick the older candidate compared to 22% of NDP voters under 45 and 16% of Liberal voters under 45.

When we combine preferences for the age and gender of potential party leaders, we find that more Canadians prefer a young female candidate to any other combination. 37% would prefer a young female candidate, all else being equal, while 27% would prefer a combination of young and male. 20% would prefer an older male while 17% would prefer an older woman.

Conservative voters are most likely to prefer an older male candidate (43%) and least likely to prefer a younger female candidate (13%). NDP voters are most likely to prefer a younger female candidate (44%) and least likely to prefer an older male (14%).

THE UPSHOT

Bruce Anderson: “Rather than prove that stereotyping by gender or age no longer exists, these results tend to say that people still harbour some biases, but the nature of the biases has been shifting – in directions that favour younger and female candidates. It’s apparent that, as with many of the shifting social attitudes that we see today, younger generations have been leading the shift, but perhaps it’s even more remarkable that older people seem unsure that older leaders would be better.

On the gender question, the numbers suggest women have been convincing more men that they have good leadership qualities, than men have been convincing women.

The breakdowns by partisanship reveal again that Liberal and NDP voters have much in common and that both see the world and politics somewhat differently from Conservative voters.

David Coletto: “This admittedly simple study provides further evidence that Canadian voters might prefer, all else being equal, female political leaders. Remember our survey experiment in January 2015? We asked respondents to pick between images of Jane and Perry and found Jane would win hands down, even after we changed her policy positions. This more recent data confirms what we found then – all else being equal, most Canadians, except perhaps Conservative voters, would prefer the female candidate over the male one.

Add in age and we find that younger candidates are more appealing to voters generally, and especially among younger voters and those who support the NDP and Liberals. Again, Conservative voters are the exception, with a majority preferring the older candidate, including younger Conservative voters.

Does this mean female party leaders will do always better, all else being equal? Maybe. Recent provincial election results in BC, Ontario, and Alberta suggest that might be the case. Obviously there is more to a candidate than their age or sex but as we learned from our Jane vs. Perry test, a candidate’s gender might be a cue for other attributes that we want in our leaders.”

METHODOLOGY

Our survey was conducted online with 2,010 Canadians aged 18 and over from August 22 to 25, 2016. A random sample of panelists was invited to complete the survey from a large representative panel of over 500,000 Canadians.

The Marketing Research and Intelligence Association policy limits statements about margins of sampling error for most online surveys. The margin of error for a comparable probability-based random sample of 2,010 is +/- 2.2%, 19 times out of 20.

The data were weighted according to census data to ensure that the sample matched Canada’s population according to age, gender, educational attainment, and region. Totals may not add up to 100 due to rounding.

Abacus Data Inc.

We offer global research capacity with a strong focus on customer service, attention to detail and value-added insight. Our team combines the experience of our Chairman Bruce Anderson, one of Canada’s leading research executives for two decades, with the energy, creativity and research expertise of CEO David Coletto, Ph.D.

Ask us a question.  We’re here to help.

CANADIANS BULLISH ON CANADA

In our latest national survey of 2,010 Canadian adults, we asked Canadians what they thought about the potential for Canada to win new investment from around the world.

ATTRACTING INVESTMENT TO CANADA

Prime Minister Trudeau has been making a case for inbound foreign investment, and two in three (65%) are inclined to believe there are real opportunities for Canada to become a place more companies want to invest in growing. About one in three (35%) feel differently, judging the effort hopeful, but unlikely to succeed.

Majorities in every region sense real opportunities, with those living in BC (72%) and Atlantic Canada (79%) leading the bullish sentiment and Quebecers lagging (57%).

Young and old, men and women were equally optimistic about the potential.

Optimism was the majority view across the political spectrum, with Liberal voters particularly bullish, and Conservatives somewhat more skeptical than others.

8 IN 10 FEEL THIS SHOULD BE A PRIORITY FOR THE FEDERAL GOVERNMENT

Eight in ten Canadians feel that trying to attract new investment into Canada should be a major or significant priority for the federal government.

More than 3 in 4 people in every region want inbound investment promotion to be a major or significant priority for Ottawa. Conservatives, Liberals and New Democrats are unusually aligned in believing this is important work for the federal government.

WHAT WOULD ATTRACT POTENTIAL INVESTORS?

We asked respondents about Canada’s strengths or weaknesses when it comes to attracting potential investors into Canada.

• Canadians say our 5 most appealing attributes are resources (74%), energy (61%), scenery (57%), cultural diversity (56%) and tolerance of differences.

• Close behind were Canada’s law and order (51%), our universities (51%), and our cities (50%) as major strengths.

• While fewer consider them “major strengths”, large majorities felt that our knowledge of the world, and our work ethic were advantages when it comes to attracting investment.
• Our most notable perceived weaknesses were our climate and level of taxation. In the case of taxation, a slight majority see that as a weakness for Canada.

• Areas where the results suggest Canadians believe there is room to improve somewhat include our regulatory system, our transportation system, and our broadband networks. A small minority felt these were weaknesses, but few felt they were major strengths.

Looking at differences across political affiliation, we find that:

Liberal voters tend to be the most enthused about Canada’s strengths almost across the board, with Conservative voters generally less so, and NDP voters in the middle. Supporters of all three parties tend to agree on the value of our natural resources, scenery.

The biggest gap between Liberal and Conservative voters is on the value of cultural diversity and tolerance of differences.


THE UPSHOT

Bruce Anderson: “Given the geopolitical turmoil that has marked recent years, including the uncertainty surrounding Brexit, the Prime Minister’s efforts to invite global investors to consider Canada, combined with higher media profile for Canada in recent months, is an economic x-factor that bears watching closely.

Because Canadian governments have long made efforts to win global investment for Canada, it remains to be seen whether these times and these efforts by Mr. Trudeau will result in greater success – but for the moment, the large majority of people think this work is important for the federal government – and 2 out of 3 feel there are reasons to feel optimistic.

What’s interesting as well is that many Canadians sense that our strengths may start with abundant resources and energy but also include cultural diversity, a solid work ethic, and good universities. The fact that many wonder if our taxation levels are a drawback probably indicates that governments have some room to use tax incentives as part of a strategy to develop more inbound investment.

David Coletto: “Most Canadians feel optimistic that Canada can attract new investment from global companies and think the federal government should make it a significant priority. Trade missions and international trips that raise Canada’s profile and seek out new investors are things most Canadians support their political leaders doing.

There’s little we see as hurdles preventing Canada from doing better. Most recognize that our natural resources, access to energy, our diversity, and tolerance of others are assets that separate Canada from other markets. First-class universities, a good work ethic, and our stable political system are all strengths when it comes to attracting investment.

Many feel our tax rates could be lower and the weather a bit less frigid, but all in all, we generally agree that Canada has a lot to offer the world and businesses that want to invest and do business here.”

METHODOLOGY

Our survey was conducted online with 2,010 Canadians aged 18 and over from August 22 to 25, 2016. A random sample of panelists was invited to complete the survey from a large representative panel of over 500,000 Canadians.

The Marketing Research and Intelligence Association policy limits statements about margins of sampling error for most online surveys. The margin of error for a comparable probability-based random sample of 2,010 is +/- 2.2%, 19 times out of 20.

The data were weighted according to census data to ensure that the sample matched Canada’s population according to age, gender, educational attainment, and region. Totals may not add up to 100 due to rounding.

Abacus Data Inc.

We offer global research capacity with a strong focus on customer service, attention to detail and value-added insight. Our team combines the experience of our Chairman Bruce Anderson, one of Canada’s leading research executives for two decades, with the energy, creativity and research expertise of CEO David Coletto, Ph.D.
THE ECONOMIC MOOD IS WARMING

PdfExport

HEALTH OF THE CANADIAN ECONOMY

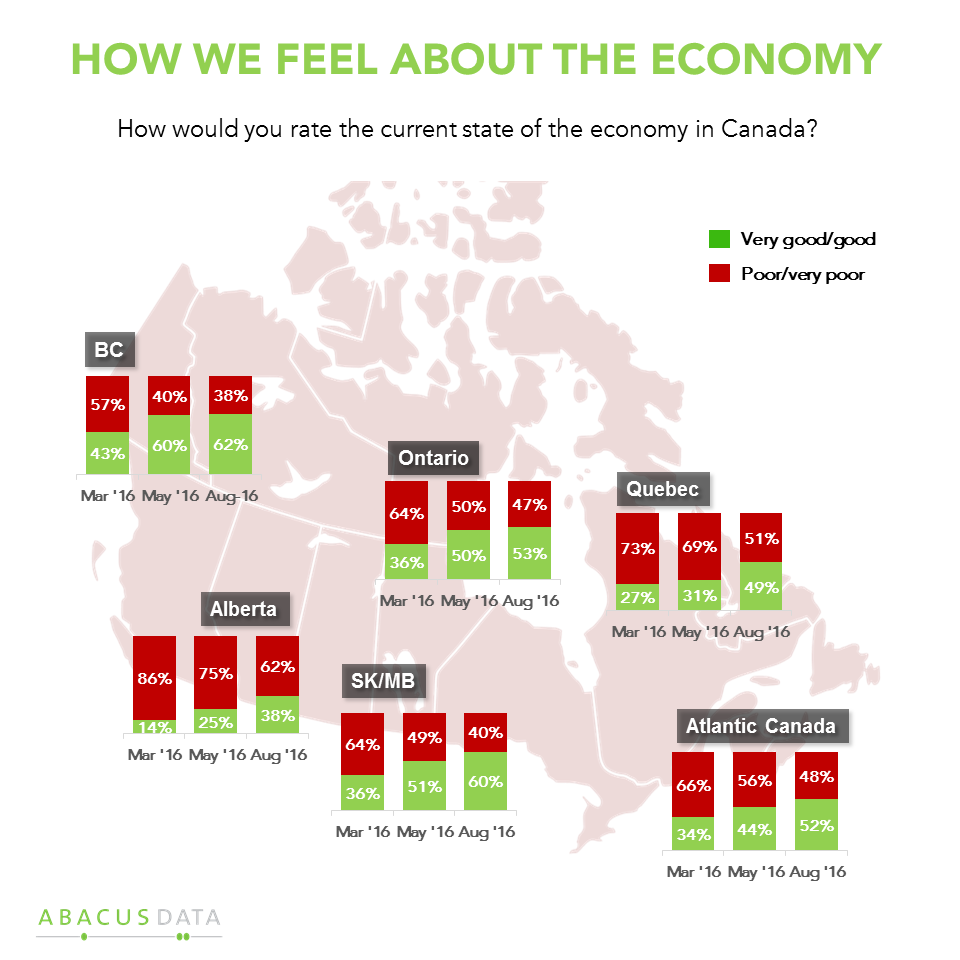
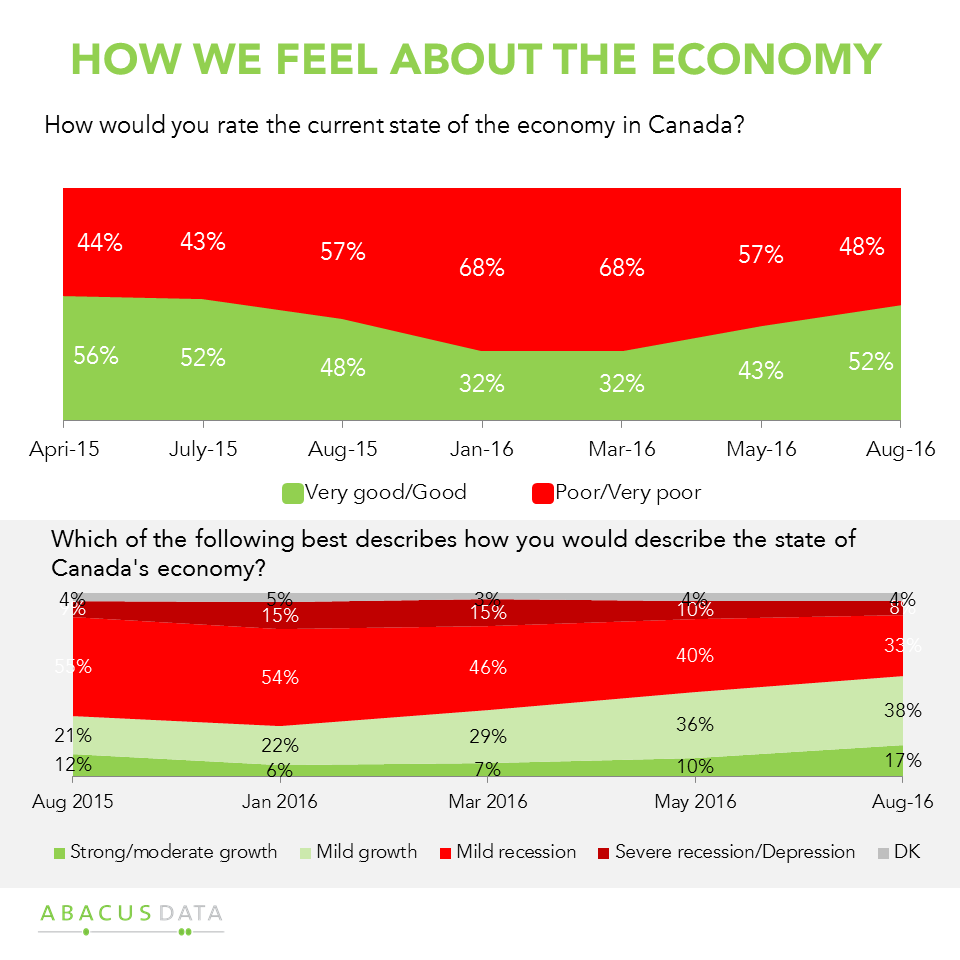
When the federal Liberals took office, the mood of Canadians on the economy was fairly gloomy: only 32% said it was in good shape. That number has climbed to 52%. In every region, feelings about the economy have improved since May. The greatest gains are in Quebec (+18), Alberta (+13), SK/MB (+9), and in Atlantic Canada (+8).

GROWTH OR RECESSION?

The number of people who saw growth in the economy hit a bottom in January, at 28%. Today, a majority say the economy is growing (55%).

OPTIMISM OR PESSIMISM ABOUT THE FUTURE?

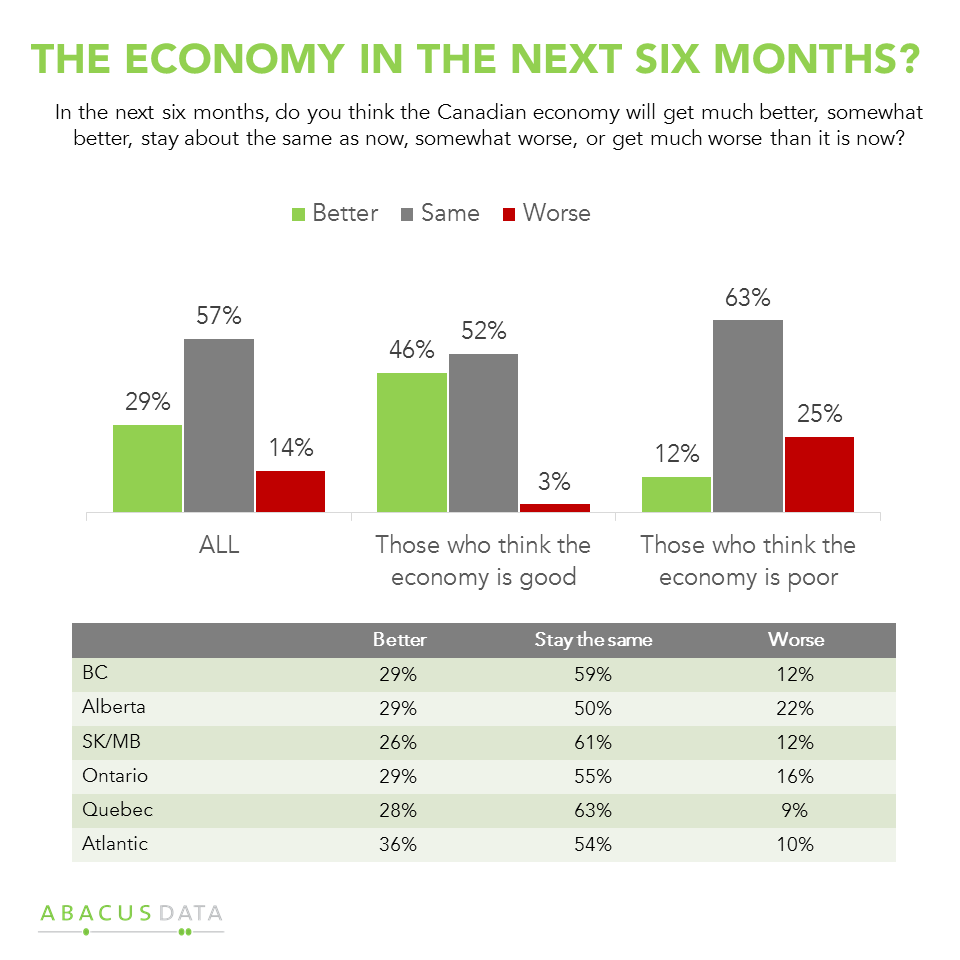
Asked to predict how the economy will do over the next six months, we find two optimists (29%) for every pessimist (14%). Optimism is greater than pessimism everywhere in the country, including in Alberta where 29% expect things to improve compared with 22% who feel things will worsen.

Worth noting is that many of those who feel good about the economy today tend to feel that even better times lie ahead. Few of those who feel the economy is in poor shape expect it to get worse – but neither do they expect it to improve.

THE UPSHOT

Bruce Anderson: “The last election saw incumbents trying to run on their economic record, even as people felt the economy was not in great shape.

While today’s results do not describe a buoyant economic mood, there is doubtless some relationship between the popularity of the new government and the feeling that the economy may be on the mend – what’s never entirely clear is whether this is a question of confidence strengthening – or fears abating – or real economic activity improving in ways that are noticeable on the ground for people.

Perhaps most interesting is that the mood in Alberta is improving, despite the fact that oil prices have only stabilized, rather than recovered. While there remains broad anxiety, there is at least more optimism than pessimism about what the future looks like.”

David Coletto: “Canadians are feeling increasingly good about the state of the economy and the prospects for the next six months. In every region of the country, the mood has improved, most noticeably in Quebec and Alberta. For the first time since July 2015, a majority of Canadians believe the Canadian economy is doing well and growing. The political implications are that the federal government may not feel public pressure to stimulate the economy through fiscal policy giving it room to focus on other parts of its agenda including innovation, healthcare, and Indigenous affairs.”

In case you missed it…

Grit support broadening with time (August 29, 2016)

METHODOLOGY
Our survey was conducted online with 2,010 Canadians aged 18 and over from August 22 to 25, 2016. A random sample of panelists was invited to complete the survey from a large representative panel of over 500,000 Canadians.

The Marketing Research and Intelligence Association policy limits statements about margins of sampling error for most online surveys. The margin of error for a comparable probability-based random sample of 2,010 is +/- 2.2%, 19 times out of 20.

The data were weighted according to census data to ensure that the sample matched Canada’s population according to age, gender, educational attainment, and region. Totals may not add up to 100 due to rounding.

Abacus Data Inc.

We offer global research capacity with a strong focus on customer service, attention to detail and value-added insight. Our team combines the experience of our Chairman Bruce Anderson, one of Canada’s leading research executives for two decades, with the energy, creativity and research expertise of CEO David Coletto, Ph.D.
Ask us a question!

GRIT SUPPORT BROADENING WITH TIME

PdfExport

Our latest survey interviewed more than 2,000 respondents and covered a host of political topics.

Our first release from this package of data covers the regular political bases.

ACCESSIBLE VOTER POOLS

At the beginning of 2015, all three major parties had accessible voter pools of a similar size. Today, the Liberals have a 20-point advantage over the NDP and a 22-point advantage over the Conservatives. To some degree, one might argue that this has something to do with the fact that the Conservatives and the NDP don’t have permanent leaders, except this gap really had emerged by the end of the last election campaign.

Today, 67% say they would consider voting Liberal, compared to just 47% for the NDP and 45% for the Conservatives. The gap in accessible voter pool is arguably the Liberals strongest asset and the critical factor that new leaders of the NDP and Conservatives will need to change if their goal is to form a government.

Slide1

CURRENT VOTING INTENTION

A year ago, all three major parties were polling within three points of each other. Today the gap from first to third is 30 points.

If there were an election tomorrow, the Liberals would win 46% support, 6-points better than their result last fall. The Conservatives are steady at 28% while the NDP is at 16%. Both the NDP and Conservative are four points below their election result last year.Regional breakdowns show the Liberals with a 23-point lead (over the NDP) in Quebec, a 23-point lead in BC, and a 17-point lead in Ontario.

Slide2

Regional breakdowns show the Liberals with a 23-point lead (over the NDP) in Quebec, a 23-point lead in BC, and a 17-point lead in Ontario.

When it comes to gender, the Liberals lead by 15 points among men, and by 22 points among women. They lead among all age groups with a 30-point lead among those under 30 and a 12-point lead among those 60+.

Slide7

Breaking down these results a bit more reveals the Conservatives greater challenge is among women under 45, where the party is 29-points behind the Liberals.

Slide8

Another critical pattern is the difference between urban and rural voters, especially west of Ontario. West of Ontario, the Conservatives have a narrow lead among rural voters, while the Liberals have become highly competitive in urban and suburban areas. East of Manitoba, the Conservatives are far behind the Liberals in urban and suburban areas and are 14 points back in rural areas.

Slide10

The relative competitiveness of the Conservative Party in rural Canada is mostly a function of how men feel about their choices. Among rural men, the two parties are only 4 points apart. Among rural women, the Liberals have a 17-point lead.

Slide9

APPROVAL OF THE GOVERNMENT

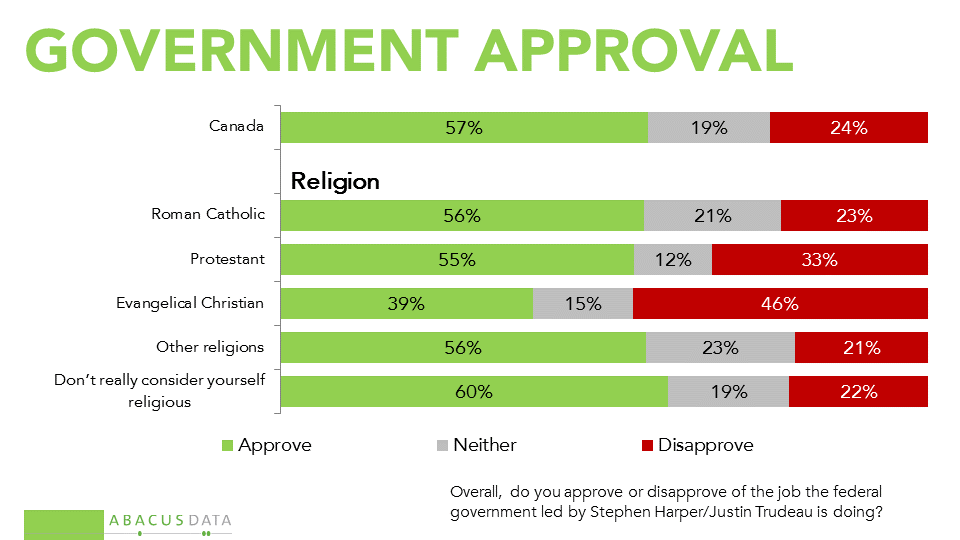
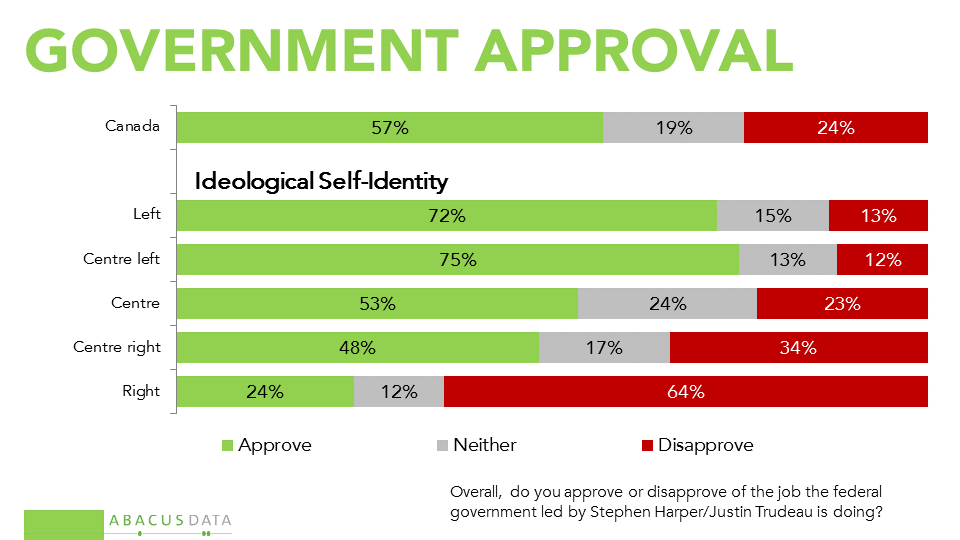
Our latest survey finds 57% approve of the job the federal government led by Justin Trudeau is doing, the highest number we have recorded since he took office, and 25-points above where Mr. Harper stood entering the last election.

Slide13

Approval levels are above 50% across the country with the exception of Alberta, where 39% approve and 47% disapprove. The Liberals obtained 25% of the vote in Alberta last fall.

Slide14
Slide15

Approval of the government is above 50% among all religious groups, except Evangelical Christians, among whom 39% approve, and 46% disapprove of the Trudeau government.

Slide21

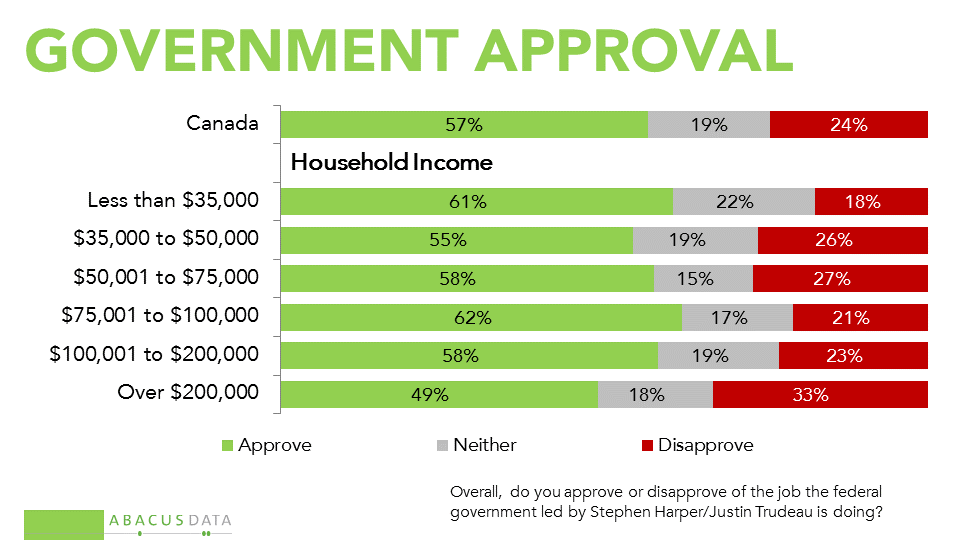
Approval levels are higher among those whose household income is below $200,000, but even among those above that threshold, approval is 49%, disapproval 33%.

Slide19
Slide22

Perhaps the most interesting stories under the surface of broad approval is the fact that the Trudeau government is winning the approval of the broad majority of those on the left (above 70%), the majority (53%) of those on the centre, and even the plurality of those on the centre right (48%-34%). It is only the relatively small portion of the population who self-describes themselves as “right” (7%) where the majority disapproves.

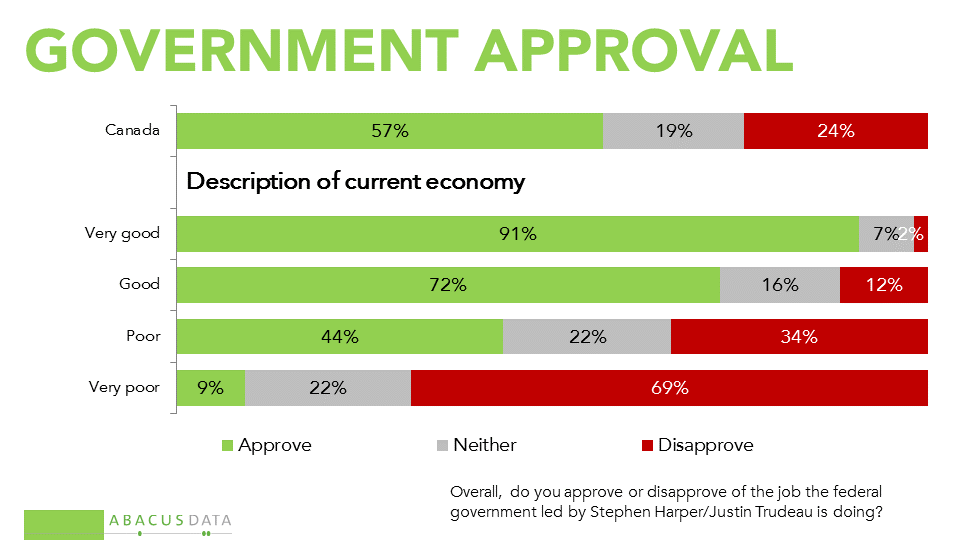
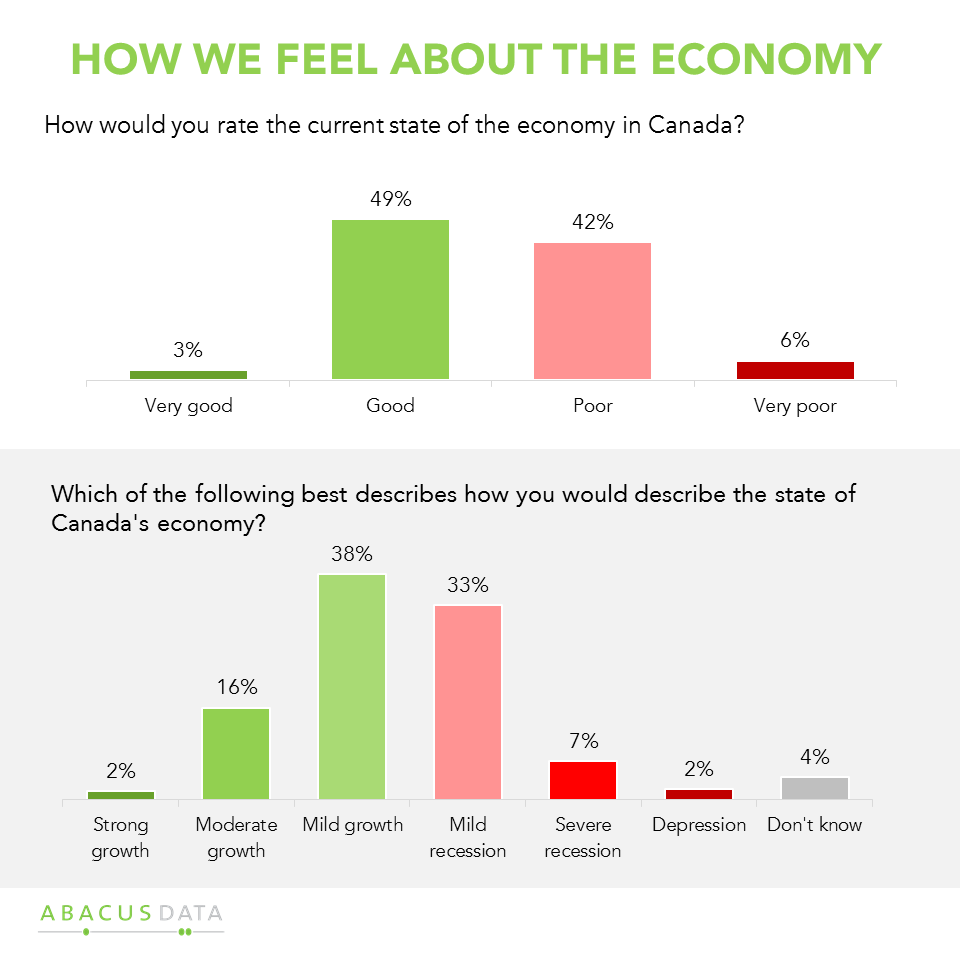
Finally, while the economic mood is improving (more on that in a later release this week), only about half of the population feels the economy is in good shape today, the other half would say poor or very poor. Among the 42% who say the economy is “poor,” more people approve (44%) than disapprove of the performance of the government.\

Slide23


THE UPSHOT

Bruce_Anderson

Bruce Anderson: “For many months now, some have wondered if the popularity of the new government would survive the inevitable tough policy tests it would face. As the new government closes in on a year in office, with the inevitable challenges that have occurred, some critical choices have been made, and public support remains pretty robust.

Perhaps more interesting is that the extensive regional and partisan polarization that has marked Canadian politics for several years may be dissipating. Voters on the centre right seem pleased with the choices the government is making as do those on the left. Many voters in the West, who didn’t vote for this government, seem to be accepting the choices Mr. Trudeau is making.

For the other two major parties, this establishes that they cannot take for granted that their approach to the next election can be about rallying a base against the incumbents: they will need to increase the appeal of their parties among those who would not currently consider them.

About 1 in 5 NDP voters has drifted towards the Liberals, and the number of Conservative voters who are angry at the Liberals is far less than would be needed to win an election.”

David2

David Coletto: “The broad public support for the Liberal government we saw soon after the election has persisted and strengthened. Approval is up 5-points since March and the Liberals would win a larger share of the vote today than they did in last year’s election.

Part of this extended run of goodwill might be explained by the fact that Mr. Trudeau lacks any alternatives for Canadians to compare as potential replacements. More likely, the popularity of Mr. Trudeau and his government is a result of its approach to governing and the emotional connection it has made with millions of Canadians, including many who didn’t vote Liberal. Despite some challenges and mistakes, the Liberals have governed like Canadians expected they would. They promised a progressive, positive, and ambitious government. Most progressive Canadians, and even some of those on the right, are happy with what they have seen so far.”

METHODOLOGY
Our survey was conducted online with 2,010 Canadians aged 18 and over from August 22 to 25, 2016. A random sample of panelists was invited to complete the survey from a large representative panel of over 500,000 Canadians.

The Marketing Research and Intelligence Association policy limits statements about margins of sampling error for most online surveys. The margin of error for a comparable probability-based random sample of 2,010 is +/- 2.2%, 19 times out of 20.

The data were weighted according to census data to ensure that the sample matched Canada’s population according to age, gender, educational attainment, and region. Totals may not add up to 100 due to rounding.

Abacus Data Inc.

We offer global research capacity with a strong focus on customer service, attention to detail and value-added insight. Our team combines the experience of our Chairman Bruce Anderson, one of Canada’s leading research executives for two decades, with the energy, creativity and research expertise of CEO David Coletto, Ph.D.
Ask us a question today!

THE FUTURE AS CANADIANS SEE IT – WORK, HEALTH & TECHNOLOGY

In our recent nationwide survey, we asked Canadians to tell us whether they thought a series of scenarios were likely or unlikely to transpire over the next 10 or 20 years.

Our first release can be found here.

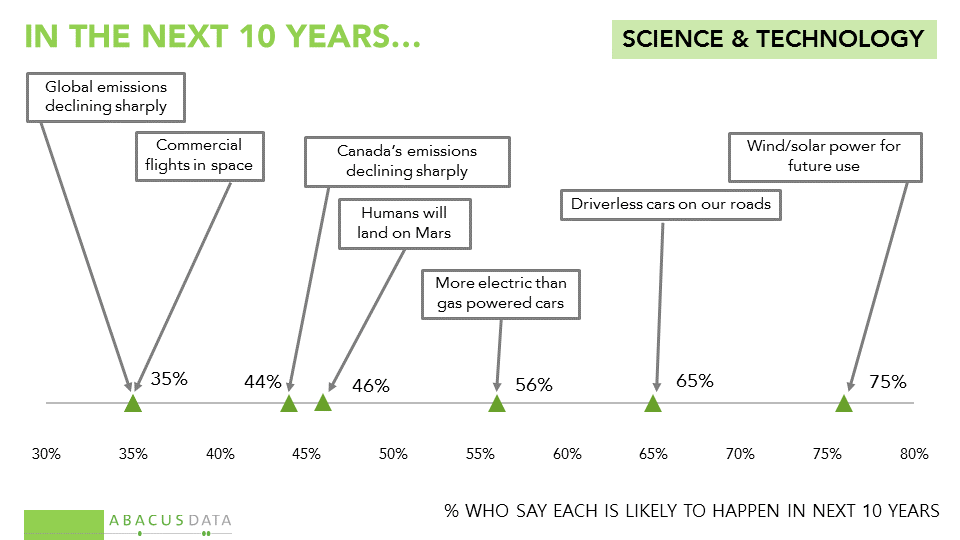
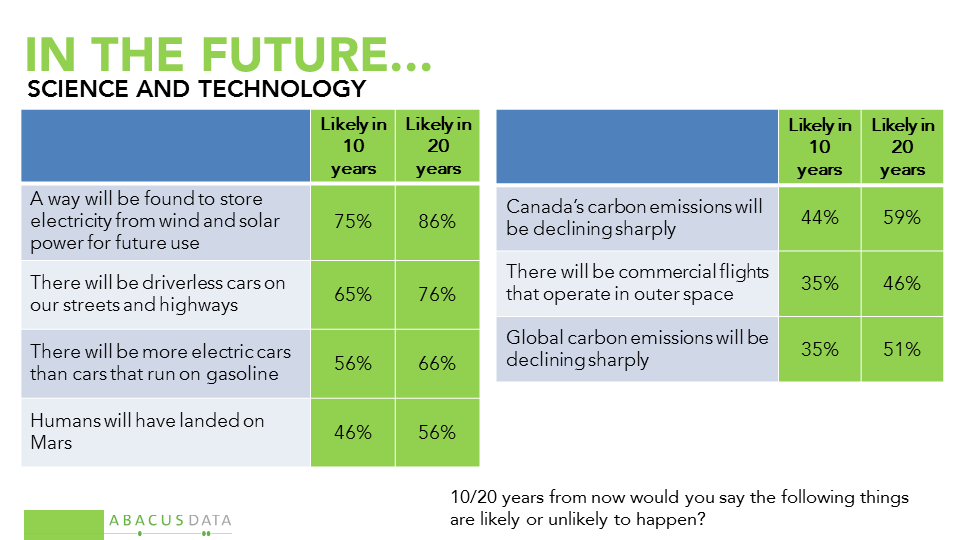
Here are our findings on items related to science and technology:

• Most (75%) believe that in the next ten years a way will have been found to store energy from wind and solar for future use.

• Two thirds (65%) believe there will be driverless cars on our streets and highways.

• More than half (56%) think there will be more electric than gas powered cars.

• Almost half think humans will have landed on Mars (46%), and 35% think there will be commercial flights in space.

• Four in ten (44%) think Canada’s greenhouse gas emissions will be declining sharply, while 35% think global emissions will be declining sharply.

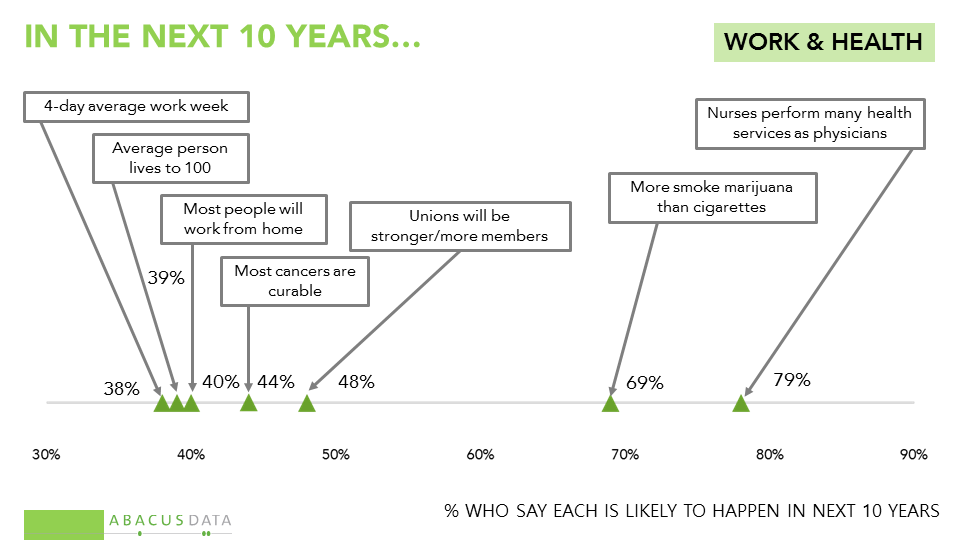
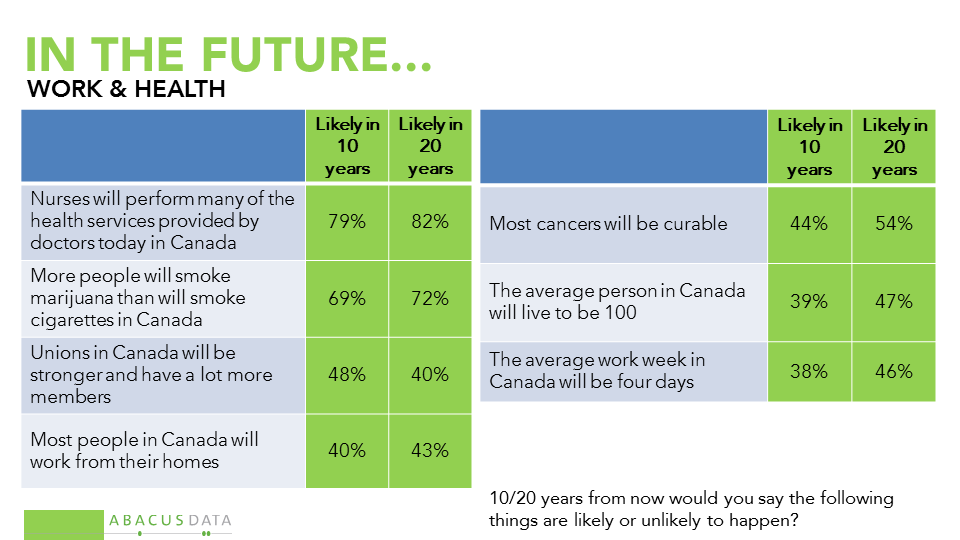
When it comes to the future of work and heath:

• 79% think it is likely that nurses will perform many of the health services performed by physicians in 10 years.

• 69% think that more people will smoke marijuana than cigarettes.

• Just under half (48%) believe unions will be stronger and have more members.

• 44% think most cancers will be curable and 39% believe the average Canadian will live to 100 years.

• 40% believe most people will work from home and 38% think the average work week will be 4 days long.

Comparing views across political lines, we find:

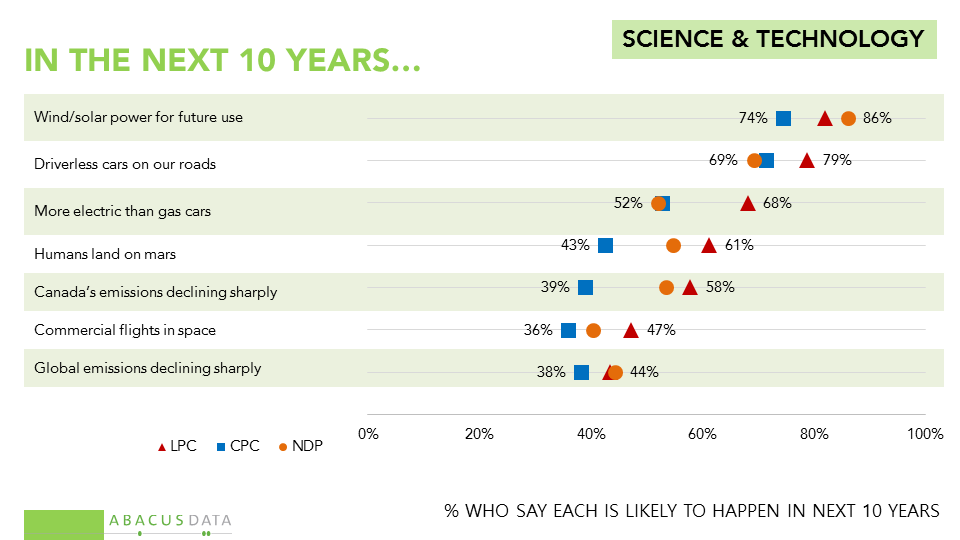
• Large majorities across all three major parties, believe energy storage solutions will be found for wind and solar.

• Liberals are more likely than others to think there will be more electric than gas cars on the roads in 10 years, the average work week will be 4 days long, most people will work from home, and more will smoke marijuana than tobacco.

• Liberals and New Democrats are more convinced that Canada’s GHG emissions will be declining sharply, compared to Conservatives.

• Liberal and NDP supporters are more likely to think that humans will land on Mars.

Slide13
Slide14
Slide9
Slide10

Comparing Outlook for 10 years and 20 years

Half our sample was asked the likelihood that certain events would occur in 10 years while the other was asked about a longer time horizon of 20 years. Some findings:

• Given a 20 year horizon rather than 10, Canadians were roughly 10 points more likely to think energy storage solutions would be found, there will be driverless cars on our streets, more electric than gas cars, humans would visit Mars, commercial flights would go into space, and most cancers would be curable.

• 59% thought Canada’s emissions would be declining sharply in 20 years compared with 44% who thought this was likely in 10.

• Adding 10 years to the horizon also made more people imagine the average lifespan would be 100.

• In contrast, there were more doubts about the future of unions, the longer the outlook.

Slide16
Slide12


THE UPSHOT

Bruce Anderson: “Canadians are known to be risk-averse, but these numbers suggest that they are not necessarily change-averse. Several of these findings suggest there is a fair bit of optimism about the potential for technology and imagination to change our world for the better: lengthening life spans, reducing environmental impacts, and expanding our understanding of space.

Correctly or not, many Canadians believe technology will be an important part of the solutions needed to reduce carbon emissions. Public expectations for the pace of emissions reduction may disappoint some, but there are few who foresee a future where Canada is not making real progress in this area, at least over the coming 20 years.”

David Coletto: “How will our lives change in 10 to 20 years? Canadians can imagine a world that is healthier and powered by renewable energy and new technologies that today are being developed. Many of us can see streets filled with driverless, electric cars powered by energy generated by the sun and wind. We see nurses peforming many of the same health services as physicians while most of us live into our 90s and 100s.

These findings suggest that since many Canadians expect rapid changes in technology, energy, and health, our ability to adapt and cope with those changes will be easier and less surprising. The speed at which things have changed in the past 20 years has primed us to expect even fast change in the next 20.”

METHODOLOGY

Our survey was conducted online with 1,500 Canadians aged 18 and over from June 14 to 16, 2016. A random sample of panelists was invited to complete the survey from a large representative panel of over 500,000 Canadians.

The Marketing Research and Intelligence Association policy limits statements about margins of sampling error for most online surveys. The margin of error for a comparable probability-based random sample of 1,500 is +/- 2.6%, 19 times out of 20.

The data were weighted according to census data to ensure that the sample matched Canada’s population according to age, gender, educational attainment, and region. Totals may not add up to 100 due to rounding.

Abacus Data Inc.

We offer global research capacity with a strong focus on customer service, attention to detail and value added insight. Our team combines the experience of our Chairman Bruce Anderson, one of Canada’s leading research executives for two decades, with the energy, creativity and research expertise of CEO David Coletto, PhD.
CANADIANS LOOK INTO THE FUTURE

PdfExport

In our recent nationwide survey, we asked Canadians to tell us whether they thought a series of scenarios were likely or unlikely to transpire over the next 10 or 20 years.

We are releasing the results over the next few days, grouping some items together for ease of presentation.

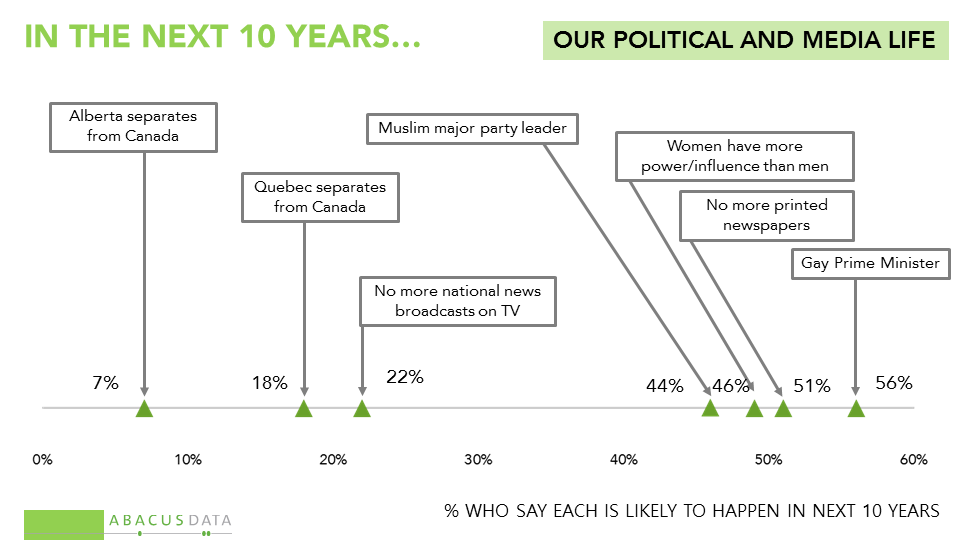
When it comes to our media and political life:

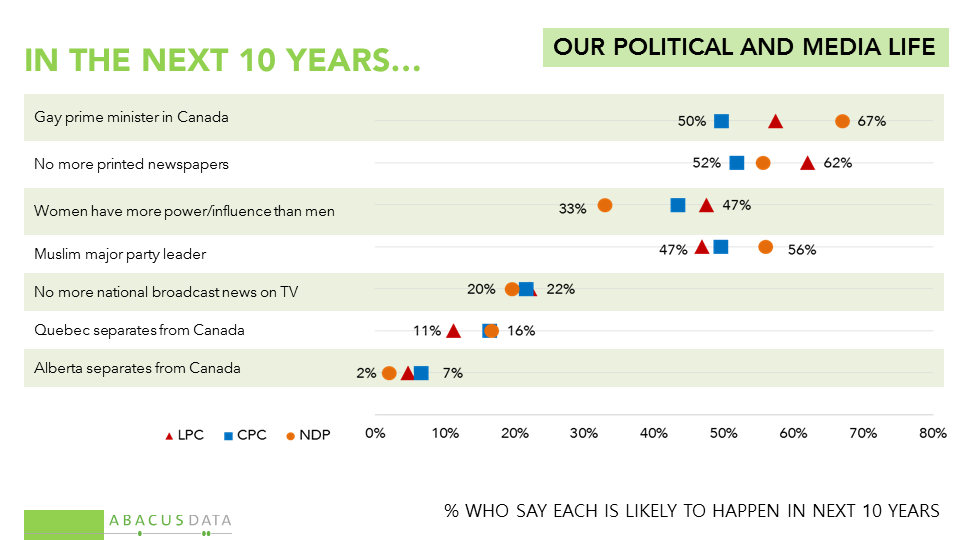
• The majority (56%) think it’s likely that Canada will have a gay Prime Minister within the next ten years. Almost as many (44%) say it’s likely that a Muslim will lead one of our major political parties.

• Half (51%) think there will be no more printed newspapers and 22% think there will be no more national news broadcasts on TV.

• 7% think Alberta will separate from Canada (11% in Alberta), and 18% think Quebec will separate (20% among Quebecers).

• 46% believe that women will have more power and influence than men in Canada, slightly higher among men (49%) than among women (44%).

Comparing views across political lines, a few observations:

• New Democrats are more likely to believe that there will be a gay PM and a Muslim leader

• Liberals are more likey to believe women will have more influence than men.

• 62% of Liberals foresee no printed newspapers, compared to 51% among Conservatives.

When it comes to global affairs:

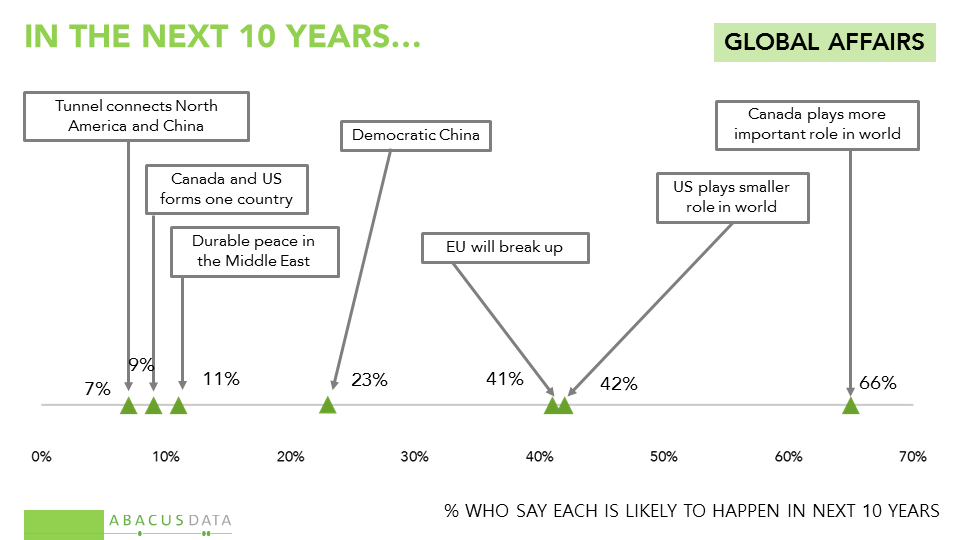
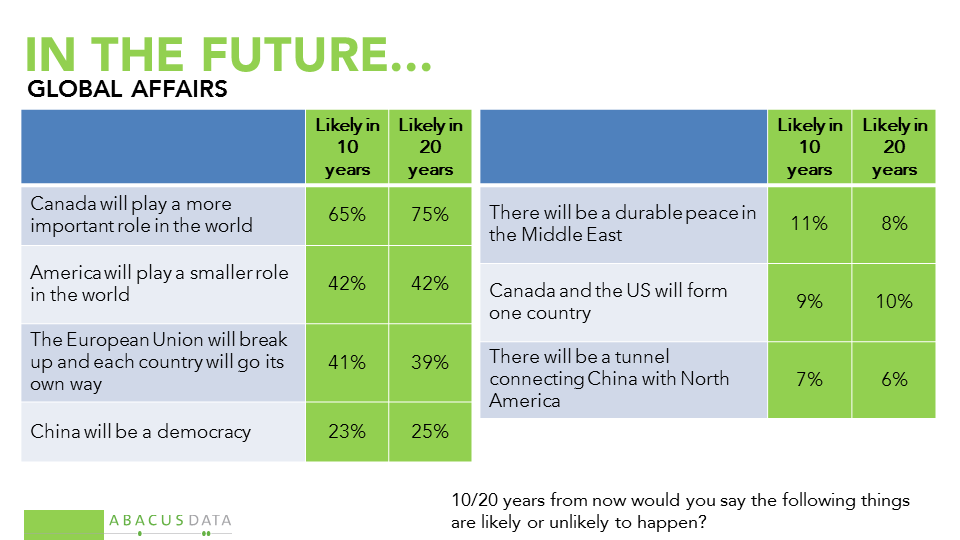
• Two out of three (66%) think Canada will play a more important role in the world.

• 42% think the US will play a smaller role in the world.

• 41% think the EU will break up.

• 23% think China will be a democracy.

• 11% expect there will be a durable peace in the Middle East.

• 9% think Canada and the US will be one country.

• 7% think a tunnel will connect North America and China.

Again, looking at results across party lines:

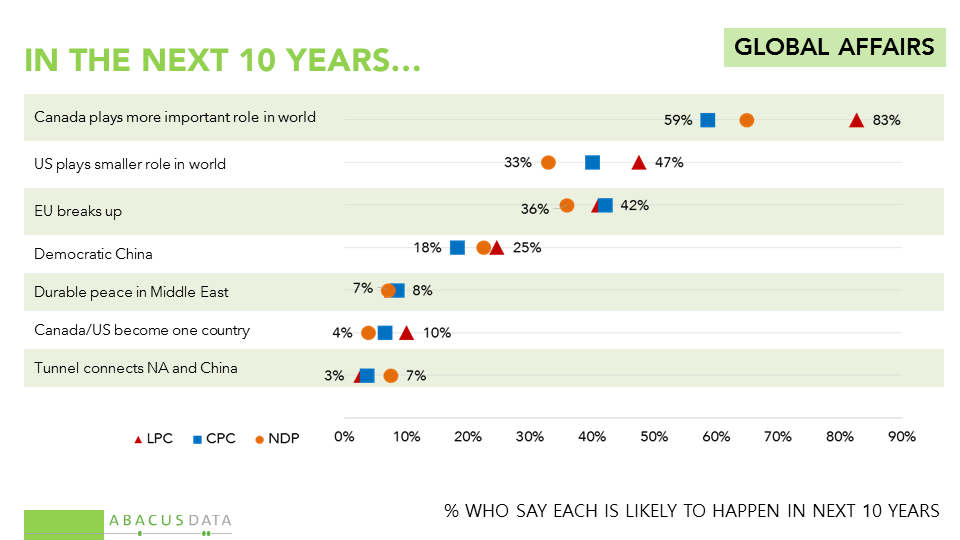
• Liberals are most likely (83%) to say Canada will play a more important role, but majorities of each parties’ supporters feel this way.

• There were fewer differences across party lines on the other questions.

Slide1
Slide3
Slide5
Slide6


Comparing Outlook for 10 years and 20 years

Half our sample was asked the likelihood that certain events would occur in 10 years while the other was asked about a longer time horizon of 20 years. Some findings:

• 62% thought it was likely that there would be no printed news papers in Canada in 20 years compared to 51% in a 10 year period.

• 54% thought there would be a Muslim major party leader in 20 years compared to 44% who said that would happen in 10.

Slide2
Slide8

• 75% believed Canada will play a more important role in the world 20 years from now, 65% felt the same in 10 years.

THE UPSHOT

Bruce Anderson: “The numbers tend to speak to an optimism about the country and a comfort with our values. We don’t expect our country to break up, or merge with the US, and we do expect it will have more influence in the world.

There is uncertainty about the course of global geopolitics, including the future of China, the US, and the EU, but pessimism about peace in the Middle East.

In terms of our own domestic politics, the numbers signal at least some confidence that bias-based barriers to high office are limited and possibly reducing over time.”

Our next release will explore our expectations about health, life, and technology.

METHODOLOGY

Our survey was conducted online with 1,500 Canadians aged 18 and over from June 14 to 16, 2016. A random sample of panelists was invited to complete the survey from a large representative panel of over 500,000 Canadians.

The Marketing Research and Intelligence Association policy limits statements about margins of sampling error for most online surveys.

The margin of error for a comparable probability-based random sample of 1,500 is +/- 2.6%, 19 times out of 20.

The data were weighted according to census data to ensure that the sample matched Canada’s population according to age, gender, educational attainment, and region. Totals may not add up to 100 due to rounding.

Abacus Data Inc.

We offer global research capacity with a strong focus on customer service, attention to detail and value added insight. Our team combines the experience of our Chairman Bruce Anderson, one of Canada’s leading research executives for two decades, with the energy, creativity and research expertise of CEO David Coletto, PhD.