Public perspectives on Canada’s oil resources

PdfExport

In our latest national public opinion survey (conducted November 11 to 13), given the contemporary debate about oil, pipelines, climate and carbon, we explored some current views about the development of oil resources in Canada.

Here’s what we found:

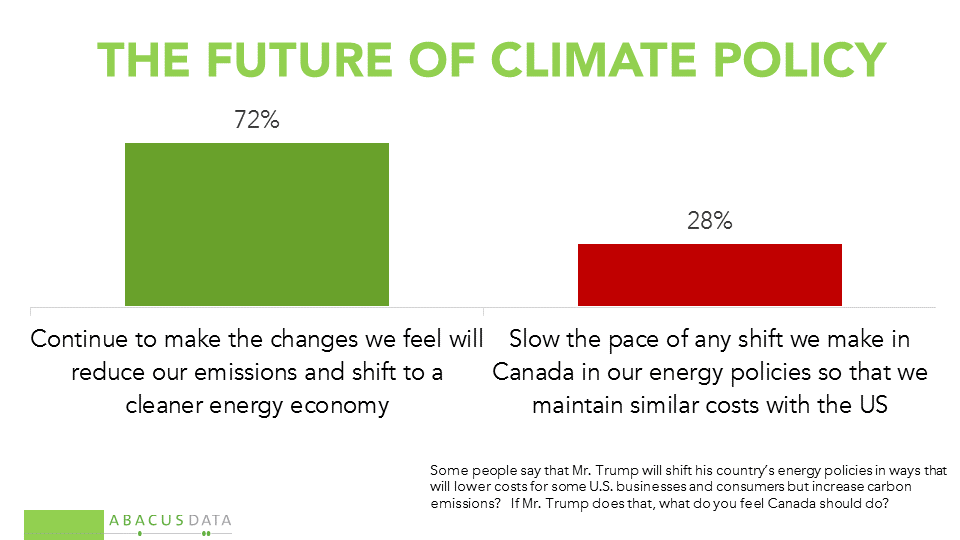
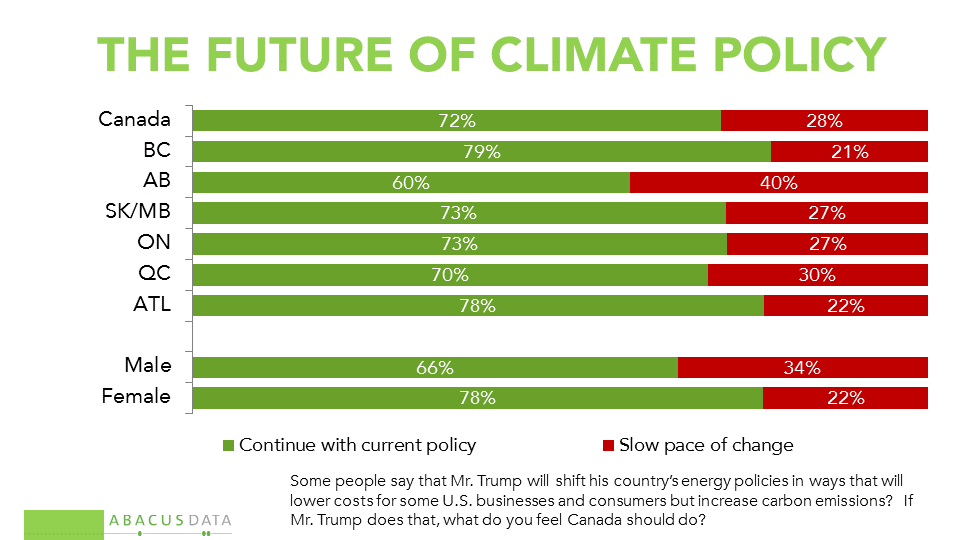
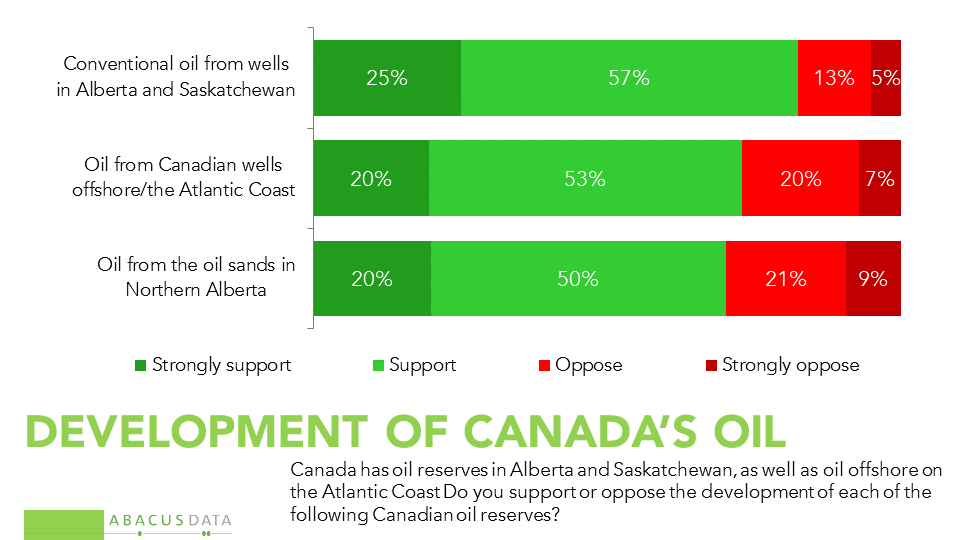
• Our recent polls have demonstrated a Canadian desire to shift energy production and consumption towards renewable and lower carbon sources. However, these results make it clear that most prefer a transition, rather than an abrupt stop when it comes to the development of domestic oil.

Broad majorities support the development of oil reserves from conventional oil wells in AB and SK (82%), from Canadian wells offshore in the Atlantic (73%) and from the oil sands in Northern Alberta (70%).

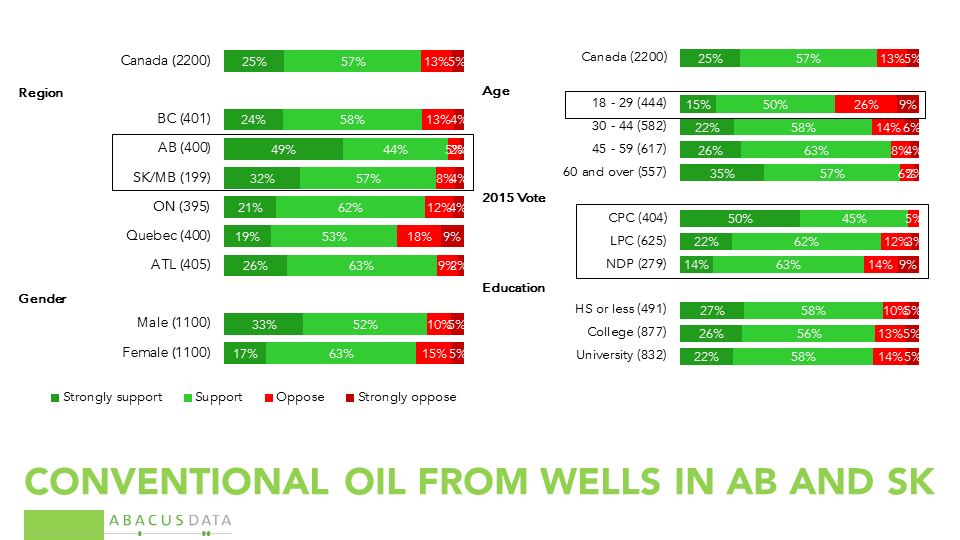
• Support for developing conventional oil is highest in the two producing provinces and among Conservative voters, but it is relatively lower in Quebec (72%) and among those who voted NDP (77%), two subgroups that tend to be less supportive of oil use generally.

• Support for developing off-shore oil reserves is highest in Atlantic Canada (88%) and in Alberta (86%) and lowest in Quebec (62%).

slide5

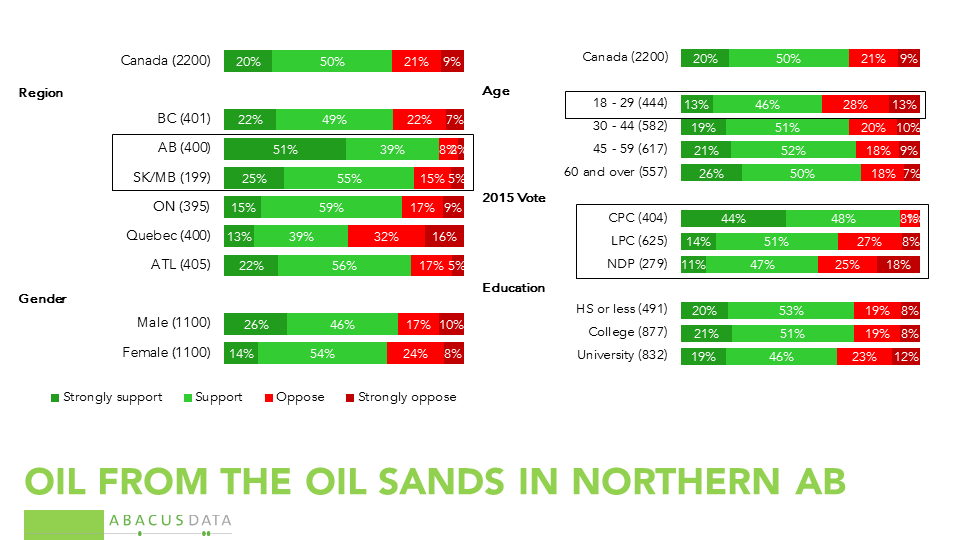
• Continued oil sands development finds majority support in every region of the country, although Quebecers are split almost equally. As with other types of oil development, younger Canadians are less supportive than older Canadians. Conservative voters are most enthusiastic about developing the oil sands (92% support, 44% strongly), but most LPC (65%) and NDP (58%) voters also support developing this resource.

• A small portion (9%) of the population supports conventional and offshore oil but opposes development of the oil sands.

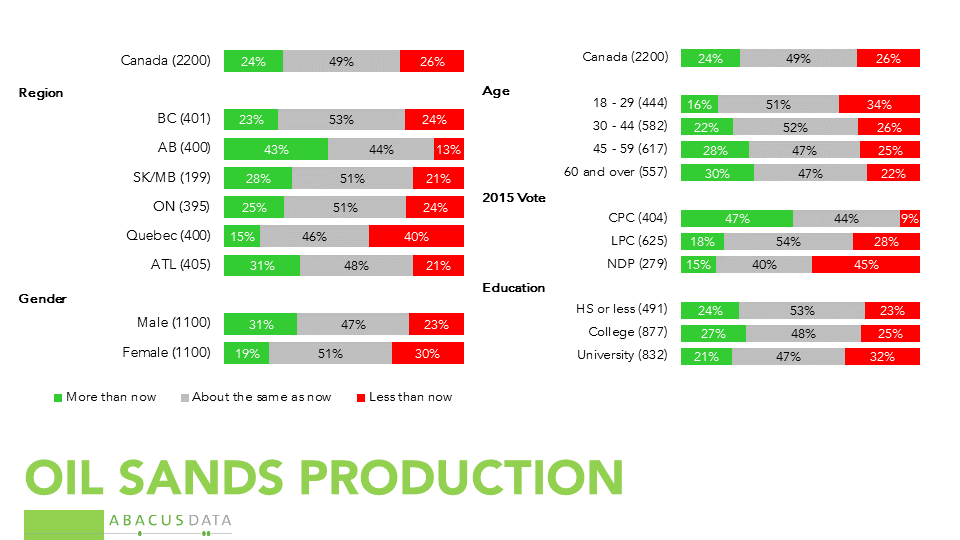
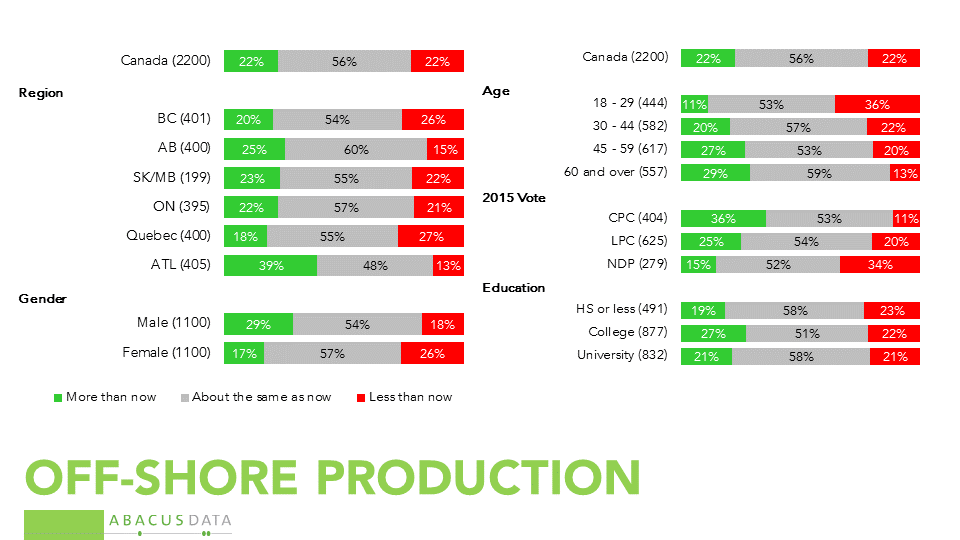
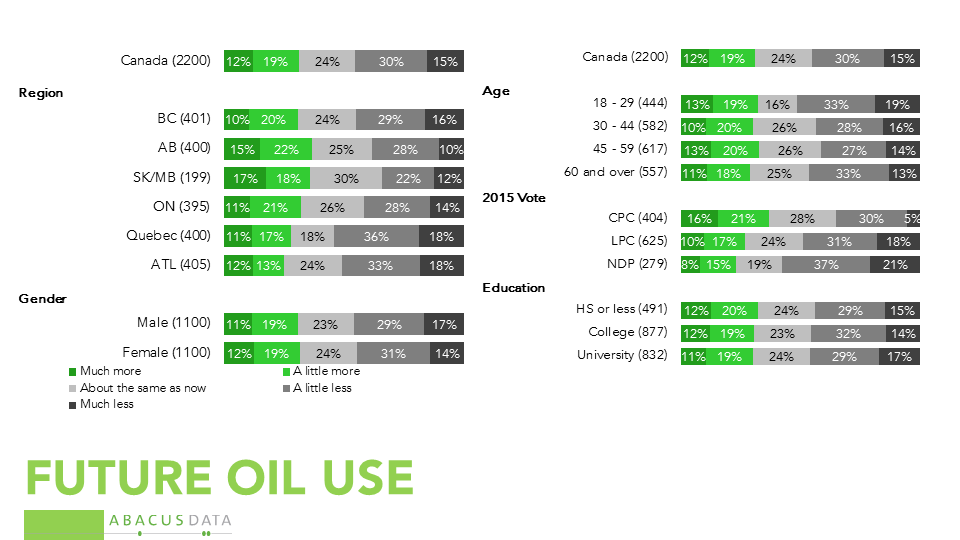
• When asked whether they would like to see increased or decreased production from the oil sands and from off-shore reserves, the plurality prefers no change in production levels. About one in four felt Canada should produce less than now while a similar number felt production should be increased.

• Support for expanding oil sands production was highest in Alberta (43%) and lowest in Quebec (15%). 40% of Quebecers want oil sands production to be reduced, the highest in the country. In BC, 23% want oil sands production expanded, 53% prefer the status quo, while 24% want production reduced.

• 47% of Conservative voters favour expanding oil sands production, while 44% prefer no change, and 9% would like to see a reduction.

• Liberal Party voters prefer production levels as they are now (54%) with 28% favouring a reduction and 18% an increase.

• NDP supporters tend (45%) to favour reducing oil sands production, but the majority prefers the status quo (40%) or even expansion (15%).

• 36% of Conservative voters favour expanding off-shore production, only 11% want a reduction. Among NDP voters, 15% favour expansion, 52% favour the status quo while 34% want off-shore oil production to be reduced.

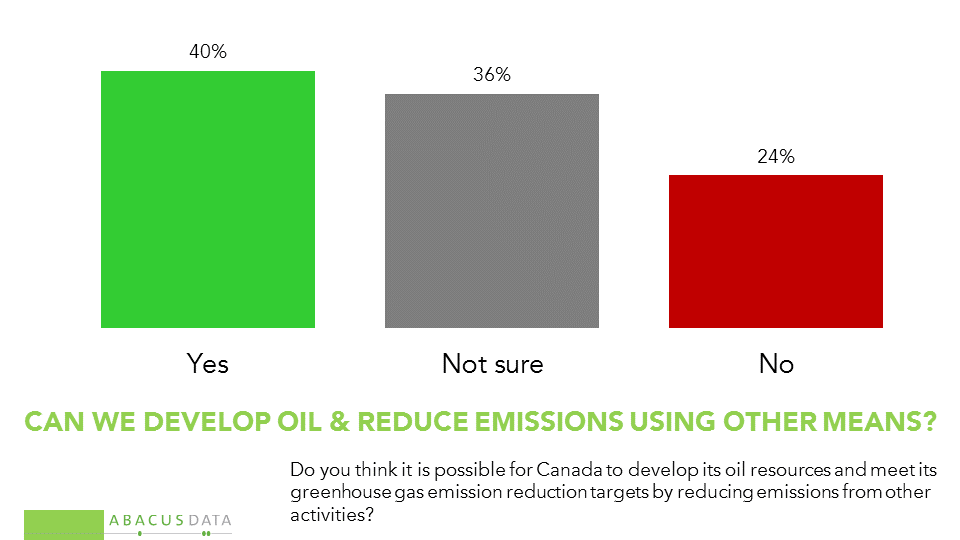
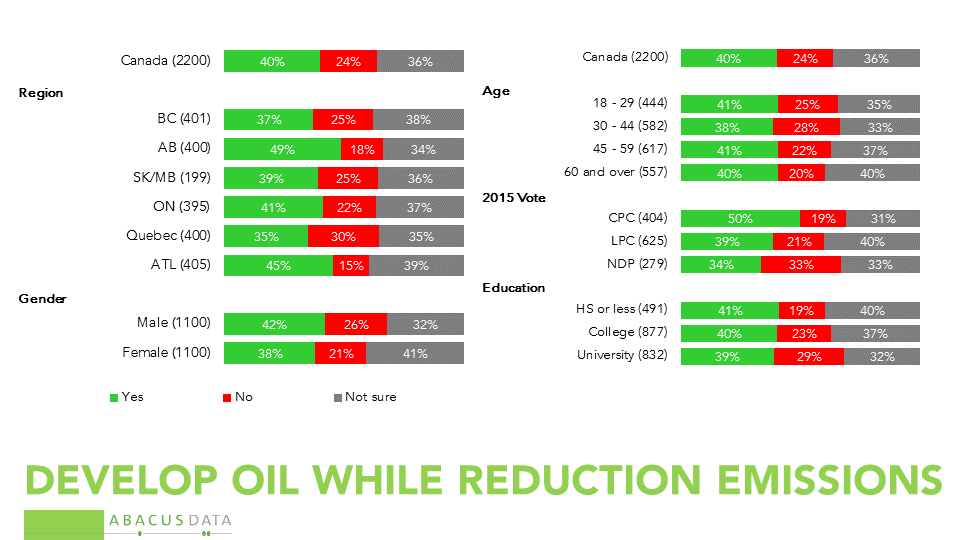
• One reason people continue to support the development of Canada’s oil resources is that they have not concluded that doing so would make it impossible for the country to meet its emission reduction targets.

40% think it is possible for Canada to develop its oil resources and meet its greenhouse gas emission reduction targets by reducing emissions from other activities, while 24% do not think this is possible and 36% are not sure.

• The views of Canadians about oil production are conditioned by a sense that global demand for the product will decline at some point. When asked what they thought the world market would look like in 20 years’ time, 46% said demand would be lower than it is today, compared to 31% who believe demand will be greater.

Even in Alberta (38%) and Saskatchewan (36%) and among CPC voters (35%) almost four in ten believe that demand for oil will be lower in 20 years.

Among those favour increasing production of the oil sands, 37% say that oil demand will be shrinking in 20 years while 39% think it will grow.

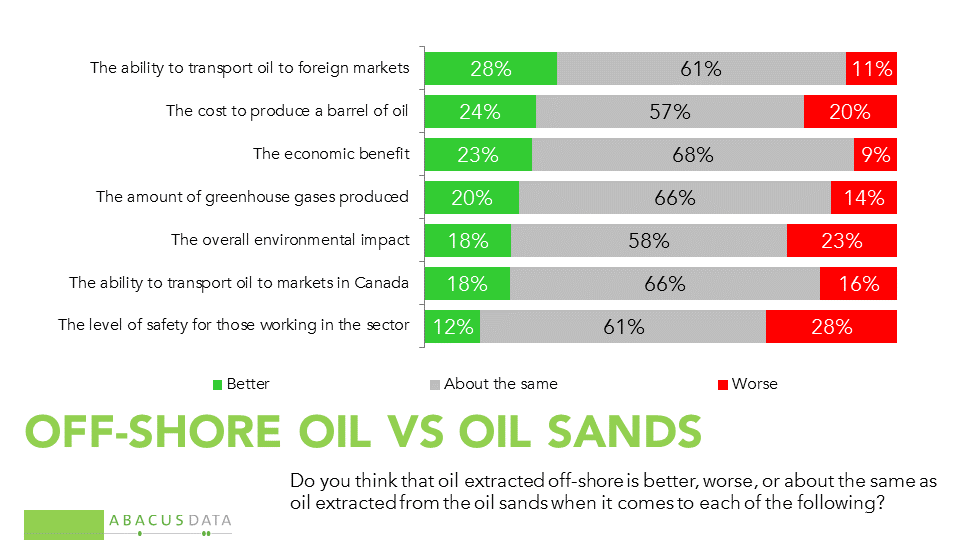
• We asked about perceived differences between offshore and oil sands production. There were a few points of differentiation:

o There was a slight tendency to feel that offshore production is better than oil sands when it comes to getting the product foreign markets, the impact on GHG emissions, and economic benefits but perhaps slightly inferior in terms of overall environmental impact and worker safety. However, these differences were modest – the tendency was to see both forms of oil production as similar.

o Regionally, there was little variation in perceptions. Apart from Atlantic Canadians being more likely to think that off-shore is better than oil sands in terms of emissions and Quebecers being more likely to think off-shore is better than oil sands in terms of economic benefit, the same views about the two production methods were held in different regions of the country.

slide12


UPSHOT

According to Bruce Anderson:

“Canadians generally believe that the future will see and should see a reduction in reliance on fossil fuels and non-renewable energy. They embrace an environmental imperative and also sense potential economic opportunity in the growing market for clean energy solutions, or a risk of losing ground to competitors that shift to more sustainable energy sources more quickly.

But the pragmatic nature that defines Canada on many issues is clear when it comes to our energy resources: most people do not want an abrupt shift, but a measured, ambitious transition.

Mainstream voters reject arguments that are overly binary: right or wrong, moral or immoral, now or never. They are far more drawn to ideas about how to marry their environmental aspiration with their economic goals and to achieve economic renewal and growth based on cleaner forms of energy.”

According to David Coletto:

“Canadians generally support continuing to develop of our oil resources and few discriminate their support across different types of development be it conventional, oil sands, or off-shore production. Quebecers are the most resistant, but even a majority in the province support the development of the oil sands.

When it comes to comparing off-shore and oil sands production, few Canadians see a difference in terms of economic benefit, safety, and environmental impact. Although one type of production may have advantages over another, few Canadians can recognize them at this point.”

METHODOLOGY

Our survey was conducted online with 2,200 Canadians aged 18 and over from November 11 to 13, 2016. A random sample of panelists was invited to complete the survey from a large representative panel of over 500,000 Canadians.

The Marketing Research and Intelligence Association policy limits statements about margins of sampling error for most online surveys. The margin of error for a comparable probability-based random sample of 2,200 is +/- 2.1%, 19 times out of 20.

The data were weighted according to census data to ensure that the sample matched Canada’s population according to age, gender, educational attainment, and region. Totals may not add up to 100 due to rounding.

ABACUS DATA INC.

We offer global research capacity with a strong focus on customer service, attention to detail and value-added insight. Our team combines the experience of our Chairman Bruce Anderson, one of Canada’s leading research executives for two decades, with the energy, creativity and research expertise of CEO David Coletto, Ph.D.

CBC/Toronto Star Poll: Canadian attitudes towards digital privacy and law enforcement

Abacus Data conducted a national survey for the Toronto Star and CBC News in October and November.  The results were released last week as part of a 5-part series on digital privacy and law enforcement.

Overall, the survey finds that Canadians are generally split on whether law enforcement agencies should have greater powers to access personal digital data, but support jumps substantially when we include the condition of judicial oversight.

The coverage of the poll is available below:

CBC News: http://www.cbc.ca/news/investigates/police-power-privacy-poll-1.385418

Toronto Star: https://www.thestar.com/news/canada/2016/11/17/canadians-support-police-calls-for-more-digital-powers-with-a-catch-toronto-starcbc-poll.html

You can download the full report here: https://abacusdata.ca/wp-content/uploads/2016/11/Digital-Privacy-FULL_INCLUDINGNEWDATA.pdf

What keeps us awake: Top national issues

PdfExport

In our latest survey of national opinion, we explored the issues people are concerned about across Canada today.

• One in three (34%) say that economic conditions in general are the most important issue facing Canada today. This is the number one concern of 47% in Alberta, and a much smaller 27% in BC.

• Another 9% say unemployment is their biggest preoccupation. Again, this number is 17% in Alberta, making it the second ranked issue in that province. This means that roughly two out of three (64%) Albertans put the economy and unemployment on the top of the priority list, almost twice as many as do across the country overall (34%).

• Health care ranks as the 2nd most important issue among people over 45, but only ties for 4th among those under 45.

• In BC, housing is the 3rd most important issue. In Ontario, housing is only the 6th most important issue. In the other provinces, less than 1% mention it as the top issue. Across the country, housing garners twice as many mentions as top issue among those under 45 compared to those over that age.

• Immigration is considered the most important issue by 5%, terrorism 2% and foreign policy or defence 1%. Concern about immigration twice as high in Manitoba/Saskatchewan as it is in Ontario.

• The environment/climate change is considered the top issue by 8% nationally. Women and those under 45 put a greater emphasis on this issue than men and older people, but the differences are modest. This issue ranks 5th among men and tied for 4th among women. BC leads in concern on this issue.

The preoccupations of Canadians vary substantially based on their partisan leanings.

• Among NDP voters, the top 3 mentions, were the economy (27%) poverty/inequality (25%) and the environment/climate change (14%).

• Among Conservatives, the top three were the economy (51%), health care (10%) and unemployment (10%). Immigration was mentioned by just 6%, and terrorism (3%), defence/foreign policy (0%), and law and order (4%) were much farther down the list of top issues. The environment/climate change was mentioned by 1% of Conservative voters.

• Among Liberal supporters, the top three were the economy (38%), health care (18%) poverty/inequality (13%), followed by climate change (9%).

UPSHOT

According to Bruce Anderson:

“The differences in economic and social conditions are really evident when it comes to the preoccupations of people in different demographic groups and regions of the country. Housing is clearly a concern for young people and especially those in BC. The economic pain in Alberta is profoundly evident in these numbers too.

Beyond this, three other things stand out.

One is the wide gulf between Conservatives and others in terms of the urgency they feel about the climate change issue.

The second is that notwithstanding the unsettled global conditions and tensions few Canadians seem highly preoccupied with defense, security, terror or law and order issues – these were a lot more prominent during the years of the Harper administration.

Finally, while screening immigrants has become a major topic of conversation in the CPC leadership race, immigration is far from a major preoccupation across the country.

Conservative voters are twice as likely as Liberals and three times as likely as New Democrats to say it is their top issue, but even at that, only 6% of those who voted Conservative last fall put it at the top of their priority list.”

METHODOLOGY

Our survey was conducted online with 2,200 Canadians aged 18 and over from November 11 to 13, 2016. A random sample of panelists was invited to complete the survey from a large representative panel of over 500,000 Canadians.

The Marketing Research and Intelligence Association policy limits statements about margins of sampling error for most online surveys. The margin of error for a comparable probability-based random sample of 2,200 is +/- 2.1%, 19 times out of 20.

The data were weighted according to census data to ensure that the sample matched Canada’s population according to age, gender, educational attainment, and region. Totals may not add up to 100 due to rounding.

ABACUS DATA INC.

We offer global research capacity with a strong focus on customer service, attention to detail and value-added insight. Our team combines the experience of our Chairman Bruce Anderson, one of Canada’s leading research executives for two decades, with the energy, creativity and research expertise of CEO David Coletto, Ph.D.

View of PM Trudeau drives support for his government

PdfExport

In our latest survey of national opinion, we explored more detailed assessments of Prime Minister Justin Trudeau.

• Since his swearing last November, Justin Trudeau’s favourable impression rating has ranged between 56% and 59%, with negative opinion ranging from 19% and 25%. Our latest findings show 57% favourable and 24% unfavourable. To add a bit more perspective to these numbers, Mr. Trudeau’s favourable rating since assuming the office of Prime Minister is more than 20 points better than in the months immediately before the election campaign.

This is an important reminder that opinion polls tend to show that people who haven’t held this office before aren’t always assumed to be as qualified as those who have – but this doesn’t mean they can’t win an election, or be judged competent after they do.

• Mr. Trudeau’s personal favourability (57%) is 11 points above his party’s standing in the polls. Views of the PM are central to the comfort people indicate with the government.

• Positive opinion towards Mr. Trudeau is the majority view everywhere but in the Prairies. In Alberta, where the Liberal Party has struggled for years, opinion is divided between positive (39%) and negative views (42%). Majorities of men and women, and across every age group, have positive views of Mr. Trudeau.

• Among partisans of other parties, Mr. Trudeau is not hugely polarizing. Only 24% of NDP voters, and 56% Conservative supporters have a negative impression of the PM.

• Positive feelings towards NDP leader Thomas Mulcair are steady in recent months, and 28% in the latest sounding. Interim Conservative leader Rona Ambrose has ranged from 14% and 19% positive opinion, with the latest sounding showing 17% positive and 23% negative views.

We updated our data on 10 detailed evaluations of the Prime Minister in this wave of surveying. The latest numbers show:

• On all 10 items, two-thirds or more of those surveyed said the PM was doing an acceptable or better job.

• Best assessments were for openness and accessibility, representing Canada abroad, the personal values he brings to the job, his cabinet appointments and his approach to working with the provincial Premiers. In each case, more than 80% said he was doing an acceptable or better job. His rating on openness and accessibility and for collaboration with the Premiers dropped by 5 and 7 points respectively since January.

• More than 3 out of 4 give the PM an acceptable or better rating for his approach to climate change and greenhouse gases. This item also saw a 5-point drop since January, which occurred primarily in the Prairie provinces.

• On his handling of the economy, 69% say the PM is doing an acceptable or better job, compared to 73% in January.

• When it comes to handling taxpayers’ money, 65% are satisfied today, down from 70% in January.

• Mr. Trudeau’s rating in dealing with the threat of ISIS has increased from 66% in January to 73% today.

slide1

• A marginal increase is also noted for the PM’s handling of the refugee issue: 71% today say he is doing an acceptable or better job, compared to 68% last January.

• Looking only at the proportion of good or very good ratings presents a fairly similar storyline.

slide2


UPSHOT

According to Bruce Anderson:

“A year after winning the job of running the country, Justin Trudeau has left a good impression among 88% of those who voted for him, and has been a positive surprise for a substantial number of voters who didn’t cast a ballot for his party.

Today, his performance assessments continue to show that his personal leadership is driving support for his party and confidence in his government, despite an economy that continues to experience headwinds. For many Canadians, the health of the economy is clearly not the only way they evaluate their political leaders.

A year of experience has caused a bit of deterioration on some performance items, although overall favourability towards the PM remains solidly, and consistently, in majority territory. This is a reminder that many voters “price in” the idea that governments will make errors and misjudgments, and tend to react to most events with that realization in mind.

Perhaps the most interesting aspect of these numbers is the evidence that the sharp partisanship that marked opinion in recent years has softened: barely half of Conservative voters don’t like Mr. Trudeau, and most NDP voters have a good feeling about the PM.”

According to David Coletto:

“Perhaps most striking in these numbers is the breadth and depth of Prime Minister Trudeau’s appeal. He is popular in almost all regions of the country, across all age groups, education levels, and genders. His popularity among young voters is something I’m watching closely.

Young voters were critical to the Liberal win in 2015 and they will be critical again in 2019. Right now, over six in ten Canadians under 30 have a positive impression of the Prime Minister. Less than one in five view him negatively. A year after his win, Mr. Trudeau’s shine with Millennials has yet to fade.”

METHODOLOGY

Our survey was conducted online with 2,200 Canadians aged 18 and over from November 11 to 13, 2016. A random sample of panelists was invited to complete the survey from a large representative panel of over 500,000 Canadians.

The Marketing Research and Intelligence Association policy limits statements about margins of sampling error for most online surveys. The margin of error for a comparable probability-based random sample of 2,200 is +/- 2.1%, 19 times out of 20.

The data were weighted according to census data to ensure that the sample matched Canada’s population according to age, gender, educational attainment, and region. Totals may not add up to 100 due to rounding.

ABACUS DATA INC.

We offer global research capacity with a strong focus on customer service, attention to detail and value-added insight. Our team combines the experience of our Chairman Bruce Anderson, one of Canada’s leading research executives for two decades, with the energy, creativity and research expertise of CEO David Coletto, Ph.D.
For more information, visit our website at http://www.abacusdata.ca/

Shock and Dismay: Canadians on Trump’s Victory

PdfExport

In our latest survey of national opinion, we explored reactions to the election of Donald Trump as US President. Here’s what we found.

• The most common single words Canadians use to describe their reaction to Mr. Trump’s election were ‘shocked, surprised, disappointed, disgusted, and horror”.

slide1

• In answer to a separate probe, 40% said they were shocked at the result, and another 28% really surprised.

• Almost half (44%) of those we surveyed were “really dismayed” by Mr. Trump’s win, and another 22% were somewhat disappointed. One in five said they had a neutral reaction. Only 14% were pleased that Mr. Trump won.

• Dismay/disappointment was the majority reaction in every region of the country, among both men and women, across all age groups. The large majority of Liberal and NDP voters were unhappy with the result. Conservative Party supporters were more likely to be unhappy (44%) than happy (33%) with Mr. Trump’s win. In Alberta, where the largest proportion of conservative voters reside, only 25% of those we surveyed were pleased with the result.

• By a very wide margin, Canadians see the Trump victory as having more to do with a lack of enthusiasm for Hillary Clinton, than enthusiasm for Mr. Trump. Women were more likely to cite a lack of enthusiasm for Clinton than men were (79% vs. 70%) while those who voted Conservative in 2015 were more likely to say the result was more about enthusiasm for Donald Trump (30%).

slide6

• Only 16% of Canadians said they would have voted for Mr. Trump. To put this in a different context, in the US Mr. Trump’s weakest result was in Hawaii, where he garnered 30% of the vote.

• In Canada, 52% say they would have cast a ballot for Ms. Clinton. Her result in the US was 48%, suggesting Canadians were not much more enthusiastic about Ms. Clinton as a candidate.

• Almost one in three Canadians (31%) say they would have voted for another candidate. Over six million Americans voted for a third party candidate, more than triple the number in 2012.

• Mr. Trump would have garnered only 9% support among Canadian women, only 27% among Alberta voters, and just 37% of Conservative Party supporters. An equal number of CPC voters would have cast a ballot for Ms. Clinton.

how-would-you-have-voted

We also asked our respondents how they thought events would unfold in a Trump era.

• A huge majority (86%) expect greater tensions between white and non-white citizens. 62% expect many Mexican immigrants will be deported; 55% expect that will happen to many Muslims.

• 70% expect the US to develop closer ties with Russia; an equal number expect the US to enter a new war. Only 30% believe the US will defeat ISIS. Most (60%) say US power and influence in the world will decline.

• Most expect the US will suffer economically (68%); only 28% expect the US will become more powerful. Only 25% expect the US will become a “greater” country.

• Most (60%) say respect for women will decline and 42% believe abortion will become illegal.

• 70% expect the US to walk away from the climate change agreement, and 81% expect the Keystone XL pipeline to be approved.

• Less than half (38%) expect Mr. Trump will build a wall along the Mexico border, and even fewer (19%) believe Mexico will pay for the wall. A majority (60%) expect Mr. Trump to scrap NAFTA.

When asked about the Canada-US relationship respondents have tended to think the relationship might be neither good nor bad, but among the rest, two-thirds expected things to be worse rather than better between the two countries.

A majority of Canadians are open to the idea of a Canada-US free trade agreement if the US decides to exit NAFTA. Those living in Alberta (63%) and Ontario (60%) are more open to the idea of a Canada-US free trade agreement while Quebecers are least open to it (45%). Conservative voters (66%) are more supportive than Liberal (54%) or NDP (48%) voters.

Finally, on the question of what Canada should do if the US shifts energy policy to lower costs and increase carbon, 72% of Canadians believe this country should stick with our plan to reduce emissions and shift to a cleaner energy economy, rather than slow the pace of our shift to make sure costs remain competitive.

This is the view of a large majority of NDP and Liberal supporters, all age groups, every region including Alberta, and even 50% of Conservative supporters.

UPSHOT

According to Bruce Anderson:

“Most likely, Canadians have never been as taken aback and anxious about the outcome of a US presidential election. Most voters didn’t anticipate this result and think it is worrying on many fronts. Not only do people think it will not ‘make America great again’ they believe America’s economic prospects and global influence will suffer.

People are worried about the risk of racial tensions and global conflict rising. The level of support for Donald Trump in Canada is very small. Most of those who voted Conservative last fall would not have voted for Mr. Trump if they had the chance.

Despite their views of the US president, the numbers imply that Canadians want their government to approach the relationship sensibly, with a willingness to look at a post-NAFTA agreement. That said, most don’t want Canada to follow a Trump lead on climate and carbon policy, including most Albertans and most Conservatives.

While some Conservatives share the delight expressed by former Minister and current leadership aspirant Kellie Leitch about the election of Mr. Trump, but they are but a fragment of the conservative base and the even smaller minority of Canadian voters.”

According to David Coletto:

“Our survey finds most Canadians are concerned, shocked, and even appalled by the U.S. election results. One in four 2015 Conservative voters said they were “really dismayed” by the results – a signal that even among the Conservative Party’s base of support, a pivot to Trump style politics will likely shrink the tent instead of growing it.

Politics is ultimately about contrast and comparisons. As a political leader, you’re often compared to your chief rival or the alternatives on offer. With President-elect Donald Trump, Prime Minister Trudeau will now have as severe a contrast of style and policy as possible. The data we released yesterday confirms that the result of the elections hasn’t dampened the government’s support but could impact support for the Conservative Party depending on who party members elect as their leader and whether he or she embraces a Trump-style agenda. The data clearly points to such an agenda being rejected by the vast majority of Canadians.”

METHODOLOGY

Our survey was conducted online with 2,200 Canadians aged 18 and over from November 11 to 13, 2016. A random sample of panelists was invited to complete the survey from a large representative panel of over 500,000 Canadians.

The Marketing Research and Intelligence Association policy limits statements about margins of sampling error for most online surveys. The margin of error for a comparable probability-based random sample of 2,200 is +/- 2.1%, 19 times out of 20.

The data were weighted according to census data to ensure that the sample matched Canada’s population according to age, gender, educational attainment, and region. Totals may not add up to 100 due to rounding.

ABACUS DATA INC.

We offer global research capacity with a strong focus on customer service, attention to detail and value-added insight. Our team combines the experience of our Chairman Bruce Anderson, one of Canada’s leading research executives for two decades, with the energy, creativity and research expertise of CEO David Coletto, Ph.D.

In Defence Of My Craft: 2016 U.S. Election Polling Did Not Fail

Given all the debate and discussion about the performance of the polls in the U.S. Election, I couldn’t help but respond and give my thoughts on what happened.

My team at Abacus takes what we do seriously.  I admit that survey research is not perfect.  But let’s not forget its value when done correctly and with its limitations in mind.

I published this piece on The Huffington Post today.  A sample of it is available below.

Welcome your thoughts!

David Coletto
CEO, Abacus Data

In Defence Of My Craft: 2016 U.S. Election Polling Did Not Fail

Late into Tuesday evening, Jake Tapper of CNN said that if Trump wins the election, “it’s going to put the polling industry out of business.” Well, Trump won the election, and not surprisingly, many have said my industry is in crisis. That’s understandable. A Clinton victory seem like a sure thing.

But was it? In my opinion, the polls were right. The interpretation of them was wrong.

Polls released over the final weekend and into Monday suggested that Hillary Clinton was leading nationally by three to four points over Donald Trump. And all of the election prediction sites said that she was the favourite to win with probabilities ranging from 71 per cent from Nate Silver’s fivethirtyeight.com to 85 per cent from the New York Times Upshot to 87 per cent from Dailykos to 98 per cent from Huffington Post Pollster. But there are important differences in what each of these models were saying.

Keep reading…

electionday

Broad support continues for the Trudeau government

PdfExport

In our latest survey of national opinion, we explored views of Canadian politics, perceptions of the federal government, the PM and other leaders, the aftermath of the US election and attitudes towards oil development in Canada, among other topics.

In this our first release, we look at the domestic political context in Canada.

• In an election held right now, the Liberal Party would attract support from 46%, compared to 25% for the Conservative Party and 17% for the NDP. These numbers show little change of late. While the changes are slight, the numbers suggest a possible softening of Conservative Party support as their leadership race gathers some pace. This is more noticeable in Ontario and BC.

vote-intention-federal

• In Ontario, the Liberals have a 20-point lead, and are up 3 points from their Election Day result. The Conservatives are 7 points below their result last fall. In Quebec, the Liberals have a 27-point lead and are 10 points higher than their election result. The NDP have dropped 6 points over the year and the Conservatives have lost 5. In BC, the Liberals lead by 25, and are 11 points ahead of their result last fall. The Conservatives are 9 points lower than they were last Election Day, and the NDP are 6 points lower. In Atlantic Canada, the Liberals lead by 39 points. In Alberta, they trail the Conservatives by 24 points.

• The Liberals lead among both men (by 16 points) and women (by 26 points). They also lead among all age groups, with their biggest advantage being among voters under 30.

• By a margin of 2:1 Canadians approve of the job the Trudeau government is doing. The current approval rating is 23 points higher than the last approval measurement for the Harper government.

• Approval is more common than disapproval in every region of the country, except Alberta. Our sample size in Saskatchewan is proportionate to population size but too small to allow for reporting the numbers for that province on a stand-alone basis.

• A majority among men and women and across all age groups approve of the performance of the government today. Among Liberal voters, 86% approve of the government’s performance, as do 51% of NDP voters and 22% of Conservative voters.

UPSHOT

A year after the Trudeau government was sworn in, voters continue to feel relatively satisfied with the choice the country made and the way in which the Prime Minister and his government are handling their responsibilities.

According to Bruce Anderson:

“Over the course of the year, the government has been dealing with a range of potentially difficult issues from a soft economy and rising deficits, to a shift in the approach against terrorism and ISIS, to refugees, to pipelines, climate change and carbon pricing, Senate appointments and electoral reform.

The net effect has been no loss of political capital and a slight increase in support. Voters tend to think the government is making mostly the right choices, including one in five of those who voted Conservative last fall, and half of those who voted NDP.

This serves as another reminder that most of what happens week-in-week-out in the hand to hand combat in Ottawa goes unnoticed by most voters. Heated debate often seems to voters to be the normal sound of politics working as it should, rather than events that should command their immediate rapt attention.

For Conservative partisans, these numbers highlight the important choice of rallying their traditional base of older voters versus finding a way to attract support among younger Canadians. As their leadership race unfolds, the positions the Party becomes associated with on diversity and tolerance, on climate change, on Canada’s role in the world, will have a lot to do with whether they can attract the next generation of voter support.”

According to David Coletto:

“For the twelfth continuous month, the Liberal Party leads its opponents across the aisle by a considerable margin. And while the opposition parties lack permanent leaders, we shouldn’t underestimate the breadth and depth of support for the Liberal Party, the Prime Minister, or his government.

Not only does Liberal Party support remain higher than its Election Day performance a year out, but approval for the government remains strong in all regions of the country (even in Alberta where 40% approve), among all age groups, and among men and women. Even across education level, which has become a strong predictor for political support in Canada and other jurisdictions, the Trudeau government is approved by a majority in all education groups – from those with high school or less to those with post-graduate degrees.

Given some of the economic uncertainty surrounding the American election, perceptions about the economy in Canada have held steady, about half describe the economy as very good or good while half feel negatively about it. Among those who currently support the Liberal Party, 69% describe the economy positively while 31% describe it negatively. This confirms that while economic perceptions are drivers for vote intention, they are not completely predictive.”

METHODOLOGY

Our survey was conducted online with 2,200 Canadians aged 18 and over from November 11 to 13, 2016. A random sample of panelists was invited to complete the survey from a large representative panel of over 500,000 Canadians.

The Marketing Research and Intelligence Association policy limits statements about margins of sampling error for most online surveys. The margin of error for a comparable probability-based random sample of 2,200 is +/- 2.1%, 19 times out of 20.

The data were weighted according to census data to ensure that the sample matched Canada’s population according to age, gender, educational attainment, and region. Totals may not add up to 100 due to rounding.

ABACUS DATA INC.

We offer global research capacity with a strong focus on customer service, attention to detail and value-added insight. Our team combines the experience of our Chairman Bruce Anderson, one of Canada’s leading research executives for two decades, with the energy, creativity and research expertise of CEO David Coletto, Ph.D.

TRUMP vs. CLINTON: What to expect Tuesday night

It’s almost over!

Tomorrow night (hopefully), we will finally find out who will be the next American President. It’s been a campaign unlike any other and even in the final hours before the votes get counted, it’s not entirely clear who will win.

Polls released over the weekend suggest that Hillary Clinton continues to hold a small, 2 to 3-point advantage in national polling. And all of the election prediction sites continue to say that she is the favourite with probabilities that she will win ranging from 65% from Nate Silver’s fivethirtyeight.com to 84% from the New York Times Upshot to 87% from Dailykos to 98% from Huffington Post Pollster.

slide1

But there are reasons to be cautious about these projections.

The polls have been much more volatile than in past elections. Even within some key states, recent polls have told very different stories about the state of the race. In Colorado, for example, one poll found the race tied while another found Clinton with a 5-point lead. There is a chance that polls are systematically missing something.

Recent experiences in the UK and in some states during the primaries confirm that we should be cautious about interpreting poll results and using them to predict election outcomes. Polls are not perfect instruments – they are estimates whose accuracy is determined by far more than the methodology or quality of the survey. For example, estimating who will show up to vote on Election Day is the hardest task for polling to get right. Are there “shy Trump voters”? What will news coverage focus on in the final 24 hours and how will that affect turnout? Is Clinton’s voter turnout operation as good as everyone thinks? How has advance voting impacted the race in different states? Polls can’t easily answer these types of questions but they will have major impacts on an election that has become much closer in the past two weeks.

What is clear, however, is that Donald Trump has far fewer paths to the 270 electoral votes needed to win the election than Hillary Clinton. Even if Trump wins Florida, Ohio, North Carolina, Arizona, Iowa, New Hampshire, Georgia, and Utah (it’s a toss up in many of these states right now), he still needs to win at least one more state where polling suggests Clinton’s lead is larger. The likely targets are Nevada, Colorado, Pennsylvania, or Michigan.

If you tune in Tuesday evening to watch this circus finally come to an end, here’s a guide to what to look for:

Florida – most polls close at 7:00pm ET: As almost 50% of the state will have voted in advance polls, we should get an early sense of where things stand. If Trump isn’t close in these early returns, that could signal a bad night for him. He must win Florida if he has any chance at winning the election.

North Carolina & Ohio – polls close at 7:30pm ET: If Trump wins Florida, he also needs to win both North Carolina and Ohio. If he has taken the lead in Florida and builds up a lead in both states, he’s on the road to 270.

Michigan, New Hampshire, and Pennsylvania – polls close at 8pm ET: These are Clinton’s firewall states. If Trump wins in two or more of these states, he will very likely be President.

Colorado & Arizona – polls close at 9pm ET: If Trump wins FL, OH, NC, and NH then these two states become critical for both campaigns. If Trump wins Colorado and Arizona, he would only need 4 more electoral votes to win (Iowa and Nevada has six a piece). If Clinton wins both, Clinton is President.

Iowa & Nevada – polls close at 10pm ET: If Trump has won FL, OH, NC, NH, CO, and AZ, he must win one of these two states to pull off the win. Iowa is his best bet given the polls released this weekend.

slide2

This path to 270 assumes that the results are clear in every state and recounts are not required. Given how close this race is, we may not know who has won the election by the end of the day.

Oh, and don’t forget the race for control of the Senate is also close and will have major consequences on policy direction over the coming years.

Steve Kent is the early favourite to be the next NL PC Leader, but John Ottenheimer could be a threat

Our final release from the survey of 600 eligible voters we conducted for VOCM News focuses on the race to replace Paul Davis as leader of the Progressive Conservative Party of Newfoundland and Labrador.

We tested the reputation of four potential leadership candidates among our survey respondents and put them in a trial ballot. The candidates we included in our survey were former deputy premier Steve Kent, former minister John Ottenheimer, lawyer Ches Crosbie, and former minister Dave Brazil.

Here are highlights of the findings:

• Steve Kent and John Ottenheimer, who both ran in the previous PC Leadership election, have the most defined images of the four candidates we tested.

• Steve Kent is viewed positively by one in four NL residents but has the highest negatives with 25% of NL residents saying they have a negative impression of him. 51% have a neutral impression of him. Among current PC Party supporters, 41% view Mr. Kent positively, 14% negatively, while 45% are neutral towards the former deputy premier.

• As the runner-up to Paul Davis in the previous PC Leadership race, John Ottenheimer would start another run at the top job with good personal numbers. Across the province, 28% have a positive impression of him compared with 12% who have a negative impression. Among PC supporters, 41% have a positive impression versus 8% who have a negative impression.

• Ches Crosbie is less known than the other two candidates but also has a net positive impression. Province-wide, 21% have a positive impression of Mr. Crosbie while 18% have a negative impression. Among PC supporters, 30% have a positive impression while 13% view him negatively.

• Former Service ML minister Dave Brazil is the least known of the four potential candidates. Three-quarters of NL residents have a neutral impression of Mr. Brazil while 10% have a positive impression and 15% view him negatively. Among PC supporters, 15% a positive impression while the same proportion view him negatively.

• When we ask respondents for their preference for PC leader among the four potential candidates, 22% would pick Steve Kent followed by 19% for John Ottenheimer, and 14% for Ches Crosbie. 3% would pick Dave Brazil and 42% are undecided.

• Among PC supporters, Steve Kent is the first choice of 35%, followed by John Ottenheimer at 24%, and Ches Crosbie at 14%. One in four PC supporters said they are undecided at this point.

THE UPSHOT

The race to replace Paul Davis as PC Leader has not started yet but our first read on the potential race finds that former leadership candidates Steve Kent and John Ottenheimer are best placed with the general public and PC Party supporters at the moment.

Mr. Kent would win a hypothetical ballot against John Ottenheimer, Ches Crosbie and Dave Brazil today among PC supporters. He is generally well liked after serving as the province’s deputy premier during the Davis years.

But Mr. Ottenheimer would also bring many strengths of his own to the race if he decides to run again. He is well liked by a large portion of the PC support base and came a close second to Paul Davis in the 2014 PC leadership election.

For Mr. Crosbie, polling suggests he could be a dark horse in the race. Less defined with a substantial portion of PC supporters having positive things to say about him, Mr. Crosbie could position himself as the non-politician in the race as the PCs look to move past the Williams-Dunderdale-Davis years.

Finally, for Mr. Brazil, if he does decide to run he will need to spend much of the early days of the campaign introducing himself to PC members and the public as his public image is limited and undefined at this point – both a weakness and an opportunity.

METHODOLOGY

The hybrid online/telephone survey was conducted with 604 eligible voters living in Newfoundland and Labrador. 300 interviews were conducted with a random sample of residents by telephone. 304 interviews were conducted online with panelists recruited from Leger’s research panel. The survey was completed from October 20 to 27, 2016.

The margin of error for a probability-based random sample of 600 respondents using a probability sample is +/- 4.1%, 19 times out of 20.

In this report we highlight the views of current PC Party supporters. A total of 115 PC Party supporters were interviewed as part of this survey. The margin of error for his subsample is + 9.3%, 19 times out of 20.

The data was statistically weighted according to census data to ensure that the sample matched the population of Newfoundland and Labrador. The tables within this report detail the weighted and unweighted counts for the sample. Note the small sample sizes when reviewing results in subgroups.

ABACUS DATA INC.

We offer global research capacity with a strong focus on customer service, attention to detail and value-added insight. Our team combines the experience of our Chairman Bruce Anderson, one of Canada’s leading research executives for two decades, with the energy, creativity and research expertise of CEO David Coletto, PhD.

The economy remains the top issue in Newfoundland and Labrador

Concern about the budget deficit and Muskrat Falls up from last year.

PdfExport

Yesterday we released new polling data that showed the provincial government’s approval rating at 22% and a close three-way horse race for party support. Today, we release additional findings from the survey of 600 eligible voters in Newfoundland and Labrador on top issues and economic perceptions.

TOP ISSUES

• The economy and jobs remains the top issue to more NL residents. Unprompted, one in three said the economy or jobs (35%) was the top issue facing Newfoundland and Labrador, largely unchanged from last November. The budget deficit or government debt (15%), the Muskrat Falls hydroelectric project (14%), and health care (8%) rounded out the top four.

• Mentions of the budget deficit and Muskrat Falls are both up 12 points since last November, the last time we conducted a province-wide survey.

• Men and women were almost equally as likely to mention jobs and the economy as the top issue. However, men were more likely to mention the budget deficit (19%) while women were more likely to mention health care (11%) as the top issue.

• Among those who voted Liberal in 2015, 43% mentioned jobs and the economy as the top issue, 18% mentioned the budget deficit, while 12% mentioned Muskrat Falls.

• Muskrat Falls was a particularly important issue for past NDP voters. 36% ranked it as the top issue followed by jobs and the economy (20%) and taxes (11%).

• For PC voters, jobs and the economy topped the list (37%), followed by Muskrat Falls (13%), and the budget deficit (11%).

slide16

ECONOMIC PERCEPTIONS

• 78% of NL residents believe the economy in Newfoundland and Labrador is in poor or very poor condition while only 20% describing it positively (3% very good, 17% good). In comparison, in a recent national survey we conducted, 50% of Canadians described the economy as being good or very good while 50% described it as poor or very poor. So the mood in NL about the economy is decidedly worse than Canadians in other provinces.

• Perceptions about the current NL economy are consistent across the province (low of 17% good/very good in St. John’s/Avalon to 23% in east/central NL).

• Perceptions are also similar across party vote in the last provincial election. 77% of Liberal voters describe the economy as poor or very poor, like the 82% of PC voters and 83% of NDP voters who feel negatively about the economy.

• Not only do most feel the economy is in rough shape today, few (20%) believe the economy will get much better over the next 12 months. More think things will stay about the same as now while 35% think the economy will get worse over the next year.

slide17

THE UPSHOT

One year into his term, Premier Dwight Ball is facing some strong headwinds as he manages a weak economy and its impact on the province’s finances. Jobs and the economy remain the top issues for most residents but concerns about the budget deficit and the Muskrat Falls hydroelectric project have grown considerably since last year. Most think the economy is in a difficult position and few think things will improve over the next year suggesting that the mood is unlikely to improve unless people start to feel improvements in their own financial position or in the economic conditions where they live.

Most governments would have a difficult time governing when perceptions about the economy and direction of the province are as negative as we currently see them in Newfoundland and Labrador. But the Liberals and Premier Ball have the added hurdle of trying to lead when many in the province dislike the Premier personally and disapprove of his work thus far. The next election is still over three years away so there is time to mend the government’s reputation. Doing so will require a mix of honesty, openness, and patience on the part of both the public and Premier Ball.

METHODOLOGY

The hybrid online/telephone survey was conducted with 604 eligible voters living in Newfoundland and Labrador. 300 interviews were conducted with a random sample of residents by telephone. 304 interviews were conducted online with panelists recruited from Leger’s research panel. The survey was completed from October 20 to 27, 2016.

The margin of error for a probability-based random sample of 600 respondents using a probability sample is +/- 4.1%, 19 times out of 20.

The data was statistically weighted according to census data to ensure that the sample matched population of Newfoundland and Labrador. The tables within this report detail the weighted and unweighted counts for the sample. Note the small sample sizes when reviewing results in subgroups.

ABACUS DATA INC.

We offer global research capacity with a strong focus on customer service, attention to detail and value-added insight. Our team combines the experience of our Chairman Bruce Anderson, one of Canada’s leading research executives for two decades, with the energy, creativity and research expertise of CEO David Coletto, PhD.