WHAT DO WE LOOK FOR IN A POLITICAL LEADER?
September 3, 2016
As the Conservative and New Democratic parties are going to choose new leaders, we asked Canadians about the qualities they would want to see in a political leader. This more detailed work will be released in the next few days.
But first, we wanted to highlight the results of two questions, dealing with the age and gender of a political leader. Here’s what we asked:
1. If the choice of a new leader for a political party came down to a man or a woman, and both were equally qualified, would you pick the man or the woman?
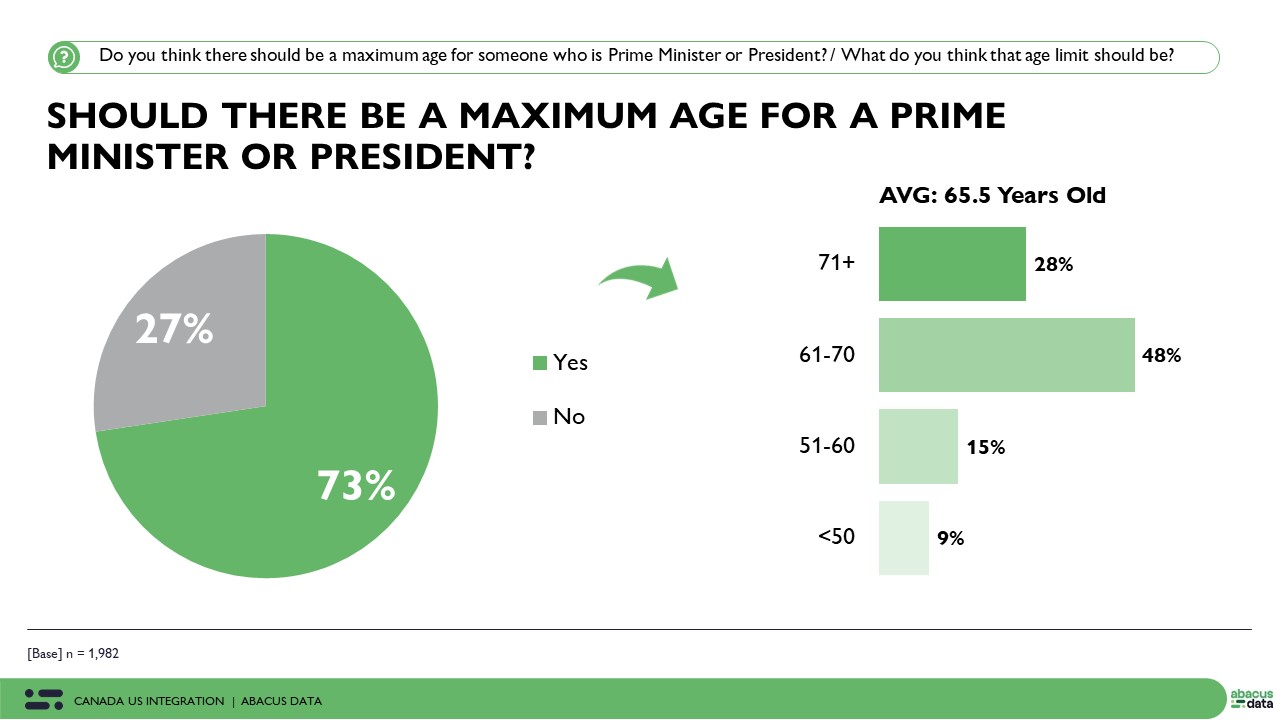
2. If the choice of a new leader for a political party came down to a person under 50 or a person over 50, would you pick the younger or older person?
Here’s what we found:
• In the gender-based contest, the woman would win (54%).
• While 31% of women would vote for the man even more (38%) of men would vote for the woman.
• Younger men and younger women tilted things about 4-5 points in favour of the female candidate, indicating that generational change is helping propel this shift in thinking.
• Conservative voters would choose the man (63%). Notably, 52% of female Conservative voters would vote for the man, 21 points higher than average. In contrast, 77% of female NDP voters and 69% of female Liberal voters would pick the woman.
• In the age-based contest, the younger candidate would win handily. By a 30-point margin (65%-35%), Canadians would prefer someone under 50.
• It is perhaps expected that younger people preferred the younger candidate, but even 50% of those 60 and older did as well.
• There was no significant gender difference on this match up.
• Again, political affiliation was a key driver in behaviour. Conservative voters were more likely to prefer the older candidate than Liberal or NDP voters. Fully half (50%) of Conservatives under 45 would pick the older candidate compared to 22% of NDP voters under 45 and 16% of Liberal voters under 45.
When we combine preferences for the age and gender of potential party leaders, we find that more Canadians prefer a young female candidate to any other combination. 37% would prefer a young female candidate, all else being equal, while 27% would prefer a combination of young and male. 20% would prefer an older male while 17% would prefer an older woman.
Conservative voters are most likely to prefer an older male candidate (43%) and least likely to prefer a younger female candidate (13%). NDP voters are most likely to prefer a younger female candidate (44%) and least likely to prefer an older male (14%).
THE UPSHOT
Bruce Anderson: “Rather than prove that stereotyping by gender or age no longer exists, these results tend to say that people still harbour some biases, but the nature of the biases has been shifting – in directions that favour younger and female candidates. It’s apparent that, as with many of the shifting social attitudes that we see today, younger generations have been leading the shift, but perhaps it’s even more remarkable that older people seem unsure that older leaders would be better.
On the gender question, the numbers suggest women have been convincing more men that they have good leadership qualities, than men have been convincing women.
The breakdowns by partisanship reveal again that Liberal and NDP voters have much in common and that both see the world and politics somewhat differently from Conservative voters.
David Coletto: “This admittedly simple study provides further evidence that Canadian voters might prefer, all else being equal, female political leaders. Remember our survey experiment in January 2015? We asked respondents to pick between images of Jane and Perry and found Jane would win hands down, even after we changed her policy positions. This more recent data confirms what we found then – all else being equal, most Canadians, except perhaps Conservative voters, would prefer the female candidate over the male one.
Add in age and we find that younger candidates are more appealing to voters generally, and especially among younger voters and those who support the NDP and Liberals. Again, Conservative voters are the exception, with a majority preferring the older candidate, including younger Conservative voters.
Does this mean female party leaders will do always better, all else being equal? Maybe. Recent provincial election results in BC, Ontario, and Alberta suggest that might be the case. Obviously there is more to a candidate than their age or sex but as we learned from our Jane vs. Perry test, a candidate’s gender might be a cue for other attributes that we want in our leaders.”
METHODOLOGY
Our survey was conducted online with 2,010 Canadians aged 18 and over from August 22 to 25, 2016. A random sample of panelists was invited to complete the survey from a large representative panel of over 500,000 Canadians.
The Marketing Research and Intelligence Association policy limits statements about margins of sampling error for most online surveys. The margin of error for a comparable probability-based random sample of 2,010 is +/- 2.2%, 19 times out of 20.
The data were weighted according to census data to ensure that the sample matched Canada’s population according to age, gender, educational attainment, and region. Totals may not add up to 100 due to rounding.
Abacus Data Inc.
We offer global research capacity with a strong focus on customer service, attention to detail and value-added insight. Our team combines the experience of our Chairman Bruce Anderson, one of Canada’s leading research executives for two decades, with the energy, creativity and research expertise of CEO David Coletto, Ph.D.