Niqabs, Hijabs, Anxiety and Accommodation

UPDATED at 12:15pm ET
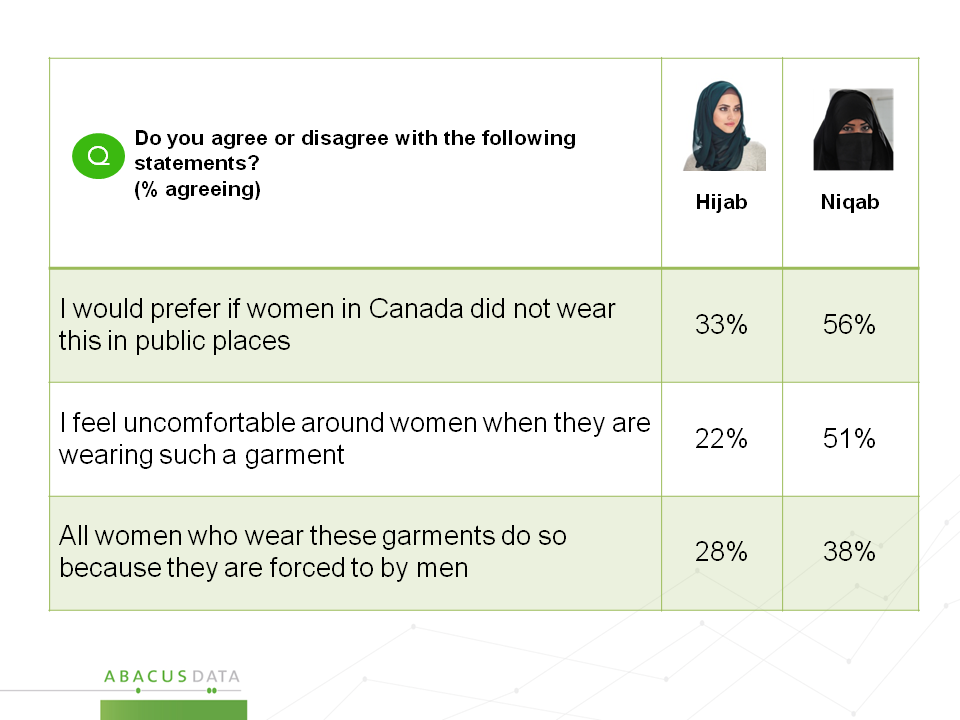
Our latest nationwide study of public opinion included questions about the rights of Muslim women to wear the hijab or the niqab. To assist respondents in considering this topic, we showed them pictures of both garments, and asked separate questions about each.
Highlights
• 51% “feel uncomfortable around women wearing” a niqab — 22% in the case of a hijab.
• Over half (56%) “prefer if women in Canada did not wear the niqab in public places”; 33% feel that way about the hijab.
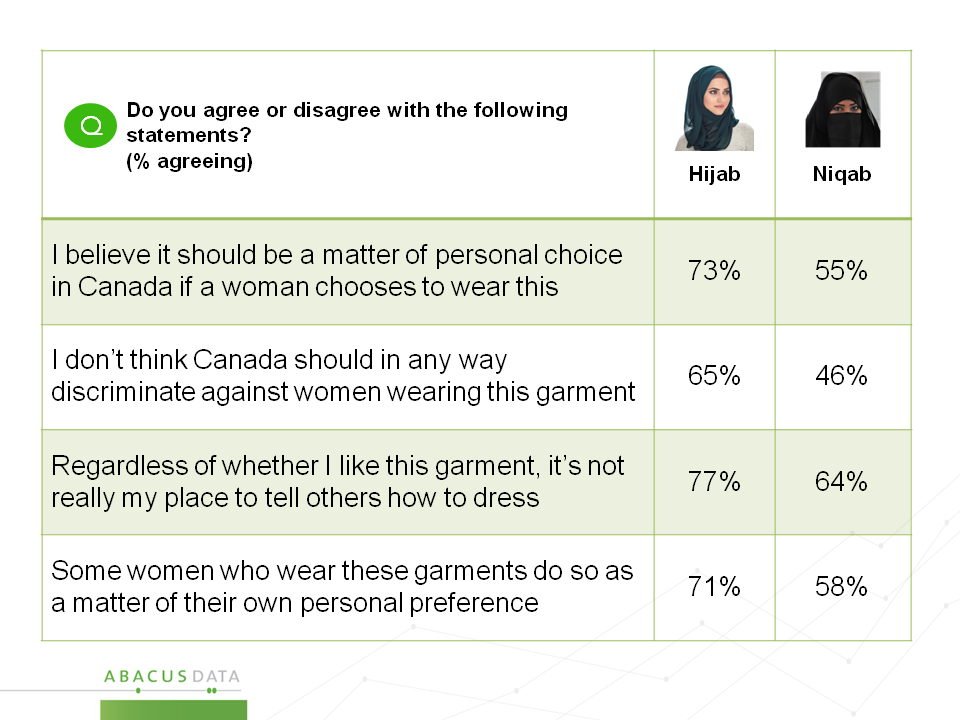
• Still, in answer to another question, more than half (55%) found themselves agreeing that “it should be a matter of personal choice in Canada if a woman wishes to wear” a niqab; 73% say that about a hijab. The only subgroup where the majority feels otherwise about the Niqab is among Bloc Quebecois voters.
• Even more – 64% – agreed, “regardless of whether I like the niqab, it’s not really my place to say what others should or shouldn’t wear”. 77% said the same about the hijab.
• 38% believe “all women who wear a niqab do so because they are forced to by men”, and 28% feel that way about the hijab. The majority feel that some women who wear a hijab (71%) or niqab (58%) “do so as a matter of their own personal choice”.
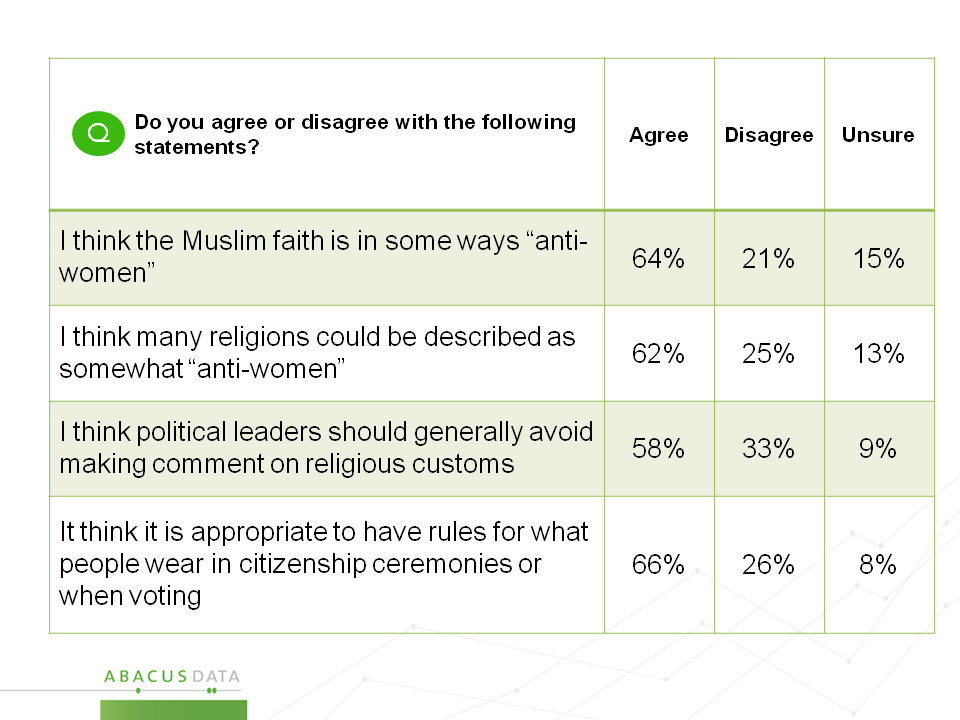
• 62% agree that they “the Muslim faith is in some ways ‘anti-women“. However the same proportion (61%) agreed “I think many religions could be described as somewhat ‘anti women“
• 60% feel “political leaders should generally avoid making comment on religious customs” but 64% agree that “it’s appropriate to have rules for what people wear in citizenship ceremonies”.
Citizenship Ceremony
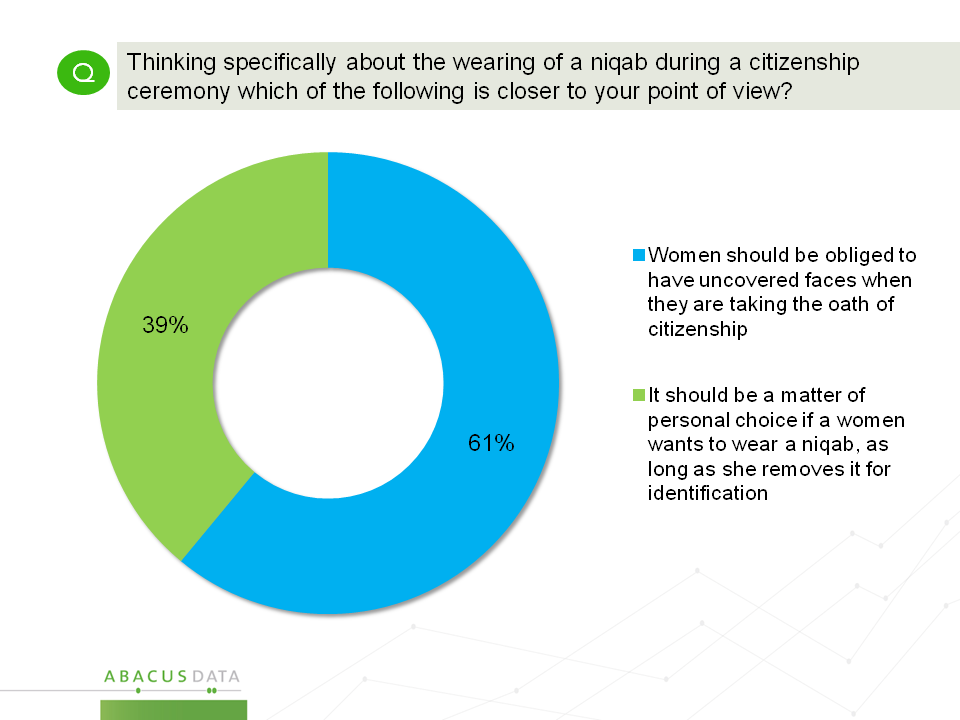
The recent debate about whether women should be obliged to bare their faces during the citizenship ceremony was also part of our probing. We offered two propositions:
“Women should be obliged to have uncovered faces when they are taking the oath of citizenship”
“It should be a matter of personal choice if a woman wants to wear a Niqab as long as she removes it for identification purposes before the ceremony”
Given these alternatives, 61% believe that faces should be uncovered, and 39% see this as a matter of personal choice. Fully 80% in Quebec, 81% of BQ voters, and 87% of Conservative voters do not believe this should be a personal choice.

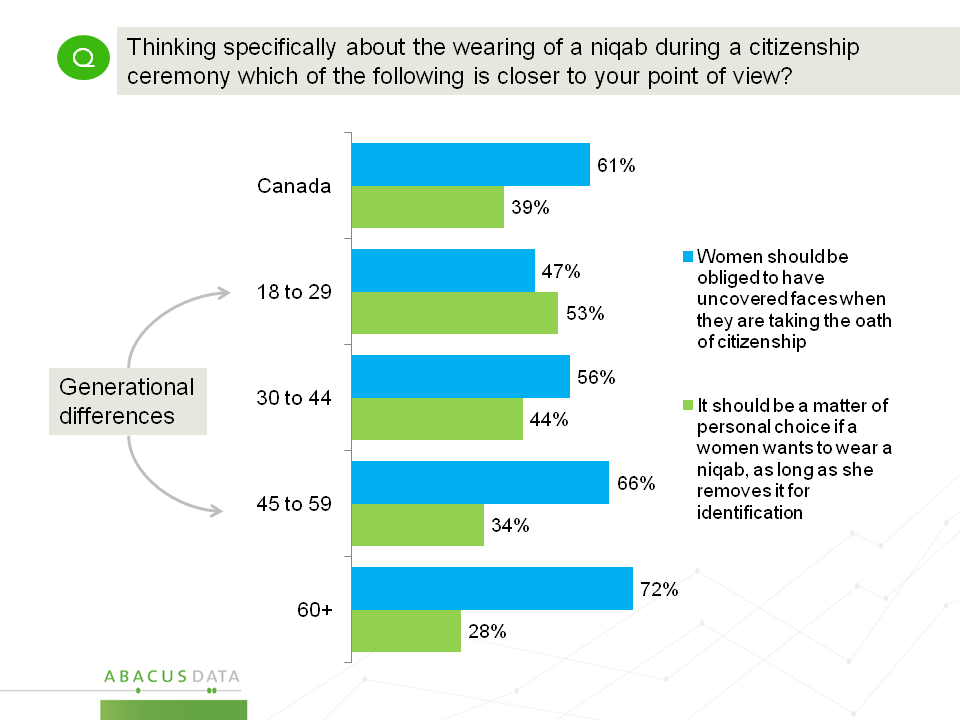
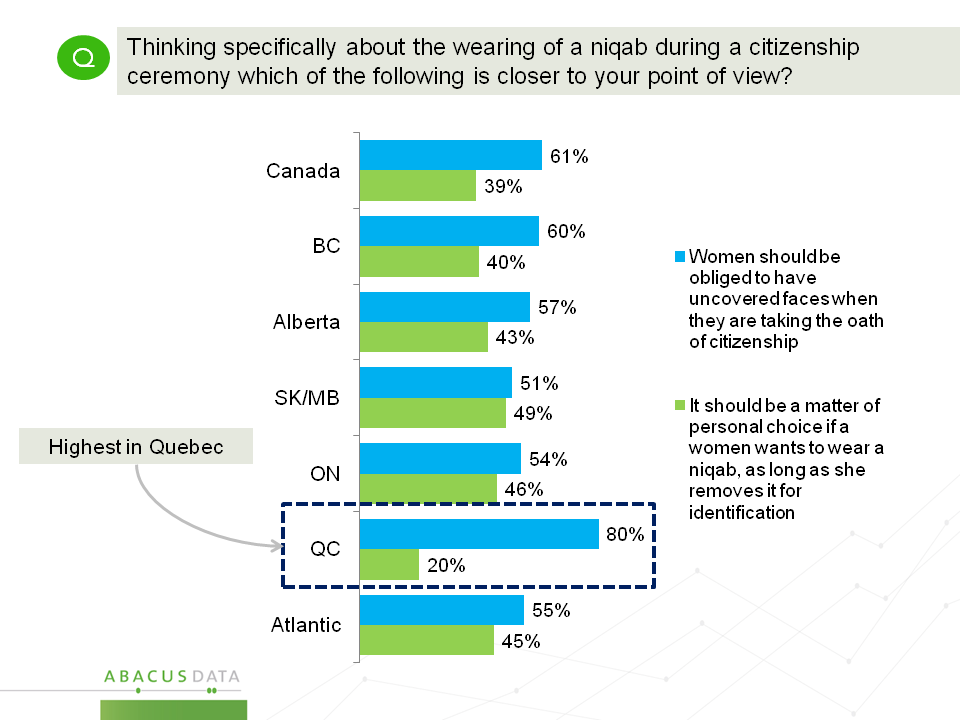
There is also a clear generational divide, with the majority of those under 30 believing it should be a matter of choice and the majority of those over that age feeling it should not.
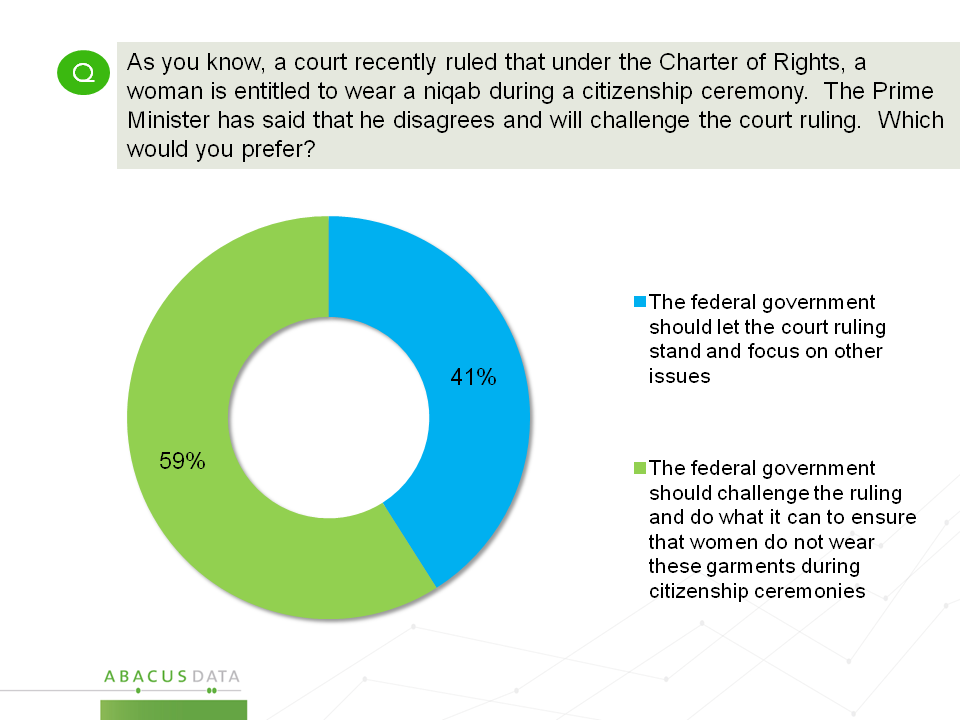
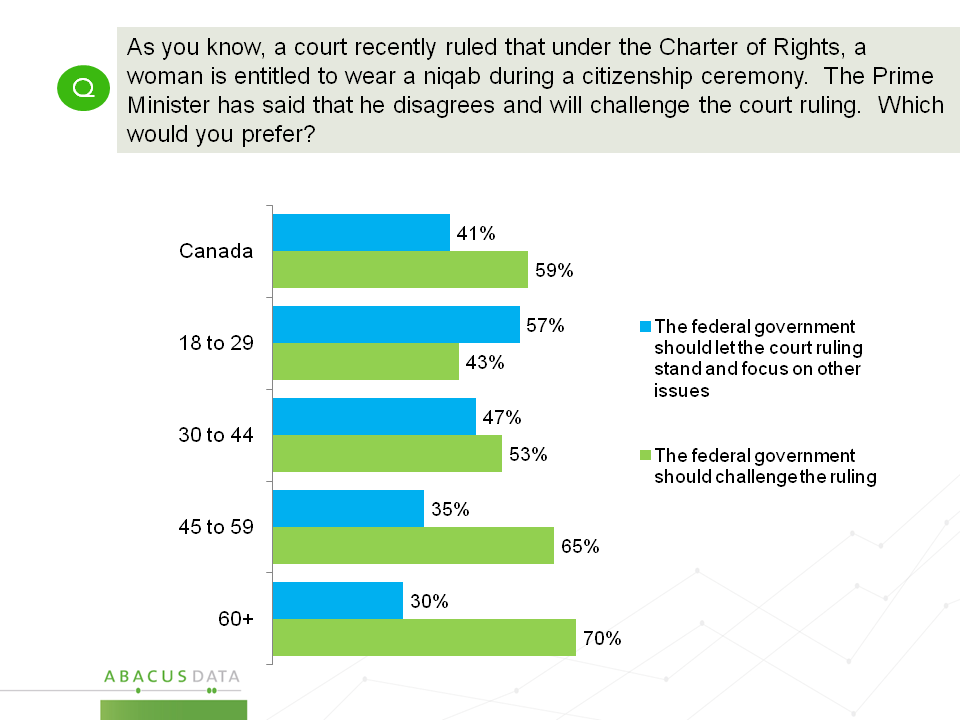
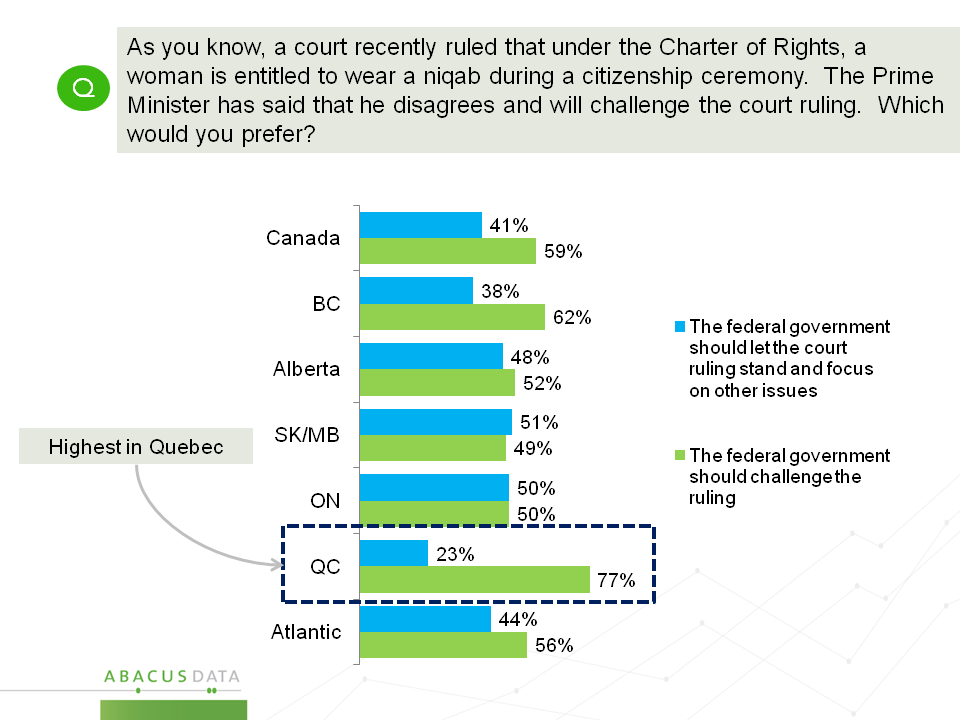
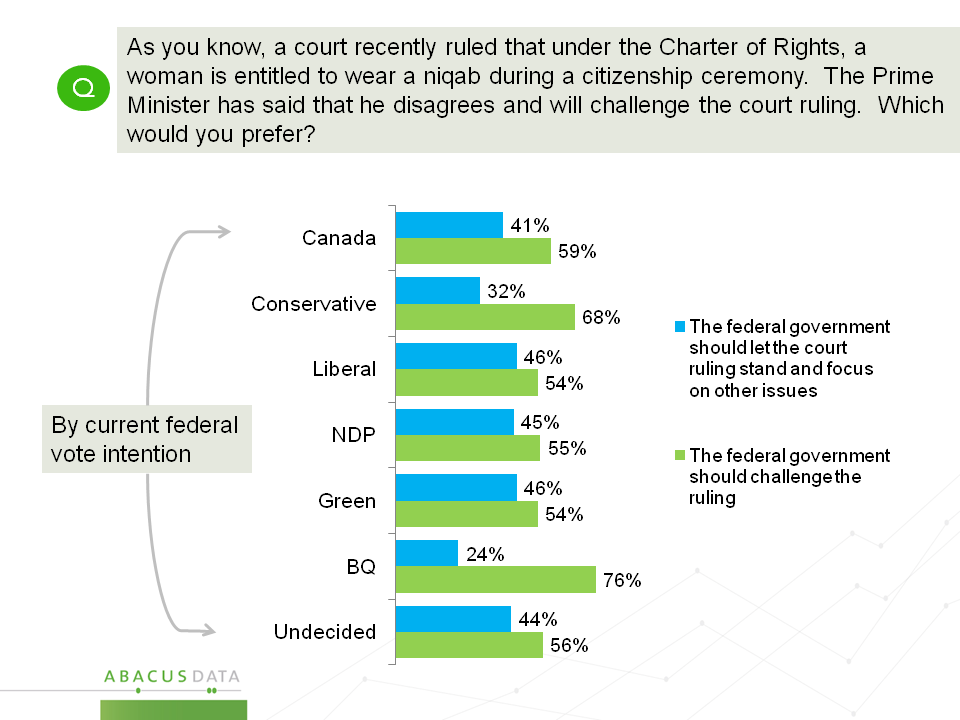
59% say the federal government is right to “challenge the recent court ruling and do what it can to ensure that women do not wear these garments during citizenship ceremonies” while 41% say Ottawa should let the ruling stand and focus on other issues”. Again, a striking generational divide is evident. Liberal voters are evenly split, as is opinion in Ontario, while Quebecers are more supportive about the challenge.
Note: “After the fact, we realized that our question contained an inaccurate reference to the Court’s ruling: our wording mentioned the Charter of Rights, rather than the Citizenship Act. We would note that a question earlier in the same poll, which did not mention the Charter, found a similar, slightly larger majority agreeing with the proposition that it is appropriate to have rules for what people wear in citizenship ceremonies or when voting. The conclusion to be drawn is that a majority side with the PM when it comes to faces being covered during a citizenship ceremony.”
When asked whether the motive of the PM has more to do with seeking votes or a true belief on the issue, opinion is split, with 53% saying the PM “truly believes this is an important issue and a bad ruling by the court” and 47% saying “he thinks it will be popular with those who may be inclined to vote for his party”.
The Upshot
According to Bruce Anderson:
The results show that this issue is complex and reveal that many Canadians feel somewhat conflicted: on the one hand feeling discomfort with the Niqab but at the same time reluctant to have their views imposed on other people.
The Niqab is clearly seen in a different light than the Hijab, results are often 20 points or more different based on the type of garment being probed.
These issues tend to divide groups of Canadians. Rural, older, Conservative, Quebec and in particular BQ voters are more anxious about the niqab whereas younger, urban Canadians are more persuaded that these are personal choices.
Most resist the generalization that these garments reflect an anti-women culture, and believe that other religions have customs that could be characterized this way as well.
The government finds majority support for its position on wearing of the Niqab during citizenship ceremonies, and for challenging the court ruling. Clearly though, other responses indicate that the public has mixed feelings about how far politicians should go in constraining personal choice.
Methodology
Our survey was conducted online with 1,000 Canadians aged 18 and over from March 20 to 22, 2015. A random sample of panelists was invited to complete the survey from a large representative panel of Canadians, recruited and managed by Research Now, one of the world’s leading provider of online research samples.
The Marketing Research and Intelligence Association policy limits statements about margins of sampling error for most online surveys. The margin of error for a comparable probability-based random sample of the same size is +/- 3.1%, 19 times out of 20. The data were weighted according to census data to ensure that the sample matched Canada’s population according to age, gender, educational attainment, and region. Totals may not add up to 100 due to rounding.
We offer global research capacity with a strong focus on customer service, attention to detail and value added insight. Our team combines the experience of our Chairman Bruce Anderson, one of Canada’s leading research executives for two decades, with the energy, creativity and research expertise of CEO David Coletto, PhD.
In case you missed it, here are some of our recent releases:
Canada’s mission against ISIL: What comes next?
Conservatives and Liberals locked in dead heat. Eve Adams defection reactions mixed.
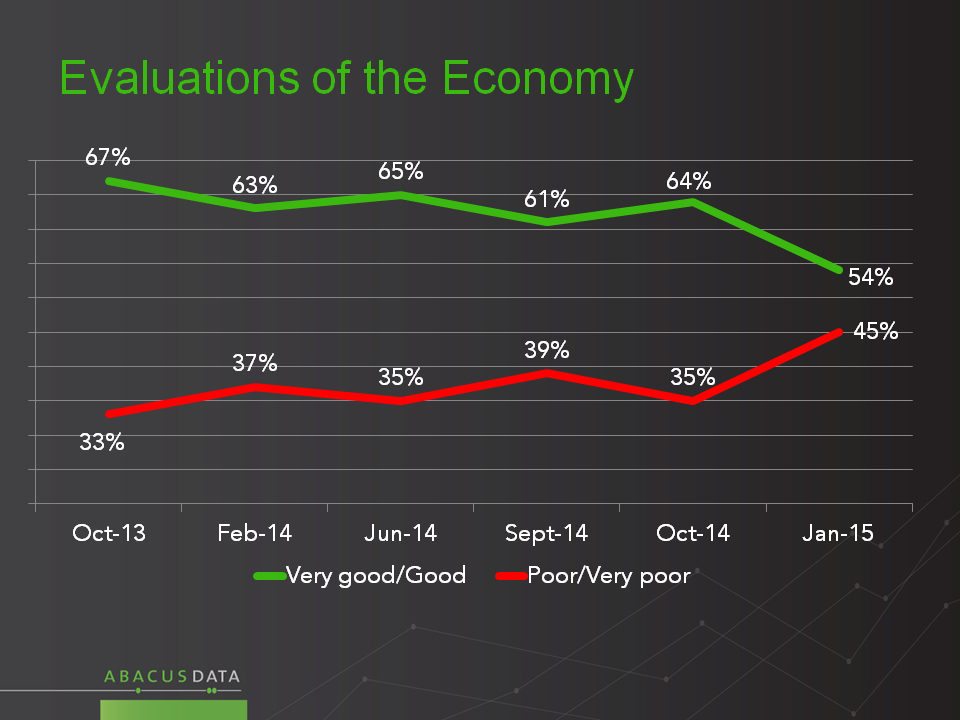
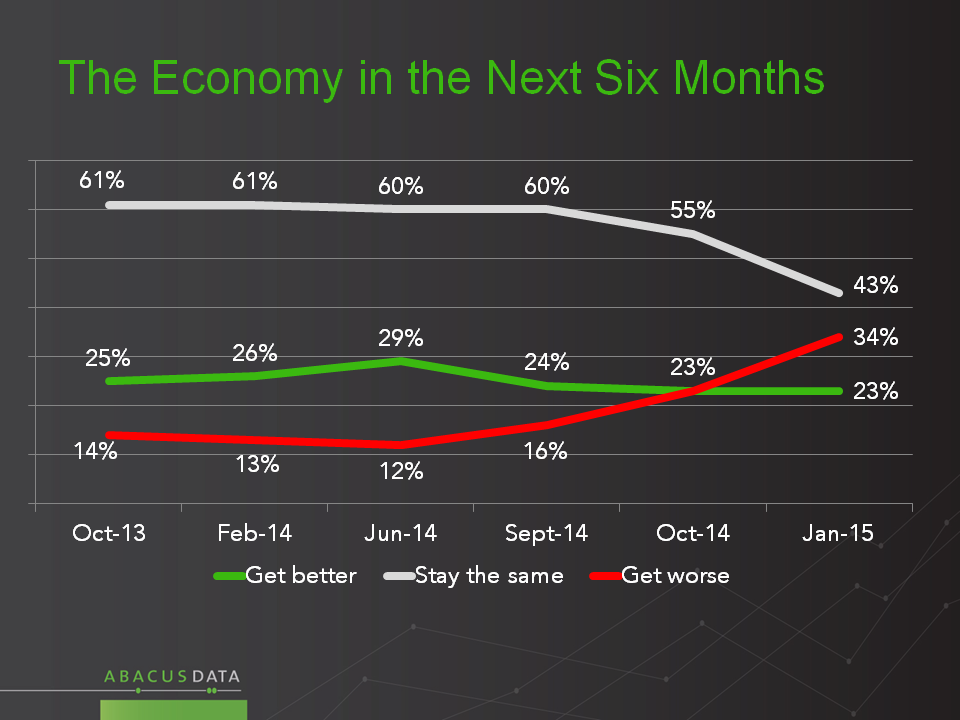
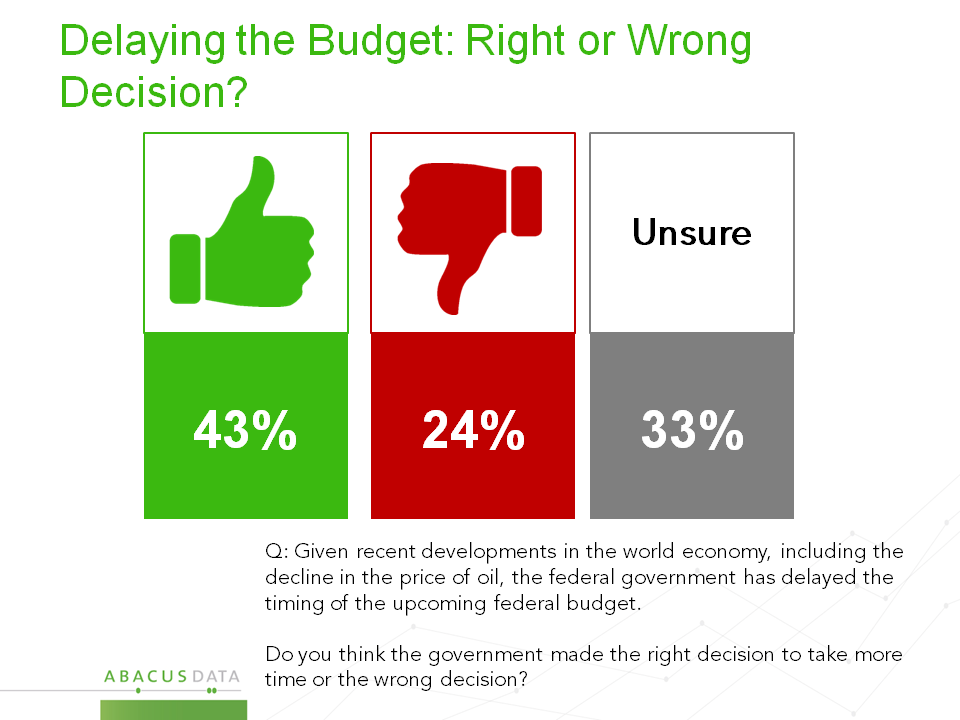
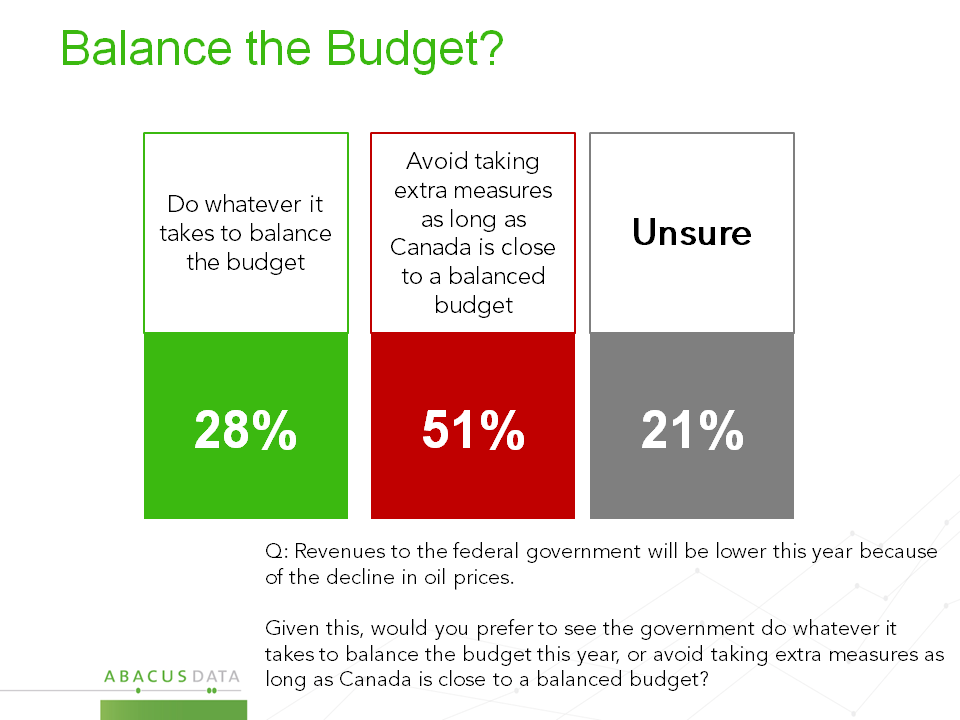
Economic anxiety on the rise; Canadians want pragmatic policy making
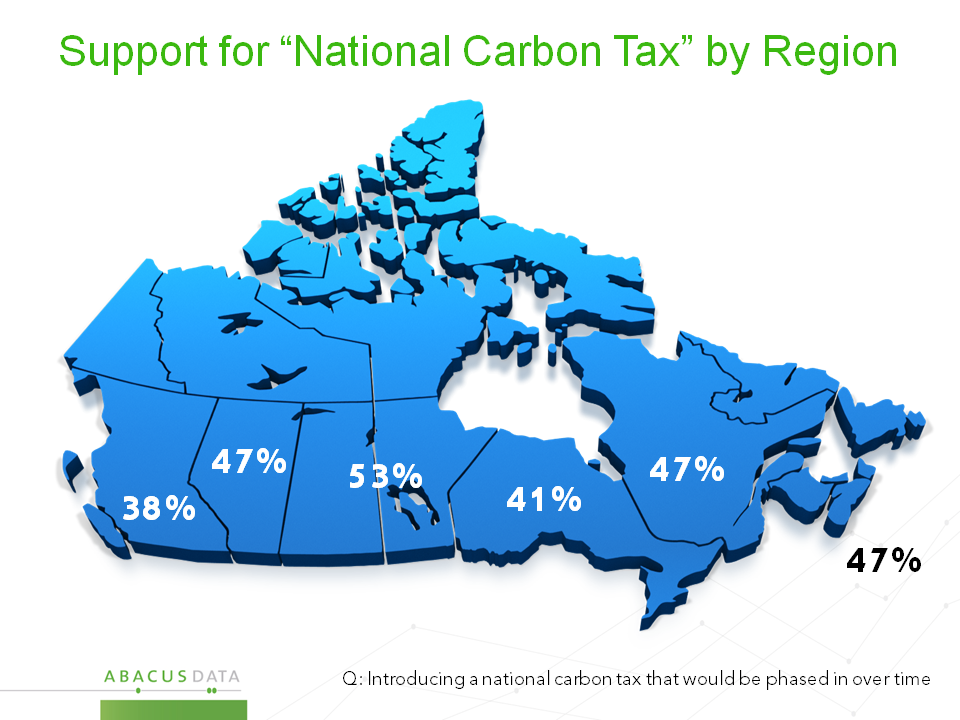
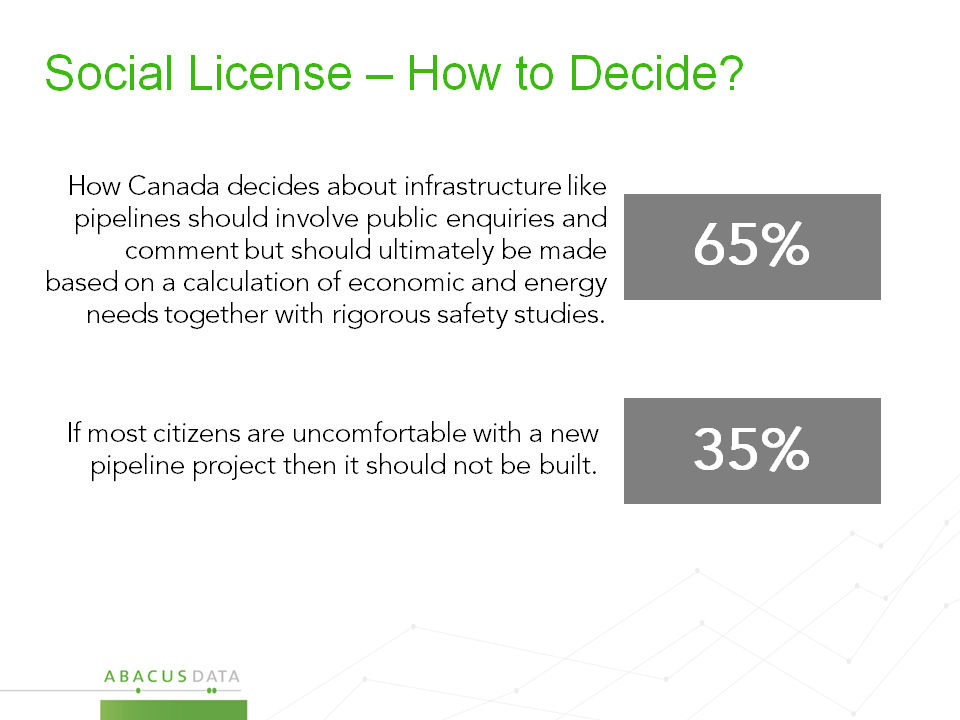
Should carbon be priced? Should public opinion decide pipelines?