Looks, Gender, and Ideas: Do these matter?
January 6, 2015

In our polling just before the end of 2014, we conducted a small experimental study. We wanted to test how people react to the physical image of a prospective political candidate and also explore whether and how gender stereotyping affects political choice.
There are clear limitations to this work, which should be acknowledged readily. First, how voters vote has a lot to do with leaders, campaigns, issues, not only local candidates. Also, local candidates are known to some local voters; our hypothetical candidates were not. Third, how people choose to answer a question in a survey is not a perfect surrogate for what they would do in an actual voting situation. We see this data as simply identifying some interesting tendencies, describing some of the background thoughts that might affect how voters make the choices they do. We welcome discussion.
Jane and Perry

We prevailed upon two people we know who share an interest in politics to allow their pictures to be used in this research experiment. Jane and Perry are of a similar age. The pictures used for the bulk of the study are below.
Willing to Consider Jane and Perry?
We began by asking whether voters would consider voting for each of them if they were running in their constituency in the next federal election. The vast majority would consider either of the two (91% for Jane and 88% for Perry).
There were few regional variations but both found more hesitant voters in Quebec, where 21% were reluctant to consider Jane and 24% were reluctant to consider Perry. Large majorities of Conservatives, Liberals and New Democrats would consider either candidate.
Among those 60 or older, 89% would consider Perry, and 91% would consider Jane, indicating no generational bias. However results did vary somewhat by gender: while women were equally likely to consider each (88% and 90%), men were more likely to consider Jane (96%) than Perry (88%)
Initial Preference between Jane and Perry?
We then asked, which one people would vote for, between Jane and Perry, if they were the only two candidates running locally. (At this point, all respondents had to base their choice on was the pictures.)
Notionally, if appearance and gender mattered not at all, the result would have been a 50/50 split. Instead, Jane would win 67% of the votes and Perry 33%.
• Across the country, Jane’s support was never below 62% support, but her high water marks were 69% in Atlantic Canada and 75% in Quebec.
• Jane comfortably carried all age groups and did best among the youngest voters (71%) and least well among those 60+ (64%).
• Jane won both genders, but her margin among women was significantly larger than among men (men 60%-40% , women 74%-26%).
• Jane won among supporters of all three major parties, but her margin was largest among New Democrats (74%) and narrowest among Conservatives (58%).
• Along the same lines Perry found more support among those who felt the country was going in the right direction (39%) and that the government deserved re-election (43%)
What might be inferred from these numbers is:
• Both gender and physical images have the potential to significantly affect how voters size up candidates, absent any other information.
• Past tendencies to favour male over female candidates regardless of qualifications may be in the process of being replaced by a tendency to favour female candidates over males.
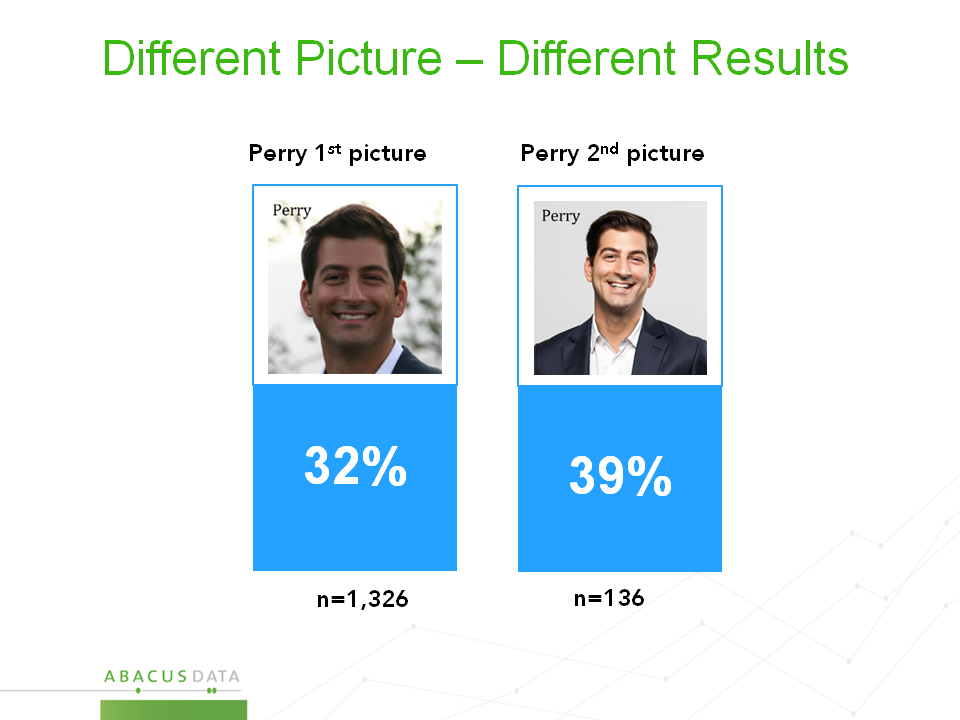
To more clearly understand the role of image versus gender, near the end of the survey, we substituted a different picture for Perry. While the sample exposed to the second picture was relatively small (N=136) his support level was 7 points higher with the second picture compared to the first. This tends to support the idea that both gender and appearance contributed to the wide margin favouring Jane, not gender alone.
Impressions of Jane and Perry
We then asked respondents to tell us a bit about what they saw in each of the two hypothetical candidates. The results again illustrate the degree to which visual impressions and gender both can influence thinking.
• On all 10 items tested, Jane came out on top.
• Jane was widely judged better for those in need (80%) and the environment (76%)
• Jane’s margin was narrow when it came to handling a crisis (54%), and the economy (52%)
• Jane was credited with better judgment (66%) and an ability to get things done (65%)
• Jane was also seen as more careful with taxpayers money (70%)
• 70% said that Jane’s values seemed closer to their own
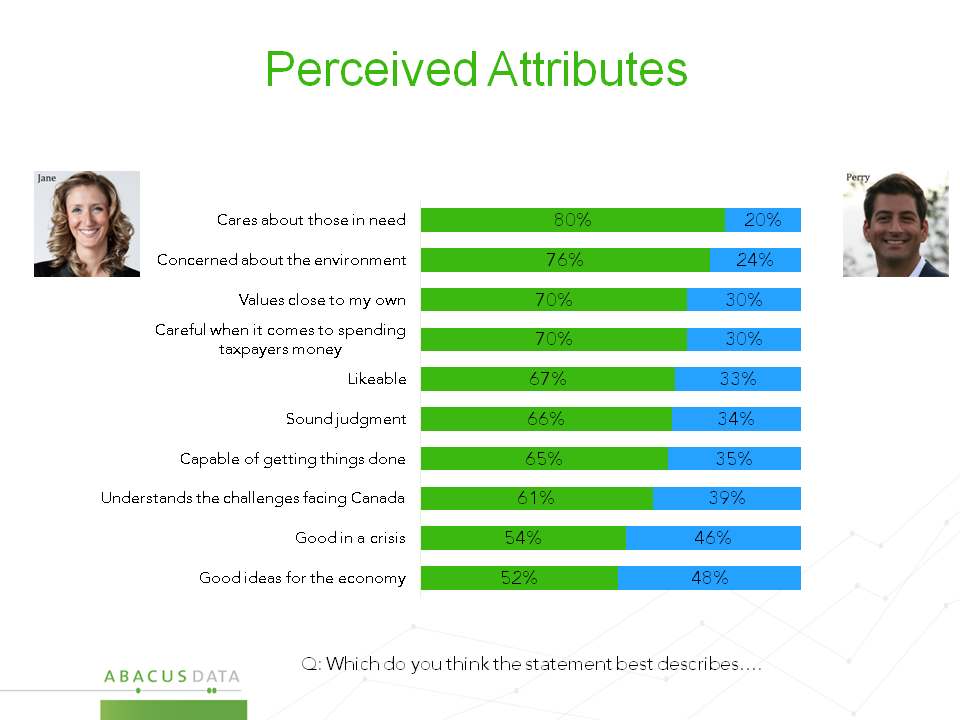
These results suggest gender stereotypes continue to flourish: including the idea that women are more compassionate and concerned about the environment. While expectations of Jane are less lofty in terms of managing a crisis and handling the economy, she is competitive with Perry on those items.
One interpretation is that women are no longer automatically considered inferior on any items. Another interpretation is that there is a yawning 28-point gap between the things that are assumed to be Jane’s greatest and lesser strengths. And still a third interpretation is that men are now automatically considered inferior in many regards, including frugality, judgment and the ability to get things done.
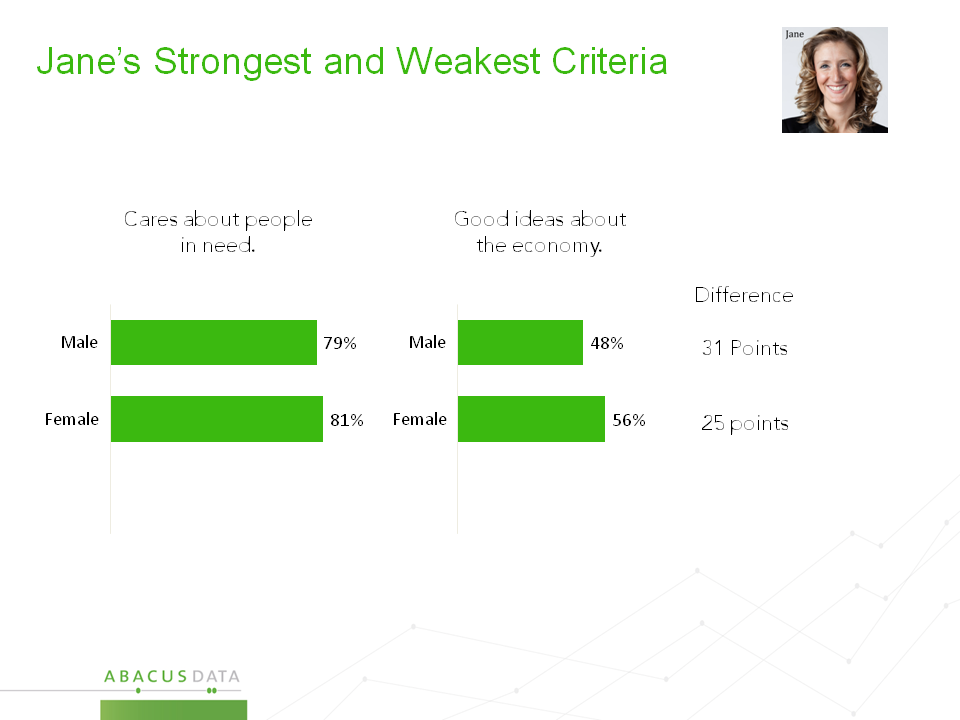
Worth noting is that both men and women are capable of adopting the same stereotyping. As noted in the chart below, while 81% of women said Jane was best at caring for people in need, only 56% of women said she was best at ideas for the economy. The effect is exaggerated among men, but sizeable among women without question.
Do Their Ideas Matter?
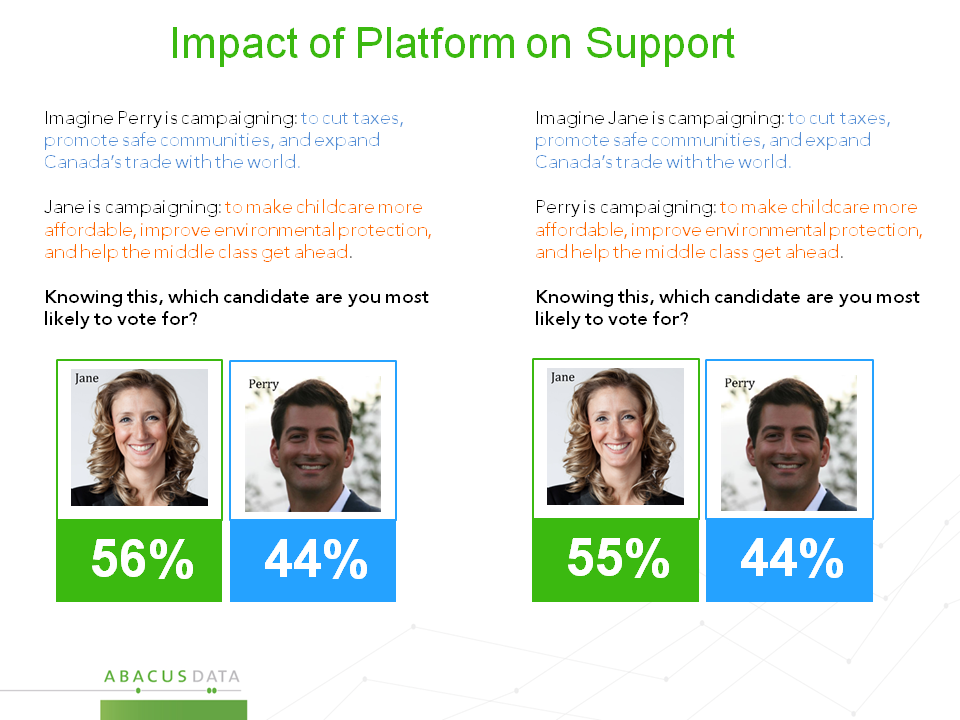
As a final test we wanted to see how things might change if we attached a platform to each of the two hypothetical candidates. So for the purposes of the experiment we created two 3-point platforms, one of which was tilted conservative (tax cuts, safe communities, expanded trade), the other progressive/liberal approach (affordable childcare, environmental protection, help for the middle class).
We randomized the assignment of each platform so that half the sample was shown Jane with the left platform the other half with the right platform, and the same was true for Perry of course. We then asked “knowing this about their platform, how would you vote?”
The results:
• Introducing competing idea sets reduced the gap between Jane and Perry by about 10 points
• Jane still won by just over 10 points regardless of which platform she “embraced”
So, on the one hand, these results point up the fact that platforms matter, in overcoming biases and preconceptions, and in winning support. And, on the other hand, the results also suggest that platform is but one factor, and not necessarily always a deciding factor at that, when it comes to how voters might size up a candidate.
Conclusions?
Over the months ahead, we will do additional experiments designed to shed light into the things that voters react to, using online research technologies to furnish deeper insight that can be gleaned through phone surveys.
Our goal is to foster a discussion, by sharing basic information, and encouraging people to form their own interpretations. From our standpoint, these results tell us that visual images play an important role in how people relate to candidates, something that may be growing more important given the ubiquity and speed with which visual images are shared today. As well, the results suggest that gender stereotyping is very much alive, but may be adopting different forms today than would have been the case in past decades.
Methodology
Our survey was conducted online with 1,438 Canadians aged 18 and over from December 18 to 20, 2014. A random sample of panelists was invited to complete the survey from a large representative panel of Canadians, recruited and managed by Research Now, one of the world’s leading provider of online research samples.
The Marketing Research and Intelligence Association policy limits statements about margins of sampling error for most online surveys. The margin of error for a comparable probability-based random sample of the same size is +/- 2.6%, 19 times out of 20. The data were weighted according to census data to ensure that the sample matched Canada’s population according to age, gender, educational attainment, and region. Totals may not add up to 100 due to rounding.
We offer global research capacity with a strong focus on customer service, attention to detail and value added insight. Our team combines the experience of our Chairman Bruce Anderson, one of Canada’s leading research executives for two decades, with the energy, creativity and research expertise of CEO David Coletto, PhD. For more information, visit our website at http://www.abacusdata.ca/
For interviews, quotes, or to find out about our services, please contact Chairman Bruce Anderson at banderson@abacusdata.ca (613-882-0929) or CEO David Coletto at david@abacusdata.ca (613-232-2806)